Embed Size (px)
Citation preview

This PDF is a selection from an out-of-print volume from the NationalBureau of Economic Research
Volume Title: Inflation, Tax Rules, and Capital Formation
Volume Author/Editor: Martin Feldstein
Volume Publisher: University of Chicago Press
Volume ISBN: 0-226-24085-1
Volume URL: http://www.nber.org/books/feld83-1
Publication Date: 1983
Chapter Title: Inflation and the Taxation of Capital Income in theCorporate Sector
Chapter Author: Martin Feldstein, Lawrence Summers
Chapter URL: http://www.nber.org/chapters/c11333
Chapter pages in book: (p. 116 - 152)
8 Inflation and theTaxation of Capital Incomein the Corporate SectorWith Lawrence Summers
This paper presents a detailed examination of the effect of inflation on thetaxation of capital used in the nonfinancial corporate sector of the U.S.economy. Our analysis shows that, with current tax laws, inflation sub-stantially increases the effective tax rate on capital income in the corpo-rate sector. The principal reason for this is that the historic cost method ofdepreciation causes a major overstatement of taxable profits, i.e., his-toric cost depreciation results in a large increase in the level of realtaxable profits at any level of real economic profits. Current methods ofinventory accounting add further to this overstatement of profits for taxpurposes.
According to our most comprehensive calculation, the effect of infla-tion with existing tax laws was to raise the 1977 tax burden on corporatesector capital income by more than $32 billion. This extra tax burdenequivalent to 69 percent of the real after-tax capital income of thenonfinancial corporate sector, including retained earnings, dividends,and real interest receipts of the corporations' creditors. Since our calcula-tions show that the total tax burden on this corporate capital income was$92 billion, the extra tax burden raised the tax by more than 54 percent.The total effective tax rate on corporate sector capital income in 1977 was66 percent; without the extra tax caused by inflation, the effective tax ratewould have been only 41 percent.
In contrast to previous studies of the relation between inflation andcorporate tax burdens, we consider not only the tax paid by the corpora-
Reprinted by permission from National Tax Journal 32 (December 1979): 445-70.This paper is part of the NBER study of capital formation. The authors are grateful for
comments on earlier drafts by participants in a meeting of the NBER research group ontaxation and several anonymous referees. James Poterba, Stephanie Seligman, and DanielSmith provided valuable assistance.
116
117 Inflation and the Taxation of Capital Income in the Corporate Sector
tions themselves but also the tax paid by the individuals and institutionsthat supply capital to the corporate sector.1 This is particularly importantfor a correct treatment of corporate debt. Inflation implies that thenominal interest payments that corporations deduct in calculating taxableprofits exceed the real cost of borrowed funds; in itself, this tends tounderstate real profits and to lower the effective tax rate.2 However, theindividuals and institutions that lend to the corporations are taxed on theoverstated nominal interest income.3 Our calculations show that theexcess tax paid by the lenders is slightly greater than the tax saving of thecorporate borrowers. Since the difference between the relevant tax ratefor borrowers and lenders is quite small, the mismeasurement of interestincome (or, equivalently, the real gains and losses on net corporate debt)can be ignored without seriously distorting the evaluation of the overalleffect of inflation on the taxation of corporate sector capital.
In addition to our analysis of the nonfinancial corporate sector as awhole, the present study makes use of an important new source of datafor individual firms on the values of both replacement cost depreciationand depreciation based on historic costs. Beginning with the year 1976,the Securities and Exchange Commission has required large corporationsto provide information on replacement cost depreciation and inventoryprofits as part of their annual form 10-K reports. We use these datatogether with other information on the financial and real performance of327 individual manufacturing firms in order to examine how inflation hasraised the effective tax rates on different industries.
In the first section of this study, we ignore the mismeasurement ofinterest expenses and income in order to focus on the additional taxationcaused by historic cost depreciation and by existing inventory accountingmethods. Section 8.2 then shows that the corporate tax savings that resultfrom overstating real interest expenses are slightly more than balanced bythe greater tax burdens that the mismeasurement of interest incomeimposes on the individuals and institutions that directly and indirectlysupply debt capital to the corporate sector. The total increase in taxliabilities on corporate source income due to inflation is then estimated insection 8.3. Section 8.4 describes inflation's impact on effective tax rates.The fifth section then uses the data on individual firms to calculate the
1. Studies that have focused on inflation's effect on corporate taxes include Davidsonand Weil (1977), Lovell (1978), Shoven and Bulow (1976) and Tideman and Tucker (1977).The importance of looking through the corporation to examine the return to suppliers ofdebt and equity capital is stressed in Feldstein (1976; chap. 3 above), Feldstein, Green, andSheshinski (1978; chap. 4 above), and Feldstein and Summers (1978; chap. 9 below).
2. Allowing the deduction of nominal interest payments that exceed real interest pay-ments is equivalent to ignoring the real gains that accrue to corporations as inflation reducesthe real value of ourstanding corporate debt. In this context, debt should of course beregarded as gross debt minus nominal assets.
3. The extent of this taxation differs substantially among the different classes of lenders.
118 Inflation and Effective Tax Rules
extent of additional taxation in each of the 20 different manufacturingindustries. There is a brief concluding section that discusses the implica-tions of these higher effective tax rates for capital formation and eco-nomic performance.4
8.1 Depreciation Rules, Inventory Accountingand Corporate Tax Payments
A desirable taxation criterion is that real tax payments should not beaffected by changes in the overall price level which do not alter realincome or wealth. Our tax system violates this standard in its treatment ofcorporate profits. When the price level rises and firms' real profits remainconstant, their real tax payments rise both because of historical costdepreciation and FIFO inventory accounting. The real cost of the depre-ciating of a firm's capital stock is the replacement cost of the obsolescentcapital. Yet for tax purposes firms are only permitted to deduct deprecia-tion based on the original purchase price. In inflationary periods, thismay be much less than the replacement cost. Similarly, the cost ofdepleting inventories is the replacement cost of the goods, not theiroriginal acquisition cost. Firms which use FIFO inventory cost deductonly the acquisition cost, giving rise to phantom inventory profits.
In this section, we discuss our estimates of how much existing deprecia-tion and inventory rules raise corporate taxes in our inflationary econ-omy. We ignore the role of debt and limit our attention to the tax burdensat the level of the corporation; this restriction is dropped in the subse-quent sections where, as we noted in the introduction, we show thatexplicit recognition of debt has little effect on the total additional taxationof all the capital used in the corporate sector because of the offsettingeffects of inflation on the taxation of borrowers and lenders. We beginthis section by examining the experience for 1977, the most recent yearfor which all the required information is available. We then discuss thetrends in inflation's effects on the taxation of corporate source incomeover the period since 1954.5
4. The analysis relates only to nonfinancial corporations even when the text refers onlyto corporations. Throughout the study we make no attempt to assess the extent to which theinitial tax burdens are shifted to other capital or to labor by changes in the allocation ofcapital or in the financial decisions of households and firms. We also ignore state and localtaxes and, to that extent, understate total tax burdens.
5. It is important to recall that firms may use LIFO inventory accounting for tax purposesonly if they also use LIFO in the "book" accounting statements that they report toshareholders and creditors. Although the extra taxes that result from FIFO accounting arein a sense voluntary, managements presumably pay these taxes because they believe thatthere would be greater costs of some other kind if they used LIFO and reported lower profitsand assets. As long as firms do pay the higher taxes based on FIFO accounts, these taxes doaffect investment and savings decisions.
119 Inflation and the Taxation of Capital Income in the Corporate Sector
8.1.1 The Experience of 1977
Before looking in detail at the data for 1977, we can summarize brieflythe impact of inflation on the taxes paid by nonfinancial corporations in1977. The cumulative effect of inflation reduced the depreciation allowedon existing plant and equipment by $39.7 billion in 1977. This raisedcorporate tax payments by $19 billion, or nearly one-third of the $59billion of corporate tax liabilities for 1977. An additional $7 billion intaxes were paid on artificial inventory profits. Thus, inflation raisedcorporate taxes from $33 billion to $59 billion, an increase of 79 percent.Stating this in a different way, the additional corporate tax caused byinflation accounts for 57 percent of the $59 billion of corporate taxliabilities in 1977.
We can now examine the specific data used to calculate these addi-tional tax burdens. The official national income account estimate of the1977 real profits of nonfinancial corporations was $113.9 billion.6 Taxableprofits for those corporations were $143.5 billion in the same year. The$30 billion difference between these two profit figures is the sum of theinventory valuation adjustment and the capital consumption adjustment.The inventory valuation adjustment (IVA) of $14.8 billion implies thatinflation added $14.8 billion of false inventory profits to taxable income.The capital consumption adjustment (CCA) of $14.7 billion7 actuallyreflects two countervailing differences between real straight-line depre-ciation and the depreciation allowed for tax purposes: the accelerateddepreciation rules made tax-deductible depreciation exceed straight-linedepreciation by $25.0 billion while inflation reduced the value of taxdeductible depreciation and raised taxable profits by $39.7 billion. Weshall refer to the two components of the CCA as the "accelerationcomponent" (CCA-A) and the "inflation component" (CCA-I). Thushistoric cost depreciation plus false inventory profits together added$54.5 billion to taxable profits. With a 48 percent statutory marginal taxrate, inflation caused a $26 billion increase in corporate tax payments.
In calculating the additional corporate tax payments we have implicitlyassumed that accelerated depreciation and the investment tax credit wereenacted to stimulate investment and not as an offset to inflation. It is clearthat these features were enacted long before adjusting taxable income for
6. Survey of Current Business, November 1978. For earlier years, we use the Survey ofCurrent Business, March 1976, pages 53-57, and updates in the Survey of Current Business.Depreciation is based on straight-line depreciation at 85 percent of the Bulletin F lives withdepreciation calculated at replacement cost.
7. While the CCA is the only available estimate of the appropriate adjustment ofdepreciation allowances, there are serious problems with its construction. It is based onestimates of "capacity disappearance" rather than as a "value reduction" standard; the twoare only exactly equivalent in the case of exponential depreciation. The underlying data onasset lives are often old and may as a result be incorrect.
120 Inflation and Effective Tax Rules
inflation was a serious issue. Accelerated depreciation was introduced tothe tax law in 1954 (a year in which the CPI actually fell) because of aconviction that tax depreciation lives were too long. Extensions ofaccelerated depreciation in subsequent years appear to have been moti-vated by a desire to stimulate investment rather than as an offset toinflation. As Stanley Surrey noted in connection with the 1971 accelera-tion provisions that created the asset depreciation range (ADR) system."The new Asset Depreciation Range system was urged by the Treasuryand adopted by the Congress in 1971 not as a device needed to measurereal net income . . . (but) as an incentive for the purchases of newmachinery and equipment" (Surrey, 1973, p. 32). Similarly the invest-ment tax credit was introduced as a countercyclical measure to stimulatedemand in 1962, a year in which the CPI rose only 1.2 percent.
Although the tax credits and accelerated depreciation that were legis-lated before the recent inflation can clearly be regarded as investmentincentives rather than offsets to inflation, it might be argued that thechanges made in the Tax Reduction Act of 1975 (and in subsequentlegislation) were intended at least partly as an offset to the inflationarydistortions of the tax liabilities. It is worth emphasizing therefore thatthese tax changes have done relatively little to reduce corporate taxes.The accelerated depreciation component of the capital consumptionadjustment rose from $20.4 billion in 1975 to $25 billion in 1977, anincrease proportional to the nominal level of fixed investment in thenonfinancial corporate sector. The increase in the amount of the invest-ment tax credit between 1975 and 1977 due to the liberalization enactedin 19758 cannot be measured precisely but a reasonably accurate "upper-bound" estimate can be made. If the 3 percent increase in the InvestmentTax Credit rate applied to all equipment investment in 1977, the addi-tional tax credit for nonfinancial corporations would have been only $3.4billion. This is clearly an overestimate of the additional investment taxcredit because various limitations prevent all corporations from using thefull 10 percent credit and because the rate is less than 10 percent oncertain types of equipment. Furthermore, the 1975 liberalization of theI.T.C. can be ascribed at least as plausibly to antirecession policy as to adesire to offset inflation's impact on taxable profits.
8.1.2 The Period Since 1954
It is useful now to see the growing impact of inflation on tax liabilitiesby examining the evolution of taxable income and taxes since 1954.9 This
8. The Tax Reduction Act of 1975 raised the investment tax credit from 7 percent to 10percent and liberalized the accelerated depreciation rules.
9. We begin with 1954 to avoid the complexities of the excess profits taxes that werelevied during the Korean War. The Internal Revenue Code of 1954 represented a majoroverhaul of the tax law that, with amendments, continues to provide the framework forcurrent tax legislation.
121 Inflation and the Taxation of Capital Income in the Corporate Sector
analysis shows that, although inflation has caused some increase in corpo-rate taxes for the past two decades, the period since 1970 has seendramatically greater tax increases induced by inflation.
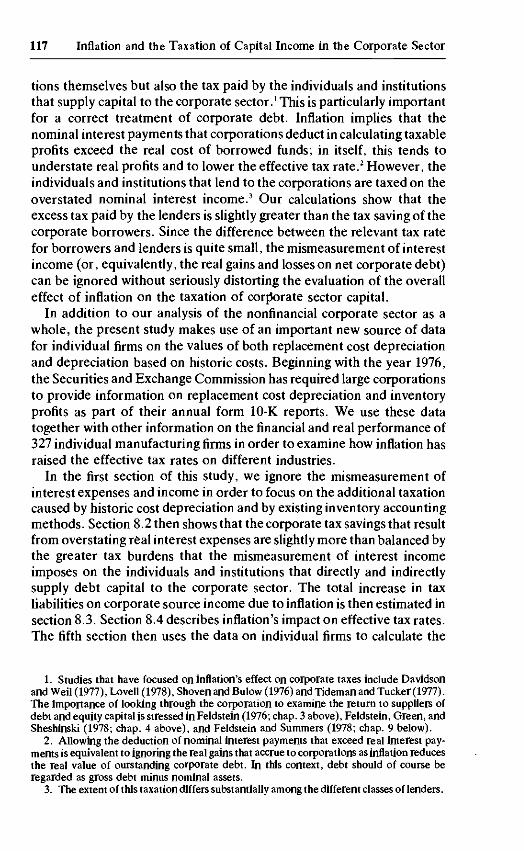
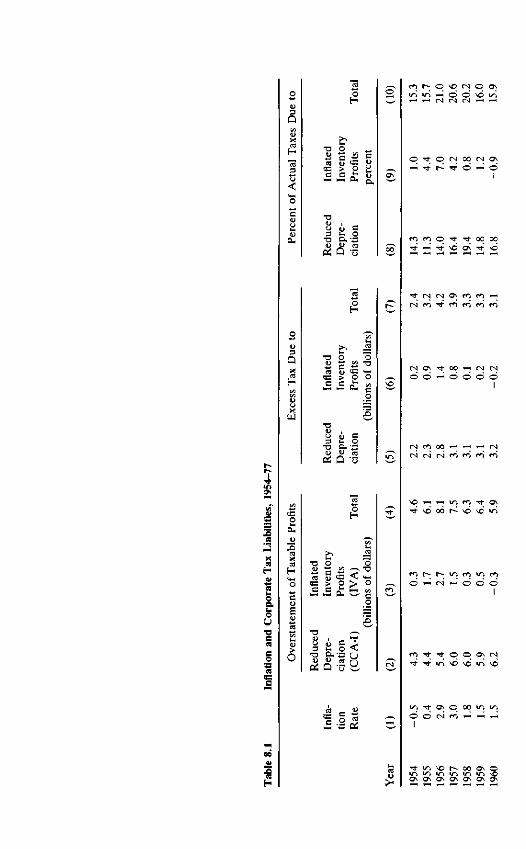
Table 8.1 presents annual information on the distortion of taxableprofits caused by historic cost depreciation (CCA-I) and by artificialinventory accounting profits (IVA), the additional tax due to each ofthese, and the proportion of actual taxes that are accounted for by theseextra taxes.
Consider first the reduced depreciation for tax purposes caused byhistoric cost accounting. Column 2 shows that this reduction in deprecia-tion (CCA-I) remained less than $10 billion a year until 1970 but reached$39.7 billion in 1977. The 1977 level is nearly double the 1974 level andnearly eight times the level of 1967. This is reflected in the correspondingadditional taxes shown in column 5. While the additional tax due tohistoric cost depreciation varied between $2 billion and $3 billion a yearuntil 1967, it has doubled every three years since then: the additionaltaxes rose from $2.4 billion in 1967 to $4.8 billion in 1970, $10.3 billion in1974, and $19.1 billion in 1977. While the extra tax caused by historic costdepreciation accounted for 9 percent of actual corporate taxes in 1967(see column 8), it accounted for 32 percent of the taxes paid in 1977.
The artificial inventory profits also remained very small until 1967,never reaching $3 billion (column 3). More recently, however, inventoryprofits have exceeded $10 billion a year and the resulting excess profitshave accounted for more than 10 percent of actual taxes paid.
Column 10 summarizes the overall effect of both sources of increasedtaxation. Until 1967, the extra tax caused by inflation accounted for 10percent to 20 percent of the corporate taxes actually paid. This impliesthat the excess tax raised the tax that would otherwise have been paid byup to 25 percent. During the most recent five years, however, the excesstax accounted for an average of 50 percent of the corporate taxes actuallypaid. This implies that corporate taxes were twice as great as they wouldhave been if replacement cost depreciation was permitted and artificialinventory profits were not taxed.
It is important to recognize that these distortions will continue to groweven if the rate of inflation does not accelerate any further. The under-statement of an asset's depreciation allowance depends on the increase inthe price level since it was purchased. Hence the understatement ofdepreciation will rise until inflation has lasted as long as the oldest assetwhich is still being depreciated. The accounting conventions used in ourtax system make taxes very sensitive to the rates of inflation that we haverecently experienced. The substantial additional tax burden caused byinflation will continue to grow unless either the tax law or the rate ofinflation changes significantly.
o* • *
OJpQ
1/1
4)X
H
oH
£̂*° 202 > O
s-.3
bil
«
atHw"S
Jorj
•o
ion
C8
c
fit
o£3caXCS
Ho
ent
Ea.K
rst
6
T3CL)
Pi
Q-iVQ
c
•o o 3«i c " -aB > O O
8 <u c3 ii O<U O ct]
Pi Q -5
o o
§ * < <«
S O <
Q -3 B
SIS
^H <N (N
o o o
O © O\ (N
o oI
in i o >r» <n >ri i/)ON OS OS OS ON OS

h n qo\ ON o
en ON O O VO VD
O © dI I
o •* oom in 06
a\ oo00 ON \O fNc oo oi oi
i n e n c N C M O O e n o oCM C M C N C N C N m en in t^
d d d d oO 00 00 ON inT-H O n̂ <N (N
O 00 O t̂ CM(N <N (N (N
en oo in CN oo
CN in ONd d T-H en >n <n
I I
ON 00rn en
>n in en
T-H CMCN en en en
i; qen en NO in en en oo
q oo oor-̂ •* vd
TH (N
ON ON
t - - o o o N O T - H c M e n r i - i n v o r -N o v o v o r - r ^ r - - t - - t - ~ r - - r - - r -ON ON ON ON ON ON ON ON ON ON ON
124 Inflation and Effective Tax Rules
8.2 The Total Taxation of the Corporate Sector
We now turn to the crucial issue of corporate debt. Although inflationreduces the real value of outstanding corporate debt, this gain by cor-porations is not taxable income. Equivalently, corporations subtractnominal instead of real interest payments in calculating taxable profits. Anumber of previous writers on the relation between inflation and corpo-rate taxes have concluded that the corporate tax saving from the exclu-sion of real gains on the debt is sufficient to offset the additional taxcaused by the mismeasurement of depreciation and inventory profits.10
This has been interpreted as implying that inflation has no net effect onthe taxation of corporate source income.
These conclusions are misleading because they are based on considera-tion of only some of the taxes levied on corporate source income. Thebasic issue is not the effect of inflation on the corporations' tax liability butthe effect of inflation on the taxation of capital used in the corporatesector. It is important to look through the corporation to the individualsand institutions that provide the equity and debt capital. The total tax oncorporate source income includes taxes paid by the owners of corporatesecurities on dividends, interest payments, and capital gains. It is thistotal tax rather than the tax levied at the corporate level alone that affectseconomic incentives.
This perspective is particularly important with respect to interest pay-ments. While corporations are permitted to deduct nominal rather thanreal interest payments, lenders are obliged to pay taxes on nominalinterest receipts. The effect of inflation on the total taxation of interestincome depends on the relative magnitude of the tax rates facing corpo-rate borrowers on one hand and those who lend to corporations on theother. If the tax rate of corporate borrowers exceeds that of lenders, totaltax payments fall. Otherwise, tax revenues rise.11
The effect of dividend and capital gains taxes must also be considered.The mismeasurement of income which gives rise to extra corporate taxpayments reduces dividends and retained earnings. This causes a reduc-tion in noncorporate taxes which partly offsets the increase in corporatetaxes. Inflation also increases nominal capital gains but not real capitalgains, leading to increases in noncorporate tax payments. A full calcula-tion of the effects of inflation on the taxation of corporate source incomerequires taking account of these effects. The analysis that we present inthis section shows that the relevant weighted average of the marginal taxrates paid by the individuals and institutions that lend to nonfinancial
10. For example, Shoven and Bulow (1976) and Cagan and Lipsey (1978) reached thisconclusion.
11. The potential balancing between borrowers and lenders is stressed in theoreticalmodels of the effect of inflation in Feldstein (1976; chap. 3 above), and Feldstein, Green,and Sheshinski (1978; chap. 4 above).
125 Inflation and the Taxation of Capital Income in the Corporate Sector
corporations is even greater than the marginal rate of tax that is saved bycorporations and their shareholders because of the overstatement of trueinterest payments. More specifically, we shall show that the relevantmarginal tax rate for those who lend to corporations is 0.420 while therelevant combined rate of corporations and their shareholders as borrow-ers is 0.404.12 Ignoring the real gains and losses on corporate debt there-fore results in an underestimate of the total excess tax on corporate sourceincome that is caused by inflation. However, since the difference betweenthe effective marginal rates of the borrowers and the lenders is quitesmall, the whole issue of the real gains and losses on debt (or themismeasurement of interest payments) can be ignored without distortingthe measurement of the additional tax caused by inflation.13
Although we believe it is important to examine the effect of inflation onthe total tax burden on corporate source income, we shall also analyze theeffect of inflation on the tax burden of the corporations and their share-holders. Our calculations, presented in section 8.3 show that the extrataxes that the corporations and their shareholders pay because of infla-tion substantially exceed the amount they save by ignoring their inflation-ary gains on their net debts. Thus whether one looks at total capitalincome or only at the equity investors, the data show that inflation raisesthe effective tax burden.
8.2.1 Noncorporate Taxation of Equity Income
Owners of corporate equity pay dividend taxes on corporate income ifit is distributed or capital gains taxes if it is retained. The rates at whichthese taxes are levied depend on the holder. Individuals, for example,pay taxes on dividend income at regular income tax rates but pay capitalgains taxes at much lower effective rates. Different financial institutionspay taxes at varying rates on capital income. As noted below, pensionincome is essentially untaxed while certain institutions (e.g. life insurancecompanies) actually face higher capital gains tax rates than dividend taxrates.
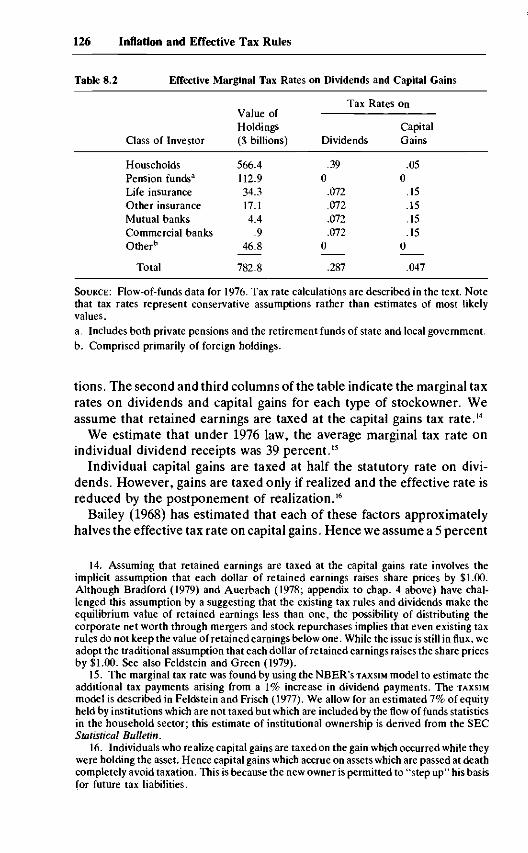
The first step in finding the effective tax rate paid on equity income is todetermine the distribution of ownership of corporate equity. Table 8.2displays the pattern of ownership of corporate equity at the end of 1976 asreported in the official flow of funds accounts prepared by the Board ofGovernors of the Federal Reserve System. The bulk of the equity is heldby households with significant fractions held by pension funds and lifeinsurance companies. A small portion is held by other financial institu-
12. The reason why the combined effective marginal tax rates for corporations and theirshareholders is less than the 48 percent corporate rate is that the extra corporate taxpayments lead to a reduction in taxes on dividends and retained earnings.
13. Since the lenders and borrowers are not the same individuals, inflation does cause aredistribution of net income among individuals and institutions.
126 Inflation and Effective Tax Rules
Table 8.2 Effective Marginal Tax Rates on Dividends and Capital Gains
Class of Investor
HouseholdsPension funds3
Life insuranceOther insuranceMutual banksCommercial banksOther"
Total
Holdings($ billions)
566.4112.934.317.14.4
.946.8
782.8
Tax Rates on
Dividends
.390
.072
.072
.072
.0720
.287
CapitalGains
.050
.15
.15
.15
.150
.047
SOURCE: Flow-of-funds data for 1976. Tax rate calculations are described in the text. Notethat tax rates represent conservative assumptions rather than estimates of most likelyvalues.a. Includes both private pensions and the retirement funds of state and local government.b. Comprised primarily of foreign holdings.
tions. The second and third columns of the table indicate the marginal taxrates on dividends and capital gains for each type of stockowner. Weassume that retained earnings are taxed at the capital gains tax rate.14
We estimate that under 1976 law, the average marginal tax rate onindividual dividend receipts was 39 percent.15
Individual capital gains are taxed at half the statutory rate on divi-dends. However, gains are taxed only if realized and the effective rate isreduced by the postponement of realization.15
Bailey (1968) has estimated that each of these factors approximatelyhalves the effective tax rate on capital gains. Hence we assume a 5 percent
14. Assuming that retained earnings are taxed at the capital gains rate involves theimplicit assumption that each dollar of retained earnings raises share prices by $1.00.Although Bradford (1979) and Auerbach (1978; appendix to chap. 4 above) have chal-lenged this assumption by a suggesting that the existing tax rules and dividends make theequilibrium value of retained earnings less than one, the possibility of distributing thecorporate net worth through mergers and stock repurchases implies that even existing taxrules do not keep the value of retained earnings below one. While the issue is still in flux, weadopt the traditional assumption that each dollar of retained earnings raises the share pricesby $1.00. See also Feldstein and Green (1979).
15. The marginal tax rate was found by using the NBER's TAXSIM model to estimate theadditional tax payments arising from a 1% increase in dividend payments. The TAXSIMmodel is described in Feldstein and Frisch (1977). We allow for an estimated 7% of equityheld by institutions which are not taxed but which are included by the flow of funds statisticsin the household sector; this estimate of institutional ownership is derived from the SECStatistical Bulletin.
16. Individuals who realize capital gains are taxed on the gain which occurred while theywere holding the asset. Hence capital gains which accrue on assets which are passed at deathcompletely avoid taxation. This is because the new owner is permitted to "step up" his basisfor future tax liabilities.
127 Inflation and the Taxation of Capital Income in the Corporate Sector
tax rate on capital gains. This estimate is conservative because we ignorethe taxes paid under the minimum tax and preference income provisionsof the tax law.
We assume that no taxes are levied on the equity income of pensionfunds. In fact, pension recipients do pay taxes on pension income uponreceipt. The effective rate is low, however, because the tax liability ispostponed and because the recipients generally have low marginal taxrates during retirement. Moreover, increased pension returns may beassociated with reduced employer contributions rather than increasedbenefits. In order to be conservative in our estimate of the effective taxrate on capital income, we assume a zero effective tax rate on pensionincome.17
Life insurance companies and commercial banks are taxed at corporatetax rates on dividends and capital gains. They are permitted to exclude 85percent of dividends because of the intercorporate dividend exclusion.Hence, their effective marginal tax rate on dividend income is 7.2percent.18 These institutions are taxed at a 30 percent statutory rate oncapital gains realizations. We assume an effective rate of 15 percent onsuch gains because of the effect of deferral. Unlike our treatment ofindividuals, we assume that all gains are eventually realized.
A weighted average of the effective tax rates provides our estimates ofthe overall marginal effective rates on dividends and retained earnings. Inorder to determine the noncorporate tax rate on all equity income, it isnecessary to determine how corporate profits are divided between div-idends and retained earnings. We estimate this payout ratio by using theaverage payout ratio over the past decade.19 The share of total profitsgoing to dividends over this period was 46.1 percent, implying an overalltax rate on equity income of 15.7 percent.
Using this figure it is possible to find the total tax increase on equity dueto a mismeasurement of corporate profits. Suppose that corporate tax-able income is increased by a single dollar with no change in real income.The corporation pays 48 cents more in taxes. Shareholder income in theform of dividends and retained earnings is reduced by 48 cents, leading toa decline of 7.6 cents in shareholder tax payments. Hence, total taxpayments rise by 40.4 cents. Thus, the marginal tax rate on mismeasuredincome is 40.4 percent. Calculations of the increase in corporate taxes
17. It can be argued that the tax treatment of pension income is equivalent to aconsumption tax because income put into pensions escapes all tax until the pension iswithdrawn and presumably consumed. On this view, the effective tax rate on pensiondividend and interest income is zero.
18. This overstates the dividend tax rate for insurance companies because of the specialrules applying to insurance companies.
19. In calculating the payout ratio, profits are adjusted for inflation effects on inventoryand depreciation and on real net indebtedness. We implicitly assume that there are no"clinetele" effects, so that payout ratio is the same for the equity owned by different classesof investors.
128 Inflation and Effective Tax Rules
due to historical cost depreciation or false inventory accounting overstateby about 20 percent the true additional burden on the suppliers of equitycapital.
8.2.2 The Value of Corporate Interest Deductions
Corporations are permitted to deduct nominal rather than real interestpayments. Increases in inflation raise the corporations' interest deduc-tions, thereby reducing corporate tax liabilities. Although the corporatetax rate is 48 percent, the overstatement of interest expenses reducestotal tax payments by less than 48 percent. This occurs because theincrease in after-tax corporate income results in an increase in noncorpo-rate tax payments on dividends and capital gains. In section 8.2.1, weshowed that the effective marginal tax rate on dividends and retentions is15.7 percent; i.e., it was demonstrated that the equity owners' tax rate on"mismeasured" corporate income was 40.4 percent. This is the correctmeasure of the reduction in tax liabilities due to the deduction of nominalinterest. It is this 40.4 percent rate that can be compared with themarginal tax rate of corporate debt holders in order to determine theeffect of inflation on the taxation of interest income and expenses. In thenext part of this section we consider the extra tax paid by the holders ofcorporate debt.
8.2.3 The Tax on Corporate Debt Holders
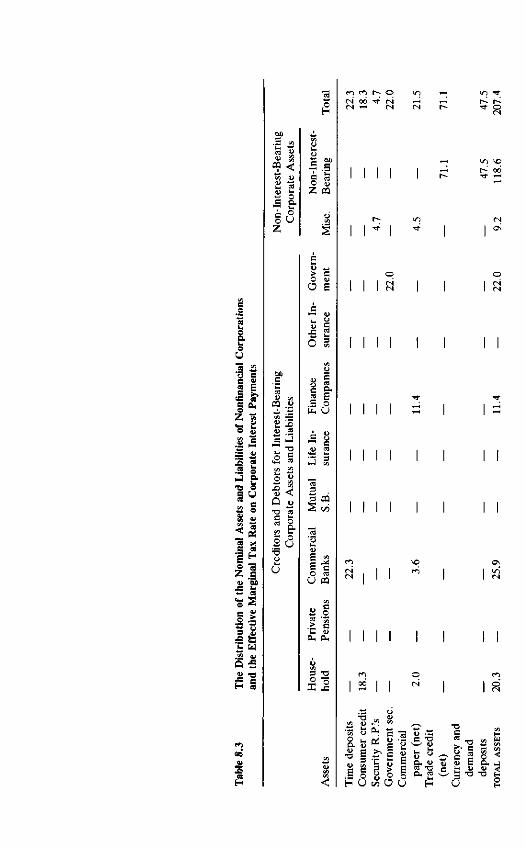
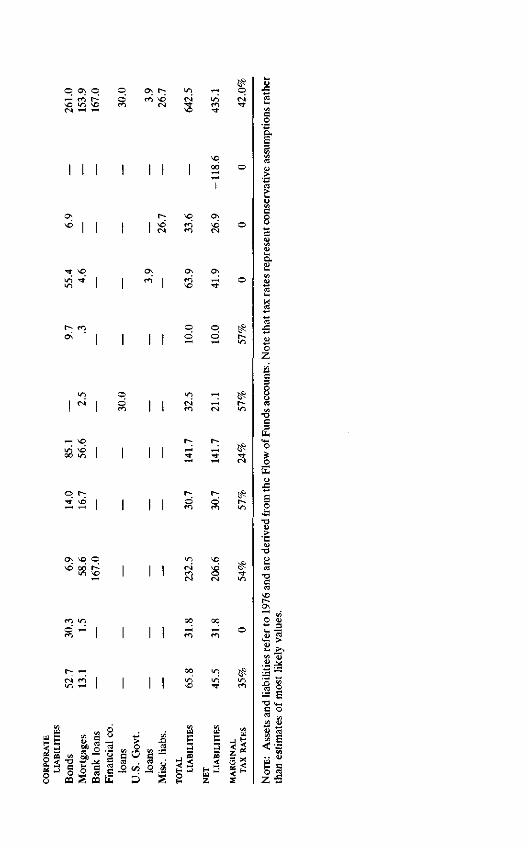
We now examine the extra taxes that the holders of corporate debt paywhen interest rates rise in response to a higher rate of inflation.Equivalently, we estimate the amount by which their taxes would bereduced if the taxation of interest income were indexed. We also examinethe extra taxes corporations pay on their interest-bearing financial assets.In table 8.3 we display the nonfinancial corporate sectors' interest-bearing financial assets and liabilities at the end of 1976. The holders ofthese securities are shown in the different columns. These figures arederived directly from the official flow of funds accounts. The penultimaterow provides the net corporate debt holdings of each class of investor,formed by aggregating the entries in the column. In order to calculate theeffective tax rate on the holders of corporate debt, we find the weightedaverage of marginal tax rates for each investor class.
Before describing our estimates of the specific marginal tax rates,several features of table 8.3 deserve comment. First, most corporate debtis not in the form of bonds. Nearly half is comprised of bank borrowingand mortgages. Second, only a small proportion of corporate interestpayments, less than 15 percent, goes to individuals. The largest portiongoes to commercial banks. Third, it is important to recall that corpora-tions themselves hold a large quantity of interest-bearing financial assets.
129 Inflation and the Taxation of Capital Income in the Corporate Sector
Inflation leads to the increased tax liabilities on increased income fromthese assets.20
Our estimate of the marginal tax rate facing each class of creditors isshown in the bottom row of table 8.3. These estimates are only approxi-mate since the laws governing financial institutions are quite complex andsince all of the desired information is not available. Fortunately, theestimates that are most uncertain generally apply to only small quantitiesof debt. When in doubt, we have selected relatively conservative assump-tions. The rationale for each of our estimates now follows:
Households. According to the NBER TAXSINT model, the weightedaverage of the marginal tax rates on interest income is about 25 percent.However, this average includes bank deposit interest as well as intereston corporate securities. Since corporate bonds are held by more affluenttaxpayers than ordinary bank account time deposits (see Projector andWeiss, 1966), the 25 percent overall figure for all interest payments is toolow. We have selected a 35 percent tax rate on interest paid, therebyimplying that household bondholders have lower marginal tax rates onaverage than household dividend recipients.
Pensions. These are conservatively treated as fully tax exempt, im-plying a zero marginal tax rate.
Commercial Banks. Commercial banks pay a 48 percent corporateincome tax at the margin on interest receipts. Those interest receipts netof corporate tax are then subject to further taxes as dividends andretained earnings; we assume the same 15.7 percent rate for this equityincome that we derived in section 8.2.1 for the equity income of nonfinan-cial corporations. Combining the 48 percent and the 15.7 percent impliesan overall tax on this equity income of 56.1. However, when the interestrates that banks charge rise, banks also raise the interest payments thatthey make to their depositors. To the extent that these interest paymentsrise, the banks do not pay extra taxes but their depositors do. Of course,there is no increase in the interest paid on demand deposits. We assumethat interest rate ceilings constrain the increase in other interest rates to0.3 percent for each 1 percent increase in inflation.21 When this is allowedfor, the total marginal tax rate on corporations and their depositors isapproximately 54 percent.22
Mutual Savings Banks. In some cases, these banks pay the same 48percent tax as ordinary corporations. However, mutual savings bankswith a sufficient fraction of their assets in the form of local mortgages are
20. In some cases this leads to deductions for the issuers of the assets.21. This assumption is based on a regression for the 1954-77 period of the time deposit
rate on the rate of inflation.22. This assumes that demand deposits account for 38 percent of total bank liabilities
and that the marginal tax rate on the depositors at commercial banks is 25 percent.
oU"as g•« e
I 22
S U
§ a
U OX)
5 S
CQ <
<u<u1—1c
woa.
cp
PQ .J>
23T3
u
D
> cO 1)
O S
sisiII
3 CQ
0)
B CO CO
U CQ
I I
I I I
3 -c o e § o« <u c a.5 "2 c t « « <2 O J> "-1 O
H u «» o a
3
I I
I I I
I I
I I
8 ^
-o £P Og C g ,O C/5
CQ ^ CQ PH ^§ y
- 6C O
132 Inflation and Effective.Tax Rules
allowed to exclude a fraction of their portfolio income, a fraction thatincreases with the mortgage share. The overall effective rate must alsoreflect the extent to which mutual savings banks raise the interest ratethey pay and the corresponding marginal tax rate of their depositors. Weestimate a 24 percent overall rate for these institutions based on theassumption that about half of marginal income is successfully sheltered.
Life Insurance Companies. Life insurance companies are taxed accord-ing to the "Menge Formula" or "ten-to-one rule" which allows insurancecompanies to exclude a portion of their portfolio income before applyingthe 48 percent corporate tax rate (see Huebner, 1976, for a discussion ofthis tax rule). The procedure in the existing law is designed to separateinvestment income into an amount required to meet the funding require-ments for existing insurance and a residual profit that is deemed taxable.To achieve this, life insurance companies pay tax on a percentage ofincome equal to ten times the difference between the average nominalyield on the portfolio (i) and the nominal yield that the insurance commis-sioners deem to be the appropriately conservative yield to use in calculat-ing required reserves (s). Thus if the assets of the insurance company (/I)are invested at a nominal yield of i, the total tax liability of the company isT = 0.48[10(/ - s)]iA. The change in the effective tax rate caused byinflation depends on how i and s adjust. As we noted above, the nominalmarket yield (i) generally rises point for point for expected inflation. Incontrast, the regulatory authorities have not altered s in response toinflation; historically, s has remained close to 3 percent for the past 70years. The marginal tax rate implied by this tax formula for increases inthe interest rate is an increasing function of the initial marginal tax rate.Evaluating the marginal tax rate at the relatively conservative value of i= 0.07 implies a marginal tax rate of 0.57.23 We use this value to beconservative; at higher initial interest yields, the effective marginal taxwould be even greater. Note we are also conservative in ignoring the taxpaid on dividends and retained earnings of the nonmutual life insurancecompanies.
Finance Companies and Other Insurance. These are taxed like ordinarycorporations. Combining the 48 percent corporate rate with the addi-tional tax on dividends and retained earnings yields an overall marginaltax rate of 57.1 percent on this type of income.
Government. We assume that government neither pays taxes on in-terest receipts nor deducts expenses for tax purposes. While increases in
23. Note that at i = .07, a $1,000 portfolio earns $70. With s = .03 only 40 percent of thisor $28 is taxed; the tax is $13.44 and the net income is therefore $56.56. Raising the interestrate to i = .08 implies earnings of $80 but 50 percent or $40 is taxable. The tax is thus $19.20,leaving a net income of $60.80. Note that an extra $10 of gross interest raises net interestincome by only $4.24. The effective marginal tax rate is thus 57.6 percent.
133 Inflation and the Taxation of Capital Income in the Corporate Sector
interest receipts may enable governments to reduce other taxes, there isno reason to suppose that capital taxes will be reduced. Moreover, othercosts of government are increased by raising interest rates.
Miscellaneous. The interest on these assets is assumed to be untaxed.Note that "miscellaneous" includes assets and liabilities of the rest of theworld so our no-tax assumption implies that no taxes are paid to either theU.S. or to foreign governments by foreigners owning bonds of U.S.corporations. It is clear that our assumption that all of this income isuntaxed is very conservative.
In order to calculate the marginal tax rate on interest income, we haveaveraged the marginal tax rates shown in the final row of Table 8.3,weighting by the share of debt owned the class of investors' share of debt.The results imply a marginal rate of 0.420 on interest income.
This implies that inflation raises the taxation of interest income, sincethe tax rate that lenders pay exceeds that at which corporations deduct.Allowing in the overall calculation for the impact of inflation on debt thusactually strengthens the conclusion that inflation raises the effectivetaxation of capital income. This effect is, however, quite small. It is equalto 1.6 percent of net interest payments (the difference between the 42percent of lenders and the 40.4 percent of corporate borrowers or about ahalf billion dollars per year). This is dwarfed by the depreciation andinventory effects described in the previous section.
While several of our estimated marginal tax rates are only approxi-mate, they pertain to relatively small amounts of debt. It is unlikely that amore exact estimate of these numbers would alter our basic conclusionthat the tax on those who lend to corporations is at least as great as therate at which corporations and their owners can deduct interest pay-ments.
8.3 The Increased Taxation of Corporate Source Income
The first section of this paper presented calculations of the additionaltax paid by corporations because of the mismeasurement of depreciationand inventories. The current section extends that calculation in threesignificant ways to obtain the total increased tax on corporations, onequity owners, and on all sources of capital for nonfinancial corporations.
Our calculations show that inflation raised the total tax on the incomeof nonfinancial corporations by $32.3 billion. This amount is substantiallygreater than the $26.1 billion additional tax paid by corporations them-selves because of the mismeasurement of depreciation and inventoryprofits.
We begin by analyzing the several effects of inflation in 1977. Estimatesfor the years since 1954 are then presented.
134 Inflation and Effective Tax Rules
8.3.1 An Analysis for 1977
We proceed in three steps to calculate the total additional taxes oncorporate source income in 1977. We first calculate the excess tax paid bythe corporation itself, recognizing the effect of not taxing the real gainson debt as well as the effect on depreciation and inventory profits. Wethen extend this to obtain the total excess tax paid by equity owners,including the effect on the tax liabilities of the corporations and theshareholders. Finally, we extend the calculation to the total excess taxincluding the tax paid by those who lend to the nonfinancial corporations.
The calculations in section 8.1 showed that historic cost depreciationand the existing inventory accounting practices added $26.1 billion to the1977 tax liabilities of nonfinancial corporations. In 1977 these corpora-tions had net interest bearing liabilities24 of $592.2 billion and non-interest-bearing assets (primarily cash and net accounts receivable25) of$130.9 billion. Their net nominal liabilities were thus $461.3 billion. Sincethe 1977 inflation rate was 6.8 percent (the December-to-Decemberincrease in the CPI), these corporations had a real gain of $31.4 billion ontheir net liabilities. Excluding the gain from the corporations' taxableincome saved them $15.1 billion in corporate tax. These tax savings thusoffset approximately one-half of the $26.0 billion of extra tax caused bythe existing tax treatment of inventories and debt. Inflation caused cor-porations to pay an extra tax of $11 billion in 1977.
The extra tax paid by the equity owners of the corporations differs intwo ways from the extra tax paid by the corporations. First, as wediscussed earlier, the extra tax paid at the corporate level leaves lessincome to be taxed as dividends. With a dividend payout rate of 0.46 andeffective marginal tax rates of .287 on dividends and 0.047 on retainedearnings, the $11 billion of extra corporate tax reduces shareholders owntaxes by $1.7 billion. Second, the shareholders must eventually paycapital gains tax on the nominal increase in the market value of thecompany that results from inflation. Since this nominal increase in valueis over and above the real increase due to retained earnings the extra taxpaid on this nominal gain represents an extra tax caused by inflation. Weshall assume that the nominal gain can be approximated by the product ofthe inflation rate and the real value of corporate assets.26 The relevantmarginal rate of tax on these accrued nominal gains is the effective capitalgains tax rate of 0.047. The real value of the physical assets of these
24. See section 8.2 for a description of the composition of this net amount. Note that$592.2 billion is net of the interest-bearing assets of these firms.
25. These assets also include Treasury bills and other federal government securities thatbear interest since the important distinguishing feature of these "non-interest-bearingassets" is that private individuals and institutions do not pay any interest on them.
26. The actual nominal gain caused by inflation is very hard to disengage from otherchanges in market value. Theoretical considerations imply that a change in the expectedrate of inflation will cause an inverse change in the market valuation ratio which then slowlyreturns to its equilibrium value (see Feldstein, 19806; chap. 10 below).
135 Inflation and the Taxation of Capital Income in the Corporate Sector
corporations (plant and equipment, inventories and land)27 in 1977 was$1,684 billion. The inflation rate of 6.8 percent and the tax rate of 0.047imply an additional capital gains tax of $5.3 billion. The total excess taxon the equity owners of the nonfinancial corporations is therefore thesum of three terms: the $11 billion of extra corporate income tax minusthe $1.7 billion resulting reduction in personal taxes plus the capital gainstax of $5.3 billion. Inflation thus induced a net extra tax of $14.6 billion oncorporations and their owners in 1977.
To obtain the total additional taxation on corporate source income thatis caused by inflation, the additional taxation of corporate creditors mustbe added to this $14.6 billion. The net financial capital supplied by thecreditors of these corporations was $595.2 billion.28 The inflation rate of6.8 percent imposed a real loss of $40.5 billion that should have beenoffset against the interest income of the creditors. The effective marginaltax rate of 0.420 on interest income implies an additional taxation of $17billion.29
Combining this $17 billion with the $14.6 billion implies an extra tax oncorporations and their owners of $31.6 billion. This additional tax oncorporate source income was 54 percent of the corporate income taxliabilities of $59 billion and 34 percent of the combined corporate, share-holder, and lender tax liabilities of $93 billion. Stated in yet a differentway, the excess tax of $31.6 billion caused by inflation is equivalent to anadditional wealth tax or capital levy of 2 percent on the real corporateassets of $1,684 billion. Since these corporations earn between 10 and 12percent on their real assets,30 this extra tax absorbs between one-sixth andone-fifth of pretax real earnings.
8.3.2 The Period Since 1954
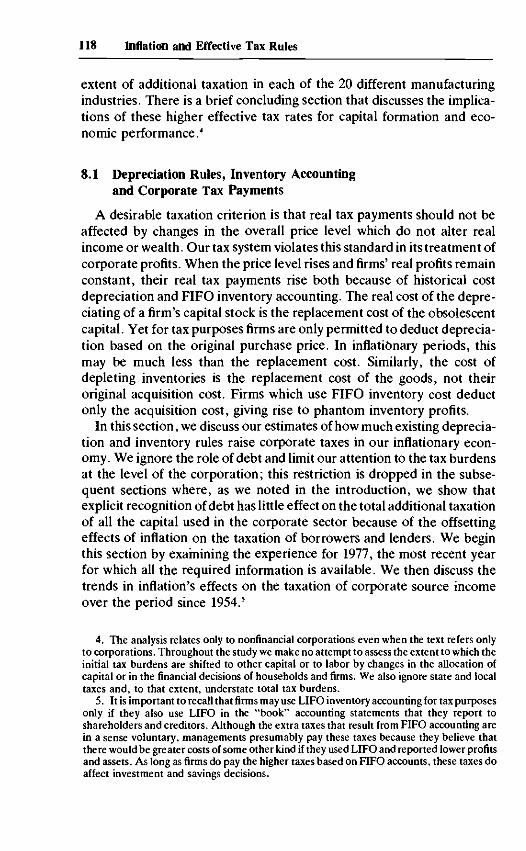
This same framework can be used to calculate the additional tax causedby inflation in each year since 1954.31 Since we do not have a detailedflow-of-funds calculation of the sort presented in section 8.2 for eachyear, we shall use the same effective marginal tax rates for all years. Thecalculations therefore represent the additional tax that would have beencaused for each year if the 1976 statutory tax rates and composition ofcreditors and debtors had prevailed; differences that result from usingactual statutory rates and ownership information would be small relativeto the differences over time caused by the changing history of inflation.
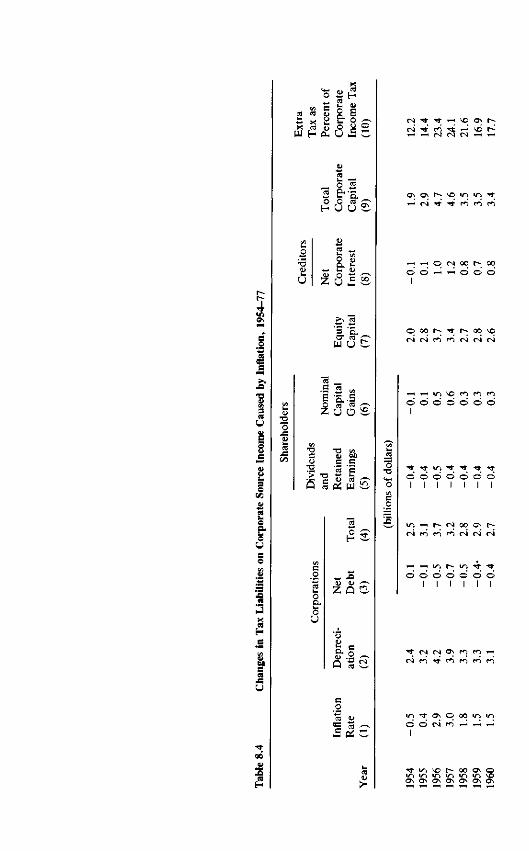
Table 8.4 traces the evolution of the inflation-generated additional
27. The data came from Von Furstenberg (1977).28. We ignore the corporate assets in the form of government securities and net accounts
receivable because these do not represent the supply of financial capital by private investors.29. We neglect here the capital gains or losses accruing to firms and bondholders in
existing debt when the interest rate changes.30. See Feldstein and Summers (1977).31. These are additional taxes due to inflation in the sense that they would not have been
paid if the system were fully indexed.
CO CO <L) 9 E£3 X H B* Ox * « o «
_, o 2
H U U i
o"3u
U_̂»m
Z
O i
US
s aW U !
Z O O S
S
CO «
N 1- ci 1;^ ^H (Nl fN
^H r^ O (N 00O ©" 1-H *-H O
H rn in *o ci n no o o o o o o
o oI I
o o o oI I I I
oo a hCA r-j CN
d o o o o o o
rn cn m m
>t a q oo ino oI
•* «n vo r-- oo>f} >/~) U~t V) V)O^ O\ Os Os ON

oo NO en oo iri«N rH CS O CN
Tt• |~- i—I OS V)O O r̂ O r̂
O N O S < N C O O - ^ r-* O r- ON. O
c-r--r--ON
o o o o o
O O O O OI I I I I
O O O O O O OI I
O T-H
I I
oo t̂ o\ h- x o\ qM >t N M « fn H
q H oo in oo
1 1 1 1t * o J ^ f r O i r i
' ' 7 7 7 7 7
VO <<•> <NI CN
t--; CNI NO ( N ON 0 0 (N O QO O0
VO t~- 0 0 ON O
ON ON ON ON
138 Inflation and Effective Tax Rules
taxation of corporate source income between 1954 and 1977. Column 2repeats the figures from table 8.1, column 7, of the excess tax at thecorporate level due to the mismeasurement of depreciation and inventoryprofits. The corporate tax savings due to ignoring the real gains on netcorporate debt are presented in column 3. It is worth noting that theadditional tax paid to the mismeasurement of depreciation and inventoryprofits always exceeds the tax savings on the debt gains. The net excess atthe corporate level, presented in column 4, remains relatively low (lessthan $5 billion) until 1974 when it jumped to $8.7 billion.
The reduced taxation of dividends and retained earnings due to highercorporate tax payments is shown in column 5 and the capital gains taxliability on the nominal capital gains caused by inflation is shown incolumn 6. Combining columns 4, 5, and 6 gives the net increase in thetaxation of equity capital presented in column 7. This additional tax onequity income remained less than $5 billion until 1970 but has exceeded$10 billion annually since 1974. The additional tax on equity income since1970 has totalled more than $80 billion.
Column 8 presents the very important additional tax on the individualsand institutions that provide debt capital to the nonfinancial corpora-tions. This excess tax on lenders reached $5 billion in 1968 and exceeded$15 billion in 1973. The additional tax on those who lent to nonfinancialcorporations has exceeded $100 billion in the brief period from 1970 to1977.
The total additional tax on corporate source income caused by inflationis shown in column 9. Three things should be noted about these figures.First, this total extra tax caused by inflation exceeds the extra tax paid bycorporations because of the mismeasurement of depreciation and inven-tory profits (column 2). Focusing exclusively on the extra corporate taxespaid because of the mismeasurement of depreciation and inventoryprofits is therefore a conservative evaluation of the total inflationaryimpact. Second, the total excess tax remained less than $5 billion a yearuntil 1966, doubled by 1970 and doubled again by 1973. The excess taxhas exceeded $20 billion a year since 1973. Third, the total excess tax oncorporate source income has exceeded $180 billion in the period between1970 and 1977.
Finally, column 10 states the total excess tax on corporate sourceincome as a percentage of the corporate tax liability. Although the extratax remained less than one-sixth of corporate income tax payments untilthe mid-1960s, it then quickly rose to more than one-third of the corpo-rate income tax. For the final five years, the excess tax payments havebeen more than 50 percent of corporate tax liabilities.
139 Inflation and the Taxation of Capital Income in the Corporate Sector
8.4 The Effective Tax Rate on Corporate Source Income
This section presents our estimates of the total effective tax rate on thereal capital income earned in the corporate sector. Our calculations showthat the total tax on corporate source income in 1977, including the taxliabilities of shareholders and lenders as well as of the corporationsthemselves, was $91.8 billion, an effective tax rate of 67 percent on thereal pretax income of the nonfinancial corporate sector. The data showthat this 67 percent represents a substantial increase in the effective taxrate over the past decade and a return to the effective tax rates of themid-1950s.
The substantial increase in the effective tax rate despite statutoryreductions reflects the impact of inflation. The $32.3 billion of extra taxcaused by inflation in 1977 accounts for more than one-third of the totaltax on corporate source income, raising the effective total tax rate from43 percent to 66 percent. The extra tax caused by inflation has thus offsetall of the accelerated depreciation and other legislated tax reductionsduring the past two decades.
8.4.1 The Effective Tax Rate in 1977
The best measure of the tax burden on corporate source income is theratio of the total tax paid on such income—including the taxes paid byshareholders and lenders as well as by the corporations—to the total realincome available before tax for the shareholders and creditors. Theofficial national income estimate of 1977 profits with the inventory valua-tion adjustment and capital consumption adjustment was $113.9 billion.Net nominal interest payments by nonfinancial corporations were $33.7billion. It seems at first that the total pretax income available for share-holder and creditors could be obtained by simply adding these adjustedprofits and net interest on the grounds that it is unnecessary to adjustinterest payments for inflation since any correction to nominal interestexpenses by the corporation would required an equal correction tonominal receipts by creditors. Although this is a generally correct princi-ple, one further modification is required. A significant fraction of thecorporations' financial assets are not liabilities of investors but of thegovernment or of the corporations' customers. When inflation lowers thereal value of these assets, the loss to the corporations is a gain to thegovernment and to the corporations' customers and not to individual orinstitutional investors. The corporations' loss on these financial assetsshould therefore be subtracted from other corporate profits. In 1977,these assets were $130.9 billion, the inflationary loss was therefore $8.9billion. The 1977 total pretax corporate sector income available forshareholders and creditors was therefore $138.7 billion.
140 Inflation and Effective Tax Rules
Our estimated total tax of $91.8 billion on this income consists of fivecomponents. (1) The largest of these is the corporate income tax pay-ments of $59 billion. This alone represents an effective tax rate of 42.5percent on total corporate source income. (2) Dividends in 1977 were$39.1 billion; an effective tax rate of 0.287 on dividends implies a taxliability of $11.2 billion32 and adds 8.1 percent to the effective tax rate. (3)The national income account estimate of $16 billion of retained earnings33
ignores the real gain on outstanding debt. With a net debt of $461.3billion and a 6.8 percent inflation rate, the additional real retainedearnings were $31.4 billion. The total retained earnings of $47.4 billionare eventually subject to capital gains taxation with an effective tax rateof 0.047; this adds $2.2 billion to the total tax and 1.6 percent to theeffective tax rate. (4) An additional capital gains tax liability results fromthe nominal increase in the value of corporate assets that accompanies ageneral rise in the price level. We abstract from the particular marketfluctuations of 1977 and calculate that the real capital stock with an initialvalue of $1,684 billion rose by 6.8 percent. With a tax rate of 4.7 percent,this nominal increase implies an effective tax of $5.4 billion, adding 3.9percent to the total effective tax rate. (5) Finally, the nominal interestpayments of $33.7 billion were taxable income of the creditors. With a taxrate of 0.42, these interest payments involve a tax liability of $14.2 billion,adding 10.2 percent to the effective tax rate.34 The total of these fivefigures of tax payments is thus $92 billion for a total effective tax rate of66.3 percent.
Before turning to a comparison of 1977 with earlier years, it is useful tocontrast the actual effective tax rate of 66.3 percent with several alterna-tive rates that are frequently cited. Perhaps the most common measure ofthe corporate tax burden is the ratio of the $59 billion corporate incometax to the conventionally measured corporate profits of $143.5 billion; theresulting rate of 41.1 percent is a gross underestimate of the actual totalrate. An alternative and more sophisticated rate is the ratio of thecorporate income tax to the sum of corporate profits with the inventoryvaluation and capital consumption adjustments ($113.9 billion) plus thereal gains on the net corporate debt ($31.4 billion); the resulting rate of40.6 percent is again less than two-thirds of the total burden. Thesecalculations underline the importance of looking beyond the corporation
32. This calculation uses our estimated marginal tax rate on dividends to measure theaverage tax rate on dividends. This causes an overstatement of the tax liability, but the erroris likely to be very small.
33. This is the official figure for the undistributed profits corrected for the inventoryvaluation and capital consumption adjustments.
34. We are again using an estimated marginal tax rate as an average tax rate on thisincome. This causes some overstatement, particularly for life insurance companies. Adjust-ing this to use an average rather than marginal tax rate for life insurance companies mightreduce the tax by up to $2 billion dollars.
141 Inflation and the Taxation of Capital Income in the Corporate Sector
to the shareholders and creditors in order to obtain a correct picture oftotal tax burdens on capital used in the corporate sector.
8.4.2 Variations in the Effective Total Tax Rate Since 1954
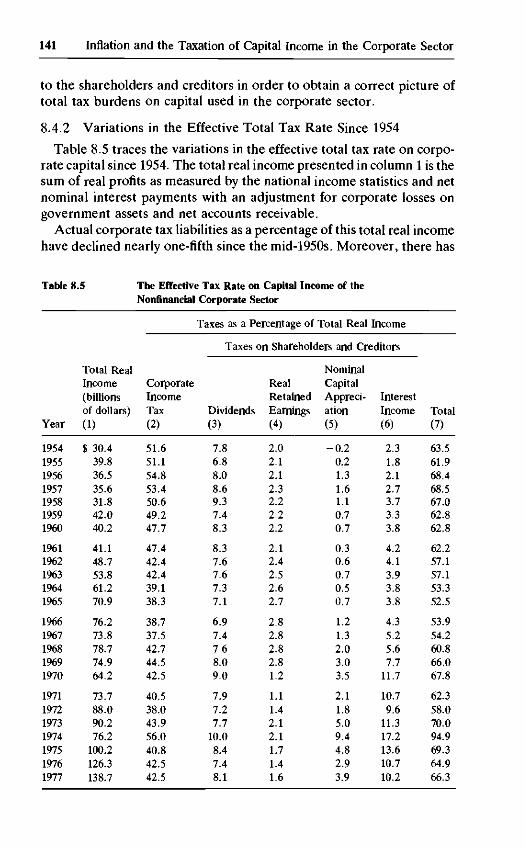
Table 8.5 traces the variations in the effective total tax rate on corpo-rate capital since 1954. The total real income presented in column 1 is thesum of real profits as measured by the national income statistics and netnominal interest payments with an adjustment for corporate losses ongovernment assets and net accounts receivable.
Actual corporate tax liabilities as a percentage of this total real incomehave declined nearly one-fifth since the mid-1950s. Moreover, there has
Table 8.5 The Effective Tax Rate on Capital Income of theNonfinancial Corporate Sector
Year
1954195519561957195819591960
19611962196319641965
19661967196819691970
1971197219731974197519761977
Total RealIncome(billionsof dollars)
(1)
$ 30.439.836.535.631.842.040.2
41.148.753.861.270.9
76.273.878.774.964.2
73.788.090.276.2
100.2126.3138.7
CorporateIncomeTax
(2)
51.651.154.853.450.649.247.7
47.442.442.439.138.3
38.737.542.744.542.5
40.538.043.956.040.842.542.5
Taxes as a Percentage of Total Real ]
Taxes on
Dividends
(3)
7.86.88.08.69.37.48.3
8.37.67.67.37.1
6.97.47.68.09.0
7.97.27.7
10.08.47.48.1
Income
Shareholders and Creditors
RealRetainedEarnings
(4)
2.02.12.12.32.22.22.2
2.12.42.52.62.7
2.82.82.82.81.2
1.11.42.12.11.71.41.6
NominalCapitalAppreci-ation
(5)
-0 .20.21.31.61.10.70.7
0.30.60.70.50.7
1.21.32.03.03.5
2.11.85.09.44.82.93.9
InterestIncome
(6)
2.31.82.12.73.73.33.8
4.24.13.93.83.8
4.35.25.67.7
11.7
10.79.6
11.317.213.610.710.2
Total
(7)
63.561.968.468.567.062.862.8
62.257.157.153.352.5
53.954.260.866.067.8
62.358.070.094.969.364.966.3
142 Inflation and Effective Tax Rules
been no increase at all in this ratio between 1970 and 1977. This hasincorrectly led some observers to discount the argument that inflationraised real tax burdens on capital income.
The varying taxes on shareholders and creditors in columns 3 through 6reflect variations in dividends, full retained earnings, inflationary appre-ciation, and interest payments. The same 1977 effective tax rates areassumed for each tax base; allowing for statutory changes would raisetaxes on dividends and interest income in the earlier years and in thoseyears but this effect would be relatively small.
The net result of these changes is shown in the total effective tax ratepresented in column 7. Despite the decline in the relative corporate taxpayments, the overall effective tax rate is as high now as it was in themid-1950s. The effect of inflation has been powerful enough to offset theintroduction of the investment tax credit, the cuts in the corporate taxrate, and the more rapid acceleration of depreciation.35
8.5 Inflation and Corporate Tax Liabilities inTwo-Digit Manufacturing Industries
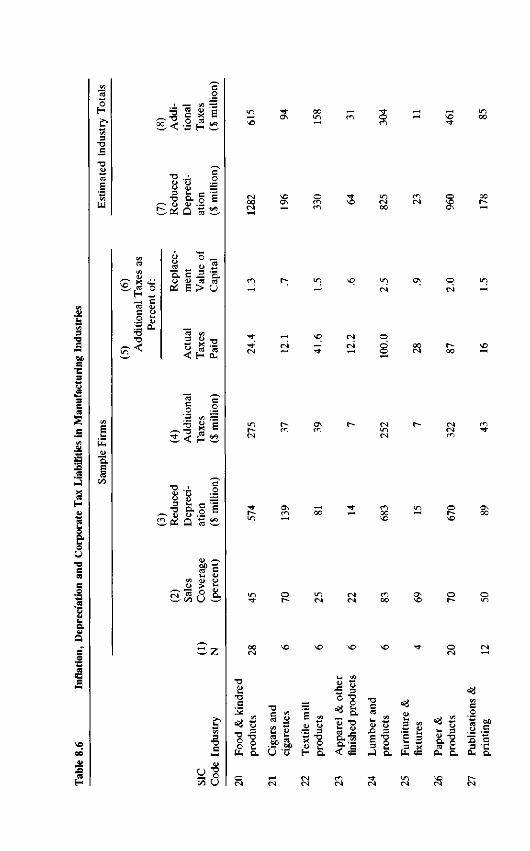
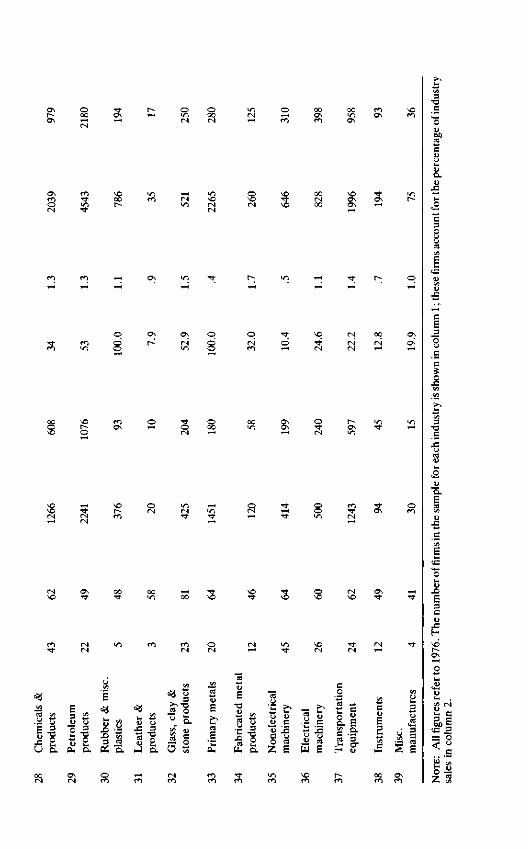
Although historic cost depreciation and existing accounting practicesraise the tax liabilities of all corporations, their importance varies sub-stantially among different industries. The current section presents in-formation for each of the 20 two-digit manufacturing industries. Formanufacturing as a whole, the additional taxes in 1976 caused by historiccost depreciation and existing accounting practices accounted for slightlymore than half of all the federal tax liabilities of these firms. Theseadditional taxes varied from less than 25 percent of actual taxes in a fewindustries to 100 percent of the taxes paid in several others. If the taxesare expressed as a percentage of the real value of capital used in theseindustries, the additional tax varies from less than 1 percent of capital tonearly 3 percent of capital. The very high tax rates that result in several ofthe industries make it particularly difficult for them to compete forcapital. If these additional tax burdens persist, the allocation of capitalamong manufacturing industries will be substantially distorted by infla-tion.
Our analysis of the additional tax burdens of individual industries isbased on information supplied by individual firms in their annual reportsand 10-K forms. Beginning with 1976, the Securities and ExchangeCommission has required the largest firms to supply information onreplacement cost depreciation and on inflation-adjusted inventory gainsas well as on historic cost depreciation and on their inventory profits as
35. We have ignored state and local taxation of corporate source income throughcorporate income rates, property taxes, and individual income rates. If these taxes wereincluded, an increase in the effective tax rate would be observed and the current rate wouldexceed 66 percent.
143 Inflation and the Taxation of Capital Income in the Corporate Sector
they are used for tax purposes. We use the differences between theinflation-adjusted and the unadjusted figures for depreciation and inven-tories to measure the overstatement of taxable profits. For each industry,we then compare the total additional tax liabilities implied by theseoverstated profits with the actual tax liabilities paid by the firms in oursample. We also calculate the additional tax payments as a percentage ofthe real value of the capital used by the sample firms in the industry.36
Finally, we use the ratio of sales by the sample firms to sales by all firms inthe industry to estimate the total additional taxes caused in each industryin 1976 by historic cost depreciation and by prevailing accountingmethods.37
Although the general approach of these calculations parallels theanalysis of section 8.1, there are several differences that should be bornein mind in interpreting the results. First, the information supplied by thefirms represents consolidated accounts and not just the domestic activi-ties that were analyzed in section 8.1. Because we are forced to includethe overseas depreciation and inventory gains, we overstate the extent ofovertaxation. Second, the firms provide the historic cost depreciation andreplacement cost depreciation as alternative measures of "book" depre-ciation rather than "tax" depreciation. Since the straight-line "book"depreciation is less than the accelerated "tax" depreciation, this proce-dure causes us to understate the extent of overtaxation. The net effect ofthese two countervailing biases cannot be determined from the existingdata but is unlikely to be large enough to distort the conclusions of theanalysis.38
The sample of firms for which we have information represents approx-imately 50 percent of the total sales of manufacturing firms. Because ofthe nature of the SEC requirement, the sample consists exclusively oflarge firms. Moreover, the coverage varies substantially among the indus-tries with a very much smaller fraction of sales in the samples for someindustries than for others. The tables in this section indicate the numberof firms in each sample and the fraction of sales that the sample firmsrepresent.39
36. Estimates of the replacement cost value of plant, equipment, and inventories arealso required by the SEC.
37. We do not analyze the effects of inflation on real indebtedness because data on theownership of securities by industry does not exist. The results in section 8.2 suggest that thisomission is not likely to have a great impact on the conclusions.
38. These results should be viewed with caution for other reasons. There appear to bewide variations in the methods used by firms in estimating replacement cost figures. There isno necessary correspondence between the depreciation lives used by firms and those used inthe construction of the aggregate statistics presented above.
39. To estimate total sales in each industry, we use the Compustat file of 2,500 firmsprepared by Standard and Poor. The 1,332 manufacturing firms in this file represent 1976sales of $1,052 billion or 87 percent of all manufacturing sales as estimated by the FederalTrade Commission. We use the Compustat file to estimate total sales by industry in order tobe sure that firms are classified by industry in the same way as in our replacement costsample.
144 Inflation and Effective Tax Rules
Table 8.6 presents information on the extent of reduced depreciationand the consequent additional taxation. The first two columns show thenumber of firms in the sample and the percentage of the total industrysales accounted for by the sample firms. The third column shows theunderstatement of depreciation, i.e., the difference between replace-ment cost depreciation and historic cost depreciation. The additional taxliability presented in column 4 is calculated by summing (for all thesample firms in the industry) 0.48 times each firm's understated deprecia-tion up to the limit of the tax actually paid by the firm. Note that this is avery conservative statement of the additional tax for any firm in which thelimit constrains our calculated amount because it assumes that no addi-tional profits would have been earned even at a zero tax rate and disre-gards the possibility of carrying losses forward. Column 5 expresses theadditional tax as a percentage of the total federal tax liability of the firmsin the sample while column 6 states the additional tax liability as apercentage of the replacement cost value of the firms' real capital stock.40
The remaining two columns are estimates for all the firms in the industryand not just the sample; they are obtained by rescaling the sample valuesfor each industry by the ratio of total industry sales to sales in the sample.
The relative importance of the additional taxes that resulted from theunderstatement of depreciation varied substantially among the 20 indi-vidual industries. Column 5 shows that these additional taxes representedless than one-sixth of actual 1976 tax liabilities in 6 of the 20 industries.These are primarily nondurable goods (tobacco, apparel, printing andpublishing, and leather and footwear) but also include the nonelectricalmachinery and instruments industries. At the other extreme, there arefour industries in which the additional tax represents more than three-fourths of actual tax liabilities: primary metals, rubber, paper, and woodproducts.
A similar picture of very substantial variation emerges when the addi-tional taxation is related to the replacement cost value of the firms' realcapital stock (column 6). The additional tax varies from 0.4 percent of thereal capital stock in the primary metals industry41 and 0.5 percent in thenonelectrical machinery industry to 2.0 percent in the paper industry and2.8 percent in the wood products industry.
For manufacturing as a whole, the reduction in real depreciationtotalled $18 billion or half of the reduction for all nonfinancial corpora-
40. The real capital stock includes inventories as well as property, plant, and equipmentbut excludes financial assets and liabilities.
41. This tax is kept so low because the extra tax is assumed to be no greater than actualtaxes paid which, in the case of primary metals, were kept low by extremely low real profits.
145 Inflation and the Taxation of Capital Income in the Corporate Sector
tions that was discussed in section 8.1. Nondurable goods industries (SICcodes 20 through 29) accounted for 58 percent of this reduced deprecia-tion or $10.4 billion. Reduced depreciation in durable goods industries(SIC codes 30 through 39) was $7.6 billion. The additional tax caused bythe understatement of depreciation was $7.6 billion, of which $4.9 billionwas in nondurable goods industries and $2.7 billion was in durable goodsindustries.
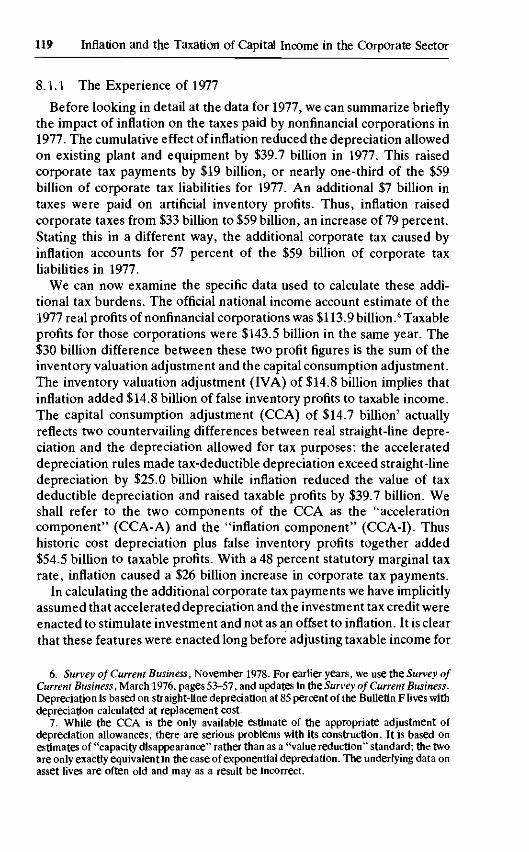
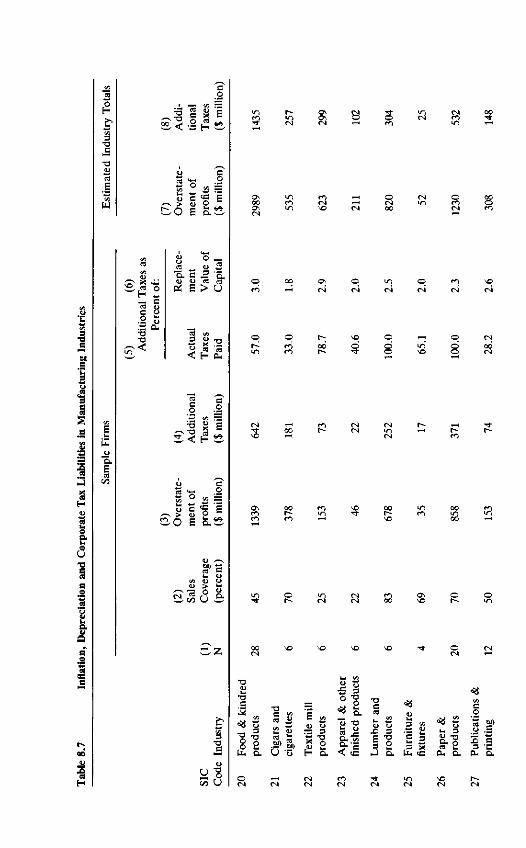
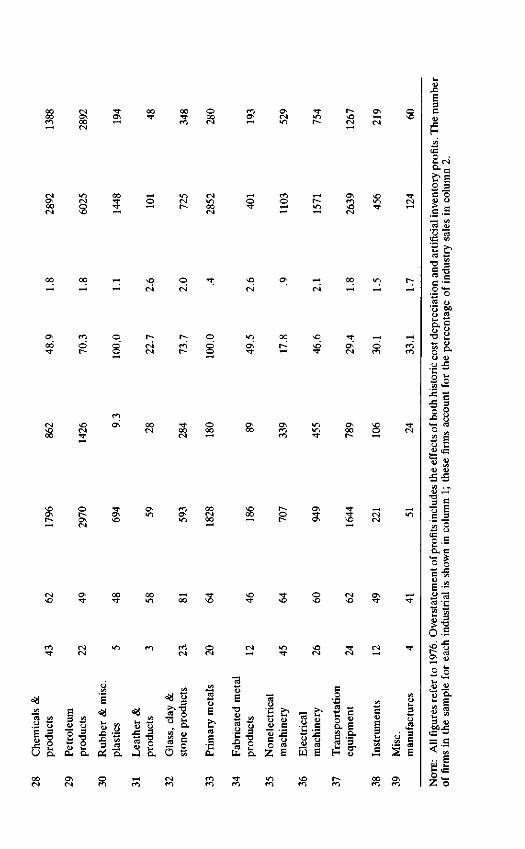
Table 8.7 presents the combined effects of reduced depreciation andoverstated inventory profits. The organization of the table parallels thatof table 8.6. The results presented in column 5 show very substantialvariation among industries in the importance of the extra tax as a percent-age of actual taxes paid. In two of the industries (leather and nonelectri-cal machinery), the extra tax amounted to less than 20 percent of theactual tax paid. In contrast, four of the industries (wood and woodproducts; paper; rubber; and steel) would have paid no tax if deprecia-tion had been calculated at replacement cost and if the artificial inventoryprofits were also eliminated. Column 6 confirms the picture of substantialvariation among industries by comparing the additional tax to the re-placement value of the real capital stock. The extra tax paid (as limited bythe total tax paid) varied from less than 1 percent of the capital stock onthe primary metals and nonelectrical machinery industries to nearly 3percent of the capital stock in the food industry and in textiles.
For all manufacturing industries, the mismeasurement of depreciationand inventories totaled $27.1 billion or 54 percent of the aggregatereported for all nonfinancial corporations in section 8.1. Of this $27.1billion total, 58 percent was accounted for by nondurable manufacturing.Note that this 58 percent is the same as the figure for depreciation only,implying that the mismeasurements of inventories and depreciation aredistributed in the same way. The additional taxation for manufacturingfirms totalled $11.3 billion, of which $7.4 billion was in the nondurablegoods industries.
8.6 Conclusion
The tax laws of the United States were designed at a time when therewas little or no inflation. The analysis in this paper has shown that, withthe existing tax laws, inflation substantially increases the effective tax rateon capital income in the nonfinancial corporate sector. In contrast toearlier studies of the impact of inflation on corporate tax burdens, wehave considered not only the tax paid by the corporations themselves butalso the taxes paid by the individuals and institutions that supply capitalto the corporate sector. This is particularly important for a correcttreatment of corporate debt; our calculations indicate that the additional
T3Uo
edu
pi
'5<D
D-
Qio
n03
Co
oU
H 2— cC U
2 ST3T3
8 °« ^ <u
"a. a 5<U <U 03
Pi B >
•J-! X
U
H Cu
_2
'•3T3
in
axe
H
lion
'B
, 1 &Pi Q
U
So U
(N ^H
5 3T3 rs
3 IS <) s 31 Jf> j& g "g S 2 3 c
O VO
OC4
8
s:U
)duc
D.
:rol
e>d
uc
fl> i lPU &
bbei
3PH
stie
s
"a
<-• i2 o u ^ u o 1 0
a O tS £ o. z 6 we H
D.3
u •S
oo
•
s
m
3to£
fi
si
g o
i l
H Z—i cC3 (U
c y.9 &T3T3<
g g
o i
P< a > u
^2CO C8
Id
E
6
• > u•O S
<N , 2c/5 U
u O
55 o
S
8
§2UH D.
T3C ««CO U
U "3
• ^ 3 !«
g o n--gH a <!e
g T3 C § 1> T3^ 2 3 X CO u. 3 e
PL, a.
TO
u
6
V3{J
T3Oo.
3 £
— °a- a
ON
3
o
E>̂
u
r>
I
cate
dib
rii
PH
icts
T3O
s.
o
lect
ri
uo2
>r>
iner
y
o
I
rica
lec
ti
PJ
\o
iner
y
uca
itio
npo
rt£
V3
03
men
t
a'3a"u
to
imen
ist
ru
00
isc.
2
res
fact
u
3
caE
mpl
<gu
res
he s
a,11
fi
<;
1z
dHi
20
.S-=
w cc —
•Bo8
8 2
II
1!
I-
61so t3Os m
150 Inflation and Effective Tax Rules
tax paid by lenders because of inflation is actually slightly greater than thetaxes that corporate borrowers save by deducting higher nominal interestpayments.
The overall effect of inflation with existing tax laws was to raise the real1977 tax burden on corporate sector capital income by more than $32billion. This extra tax represented 69 percent of the real after-tax capitalincome of the nonfinancial corporate sector, including retained earnings,dividends, and the real interest receipts of the corporations' creditors.The extra tax raised the total tax burden on nonfinancial corporate capitalincome by more than one-half of its noninflation value, raising the totaleffective tax rate from 43 percent to 66 percent.
The substantial increase in the effective tax rate on capital used in thenonfinancial corporate sector can influence the performance of the econ-omy in a number of important ways. The most obvious of these is areduction in the rate of capital formation in response to the reduction inthe real after tax return.42
Moreover, since the tax rules that we have emphasized do not apply toresidential real estate, the combination of inflation and existing tax ruleswill encourage a redistribution of investment away from the corporatesector and to residential construction and consumer durables. Withintotal corporate investment, existing tax rules will induce firms to investmore in inventories and less in equipment and structures.
The evidence on individual manufacturing industries presented in sec-tion 8.5 shows that there is substantial variation among industries in theextent to which inflation has caused greater tax burdens. In some indus-tries, the additional tax induced by inflation accounts for less than 25percent of actual taxes paid; in other industries, the additional tax in-duced by inflation is responsible for the entire actual tax payment. Theadditional tax varies from less than 0.5 percent of the real capital in twoindustries to nearly 3 percent in others. This substantial variation impliesa further source of capital misallocations among individual industrieswithin the overall manufacturing sector.
42. Although this reduction cannot be unambiguously established, in any realistic lifecycle model a lower net return will reduce private saving (Summers, 1978). Some prelimi-nary empirical evidence tends to support this view (Boskin, 1978).

Ill Interest Ratesand Asset Yields