Embed Size (px)
Citation preview
Financial Accounting
John J. Wild
Sixth Edition McGraw-Hill/Irwin Copyright © 2013 by The McGraw-Hill Companies, Inc. All rights reserved.
Chapter 05
Reporting and Analyzing Inventories
Conceptual Chapter Objectives
C1: Identify the items making up merchandise inventory.
C2: Identify the costs of merchandise inventory.
5-*

Analytical Chapter Objectives
A1: Analyze the effects of inventory methods for both financial and tax reporting.
A2: Analyze the effects of inventory errors on current and future financial statements.
A3: Assess inventory management using both inventory turnover and days’ sales in inventory.
5-*
Procedural Chapter Objectives
P1: Compute inventory in a perpetual system using the methods of specific identification, FIFO, LIFO, and weighted average.
P2: Compute the lower of cost or market amount of inventory.
P3: Appendix 5A – Compute inventory in a periodic system using the methods of specific identification, FIFO, LIFO, and weighted average (see text for details).
P4: Appendix 5B – Apply both the retail inventory and gross profit methods to estimate inventory (see text for details).
5-*
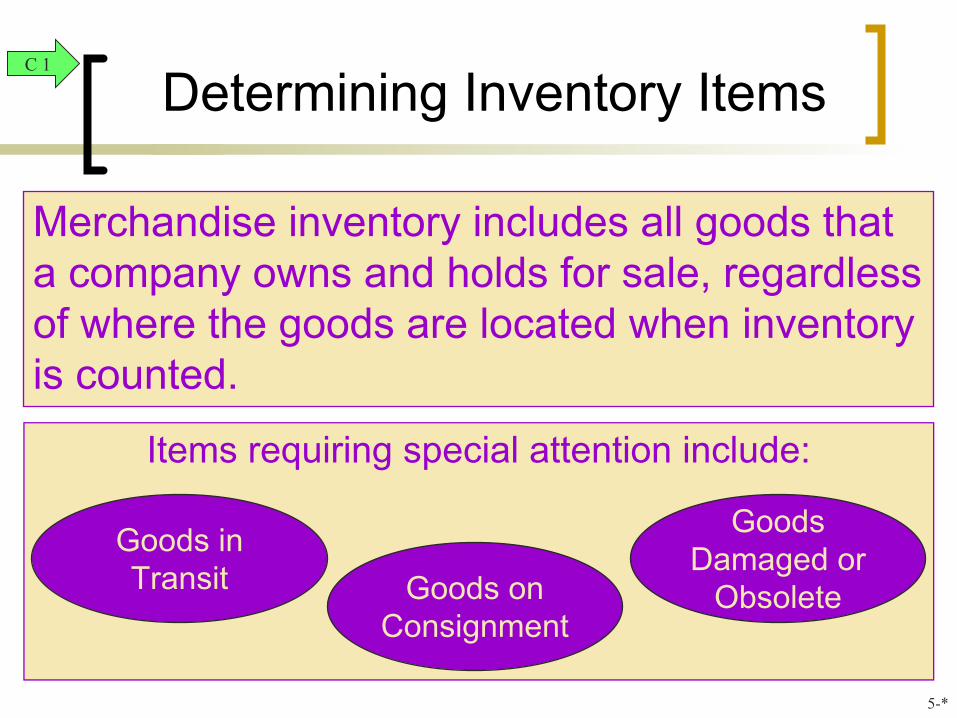
Determining Inventory Items
Merchandise inventory includes all goods that a company owns and holds for sale, regardless of where the goods are located when inventory is counted.
Items requiring special attention include:
Goods in Transit
Goods Damaged or
ObsoleteGoods on Consignment
C 1
5-*
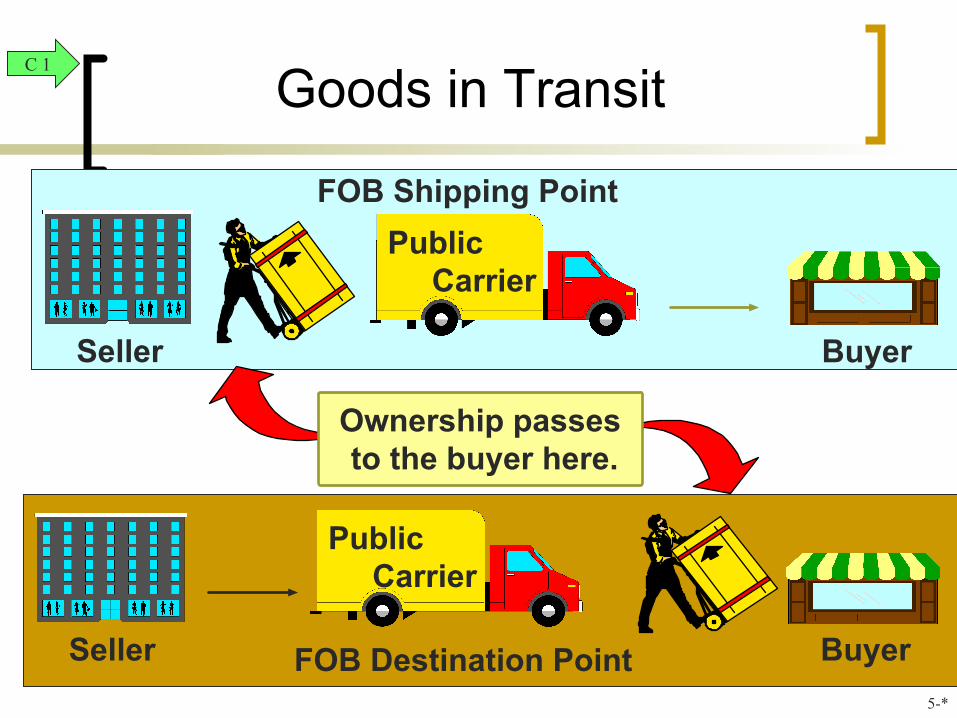
FOB Destination Point
Public Carrier
Seller Buyer
Goods in Transit
Public Carrier
Seller Buyer
FOB Shipping Point
Ownership passes to the buyer here.
C 1
5-*
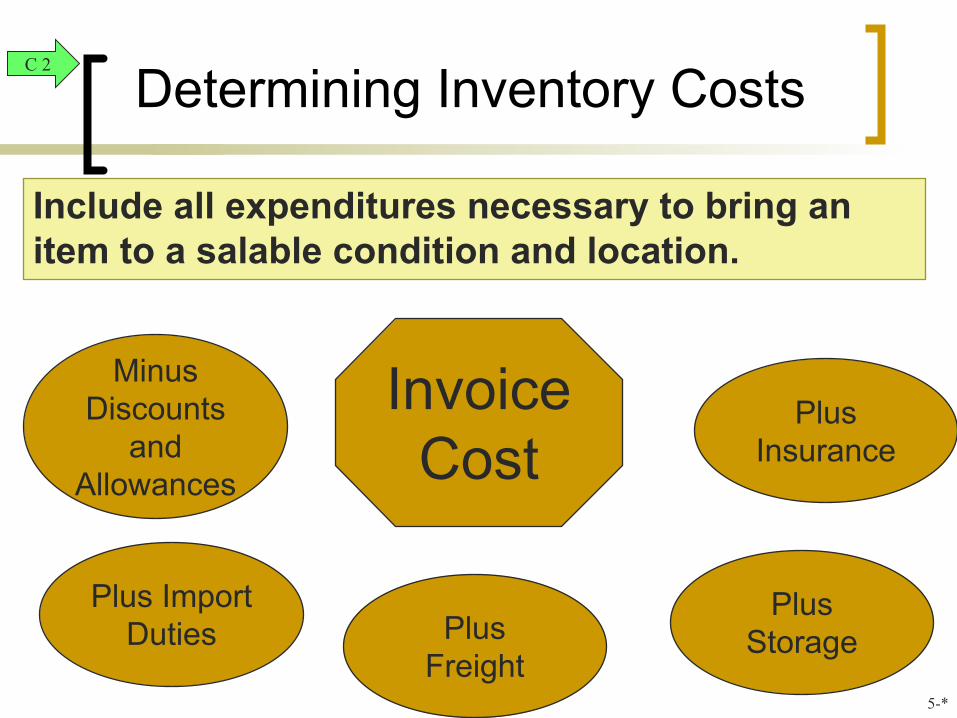
Determining Inventory Costs
Invoice Cost
Include all expenditures necessary to bring an item to a salable condition and location.
Minus Discounts
and Allowances
Plus Import Duties Plus
Freight
Plus Storage
Plus Insurance
C 2
5-*
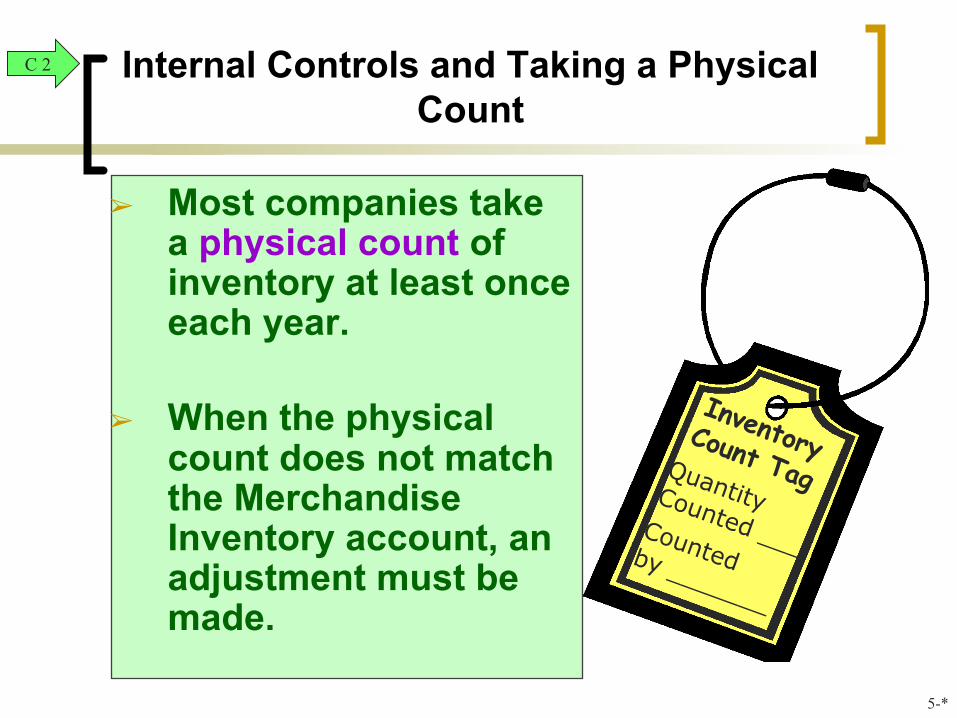
Internal Controls and Taking a Physical Count
➢ Most companies take a physical count of inventory at least once each year.
➢ When the physical count does not match the Merchandise Inventory account, an adjustment must be made.
InventoryCount Tag
Countedby _______
Quantity Counted ___
C 2
5-*
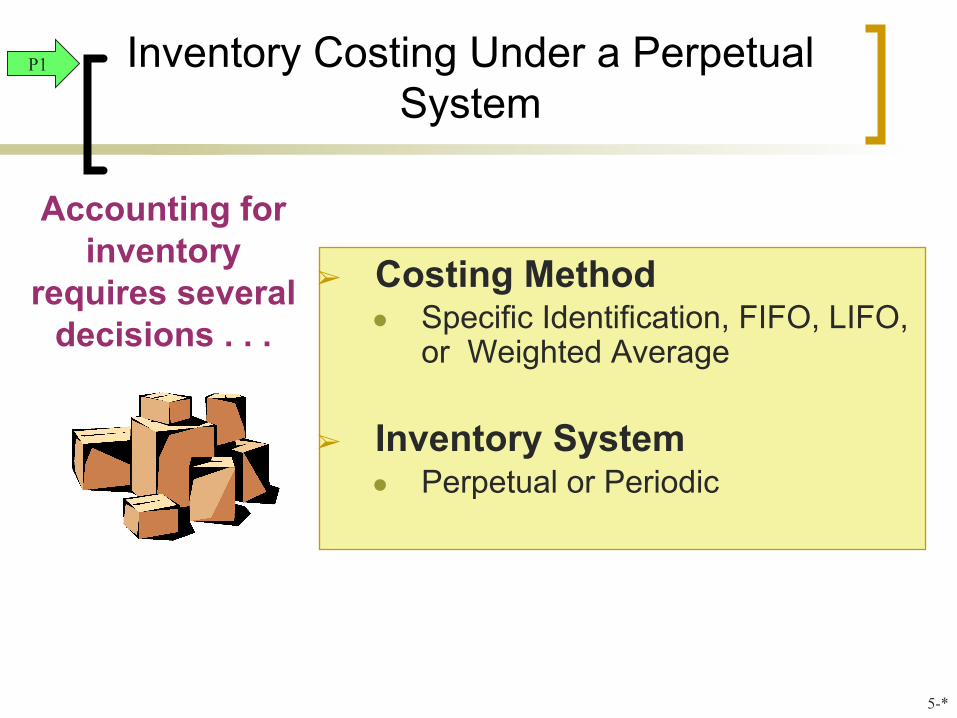
Inventory Costing Under a Perpetual System
Accounting for inventory
requires several decisions . . .
➢ Costing Method● Specific Identification, FIFO, LIFO,
or Weighted Average
➢ Inventory System● Perpetual or Periodic
P1
5-*
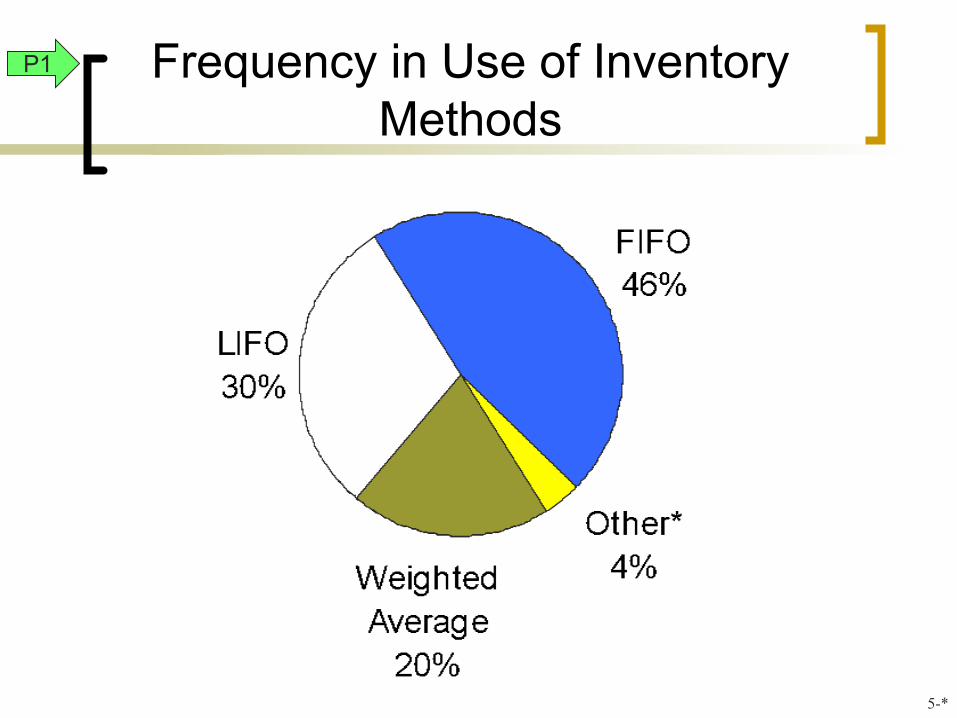
Frequency in Use of Inventory Methods
P1
5-*
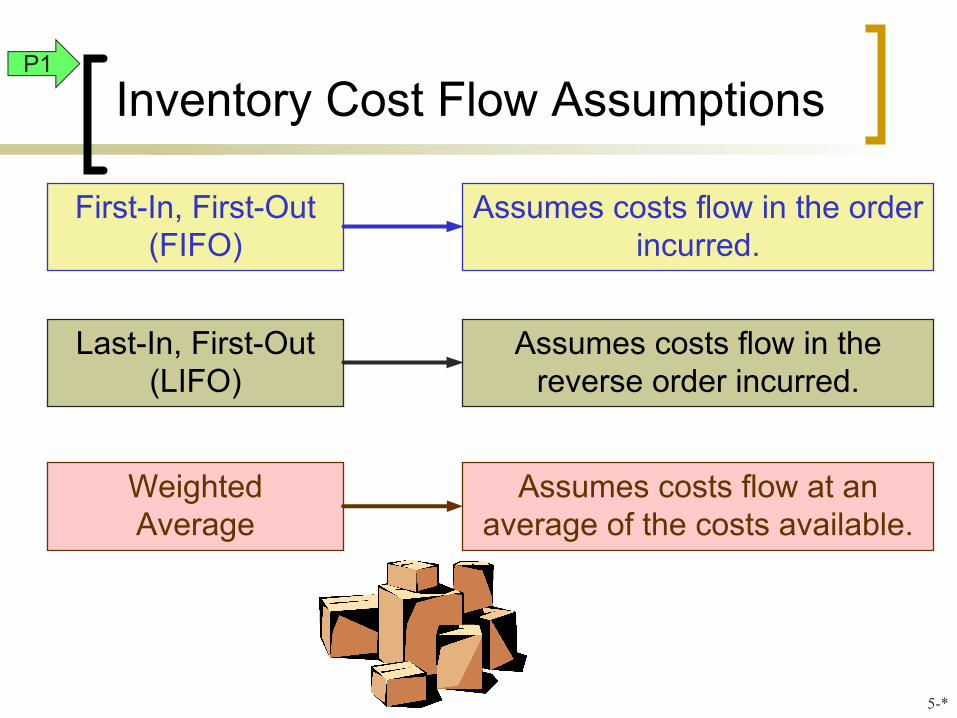
Inventory Cost Flow Assumptions
First-In, First-Out(FIFO)
Assumes costs flow in the order incurred.
Last-In, First-Out(LIFO)
Assumes costs flow in the reverse order incurred.
Weighted Average
Assumes costs flow at an average of the costs available.
P1
5-*

Inventory Costing IllustrationP1
5-*

Specific Identification
The above purchases were made in August. On August 14, a company sold 8 bikes originally costing $91 and 12 bikes originally costing $106.
P1
5-*
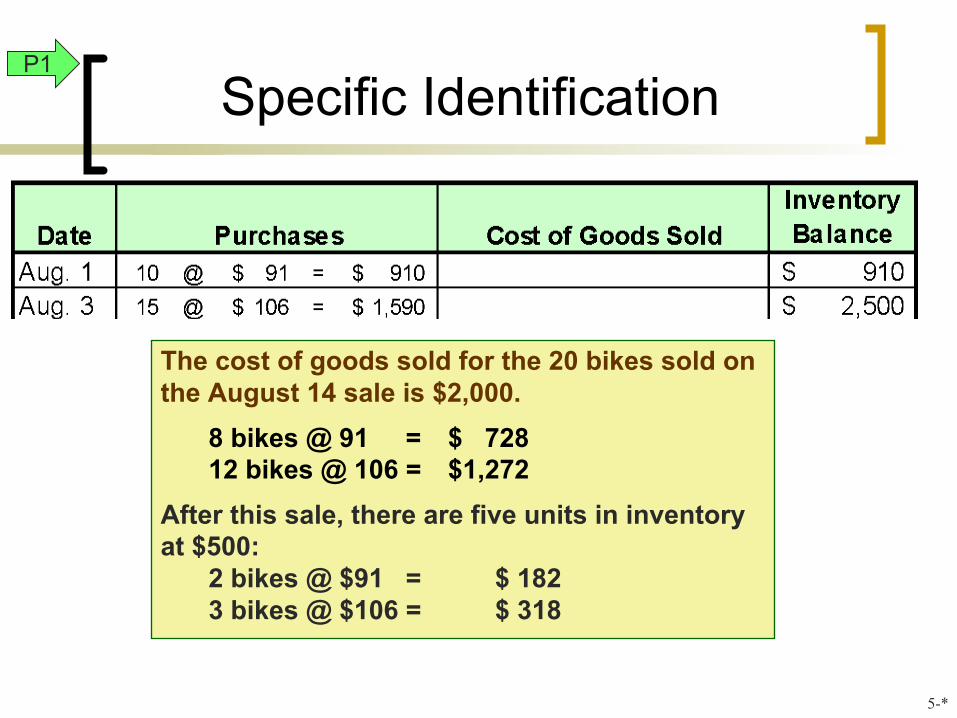
The cost of goods sold for the 20 bikes sold on the August 14 sale is $2,000.
8 bikes @ 91 = $ 72812 bikes @ 106 = $1,272
After this sale, there are five units in inventory at $500:
2 bikes @ $91 = $ 182 3 bikes @ $106 = $ 318
Specific IdentificationP1
5-*
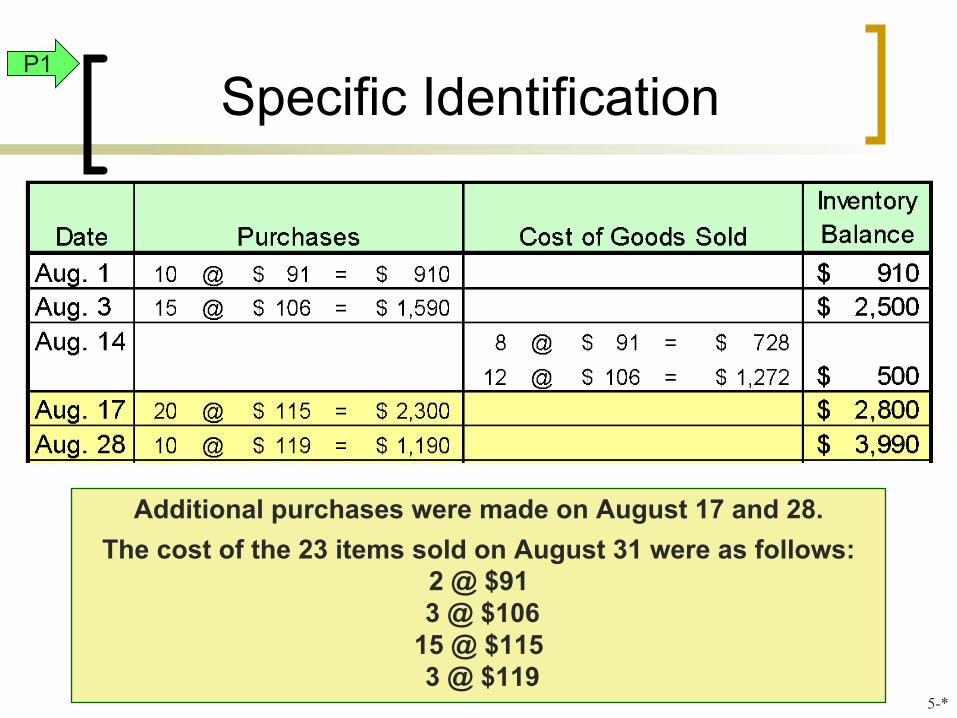
Additional purchases were made on August 17 and 28. The cost of the 23 items sold on August 31 were as follows:
2 @ $91 3 @ $10615 @ $115 3 @ $119
Specific IdentificationP1
5-*
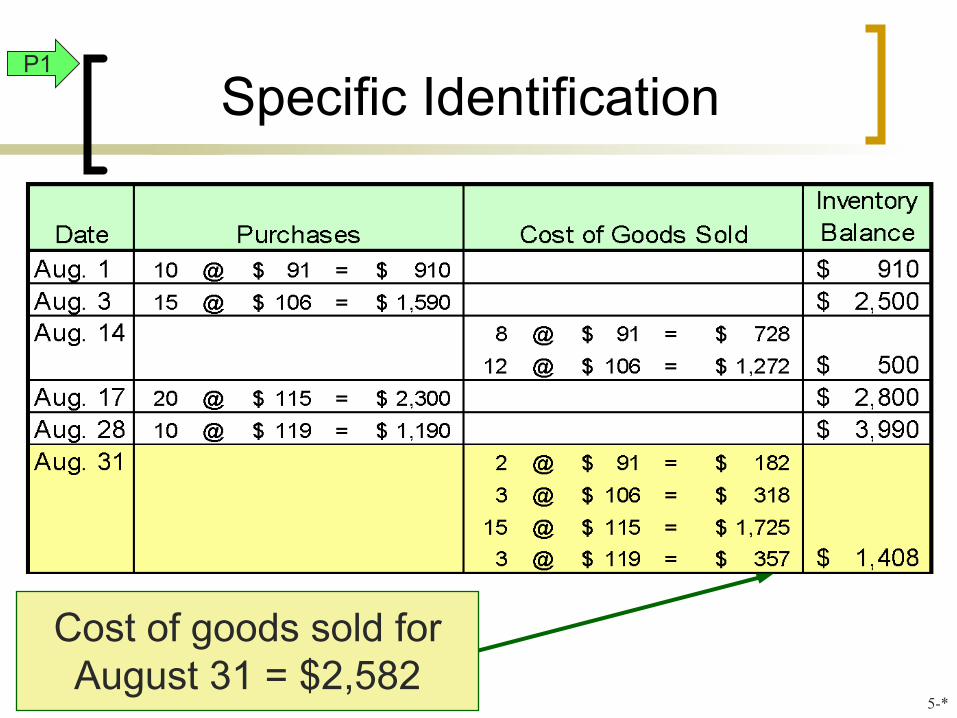
Specific Identification
Cost of goods sold for August 31 = $2,582
P1
5-*
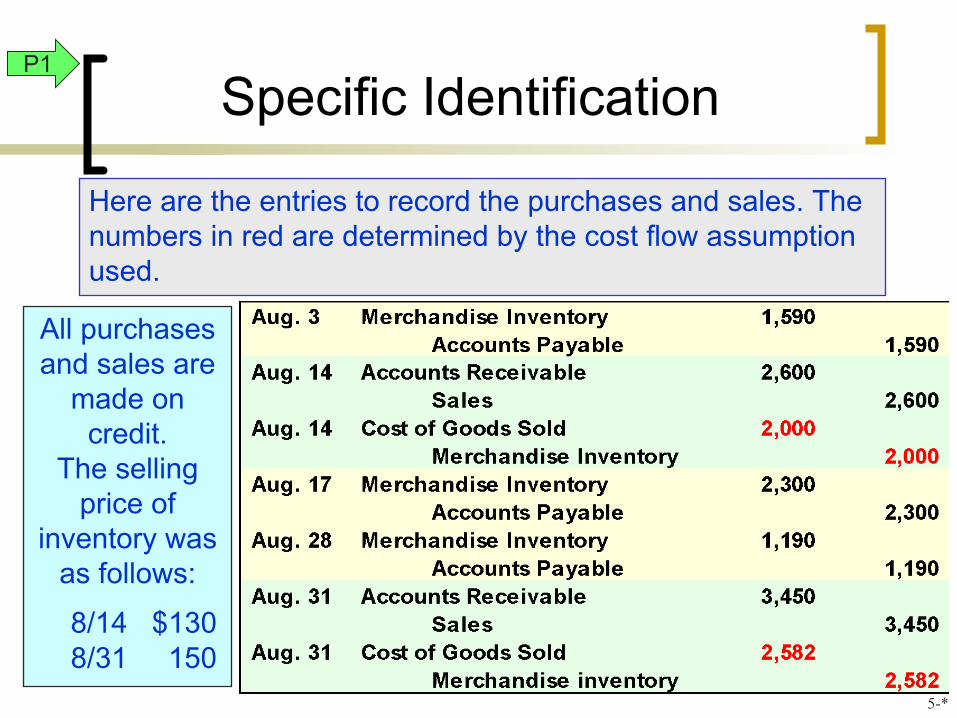
Specific Identification
Here are the entries to record the purchases and sales. The numbers in red are determined by the cost flow assumption used.
All purchases and sales are
made on credit.
The selling price of
inventory was as follows:
8/14 $130 8/31 150
P1
5-*
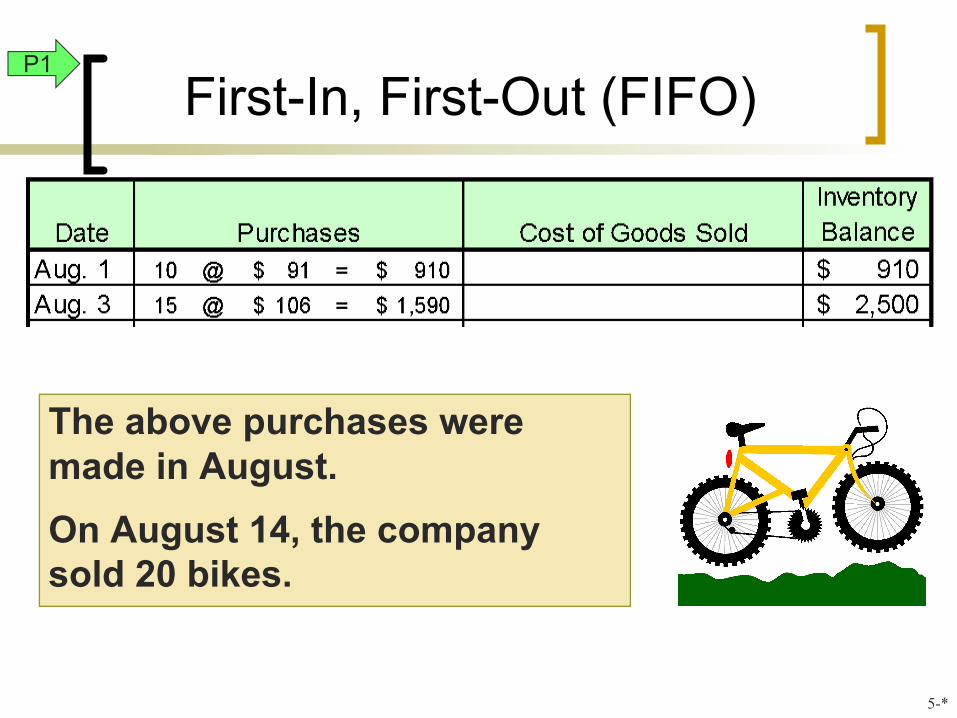
First-In, First-Out (FIFO)
The above purchases were made in August. On August 14, the company sold 20 bikes.
P1
5-*
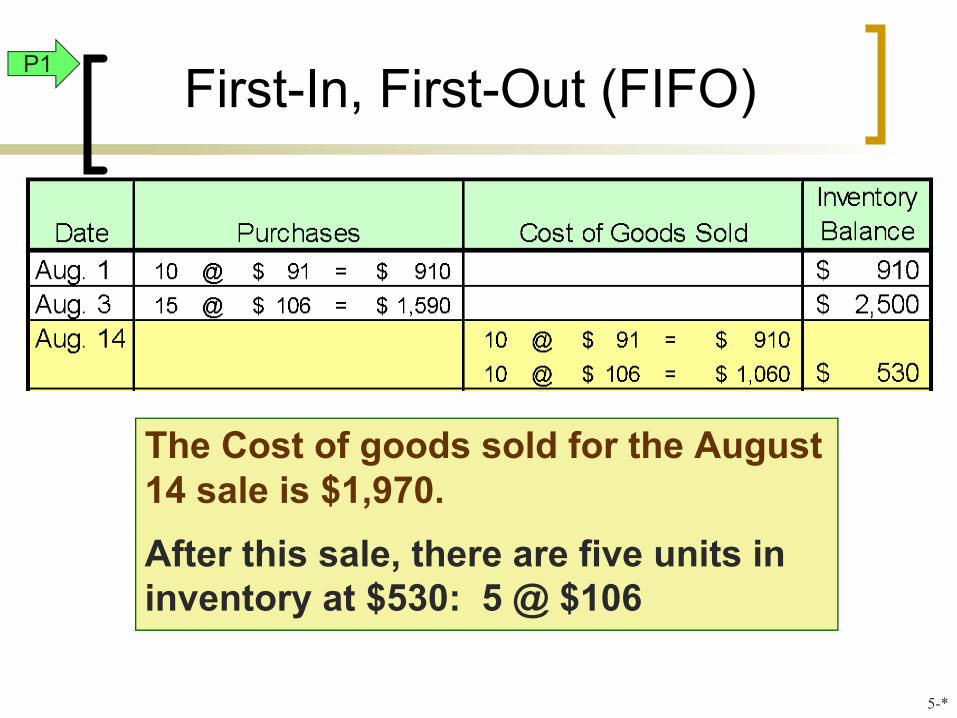
First-In, First-Out (FIFO)
The Cost of goods sold for the August 14 sale is $1,970. After this sale, there are five units in inventory at $530: 5 @ $106
P1
5-*
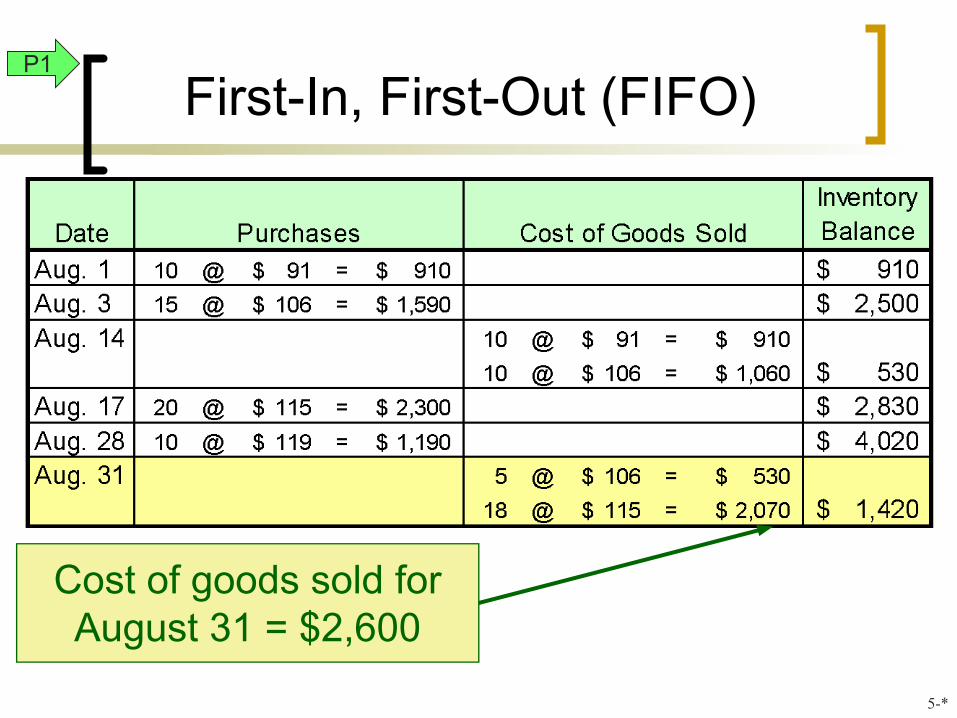
First-In, First-Out (FIFO)
Cost of goods sold for August 31 = $2,600
P1
5-*
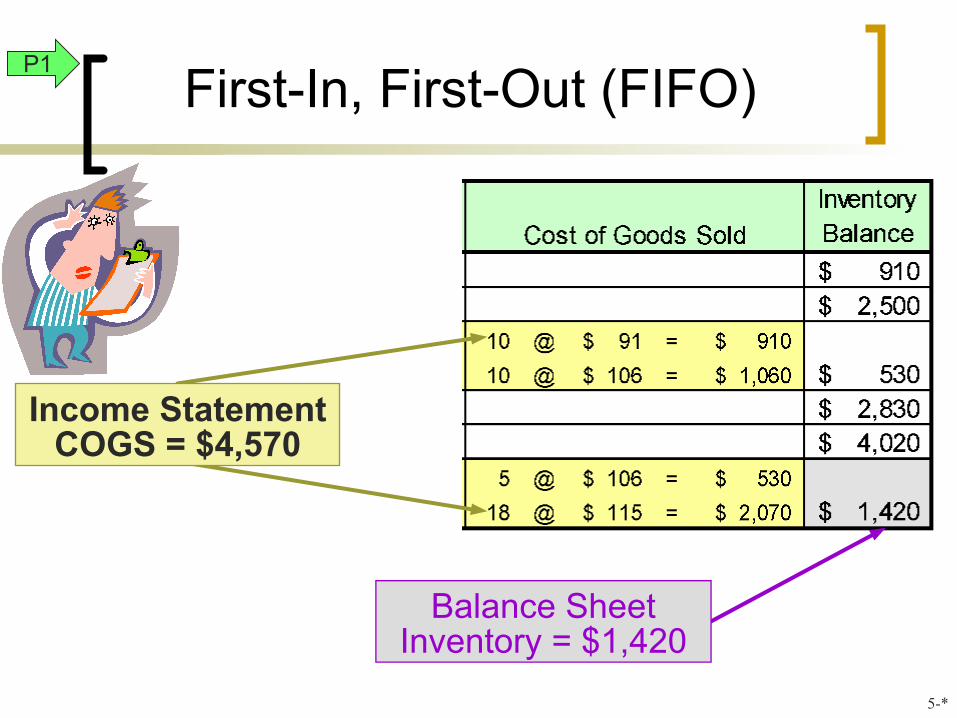
First-In, First-Out (FIFO)
Balance Sheet Inventory = $1,420
Income Statement COGS = $4,570
P1
5-*

First-In, First-Out (FIFO)
Here are the entries to record the purchases and sales entries. The numbers in red are determined by the cost flow assumption used.
All purchases and sales are
made on credit.
The selling price of
inventory was as follows:
8/14 $130 8/31 150
P1
5-*

Last-In, First-Out (LIFO)
The above purchases were made in August. On August 14, the company sold 20 bikes.
P1
5-*

Last-In, First-Out (LIFO)
The Cost of goods sold for the August 14 sale is $2,045.
After this sale, there are five units in inventory at $455:
5 @ $91
P1
5-*
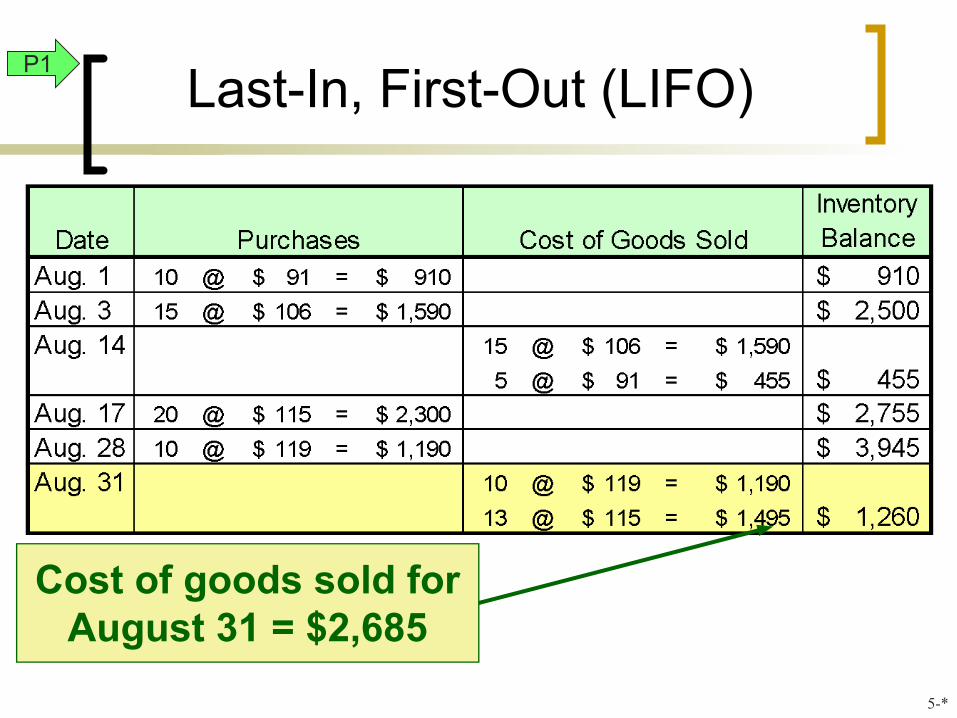
Last-In, First-Out (LIFO)
Cost of goods sold for August 31 = $2,685
P1
5-*
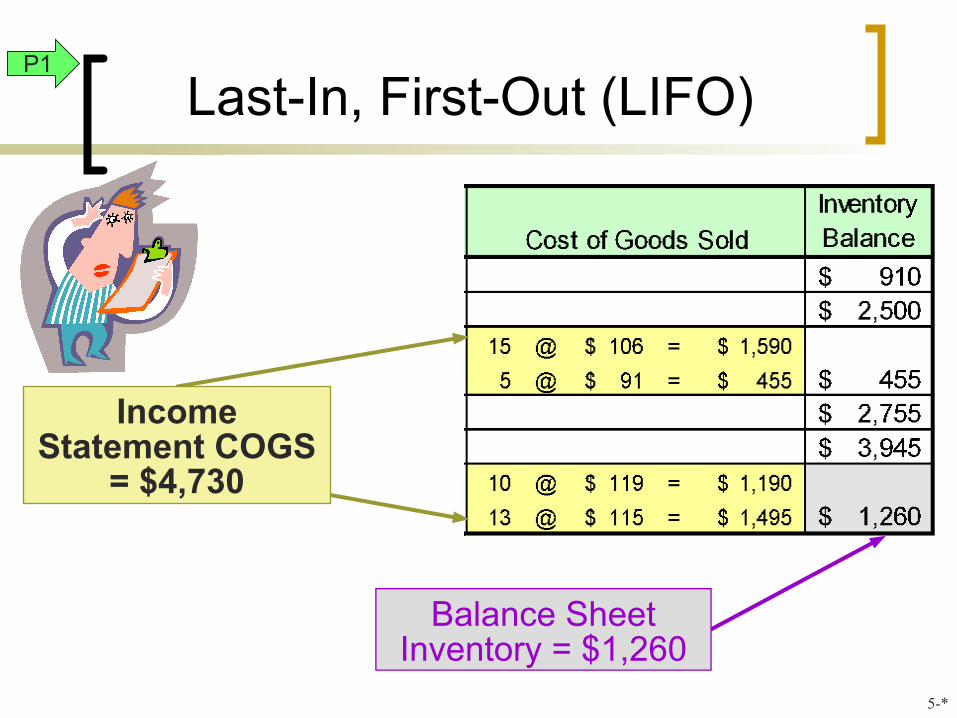
Last-In, First-Out (LIFO)
Balance Sheet Inventory = $1,260
Income Statement COGS
= $4,730
P1
5-*
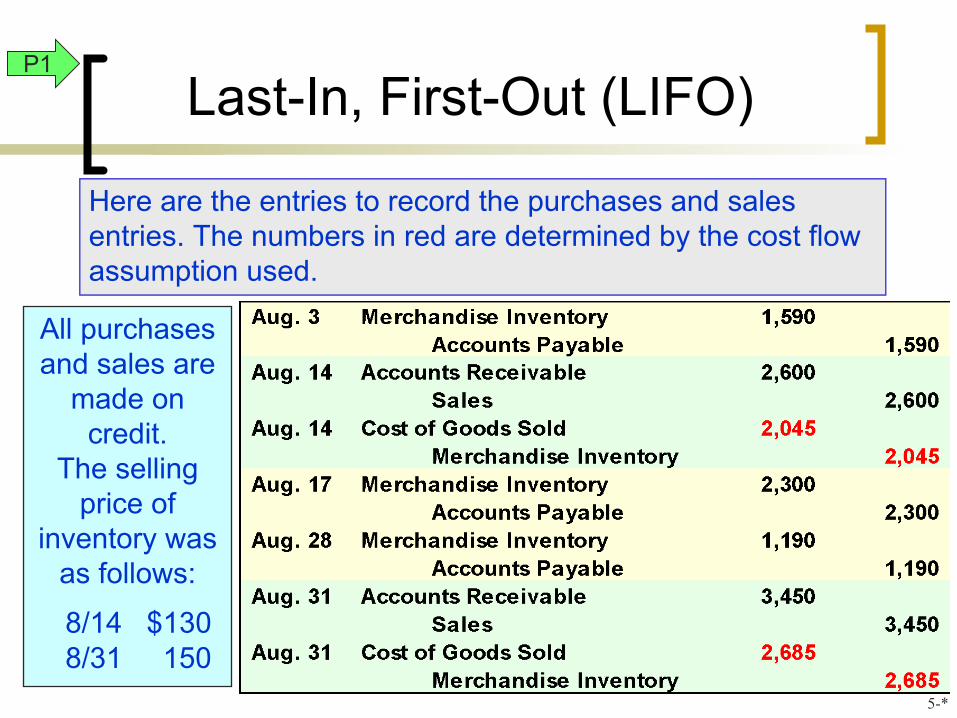
Last-In, First-Out (LIFO)
Here are the entries to record the purchases and sales entries. The numbers in red are determined by the cost flow assumption used.
All purchases and sales are
made on credit.
The selling price of
inventory was as follows:
8/14 $130 8/31 150
P1
5-*
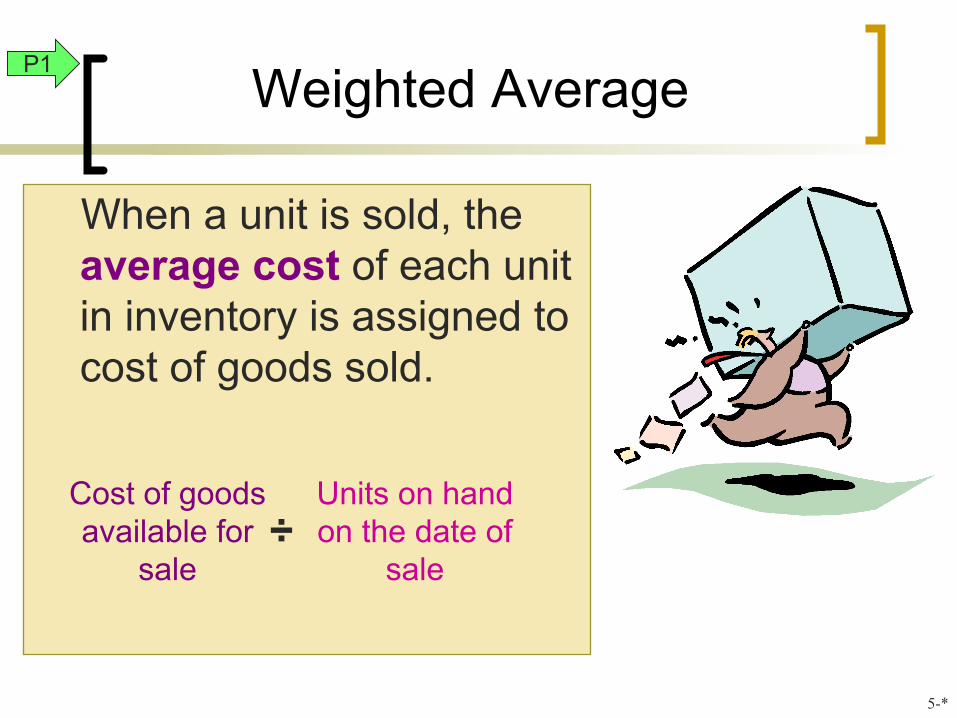
Weighted Average
When a unit is sold, the average cost of each unit in inventory is assigned to cost of goods sold.
Cost of goods available for
sale
Units on hand on the date of
sale÷
P1
5-*
÷
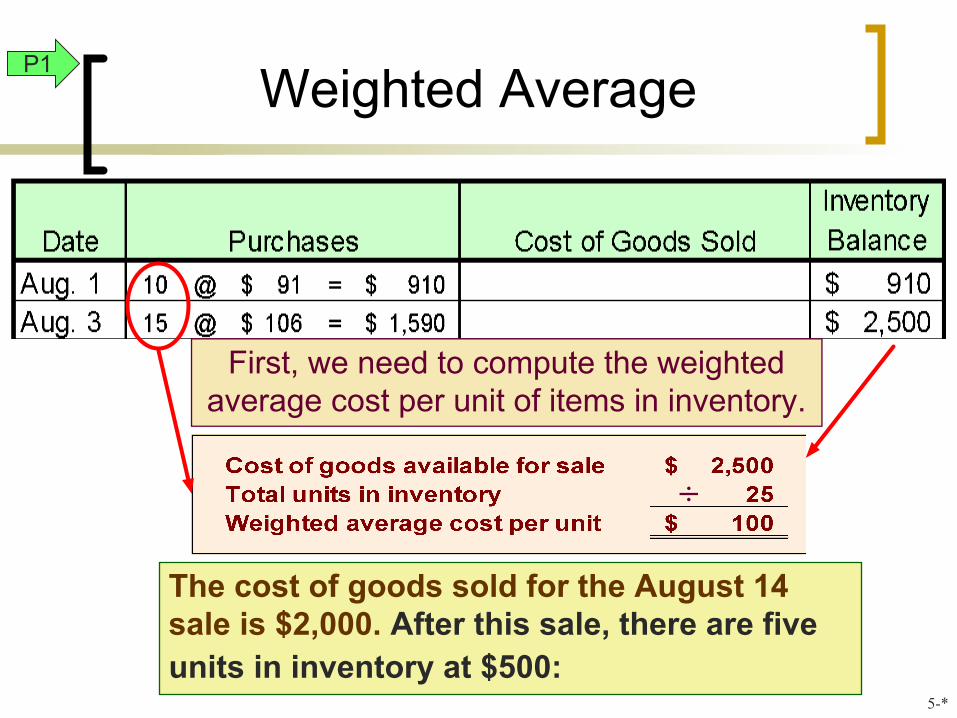
Weighted Average
First, we need to compute the weighted average cost per unit of items in inventory.
P1
The cost of goods sold for the August 14 sale is $2,000. After this sale, there are five units in inventory at $500:
5-*
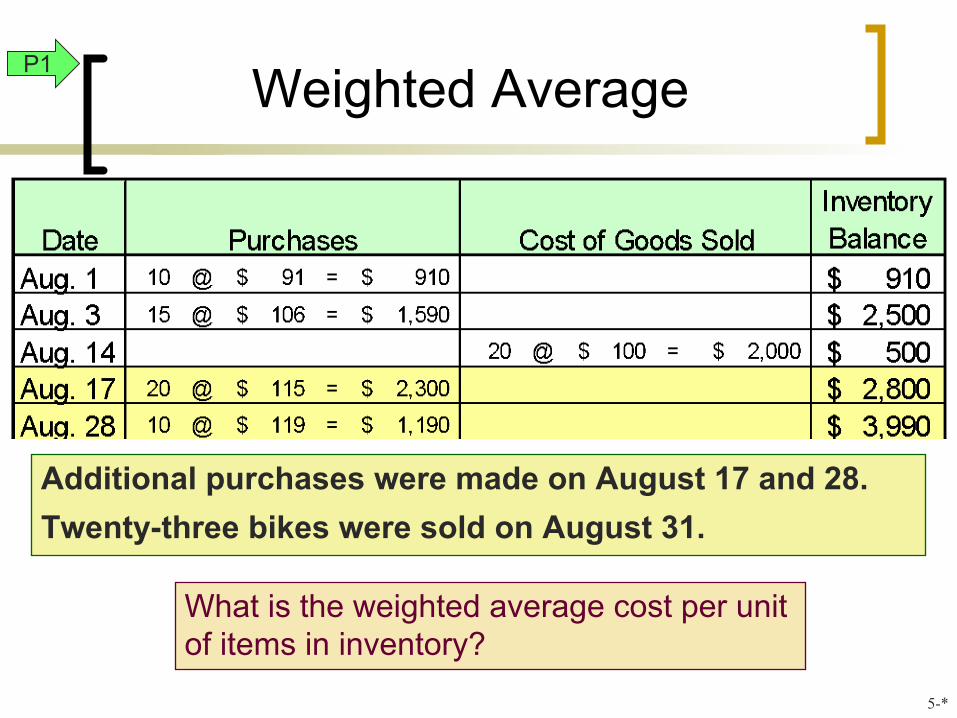
Weighted Average
Additional purchases were made on August 17 and 28. Twenty-three bikes were sold on August 31.
What is the weighted average cost per unit of items in inventory?
P1
5-*

Weighted Average
÷
P1
5-*
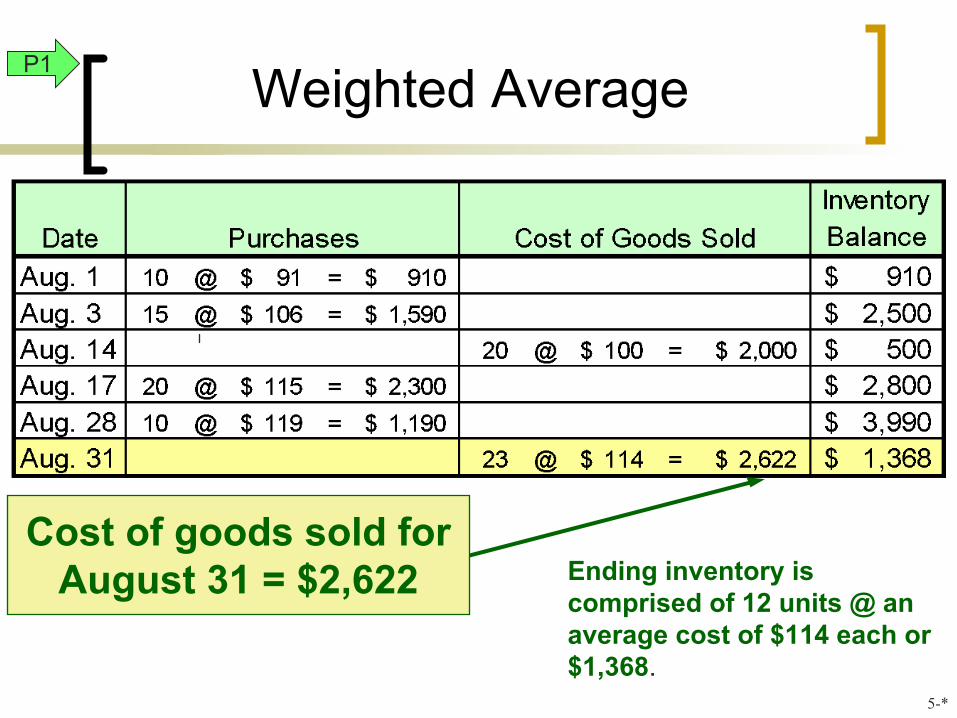
Weighted Average
Cost of goods sold for August 31 = $2,622
P1
Ending inventory is comprised of 12 units @ an average cost of $114 each or $1,368.
5-*
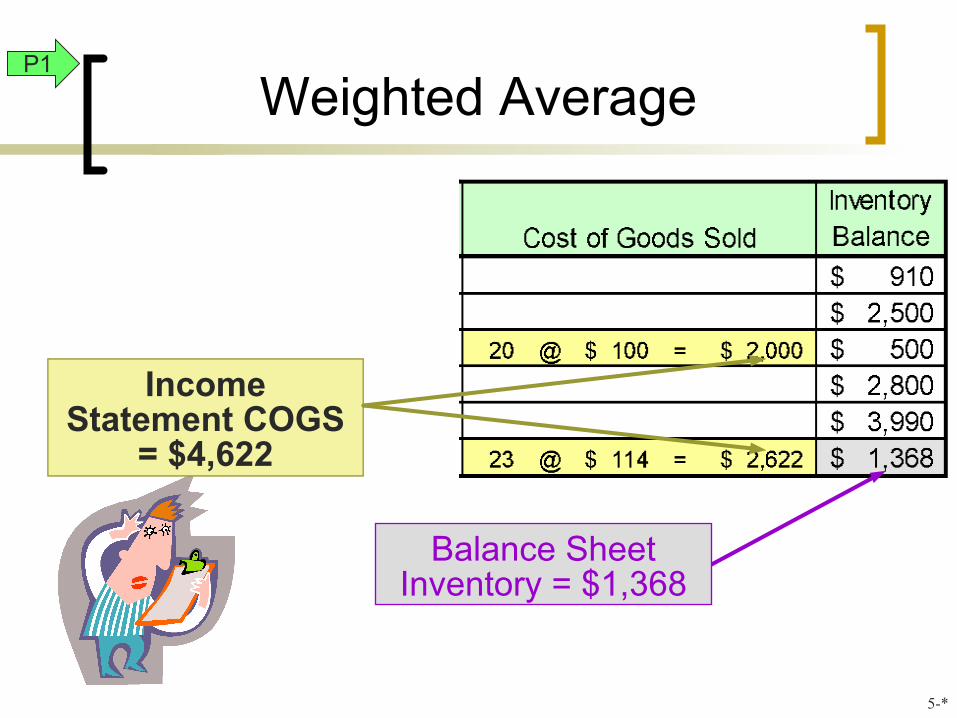
Weighted Average
Balance Sheet Inventory = $1,368
Income Statement COGS
= $4,622
P1
5-*
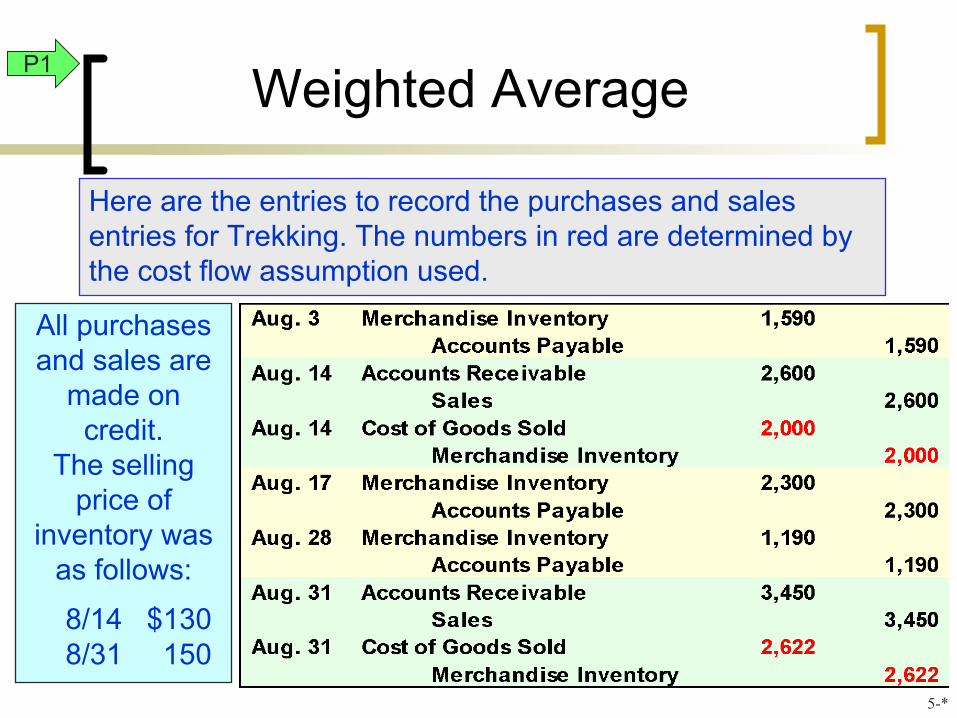
Weighted Average
Here are the entries to record the purchases and sales entries for Trekking. The numbers in red are determined by the cost flow assumption used.
All purchases and sales are
made on credit.
The selling price of
inventory was as follows:
8/14 $130 8/31 150
P1
5-*
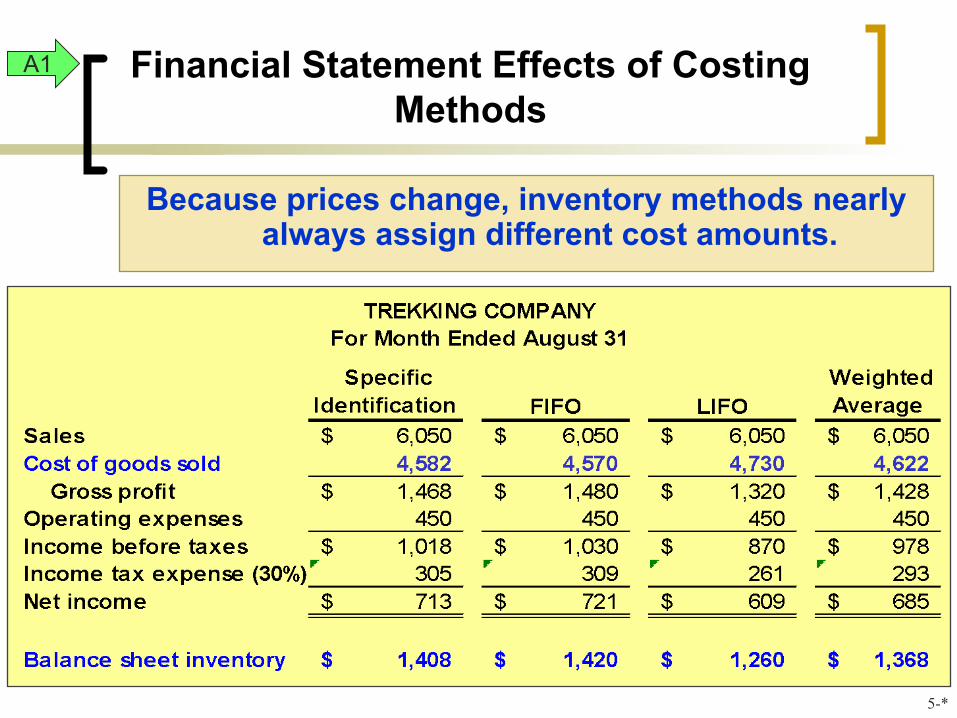
Financial Statement Effects of Costing Methods
Because prices change, inventory methods nearly always assign different cost amounts.
A1
5-*
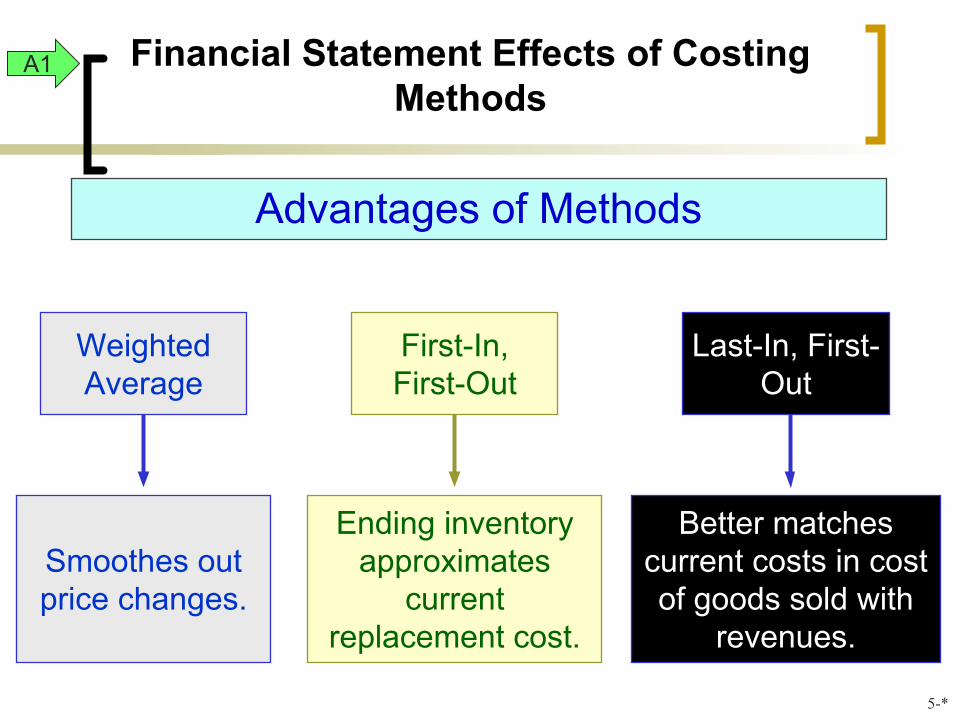
Financial Statement Effects of Costing Methods
Advantages of Methods
Smoothes out price changes.
Better matches current costs in cost of goods sold with
revenues.
Ending inventory approximates
current replacement cost.
First-In, First-Out
Weighted Average
Last-In, First-Out
A1
5-*
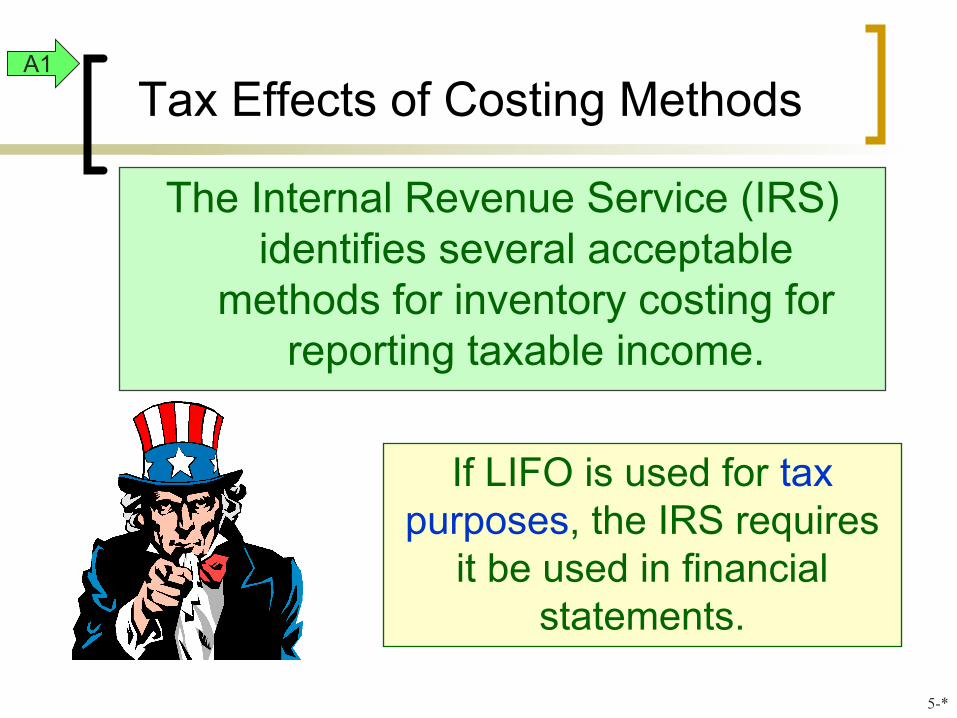
Tax Effects of Costing Methods
The Internal Revenue Service (IRS) identifies several acceptable
methods for inventory costing for reporting taxable income.
If LIFO is used for tax purposes, the IRS requires
it be used in financial statements.
A1
5-*

Consistency in Using Costing Methods
The consistency concept requires a company to use the same accounting methods period after period so that financial statements are comparable across periods.
A1
5-*
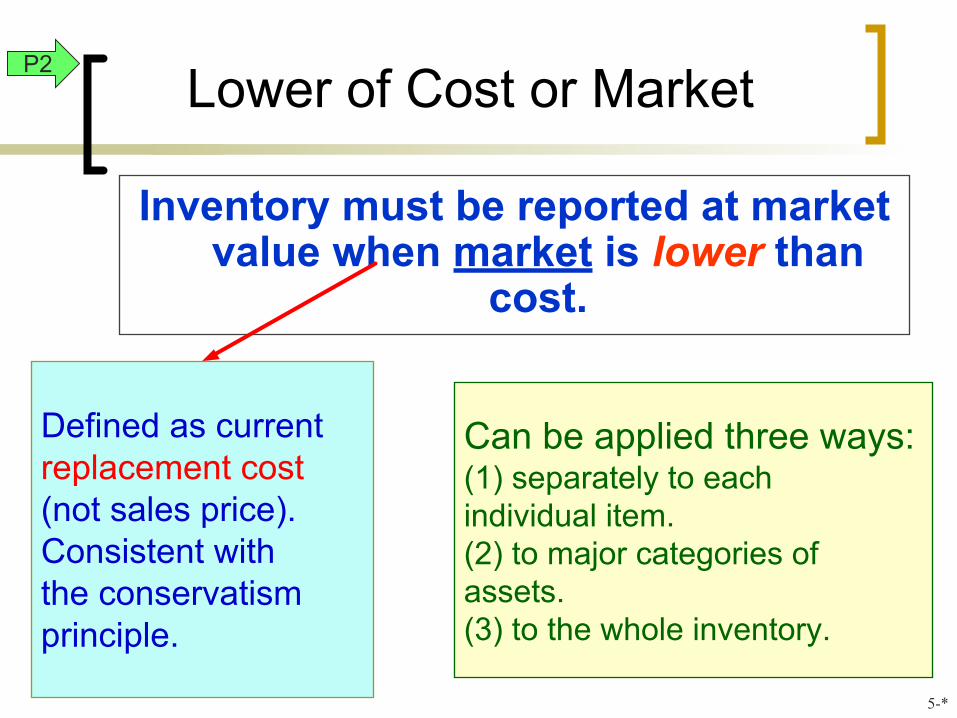
Lower of Cost or Market
Inventory must be reported at market value when market is lower than
cost.
Can be applied three ways:(1) separately to each individual item.(2) to major categories of assets.(3) to the whole inventory.
Defined as current replacement cost (not sales price).Consistent withthe conservatismprinciple.
P2
5-*
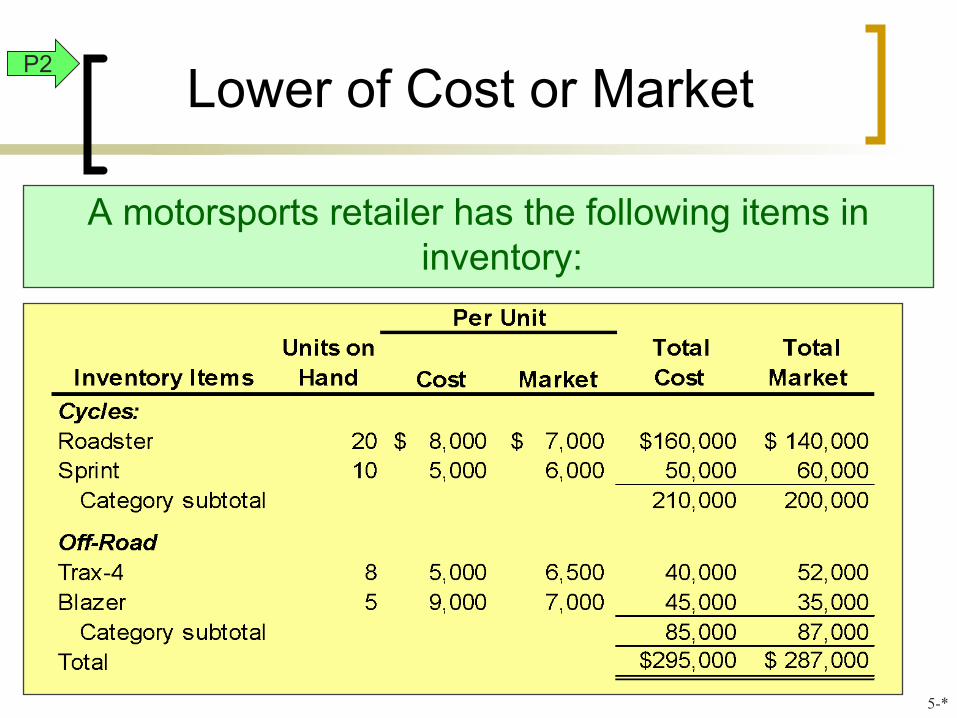
Lower of Cost or Market
A motorsports retailer has the following items in inventory:
P2
5-*

Lower of Cost or Market
Here is how to compute lower of cost or market for individual inventory items.
P2
5-*

Financial Statement Effects of Inventory Errors
Income Statement Effects
A2
5-*
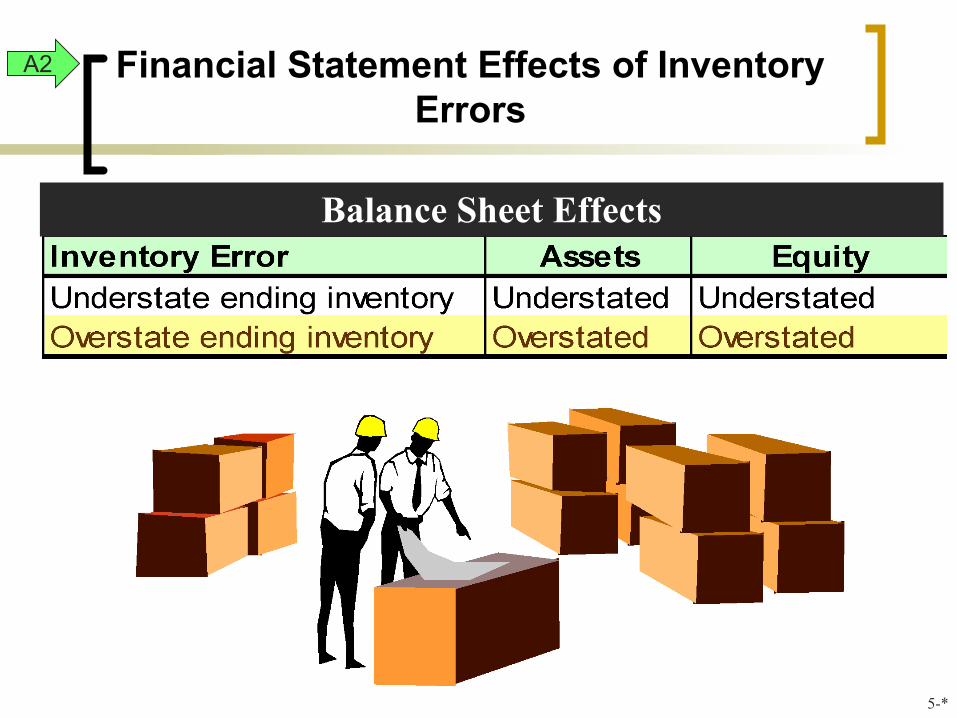
Financial Statement Effects of Inventory Errors
Balance Sheet Effects
A2
5-*
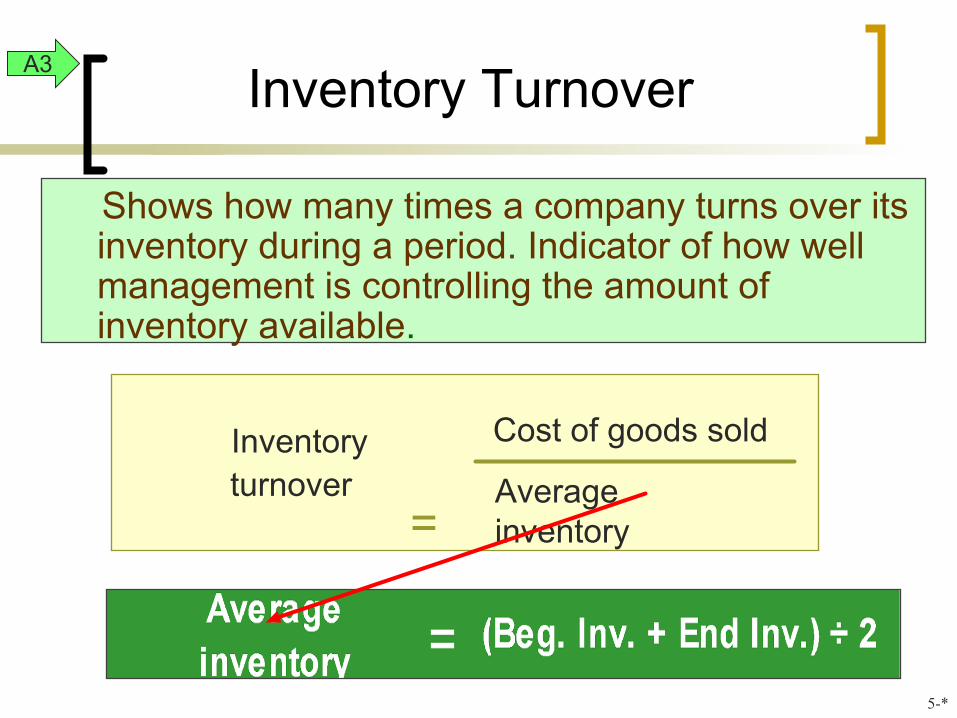
Inventory Turnover
Shows how many times a company turns over its inventory during a period. Indicator of how well management is controlling the amount of inventory available.
Inventory turnover
=
Cost of goods sold
Average inventory
A3
5-*

Days’ Sales in Inventory
Reveals how much inventory is available in terms of the number of days’ sales.
Days' sales in inventory
=
Ending inventory
Cost of goods sold ×
365
A3
5-*
End of Chapter 05
5-*