Embed Size (px)
Citation preview

Inflation and Forest Investment Analysis
What’s real?

What’s Inflation
• An increase in prices that makes a “market basket” of goods and services more expensive over time.
• Basket costs $1,400 in 2003 and $1,550 in 2004, a one year period.– Increase in cost is $150– % increase, the annual rate of inflation, is
• $150/$1,400 = 10.7%, or• $1,550/$1,400 – 1 =1.107 – 1 = 10.7%

Causes of Inflation
• Demand-pull inflation– Too many people chasing too few goods and services
• Cost-push inflation– Costs of factors of production rise, pushing up prices
of goods and services
• Monetary inflation– Government “prints” more money, leading to demand
pull inflation

Terminology
• Price with inflation included– Nominal– Current dollar– Inflated– Actual
• Price with inflation not included– Real– Constant dollar– Deflated– Relative

Nomenclature
• f = annual inflation rate
• r = real interest rate
• i = inflated or nominal interest rate i = (r + f + rf)
• In = inflated or nominal dollar value in year n
• Vn = future value in year n, in constant dollars of year 0

Producer Price Index for Finished Goods
0
20
40
60
80
100
120
140
160
Year
1987
bas
e ye
ar
32.5
143
1957
2003

Average Annual Rate of Inflation
• Rate of inflation between two points in time more than one year apart.
• Calculate as, f = (Vn/V0)1/n -1
= (143/32.5)1/46 – 1
= 4.40.02174 – 1
= 1.0327 – 1
= 3.27% per annum

Converting the value of an asset from its nominal to its real value
• Vn = In/(1+f)n • Example – Timberland is purchased for
$500 per acre in 1957. In 2004 it’s sold for $3,500 per acre. If average annual inflation over this period is 3.27%, what is the sale price of the land in terms of 1957 values?V1957 = $3,500/1.032747 = $796
• What is the real rate of return on the land?r = ($796/$500)1/46 – 1 = 0.01

Table 8. Weighted average actual price, price index, and deflated price for an average and quality stand of timber in Indiana, 1957 to 2003. Average Stand Quality Stand
Year
Producer Price Index
Nominal Price
Index Number
Real
Price 1
Nominal Price
Index Number
Real
Price 1 (1) (2) (3) (4) (5) (6) (7) (8)
($/MBF) ($/MBF) ($/MBF) ($/MBF) 1957 32.5 55.6 100.0 171.1 66.6 100.0 204.9 1958 33.2 53.7 96.6 161.8 64.0 96.1 192.8 1959 33.1 54.8 98.5 165.5 67.5 101.4 204.0 1960 33.4 57.5 103.5 172.3 68.7 103.2 205.7 1961 33.4 58.9 105.9 176.3 70.0 105.1 209.5 1962 33.5 59.6 107.3 178.1 72.3 108.6 215.8 1963 33.4 59.3 106.7 177.6 74.5 111.9 223.1 1964 33.5 60.1 108.1 179.5 74.4 111.8 222.2 1965 34.1 63.6 114.3 186.4 78.5 118.0 230.3 1966 35.2 68.8 123.7 195.4 86.0 129.2 244.3 1967 35.6 70.1 126.0 196.8 87.2 131.0 245.0 1968 36.6 74.7 134.2 204.0 92.7 139.3 253.4 1969 38.0 77.7 139.7 204.5 98.6 148.2 259.6 1970 39.3 83.1 149.4 211.5 103.9 156.0 264.3 1971 40.5 85.9 154.4 212.0 107.4 161.3 265.2 1972 41.8 90.2 162.2 215.8 112.2 168.5 268.4 1973 45.6 112.6 202.5 247.0 139.0 208.8 304.9 1974 52.6 135.3 243.3 257.3 170.2 255.7 323.7 1975 58.2 125.1 225.0 215.0 166.3 249.8 285.8 1976 60.8 133.6 240.2 219.7 172.7 259.4 284.1 1977 64.7 143.6 258.1 221.9 188.0 282.4 290.6 1978 69.8 181.7 326.1 260.3 234.9 352.9 336.6 1979 77.6 201.5 362.3 259.6 260.7 391.6 336.0 1980 88.0 207.8 373.6 236.1 309.3 464.5 351.5
1 Actual price deflated by Producer Price Index for Finished Goods, U.S. Dept. Commerce, 1982 base year.

Table 8. Weighted average actual price, price index, and deflated price for an average and quality stand of timber in Indiana, 1957 to 2003. Average Stand Quality Stand
Year
Producer Price Index
Nominal Price
Index Number
Real
Price 1
Nominal Price
Index Number
Real
Price 1 (1) (2) (3) (4) (5) (6) (7) (8)
($/MBF) ($/MBF) ($/MBF) ($/MBF) 1981 96.1 206.7 371.7 215.1 284.9 427.8 296.4 1982 100.0 196.8 353.8 196.8 277.3 416.5 277.3 1983 101.6 207.6 373.3 204.3 294.4 442.2 289.8 1984 103.7 235.8 424.0 227.4 322.7 484.6 311.2 1985 104.7 210.5 378.5 201.0 274.0 411.5 261.7 1986 103.2 223.6 402.0 216.6 312.2 468.9 302.5 1987 105.4 257.3 462.7 244.2 334.6 502.6 317.5 1988 108.0 262.1 471.3 242.7 345.9 519.6 320.3 1989 113.6 285.9 514.0 251.6 404.9 608.1 356.4 1990 119.2 288.3 518.3 241.8 397.9 597.6 333.8 1991 121.7 268.1 482.1 220.3 362.9 545.1 298.2 1992 123.2 293.4 527.6 238.2 417.6 627.1 338.9 1993 124.7 355.2 638.8 284.9 491.2 737.8 393.9 1994 125.5 364.8 655.9 290.6 507.4 762.1 404.3 1995 127.9 354.0 636.4 276.7 451.6 678.3 353.1 1996 131.3 337.7 607.1 257.2 495.4 744.0 377.3 1997 131.8 357.5 642.7 271.2 448.3 673.3 340.2 1998 130.7 391.1 703.3 299.3 501.7 753.5 383.9 1999 133.0 389.2 699.8 292.6 526.3 790.5 395.7 2000 138.0 426.5 766.9 309.1 617.6 927.5 447.5 2001 140.7 389.7 700.8 277.0 538.5 808.8 382.7 2002 138.9 410.7 738.4 295.7 561.2 842.9 404.0 2003 142.5 433.7 779.7 304.3 567.9 852.9 398.5
1 Actual price deflated by Producer Price Index for Finished Goods, U.S. Dept. Commerce, 1982 base year.

Figure 2. Average stand of timber, nominal, deflated, and trend line price series, 1957 to 2003.
0
50
100
150
200
250
300
350
400
450
500
57 59 61 63 65 67 69 71 73 75 77 79 81 83 85 87 89 91 93 95 97 99 01 03
Year
$ pe
r MBF
Trend line 1.20% per year
Nominal Price
Real price, 1982 $’s

Figure 3. Quality stand of timber, nominal, deflated, and trend line price series 1957 to 2003.
0.0
100.0
200.0
300.0
400.0
500.0
600.0
700.057 60 63 66 69 72 75 78 81 84 87 90 93 96 99 02
Year
$ p
er M
BF
Real price, 1982 $’s
Nominal Price
Trend line 1.52% per year

Nominal and Real ROR’s
Loan $100 now to be returned in one year. You want a 5% real rate of return, r, i.e. 5% more than inflation. If inflation will be 4% over the year you need $104 back just to keep same purchasing power of $100.
$100 (1+f)n = 100 (1.04)1 = $104
To get 5% return need to multiply $104 by (1+r)n,
$104 (1.05)1 = $109.20

Nominal and Real ROR’s
Combining the steps,
In = V0 (1+r)n (1+f)n
= V0 (1+ r + f + rf)n = V0 (1+i)n,therefore,
i = r + f + rf = 0.05 + 0.04 + 0.05*0.04 = 0.09 + 0.002 = 0.092,
or, i = (1 + r) (1 + f) -1

Nominal and Real ROR’s
If you know the nominal rate of return and inflation rate, solve for the real rate of return,
(1 + r) (1 + f) = 1 + i
1 + r = (1 + i) / (1 + f)
r = [(1 + i) / (1 + f)] - 1

Calculating Inflation Adjusted PV’s
PV = In/(1+i)n
= [Vn (1+f)n] / (1+r+f+rf)n
= [Vn(1+f)n]/[(1+r)n(1+f)n]
= [Vn(1+f)n]/[(1+r)n(1+f)(1+f)nn]
= Vn/(1+r)n

Calculating Inflation Adjusted PV’s
• Guidelines for computing net present value (NPV)– If future cash flows are in constant dollars
compute NPV with a real interest rate, r– If future cash flows are in current dollars
compute NPV with a nominal interest rate. Use same inflation rate in the cash flows and nominal interest rate

Warning
• Never mix real dollars and nominal dollars in the same equation

Recommendation
• It’s usually easier to work in real terms, that is adjust all cash flows to real values, and discount with real interest rate, r
• However, have to use nominal values for after-tax calculations,– Tax laws generally don’t adjust rates for
inflation, and never adjust basis of assets for inflation

Income tax on gain from disposal of assets
C = basis of asset
In = nominal value in year n
Ti = tax rate (5% or 15%)
Tax due = Ti (In – C)

Example
George buys timberland in 1975 for $120,000 of which $80,000 is attributable to merchantable timber. In 1980 he sells 20% of the merchant-able timber for $50,000. What is the tax on the sale?C = 0.2 * $80,000 = $16,000
I80 = $50,000
Ti = 15%Tax due = 0.15 ($50,000 - $16,000)
= 0.15 * $34,000 = $5,100
After-tax gain = $50,000 - $5,100 = $44,900
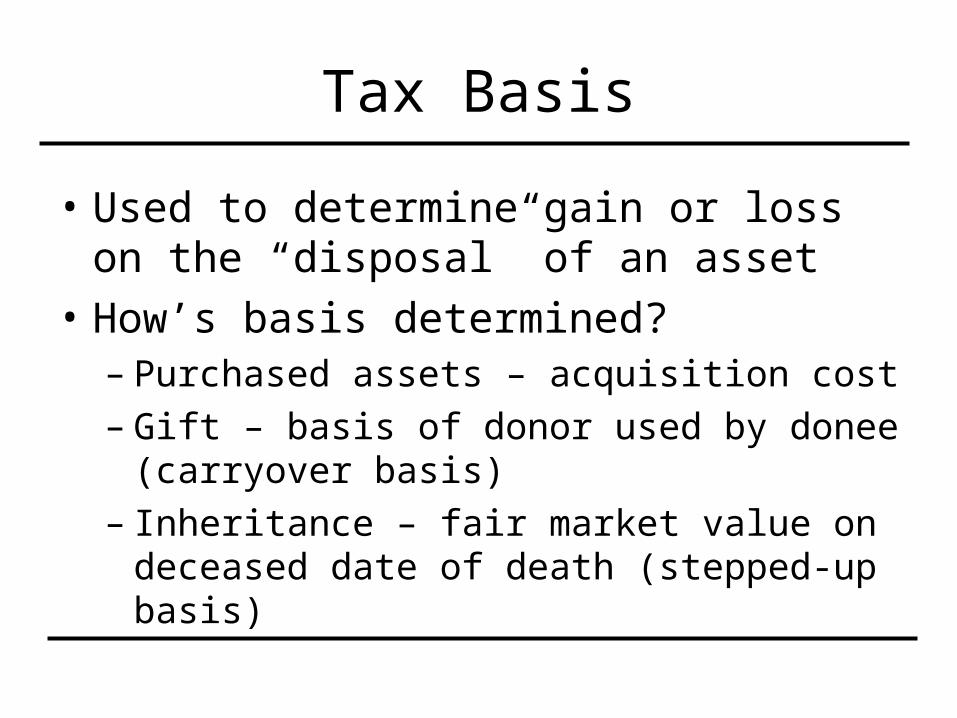
Tax Basis
• Used to determine gain or loss on the “disposal” of an asset
• How’s basis determined?– Purchased assets – acquisition cost– Gift – basis of donor used by donee
(carryover basis)– Inheritance – fair market value on deceased
date of death (stepped-up basis)
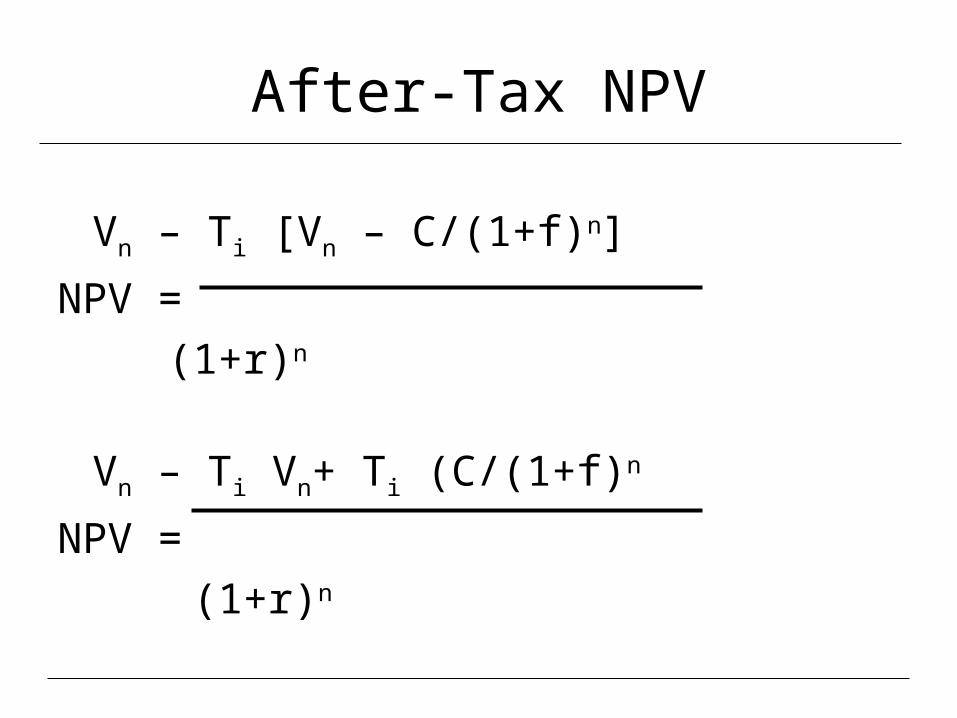
After-Tax NPV
Vn – Ti [Vn – C/(1+f)n]
NPV =
(1+r)n
Vn – Ti Vn+ Ti (C/(1+f)n
NPV =
(1+r)n

After-Tax NPV, Example
Buy an asset for $2,000 and sell it 8 years for $8,000. Annual inflation rate is 9.05%.
f = 0.0905, r = 0.05
Ti = 0.15
I8 = $4,000/1.09058 = $8,000
$4,000 – 0.15[4,000 – 2,000/(1.09058)]
NPV =
(1.05)8
= $2,402.78

$2,000
$4,000
$6,000
$8,000
Basis = $2,000 nominal
Vn = $4,000
In = $8,000
Years 8
Capital gain = $6,000
Real gain = $2,000
Nominal and real gain
4

After-Tax NPV With No Inflation
$4,000 – 0.15 ($4,000 – $2,000)
NPV =
(1.05)8
= $2,504.31
Decrease in after-tax NPV due to inflation is,
$2,504.31 - $2,402.78 = $101.52

Affect of Inflation on Series Payment Formulas – annual and periodic
• Basic formulas assume fixed payments
• If payments are fixed in nominal terms must use nominal interest rate, i, in series payment formulas.
• If nominal payments rise at exactly the inflation rate, they are fixed in real terms and must use real interest rate in formulas.