Embed Size (px)
Citation preview

From DEPARTMENT OF CELL AND MOLECULAR BIOLOGY Karolinska Institutet, Stockholm, Sweden
INFERRING TRANSCRIPTIONAL REGULATION ON THE PROMOTER LEVEL AND ITS APPLICATIONS TO
DISEASES
Morana Vitezic
Stockholm 2013

2013
Gårdsvägen 4, 169 70 Solna
Printed by
Cover page illustration by Damir Rukavina. All previously published papers were reproduced with permission from the publisher. Published by Karolinska Institutet. Printed by Reproprint. © Morana Vitezic, 2013 ISBN 978-91-7549-123-3

Mojim roditeljima

ABSTRACT Gene regulation is important in maintaining cell identity and in higher organisms is a very complex process with many layers of regulation. Genome-wide transcriptional studies that define gene expression across different cells and tissues give important insights into overall gene regulation of a cell as well as the impact of dysregulation in diseases. With the recent advances of high-throughput sequencing methods, it has become increasingly feasible to elucidate transcriptional regulation in the cell, under normal conditions or during cell perturbation. The aim of this thesis is, using these genome-wide profiling methods, to study in depth the regulatory promoter regions. In Paper I, we knocked down 4 transcription factors in the THP-1 cell line and applied Cap Analysis of Gene Expression (CAGE) with sequencing. We were able to elucidate de-novo the transcriptional binding motifs of these 4 transcription factors as well as build perturbation driven gene regulatory networks. In Paper II, we utilized a similar approach on DYX1C1, a dyslexia susceptibility gene. Using perturbation studies and gene expression profiling with microarrays, the perturbed genes corresponded to the previously described neuronal migration phenotype that was speculated to be linked to the function of this gene. Furthermore, using mass spectrometry, we were able to identify novel protein interacting partners for DYX1C1 and combining with already available data build protein level interaction network. In Paper III, relying on the post-mortem brain samples from the FANTOM5 project, and using CAGE in conjunction with a single molecule sequencer, we identified brain specific transcriptional start sites and brain specific alternative promoters. Additionally, we identified differences between adult and infant brain, interestingly noting many of them originating from alternative promoters. We also classified differences between 15 brain regions into 4 distinct groups and built underlying transcription factor interaction networks. In Paper IV, using the FANTOM5 database we investigated the promoter structure and expression of 3 genes implicated in Rett syndrome. We identified novel promoters, silencing of FOXG1 in the cerebellum, as well as the low correlation between MECP2 and FOXG1 expression. Interestingly, although expression of FOXG1 is limited to the brain and MECP2 is ubiquitous, MECP2 motif activity is significantly lower in the brain than in other tissues, while no differences were observed for FOXG1 motif activity. In summary, our genome-wide studies employing quantitative gene expression measures on promoter level resolution let us describe how cells are different, let us obtain insights into likely underlying regulatory mechanisms as well as gave us the opportunity to explore diseases.
LIST OF PUBLICATIONS
I. Morana Vitezic*, Timo Lassmann*, Alistair R. R. Forrest, Masanori Suzuki, Yasuhiro Tomaru, Jun Kawai, Piero Carninci, Harukazu Suzuki, Yoshihide Hayashizaki and Carsten O. Daub. Building promoter aware transcriptional regulatory networks using siRNA perturbation and deepCAGE. Nucleic Acids Res. 2010 Dec;38(22):8141-8. *Authors contributed equally
II. Kristiina Tammimies, Morana Vitezic, Hans Matsson, Sylvie Le Guyader, Thomas R. Bürglin, Tiina Öhman, Staffan Strömblad, Carsten O. Daub, Tuula A. Nyman, Juha Kere, and Isabel Tapia-Páez. Molecular networks of DYX1C1 gene show connection to neuronal migration genes and cytoskeletal proteins. Biol Psychiatry. 2013 Mar 15;73(6):583-90.
III. Francescatto Margherita*, Morana Vitezic*, Patrizia Rizzu, Javier Simón-Sánchez, Robin Andersson, , Hideya Kawaji, Masayoshi Itoh, Naoto Kondo, Timo Lassmann, Jun Kawai, Harukazu Suzuki, Yoshihide Hayashizaki, Carsten O Daub, Albin Sandelin, Michiel JL de Hoon, Piero Carninci, Alistair RR Forrest and Peter Heutink. A high resolution spatial-temporal promoterome of the human brain. Manuscript. *Authors contributed equally
IV. Morana Vitezic, Michiel JL de Hoon, Nicolas Bertin, Robin Andersson, Leonard Lipovich, Timo Lassmann, Albin Sandelin, Alistair R R Forrest, Piero Carninci, Alka Saxena and the FANTOM Consortium. FANTOM5 reveals the genomic architecture of the genes implicated in Rett Syndrome. Manuscript.
ADDITIONAL PUBLICATIONS
I. Charles Plessy*, Nicolas Bertin*, Hazuki Takahashi*, Roberto Simone*, Md Salimullah, Timo Lassmann, Morana Vitezic, Jessica Severin, Signe Olivarius, Dejan Lazarevic, Nadine Hornig, Valerio Orlando, Ian Bell, Hui Gao, Jacqueline Dumais, Philipp Kapranov, Huaien Wang, Carrie A Davis, Thomas R Gingeras, Jun Kawai, Carsten O Daub, Yoshihide Hayashizaki, Stefano Gustincich and Piero Carninci. Linking promoters to functional transcripts in small samples with nanoCAGE and CAGEscan. Nat Methods. 2010 Jul;7(7):528-34.. *Authors contributed equally
II. Luba M. Pardo*, Patrizia Rizzu*, Margherita Francescatto, Morana Vitezic, Gwenaël G.R. Leday, Javier Simon Sanchez, Abdullah Khamis, Hazuki Takahashi, Wilma D.J. van de Berg, Yulia A. Medvedeva, Mark A. van de Wiel, Carsten O. Daub, Piero Carninci and Peter Heutink. Regional differences in gene expression and promoter usage in aged human brains. Neurobiol Aging. 2013 Jul;34(7):1825-36. *Authors contributed equally
TABLE OF CONTENTS
1 Background ................................................................................................................... 12 RNA and transcriptional regulation ............................................................................. 2
2.1 From DNA to RNA – transcription ................................................................. 22.2 RNA polymerase .............................................................................................. 22.3 Transcription starts at the promoter region ...................................................... 32.4 mRNA as the result of the transcription .......................................................... 42.5 Transcription factors are the main regulatory elements .................................. 52.6 Measuring differences in gene expression ....................................................... 7
3 RNA experiments for genome wide studies ................................................................ 93.1 RNA perturbation studies ................................................................................. 93.2 Cap analysis gene expression (CAGE) ............................................................ 9
4 Genome wide expression profiling methods ............................................................. 124.1 Microarrays ..................................................................................................... 124.2 Next-generation sequencing – History and overview ................................... 13
4.2.1 The Roche 454 ............................................................................... 144.2.2 Illumina Genome Analyzer ............................................................ 154.2.3 Life Sciences SOLiD and Ion Torrent ........................................... 164.2.4 Heliscope single molecule sequencing .......................................... 174.2.5 Third generation sequencing and future efforts ............................ 174.2.6 The bioinformatics requirements of handling next-generation sequencing data ........................................................................................... 18
5 Consortium work on transcriptome studies ............................................................... 205.1 The FANTOM project .................................................................................... 205.2 The ENCODE project .................................................................................... 21
6 Applications to diseases ............................................................................................. 226.1 Dyslexia .......................................................................................................... 226.2 Rett syndrome ................................................................................................. 22
7 Aims ............................................................................................................................ 237.1 Individual aims ............................................................................................... 23
8 Present investigation ................................................................................................... 248.1 Combining siRNA perturbation and deepCAGE gives us insight into transcriptional regulatory networks (Paper I) ......................................................... 248.2 Perturbation studies of DYX1C1 reveal its involvement in neuronal migration pathways (Paper II) ................................................................................. 258.3 The promoter level atlas of specific transcripts as well as spatio-temporal comparisons in human brain (Paper III).................................................................. 278.4 Characterizing Rett disease genes on the promoter level (Paper IV) ........... 29
9 Conclusions and perspectives .................................................................................... 3110 Acknowledgements .................................................................................................. 3311 References ................................................................................................................ 37
LIST OF ABBREVIATIONS
A adenin
bp base pair
C cytosine
CAGE Cap Analysis Gene Expression
cDNA complementary DNA
CDS coding sequence
CGI CG island
ChIP Chromatin Immunoprecipitation
DNA deoxyribonucleic acid
DYX1C1 dyslexia susceptibility 1 candidate gene 1
DPE downstream promoter element
ENCODE Encyclopedia of DNA Elements
FANTOM Functional Annotation of the Mammalian Genome
G guanine
GO gene ontology
Inr inititor element
KEGG Kyoto Encyclopedia of Genes and Genomes
LC-MS/MS liquid chromatography tandem mass spectrometry
lncRNA long non-coding RNA
miRNA micro RNA
mRNA messenger RNA
PIC preinitiation complex
PolII RNA Polymerase II
RNA ribonucleic acid
RNAi RNA interference
rRNA ribosomal RNA
SELEX Systematic Evolution of Ligands by Exponential Enrichment
siRNA small interfering RNA
T threonine
TBP TATA binding protein
TF transcription factor
TFBS transcription factor binding site

tRNA transfer RNA
TSS transcription start site
U uracil
UTR un-translated region
1
1 BACKGROUND The year 2001 gave the first draft of the human genome, a first view at the whole
collection of all the nucleotides, letters and their order that make up our human DNA
(Lander et al, 2001; Venter et al, 2001). This enormous project conducted in big
consortia around the world showed that the number of genes we posses is much less
than was previously believed, around 30,000 out of the earlier predicted 100,000 (Bork
P. and Copley R. 2001). Yet, these genes and their inner workings give rise to over 200
different cells that make up our body (Vickaryous and Hall, 2006), all containing the
same DNA sequence, but with a brought array of functions due to genes being
regulated in different ways. Gene regulation is important in maintaining cell identity
and in higher organisms is a very complex process with many layers of regulation.
Genome-wide transcriptional studies that define gene expression across different cells
and tissues give important insights into overall gene regulation of a cell as well as the
impact of dysregulation on diseases.
2
2 RNA AND TRANSCRIPTIONAL REGULATION
2.1 FROM DNA TO RNA – TRANSCRIPTION
Inside the nucleus each of our cells contains the complete hereditary material, the set of
46 chromosomes that we inherited from our parents, half from the mother and half from
the father. The chromosomes are made up of DNA helixes wrapped around histone
proteins. DNA is double stranded and DNA length is measured in base pairs (bp). Basic
building blocks of the DNA are nucleotides, the purines adenine (A) and guanine (G)
together with the pirimidines cytosine (C) and thymine (T), making pairs to connect the
backbones of the two DNA strands (adenine with thymine and guanine with cytosine).
Genes are stretches on the DNA that define heritable, functional units. The entirety of
heredity information of an organism forms its genome. DNA is like a blueprint and for
a gene to be used, it needs to be transcribed from DNA into RNA, meaning that its
sequence is copied. RNA is, like DNA, a nucleic acid, but it uses the nucleotide uracyle
instead of thymine and in the cell it occurs mostly in single stranded form, unlike DNA
who is double-stranded. The central dogma of molecular biology (Crick F, 1970.)
describes the information flow from DNA is part of the basic information flow in the
cell that defines that DNA transcribes into RNA which in turn gets translated into
proteins.
2.2 RNA POLYMERASE
Transcription is performed by RNA polymerase, an enzyme that uses the DNA strand
as a template to build RNA base by base by moving along the DNA strand. The
products of RNA polymerase are: messenger RNA (mRNA) that is the template for
translation into proteins as well as non-coding RNA that is a wide group of genes that
do not get translated into proteins but have other, mostly functional (such as transfer
RNAs or ribosomal RNAs) or regulatory functions (such as micro RNAs). Non-coding
RNA includes transfer RNA (tRNA), ribosomal RNA (rRNA), micro RNA (miRNA),
short RNAs and long non-coding RNAs (lncRNAs). Humans have several different
types of RNA polymerases: polymerase I synthesizes rRNA, polymerase II synthesizes
mRNA and most snoRNA and miRNA and polymerase III synthesizes tRNAs, rRNAs
and other small RNAs.
3
Polymerase II (PolII) is the most studied one and due to its complex level of control,
requires many additional binding factors. For PolII transcription to function properly,
additional proteins are recruited to the DNA strand to form the transcription
preinitiation complex (PIC) together with the polymerase. The role of the PIC is
positioning the polymerase over the transcription start site (TSS), the position from
where the transcription of the gene starts.
2.3 TRANSCRIPTION STARTS AT THE PROMOTER REGION
The PIC binds at the promoter, a specific position on the DNA where transcription is
initiated. The promoter is an important part of the gene, without the promoter
transcription of the gene cannot be initiated and no gene product is obtained. The
promoter is located upstream of the gene and is usually between 100 and 1000 bp long.
Depending on distance to the TSS and the specific function, we can classify the
promoter into three parts: the core promoter in close proximity upstream of the TSS;
the proximal promoter region that comprises about 300 bp upstream from the TSS and
includes specific regulatory elements binding sites, most notably for transcription
factors; the distal promoter region up to several 10 kb upstream of the TSS contains
enhancers or insulators.
The core promoter region, except the TSS itself, contains binding sites for the PIC,
RNA polymerase and general binding sites. These include the TATA box (Lifton et al,
1978), a sequence that contains a TA-rich pattern about 30bp upstream from the TSS
and binds the TATA binding protein (TBP) involved in DNA strand separation during
the process of transcription and part of the PIC. Only about 10-20% of all promoters
have a clear TATA box motif (Valen and Sandelin, 2011) and are linked to genes
expressed in specific tissues (Carninci et al, 2006). Other core promoter elements
include the initiator element (Inr), independent of the TATA box but can also initiate
transcription on its own (Smale and Kadonga, 2003), the downstream promoter element
(DPE), the TFIIB recognition element (BRE) and the CpG island (CGI).
Between 40% and 70% of human promoters contain a CGI (Sandelin et al, 2007),
meaning there are more CG stretches than expect for the local number of C and G
nucleotides (Deaton and Bird, 2011). Unlike TATA-box connected proteins, CGIs are
most often associated to ubiquitously regulated genes.
4
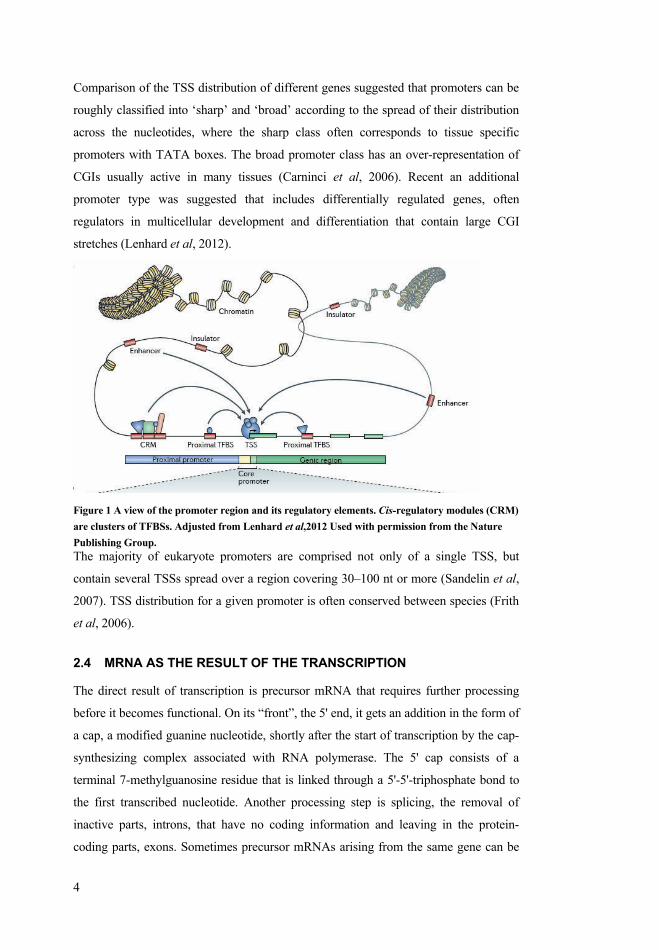
Comparison of the TSS distribution of different genes suggested that promoters can be
roughly classified into ‘sharp’ and ‘broad’ according to the spread of their distribution
across the nucleotides, where the sharp class often corresponds to tissue specific
promoters with TATA boxes. The broad promoter class has an over-representation of
CGIs usually active in many tissues (Carninci et al, 2006). Recent an additional
promoter type was suggested that includes differentially regulated genes, often
regulators in multicellular development and differentiation that contain large CGI
stretches (Lenhard et al, 2012).
Figure 1 A view of the promoter region and its regulatory elements. Cis-regulatory modules (CRM) are clusters of TFBSs. Adjusted from Lenhard et al,2012 Used with permission from the Nature Publishing Group. The majority of eukaryote promoters are comprised not only of a single TSS, but
contain several TSSs spread over a region covering 30–100 nt or more (Sandelin et al,
2007). TSS distribution for a given promoter is often conserved between species (Frith
et al, 2006).
2.4 MRNA AS THE RESULT OF THE TRANSCRIPTION
The direct result of transcription is precursor mRNA that requires further processing
before it becomes functional. On its “front”, the 5' end, it gets an addition in the form of
a cap, a modified guanine nucleotide, shortly after the start of transcription by the cap-
synthesizing complex associated with RNA polymerase. The 5' cap consists of a
terminal 7-methylguanosine residue that is linked through a 5'-5'-triphosphate bond to
the first transcribed nucleotide. Another processing step is splicing, the removal of
inactive parts, introns, that have no coding information and leaving in the protein-
coding parts, exons. Sometimes precursor mRNAs arising from the same gene can be
5
spliced in different ways, giving rise to different proteins in the process called
alternative splicing. Another possible process is editing, where nucleotides directly in
the mRNA are changed and can result in an altered protein sequence in the case of
protein coding RNA. The final processing step happening at the 3’ end is called
polyadenylation, an addition of a ‘tail’ of adenosine residues (poly(A) tail) added to the
free 3' end. This reaction is catalyzed by polyadenylate polymerase. Similar to
alternative splicing, there can be more than one polyadenylation variant of one mRNA.
The purpose of the poly(A) tail is to protect mRNA from degradation by exonucleases,
for export of the mRNA from the nucleus as well as for loading into the ribosome for
translation.
A mature, fully processed mRNA is thus composed of the cap at the 5’ end, followed
by the 5’ untranslated region (UTR) that contains regulatory regions, the coding
sequence (CDS) that includes the code for the start and stop codons used in translating
the mRNA intro proteins, the 3’UTR and at the end the poly(A) tail.
2.5 TRANSCRIPTION FACTORS ARE THE MAIN REGULATORY
ELEMENTS
The regulatory elements that bind at the promoter sites are specific proteins known as
transcription factors (TFs). A TF can act alone or with other proteins in a complex by
promoting (activation) or blocking (repression) the recruitment of RNA polymerase to
the specific promoter (Lee and Young, 2000). However, regulation of gene expression
in eukaryotes is highly complex and depends on sets of TFs rather than individual TFs
(Elkon et al, 2003). The main trait that makes a protein a transcription factor is having
one or more DNA binding domains that recognize and bind to specific sequences of
DNA in the promoter region. One or more DNA-binding domains are often part of a
larger protein consisting of additional domains with differing function. The additional
domains often regulate the activity of the DNA-binding domain.
There are approximately 1,400 proteins in the human genome that contain DNA
binding domains and most of these are presumed to function as TFs (Vaquerizas et al,
2009). The TFs are the largest family of human proteins, comprised of about 10% of all
coding genes. The promoter composition of the genes is one of the major determinants
of gene regulation including multiple transcription binding sites that interact with a
specific combination of transcription factors (TF). Eukaryotes achieve this diversity by
combining a small number of transcription factors whose activities are modulated by
6
diverse sets of conditions. Different functionalities can be held by one TF by its
association with different co-factors. These factors may act as global TFs that assist
their gene-specific partners in their function, and may thus activate or repress
transcription depending on the partner motif and the condition. Usually, several binding
sites for distinct transcription factors are found around each gene and efficient
expression requires the cooperative action of several different TFs (Pilpel et al, 2001).
This way, combining 2,600 TFs can regulate the whole genome in an efficient way
during development and maintenance (Brivanlou and Darnell, 2002).
The TF binds to its specific DNA sequence at the position called the transcription factor
binding site (TFBS). Due to the weak interactions of such bonds, the TF can bind not
just to one sequence but to a subset of closely related sequences, making the detection
of such regions much more complicated. Because these TFBS tend to be short
sequences, many potential binding sites can be found throughout the genome, not
necessarily meaning all of them are active binding sites, additionally complicating the
search for true active TFBS in a specific cell. Additionally, although we know most of
these proteins to be TFs due to their binding domains, for a vast majority we do not
know the sequence they bind to with confidence.
Many attempts have been made to identify the TFBSs, both experimentally and
computationally. Computational methods include identifying the presence of a
sequence motif in a set of DNA sequences known to bind the protein. The difficulty
here is that even if the motif is present, we cannot know if the TF really binds there in
vivo. The most efficient methods combine experimental efforts with computational
analysis. Chromatin Immunoprecipitation (ChIP) is a technique where a protein of
interest is selectively immunoprecipitated from a chromatin preparation to determine
the DNA sequences associated with it (Collas 2010). The obtained sequences that bind
that protein or TF can then be identified on a tiling microarray (ChIP-chip) or by
sequencing (ChIP-Seq). To be able to perform experiments for specific transcription
factors, however, specific antibodies are needed whose production is difficult. For
many of the transcription factors antibodies are not yet available (Sikder and Kodadek,
2005). Additionally, computational analysis of such datasets is very demanding for
example due to low resolution of the ChIP-chip method or the longer reads than
binding sites in ChIP-Seq that can make it hard to determine the exact sequence the
protein recognizes. Another emerging experimental technology to identify binding sites
7
in vitro is Systematic Evolution of Ligands by Exponential Enrichment (SELEX). This
method uses rapid selection of nucleic acids (single- or double-stranded RNA or DNA),
which have high affinity to a molecular target such as a TF (Oliphant et al, 1989; Tuerk
and Gold, 1990). Combining SELEX with next-generation sequencing has recently led
to identifying over 400 TF binding motifs (Jolma et al. 2010; 2013). Over-selection can
be a problem for SELEX technology that enriches for specific binding sequences since
TFs in vivo bind to biologically important medium or low affinity TFBSs as well.
Due to their important roles in development, intercellular signaling and cell cycle, some
human diseases have been associated with mutations in transcription factors. One such
disease is the Rett syndrome (Paper IV), a neurodevelopmental syndrome linked to
mutations in the MECP2 transcription factor.
Additional regulatory elements, such as distal acting enhancers and non-coding RNAs
as well as epigenetic regulators (Chawan et al, 2011) can influence the start of
transcription and formation of a fully functional mRNA. To be able to characterize
transcriptional events, different genome-wide techniques can be utilized to gain a better
insight of the current transcription ongoing in the cell and the underlying regulation.
2.6 MEASURING DIFFERENCES IN GENE EXPRESSION
Genome-wide expression measurement of a diseased state together with a reference
normal state allows identifying differences global level using differential expression
analysis. In the first years when microarrays have been introduced, differentially
expressed genes were inferred using a fixed threshold cut-off for expression
differences, for example a two-fold increase or decrease in expression. Improved
methods to infer significance were based on replicate measurements for ranking genes
according to their possibilities of differential expression and selection of a cut-off value
for rejecting the null-hypothesis that the gene is not differentially expressed (Leung and
Cavalieri, 2003). Replication of an experiment is important to obtain the variation in
the gene expression for statistics calculation, ideally every experiment performed in at
least triplicates (Lee et al, 2000). Replication can be either technical, by using the same
RNA sample multiple times, or biological by extracting RNA from different samples.
This is particularly important in tissue samples to characterize expression variability
caused by variability of the tissue so that one sample of a tissue might not be a
representative sample. Statistical methods such as Student’s t-test, ANOVA, Bayesian

8
method, or Mann-Whitney test can be used to rank the genes from replicated data
(Storey and Tibshirani, 2003). Setting a ad-hoc cut-off for differential expression is
difficult, because of the false positives (Type I error) and the false negatives (Type II
error). Furthermore, performing statistical tests for tens of thousands of genes creates a
multiple hypothesis-testing problem. Therefore, it is necessary to control the false
discovery rate (FDR) (Reiner et al, 2003), the expected proportion of false positives
among the number of rejected hypotheses and base the cut-off on the samples that
satisfy the FDR criteria.
9
3 RNA EXPERIMENTS FOR GENOME WIDE STUDIES There is a range of technologies that target the mRNA in a specific way, allowing us to
capture the expression of a certain cell line or tissue.
For the 4 different papers, we applied a set of different techniques: RNA perturbation in
papers I and II as well as CAGE in papers I, III and IV.
3.1 RNA PERTURBATION STUDIES
Many approaches aim at understanding the interactions between genes that ultimately
govern phenotype and disease pathology (Birney et al, 2007). The complex
interactions among transcription factors derived from such networks point to diverse
regulatory programs responsible for cell differentiation during development and
cellular responses to outside stimuli. A powerful technique to understand gene
regulatory networks is the perturbation of individual transcription factors in concert
with high-throughput profiling of all genes to assess the impact. Perturbation can be
performed by either knocking down individual genes or up-regulation. RNA
interference (RNAi) uses small RNA molecules to inhibit gene expression, typically by
causing the destruction of specific mRNA molecule and thus knocking-down the gene
expression. This method employs the cell’s own RNAi pathway in which small
interfering RNAs (siRNA) are used as a template to mark the target mRNA for
cleavage (Voorhoeve and Agami, 2003). Alternatively, overexpression of a gene can be
induced by putting the gene and its promoter into a plasmid construct inserted into the
cell.
3.2 CAP ANALYSIS GENE EXPRESSION (CAGE)
Capturing the exact transcription amount and positions of the TSS in the cell is an
important goal for genome-wide expression studies. Cap-analysis gene expression
(CAGE) captures the 5’-end of the mRNAs in the cell (Shiraki et al, 2003; Kodzius et
al, 2006). The strength of CAGE is to comprehensively map the vast majority of
human transcription starting sites and hence their promoters, and simultaneously
decipher the expression of the RNAs produced at each promoter. Thus, CAGE allows
for high- throughput gene expression profiling with simultaneous identification of the
tissue/cell/condition-specific TSSs, including promoter usage analysis and
determination of the expression level at each promoter (Takahashi et al, 2012).
10
Precisely mapping the TSS position allows for identifying regulatory elements, such as
core and proximal promoters and the TFBSs that are responsible for transcription.
Bioinformatic analysis allows for selection of promoters having similar expression
profiles that are analyzed for the presence of common TFBS. Coupled to the
determination of the expression of transcription factors, which drive the gene
transcription, this analysis allows reconstructing the regulatory networks that drive
gene expression (Suzuki et al, 2009). Expression is represented by the number of
CAGE ‘tags’ mapping to a certain TSS. By counting the number of CAGE tags for
each TSS within a gene, we can determine not only the RNA expression level on a
digital resolution but also the various alternative promoters being used, allowing
comprehensive mapping of promoters in mammalian genomes (Carninci et al, 2006).
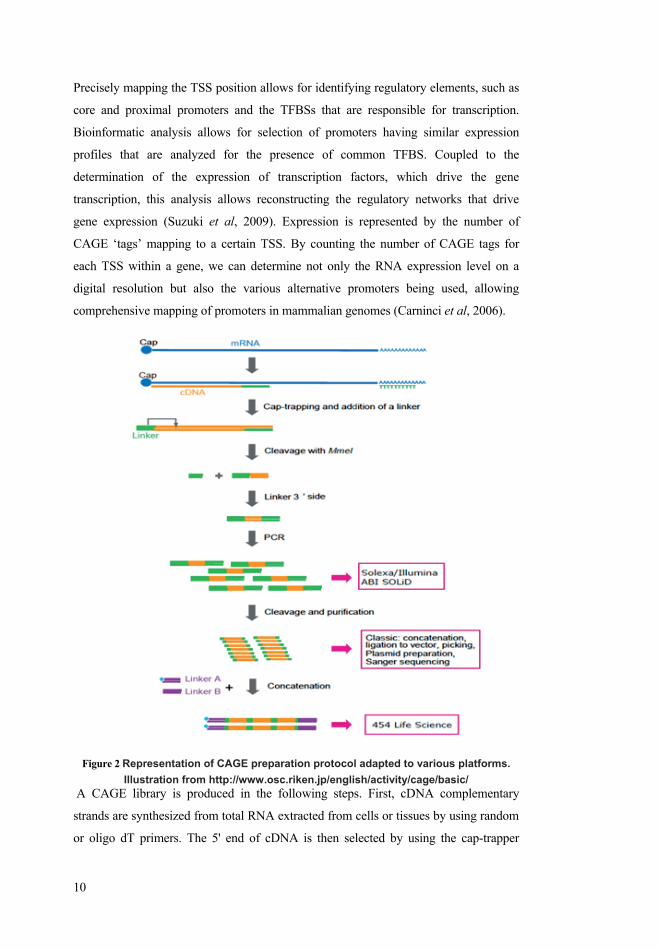
Figure 2 Representation of CAGE preparation protocol adapted to various platforms. Illustration from http://www.osc.riken.jp/english/activity/cage/basic/
A CAGE library is produced in the following steps. First, cDNA complementary
strands are synthesized from total RNA extracted from cells or tissues by using random
or oligo dT primers. The 5' end of cDNA is then selected by using the cap-trapper
11
method. Second, a biotinylated linker is attached to 5' end of single-strand cDNA
acquired by removing the RNA strand using RNaseI. This linker contains recognition
sites that are essential for cloning, short specific base sequences, and endonuclease
recognition sites (MmeI or EcoP15I). After the second cDNA strand is synthesized, 20
nucleotides (MmeI) or 27 nucleotides (EcoP15I) are cut from the 5' end to make the
CAGE tag. Next, a linker is attached to the 3' side of the tag sequence to amplify it.
Previously, fragments were cleaved and concatenated in CAGE tags, but current next
generation sequencers (see below) do not require cleavage and the tags can be directly
sequenced to produce millions of tags per sample (Takhashi et al, 2012). This next-
generation sequencer adapted CAGE is often referred to as deepCAGE.
CAGE was also adapted for the single molecule sequencer Heliscope. The changes in
this simplified protocol include generation of only first strand cDNA using an excess of
random primer. The capped end is captured on magnetic strepatavidin beads. Released
first-strand cDNA is poly(A)-tailed and blocked and then loaded directly onto the
HeliScope flow cell for sequencing (Kanamori-Katayama et al, 2011).
12
4 GENOME WIDE EXPRESSION PROFILING METHODS
4.1 MICROARRAYS
Studies of gene expression were previously possible on only one or a few genes at a
time. The ability to perform genome expression profiling on the whole set of genes in a
cell came in the mid 1990s with the advent of expression microarray technology
(Schena et al, 1995). This technology allows for the study of thousands of transcripts
at the same time. The technology is based on a set of probes immobilized on a glass
slide in the form of spots. Each spot contains picomoles of a specific probe (either a
part of a gene or some other specific sequence) and it uses the mechanism of
hybridization to connect the DNA or RNA target strands to the probes. The un-
hybridized targets are washed away and the hybridization of the probe and its target is
then detected by fluorophore or chemiluminescence labeled targets to determine
relative abundance of nucleic acid sequences in the target. Total strength of the signal
on one spot depends on the amount of targets binding to the probes on that spot. The
signal then needs to be normalized, usually using the background probe levels. The
expression levels can be determined using relative normalization in the comparison of
an experiment and its control for each spot. Thus the values are only explainable in
relative conditions and are not a direct measurement of the level of expression of the
target
The most popular genome expression technologies include in-situ-synthesized arrays
and high-density bead arrays. In situ-synthesized arrays are high-density
oligonucleotide probe microarrays (such as Affymetrix GeneChip). They are made
using photolithography, using light to create a pattern. The method relies on UV
masking and light-directed combinatorial chemical synthesis on a solid support to
selectively synthesize probes directly on the surface of the array, one nucleotide at a
time per spot, for many spots simultaneously. The probes are 25 bp long. The other
popular high-density methods are BeadArrays manufactured by Illumina. This
technology is based on color-coded 3-micron silica beads that randomly self assemble
in either a fiber-optic bundle substrate that then themselves assemble into arrays, or a
silica slide substrate. When randomly assembled on one of these two substrates, the
beads have a uniform spacing of approximately 5.7 microns, with a packing density of
13
about 40,000 array elements per square millimeter. This gives the Bead Array platform
about 400 times the information density of a typical spotted array. Each bead is covered
with hundreds of thousands of copies of a specific oligonucleotide that act as the
capture sequences in one of Illumina’s assays. The sequence specific probe is 50 bp
long (Miller and Tang 2009). Illumina BeadArrays were used in Paper II.
The microarrays are usually genome based (containing probes for about 47,000
different RNAs) and the probes are usually based on the 3’ end of the expressed mRNA
since they target the poly-A tail of mRNAs and contain probes that are clustered for
detection of sequences at the 3’-end of the target. While these expression arrays can
report changes in transcript abundance, they are only able to distinguish transcripts of
the same gene if the transcripts differ in their last few transcribed exons. Since
microarrays contain many thousands of probes, there is the possibility of cross-
reactivity of samples to different genes giving then a false estimation of gene
expression annotated for that probe. Many changes in transcript expression are caused
by inclusion of alternate exons or alternative start sites, which would produce different
isoforms of the gene that are not visible to 3’ expression arrays. To address the
challenge of alternative splicing that produces alternative exon expression, several
splice-sensitive microarray platforms have been developed.
Studying gene expression using microarrays has had big impacts on medical research
since this technology can compare expression of gene based probes between diseased
and normal samples, cancers and tissues, enabling the identification of potential targets
for treatments (van t’Veer et al, 2002). This technology has fundamentally altered
biology and medicine by allowing the study of expression patterns across an entire
genome.
4.2 NEXT-GENERATION SEQUENCING – HISTORY AND OVERVIEW
Sequencing is a method that determines the order of the nucleotides in a sequence. One
of the first established methods for sequencing was Sanger sequencing, based on chain
termination. In this method, an extension is initiated at a specific site on the template
DNA by using a short oligonucleotide primer complementary to the template at that
region. Included with the primer and polymerase are the four bases, along with a low
concentration of a chain terminating nucleotide (most commonly a di-
deoxynucleotide). Incorporation of the chain terminating nucleotide results in a series
of related DNA fragments that are terminated only at positions where this particular
14
nucleotide is used. The fragments are then size-separated by electrophoresis in a slab
polyacrylamide gel or a glass capillary (Sanger et al, 1977).
The next steps to improve this technology came with the development of different
colored terminating nucleotides to enable the reaction to run in one tube (Smith et al.,
1985) as well as the development of machines enabling many reactions to run at the
same time thus automating the process (Smith et al, 1986). These were all pre-
requisites for one remarkable project of mapping the whole human genome. In the
works since the mid 80s, the Human Genome Project (HGP) officially started in 1990
and finished in 2003. The project was also marked with a huge investment in genome
sciences, which focused on parallelization and automation of sequencing methods.
The next big brake for sequencing came in 1996 with establishing of pyrosequencing
(Ronaghi et al, 1996), a method very different from previous ones. It is based on the
incorporation of nucleotides one at a time as a complementary, single strand to the
single stranded DNA template. As the nucleotides are added, light from the release of
PPi is emitted and measured (usually via a CCD camera). The addition of each
nucleotide is controlled, allowing for easy tracking of the desired sequence loci.
Different methods as well as automation, massive parallelization of processes and
lowering of sequencing costs prepared the market for the advent of sequencing
machines.
4.2.1 The Roche 454
The new era of next-generation sequencing was ushered in with the release of the first
next-generation sequencer, Life Sciences 454 (Margulies et al, 2005). For a sample to
be sequenced, it needs to be randomly cut into smaller pieces, adding adapter sequences
to the ends, then combining the fragments with Sepharose beads (diameter ~28 µm)
which have been coated with oligonucleotides complementary to the adapters. The
sample is mixed with an excess of beads so that most beads bind only a single template
molecule. The beads with the bound DNA are subjected to emulsion PCR (Nakano et
al, 2003), which amplifies the DNA templates from a single copy to approximately 10
million copies on each bead. Subsequently, the enriched, template-carrying beads are
deposited into open wells arranged along one face of a 60×60 mm2 fibre-optic. The
wells are sized to fit only a single bead and each plate contains approximately two
million wells. Reagents are supplied to the picotiter plate for sequential rounds of
sequencing by synthesis using a modification of the pyrosequencing method. The
chemiluminescent event is detected by a camera. The location of each template
15
molecule in its unique well of the 454 picotiter plate is recorded and computational
assembly of the sequences of all templates happens simultaneously. The 454 sequencer
is equipped with an integrated computer which allows for signal processing in real
time. This system has very low base calling error rate due to only one nucleotide being
added at a time but it has an issue when a template molecule contains multiple bases of
the same type, such as a run of AAAA’s , then multiple bases are synthesized onto the
copy strand all at once, creating a larger emission of light. It is difficult for the system
to accurately count the number of bases in homopolymers longer than eight or nine
bases.
The first 454 produced approximately 500,000 sequences (or 25 Mb) of data, with
reads 80-120 bases long. In 2012, an upgrade to the ‘GS’ system known as ‘FLX+’
increased the average read length to 700 bases for ~1 million reads or 3 Gb of data
from a run. The cost per run remains about $8,000. To lower the cost and increase
yield, a multiplex strategy that involves both barcodes for individual samples, and a set
of gaskets which divide the surface of the sequencing plate into sub-sections are
employed. The advantage of this system is that it can deliver long reads and deep
sequencing which is particularly suitable for de-novo sequence assembly. Roche 454
sequencer is used to sequence the data in Paper I.
4.2.2 Illumina Genome Analyzer
Around the same time of the release of the 454, a new technology was being developed
at the University of Cambridge using the bridge-amplification technology or
sequencing-by-synthesis. It was able to generate for the first time 1 Gb in a run. The
instrument was called the Solexa 1G (Bentley et al, 2008).
Prepared libraries are sequenced on a flow cell, which has a lawn of two oligos
complementary to the different adapter sequences. Cyclical reactions produce a
‘cluster’ of around 1000 copies of the original library molecule. Clusters are made
single-stranded by cleaving of the adapter sequence. Hybridization of a sequencing
primer is then followed by addition of fluorescent terminators in a cyclical reaction
(similar to pyrosequencing, but using just one color). Nucleotides are incorporated by
polymerase into the growing DNA strand. The flow cell is imaged to determine which
nucleotide has been incorporated into each individual cluster. The terminator is
removed by chemical cleavage ready for the next round of incorporation, imaging and
cleavage.
16
In 2007, the early Solexa-based sequencers generated reads of 35 bp and generated
around 30 M sequences (or 1 Gb) of data from a flowcell.
The newest version of this sequencer, the HiSeq, is currently the most widely used
sequencer and can generate 2.4 billion sequences (300 Gb) of data in one run, with the
read length of 100 bp as compared to the first read length of just 26 bp.
4.2.3 Life Sciences SOLiD and Ion Torrent
The third major technology to enter was the SOLiD, Sequencing by Oligo Ligation
Detection, which uses sequencing-by-ligation. On a SOLiD flowcell, the libraries can
be sequenced by 8 base-probe ligation which contains ligation site (the first base),
cleavage site (the fifth base), and 4 different fluorescent dyes (linked to the last base)
(Mardis E, 2008). The fluorescent signal is recorded while the probes are bound to the
template strand and diminished by the cleavage of probes’ last 3 bases.
Originally, the read length of SOLiD was 35�bp and the output was 3�Gb of data per
run. The new generation has improved read length, accuracy, and data output of
85�bp, 99.99%, and 30�G per run, respectively (Lin L. et al, 2012). Despite its high
accuracy, SOLiD’s short read length makes it a less popular laternative to the Illumina
Hi-Seq.
The newer system Ion-Torrent has a semiconductor base detection system. The
sequencing itself is an approach similar to pyrosequencing but with a twist. It detects
hydrogen ions that are released during the polymerisation of DNA, as opposed to the
optical methods used in other sequencing systems. The sequencing is performed in the
wells of a semiconductor chip into which individual emulsion PCR beads can be
loaded. Sequencing is performed in the same cyclical manner but there are no
additional enzymes and natural, rather than fluorescently modified, nucleotides are
used. As each nucleotide is incorporated hydrogen ions are released, which change the
pH of the solution in the well. The change in pH is detected by the chip which has an
ion sensor at the bottom of each well reading out the data (Rotherberg et al. 2011). Ion
Torrent produces similar amount of data to HiSeq but with a longer read length of up to
200bp.
Other vendors are competing with the current ‘big three’ of the next-generation
sequencing, including Complete Genomics, which uses DNA nanoballs and unchained
sequencing by ligation (Lee et al, 2010) but does all the sequencing ‘in house’ as a
service without producing any machines.
17
Another angle is making the machines more approachable to general users, particularly
aiming at clinicians by miniaturizing the products. Both Illumina and Ion Torrent have
smaller versions, MiSeq and Ion PGM, that give smaller yields but are more affordable
and aimed at personal genomics for sequencing few genes of many different
individuals.
4.2.4 Heliscope single molecule sequencing
Helicos Biosciences sequencer Heliscope was the first sequencer that was truly single
molecule based, meaning that it did not need any of the amplification steps that the
other sequencers use. It uses DNA fragments with added poly-A tail adapters attached
to the flow cell surface. The next steps involve extension-based sequencing with cyclic
washes of the flow cell with fluorescently labeled nucleotides (one nucleotide type at a
time, like with the early Sanger method). The reads are short, up to 55 bases per run,
but allow for more accurate reads of stretches of one type of nucleotides (Thompson
and Steinman, 2010). Heliscope was used for sequencing the data described in Paper III
and Paper IV.
4.2.5 Third generation sequencing and future efforts
Two things characterize third the generation of sequencers: they are single molecule
sequencers without any PCR steps involved and the reactions are observed in real time.
Single-molecule real-time (SMRT) is the third-generation sequencing method
developed by Pacific Bioscience. An active polymerase is immobilized at the bottom of
each SMRT Cell, each patterned with 150,000 zero mode waveguide chambers,
nucleotides diffuse into each of these chambers. In order to detect incorporation events
and identify the base, each of the four nucleotides A, C, G and T are labeled with a
different fluorescent dye having a distinct emission spectrum. Since the excitation
illumination is directed to the bottom of the chamber, nucleotides held by the
polymerase prior to incorporation emit an extended signal that identifies the base being
incorporated. Read lengths of 20 KB and higher have been recorded and it is possible to
generate base-modification data as well (Branton et al. 2008; Timp et al, 2010).
The newest sequencer to come out is based on nanopore technology produced by
Oxford Nanopore Technologies. They use a semiconductor chip with nanometer sized
holes (‘nanopores’) to read DNA as it translocates through the pore under an
electrophoretic current. The DNA is tethered to the pore by a polymerase which slows
18
translocation down to around 1000 bases-per-second (Ayub and Bayley 2012). The
read lengths are expected to be 100,000 base pairs. In 2012, they announced the
MinION sequencer, a disposable genome sequencer in a USB stick capable of
generating over 1 GB of data (Niedringhaus et al, 2011).
The future of commercial sequencing will be driven by miniaturization of machines
and lowering the costs as well as providing a high level of yield together with long
reads. In addition, methods to handle to high level of data are being developed in
parallel as well as novel techniques of processing and analyzing the data.
4.2.6 The bioinformatics requirements of handling next-generation
sequencing data
With the development of many high-throughput technologies to be used in genome
expression profiling, there was also a need for dedicated bioinformatics methods for
these data. Some important steps are shared by all the different approaches and types of
data, starting from obtaining the raw data, checking for quality and mapping to the
reference genome. Most of the modern sequencers follow the same standard file
formats. The reads obtained from the sequencers are presented in a FASTQ format, a
text based format that presents the sequence and its sequencing quality (Cock et al,
2010). The range of quality values is different for each sequencer, but in principle
quality score is an indication of probability of the base call being incorrect.
The FASTQ format is usually the input format for the next basic step, which is
mapping or aligning the data to the reference genome. The reference genome is the
current genome assembly released by the Genome Reference Consortium
(http://www.ncbi.nlm.nih.gov/projects/genome/assembly/grc/). Next-generation
sequencing generally produces short reads, meaning short sequences of <~200 bases
(as compared to long reads by Sanger sequencing, which cover ~1000 bases).
To compare the sequenced sample to its reference sequence, we need to find the
corresponding part of that sequence for each read in our data.
Many different mapping tools are freely available and usually the choice of which to
use depends on the exact dataset and technology used. In Paper I we used the Nexalign
(Lassmann,T., http://genome.gsc.riken.jp/osc/english/dataresource/) while in Papers III
and IV we used Delve, a probabilistic mapper. Delve uses a pair hidden Markov model
to iteratively map reads to the genome and estimate position dependent error
probabilities. After all error probabilities are estimated, individual reads are placed to a
19
single position on the genome where the alignment has the highest probability to be
true according to the model. Phred scaled mapping qualities (Li et al, 2008), reflecting
the likelihood of the alignment at a given genome position, are also reported, allowing
filtering of the mapped reads based on the error probability of the mapping. Other
popular mapping tools include BWA (Li and Durbin, 2009) and Bowtie (Langmead et
al, 2009).
Possible errors during the mapping process can arise from the following: PCR artifacts
from the early amplification steps of the sample, these errors are visible as mismatches
in the alignment; sequencing errors come from the machine making an erroneous call
either for physical reasons (limitations on the slide) or due to repeated stretches of the
same base; mapping errors that arise due to the mapping algorithm, most often
happening around repeat or low complexity regions (Li et al, 2012).
The mapping tools usually give output in the standard SAM/BAM file format. SAM
format is the text version of the binary BAM format. These files include information
about the alignment of the sequence and the mapping quality. They can easily be
converted into the one another or queried for information using the samtools package
(Li et al, 2009). Data files processed in this way can be further analyzed to answer
specific questions as well as visualized and compared to existing data in dedicated
genome browsers such as the UCSC Genome Browser (Meyer et al, 2013).
20
5 CONSORTIUM WORK ON TRANSCRIPTOME STUDIES
There is still a lot of work left to gain complete insight into transcriptional regulation
and events in the cell. Similarly to the Human Genome Project, using the expertise and
technology of different research centers, a few consortia aiming at demystifying
transcriptional regulation have been formed.
5.1 THE FANTOM PROJECT
The Functional ANnotation of The Mammalian Genome project (FANTOM
Consortium) begun in the year 2000 to assign functional annotations to the full-length
cDNAs that were collected during the Mouse Encyclopedia Project at RIKEN, Japan.
FANTOM has since developed and expanded over time to encompass the fields of
transcriptome analysis involving researchers from 19 countries. The object of the
project is moving steadily up the layers in the system of life, progressing from an
understanding of the ‘elements’ - the transcripts - to an understanding of the ‘system’ -
the transcriptional regulatory network. Since FANTOM3, the consortium has taken on
CAGE as its main technology. Some of the major findings through the projects include:
FANTOM3 revealed that 63% of the genome, instead of the previously thought 1.5%
comprising of protein coding genes, is transcribed as RNA in the mammalian genome
(mouse and human), as well as discovering over 23,000 non-coding RNAs and
abundant sense-antisense transcription (Carninci et al, 2005; Katayama et al, 2005).
FANTOM4 used CAGE adapted for next generation sequencing (Roche 454 machine)
and the THP1 cell line to monitor the dynamics of TSS usage during a time course of
monocytic differentiation. The expression levels from each promoter and TFBS
predictions were then used to build a transcriptional regulatory network (Suzuki et al,
2009). The current project FANTOM5 aims to expand on previous projects to generate
a map of the majority of human promoters and comparative transcriptional regulatory
models across different primary cells, cell lines and tissues. The CAGE sequencing is
performed on Helicos single molecule sequencer and RNA isolated from every major
human organ, over 200 cancer cell lines, 200 primary cells as well as time courses.
The FANTOM resources have been used in several important research projects,
including the Human Genome Project and the iPS cell establishment. The deliverable
of FANTOM also include the FANTOM database and the FANTOM full-length cDNA
clone bank.
21
5.2 THE ENCODE PROJECT
The ENCyclopedia Of DNA Elements (ENCODE) Project launched by the US
National Human Genome Research Institute in September 2003 aims at identifying all
functional elements in the human genome sequence. The pilot phase of the Project was
focused on a specified 30 megabases (�1%) of the human genome sequence and is
organized as an international consortium of computational and molecular laboratory-
based scientists working to develop and apply high-throughput approaches for
detecting all sequence elements that confer biological function. For the current phase,
the primary assays used in ENCODE are ChIP-seq, DNase I Hypersensitivity, RNA-
seq, CAGE and assays of DNA methylation. The combination of these technologies
across cell lines enabled the project to assign biochemical functions for 80% of the
genome, in particular outside of the well-studied protein-coding regions (Dunham et al,
2012; Djebali et al, 2012). Other deliverables include a comprehensive map of DNase 1
hypersensitive sites (Thurman et al, 2012), a lexicon of short DNA sequences that form
recognition motifs for DNA-binding proteins (Neph et al, 2012), and a preliminary
sketch of the architecture of the network of human transcription factors (Gerstein et al,
2012). One part of the ENCODE project is also GENCODE, a project to annotate all
evidence-based gene features in the entire human genome at a high accuracy (Harrow
et al, 2006).
22
6 APPLICATIONS TO DISEASES An integral next step is to apply all of these technologies and approaches to research
complex diseases. In my research I have applied these approaches to genes involved in
dyslexia (Paper II) and Rett syndrome (Paper IV).
6.1 DYSLEXIA
Dyslexia is a common impairment in learning to read and write despite normal
intelligence and normal senses that affects approximately 5%–10% of the population
(Petryshen and Pauls, 2009). Developmental dyslexia is a complex neurodevelopmental
disorder with a genetic basis. Many candidate genes for dyslexia have been identified
with DYX1C1, dyslexia susceptibility 1 candidate 1, being one of the most promising.
Function of DYX1C1 is mostly unknown, but it has been demonstrated to affect
neuronal migration and modulate estrogen receptor signaling (Wang et al, 2006;
Massinen et al, 2009). Knowledge that RNAi mediated knockdown in rats influenced
cognitive processes (Threlked et al, 2007), is involved in estrogen receptor signaling
and that the protein product can be seen in the nucleus, led us to think DYX1C1 would
be a good candidate for perturbation studies.
6.2 RETT SYNDROME
Rett syndrome is a neurodevelopmental disorder that affects the grey matter of the
brain. While almost exclusively affecting females, it has been detected in males as well.
The clinical features include small hands and feet and a deceleration of the rate of head
growth including repetitive stereotyped hand movements, seizures, no verbal skills or
walking skills as well as intellectual disability (Neul et al, 2010).
It is caused by mutations in three functionally diverse genes: FOXG1 (Ariani et al,
2008), MECP2 (Amir et al, 1999) and CDKL5 (Weaving et al, 2004). Although the
functions of FOXG1, MECP2 and CDKL5 have been studied individually, not much is
known about their relation to each other with respect to expression levels and
regulatory regions. Using the big data repository of FANTOM5, we set out to identify
the promoter characteristics of each gene in human and mouse, as well as the other
possible common features related to the core promoter region.
23
7 AIMS Employing genome-wide profiling methods we aim to study in depth the promoter
regions to characterize and better understand transcriptional regulatory events in the
context of expression changes and using these approaches to study disease on the
transcriptional level.
7.1 INDIVIDUAL AIMS
Paper I Combining knock-down and deepCAGE to infer genome-wide effects
of the transcription factors.
Paper II Apply the method used in paper I to DYX1C1 and infer the genome-
wide effects of its perturbation.
Paper III Using human post-mortem brain samples, define promoter-level
differences on the spatio-temporal level using single-molecule sequencer CAGE data.
Paper IV Using the wide set of samples, define the promoter regions, expression
levels and shared regulatory level features of 3 genes implicated in Rett syndrome.
24
8 PRESENT INVESTIGATION
8.1 COMBINING SIRNA PERTURBATION AND DEEPCAGE GIVES US INSIGHT INTO TRANSCRIPTIONAL REGULATORY NETWORKS (PAPER I)
In this paper, we knocked down the 4 key transcription factors IRF8, MYB, PU.1 and
SP1 in the human monoblastic leukemia cell line THP-1 (Tsuchiya et al, 1980). The
capped RNAs in the knockdown and control samples were captured by CAGE and
sequenced using the Roche 454 sequencer.
Since microarray experiments done on the same RNA samples were available through
the FANTOM4 project (Suzuki et al, 2009), first we compared the fold changes of the
perturbed genes for both the microarrays and CAGE. We found an overall positive
correlation for all four TF knockdown samples across both technologies. In general,
CAGE fold changes were greater than those measured by microarrays, as has been
previously noted (deHoon and Hayashizaki, 2008).
Knockdown of SP1, IRF8, PU.1 and MYB led to induction of 267, 347, 189 and 307
genes and repression of 428, 527, 260 and 1160 genes by 1.5-fold up- or down-
regulation, respectively. We used the top 50 of each set of perturbed promoters to
search for novel motifs using de-novo motif finder MEME (Bailey et al, 2006). Our
results were consistent with the expected roles of the TFs. For example, we find that
knockdown of IRF8, a known activator (Meraro et al, 2002), results in down-regulation
in both the deepCAGE and microarray experiments of XAF1, a gene which we predict
to contain our novel motif. The observation that MYB knockdown yielded motifs for
both up- and down-regulated sets is consistent with its known role as both a
transcriptional activator and repressor (Luscher and Eisman, 1990).
We assessed if our motifs truly describe functional sites by comparing the expression
fold changes of the TSSs containing the motifs. Since we had replica for microarray
data only, we used microarray expression for these measurements, although we got no
discernable differences when using just the CAGE values. We found the most
interesting results in the IRF8 and PU.1 down-regulated sets and the motifs we found
there. Promoters containing those motifs were expressed at significantly lower levels
than promoters lacking the motif. Furthermore, our motif out-performed known motifs
present in the Transfac database (Matys et al, 2006) for PU.1 and IRF8, as well as PU.1
ChIP data from the same cell line. Checking the conservation of our motifs, we find
that 32.8 % (PU.1) and 35.5% (IRF8) of their base positions are strictly conserved
25
compared to the 3–8% average overall conservation and 11–24% conservation in
coding regions.
Our found motifs were longer than the known ones present in the databases. Tested this
by truncating the motifs to be of the same length, we lost specificity leading us to
confirm our longer. Additionally, we found an overlap between down-regulated TSSs
in both PU.1 and IRF8 (44 TSSs) that contain both motifs overlapping each other.
Here, we found confirmation by already published data on the combinatorial regulation
properties of these two TFs (Meracki and Fenton 2000; Meraro et al, 2002).
Finally, we constructed a promoter based gene regulatory network led by our
confirmation that the most down-regulated genes contain the motifs linked to TFs. In
this network, we included only genes that were perturbed upon knockdown of at least 2
out of 4 TFs. Genes co-regulated by PU.1 and IRF8 were predominantly co-
downregulated upon knockdown. Interestingly, there is an antagonistic relationship for
genes co-regulated by PU.1 and MYB, with the majority downregulated upon PU.1 KD
but up-regulated upon MYB knockdown.
In this paper we have established the knockdown (KD) CAGE technology and
demonstrated that it can be used to determine de novo TFBS as well as build promoter
based networks. Compared to ChIP technology, we can identify sites that are
influenced by TF KD, with ChIP identifying sites where the TF is bound but not
necessarily functionally active (Wasserman and Sandelin, 2004). However, combining
these two approaches could create a powerful method to discriminate indirect targets
from direct targets bound by factors at both proximal and distal sites including
enhancers and insulators.
8.2 PERTURBATION STUDIES OF DYX1C1 REVEAL ITS INVOLVEMENT
IN NEURONAL MIGRATION PATHWAYS (PAPER II)
In the previous paper we explored the properties of knockdown of known TFs to infer
regulatory networks of perturbed genes. In this study, we applied this knowledge to
DYX1C1, a dyslexia candidate gene and analyzed molecular networks of DYX1C1
with global transcriptome and protein interaction assays.
We perturbed DYX1C1 in the neuroblastoma SH-SY5Y cells and investigated the
global transcriptome changes using the Illumina HT-12v4 expression beadchip arrays.
We detected 379 probes corresponding to 357 genes with significant differential
expression in the DYX1C1 overexpressed cell line compared with control SH-SY5Y,
207 of these probes were up-regulated, and 172 were down-regulated. Genes previously
26
linked to neuronal differentiation and migration, RELN and ASL1 (D’Arcangelo et al,
1999; Dixit et al, 2011), were the most upregulated and downregulated. In the siRNA
samples, siDYX1C1 was compared with siControl, revealing 88 differentially
expressed probes corresponding to 87 genes, of which 15 probes were upregulated, and
73 were downregulated. In total, 30 genes including PDGFRA, SNAP91, CUX2, GAL,
IL11RA, OLFM1, and PDS5A were differentially expressed in both comparisons. To
check these genes for common features and put them into context, we examined the
gene ontology (GO) enrichment. The upregulated genes of the overexpression
experiment showed the most significant enrichment in the biological process GO terms
“cellular component movement”, “cell migration”, and “nervous system development”.
Interestingly, a total of 18 genes were classified in the “cell migration” term, and 6 of
those genes (TWIST1, RELN, PHOX2B, NRCAM, DCX, and PXMP3I) are part of the
“neuron migration” term, which is another confirmation of previous involvement of
neuronal migration role of DYX1C1 (Wang et al, 2006). Additionally, the GO term
“nervous system development” was also significantly enriched in the siDYX1C1 list of
downregulated genes, with a total of 17 of the 73 genes in that term. The “cell
migration” GO term was not significantly enriched when analyzing the siDYX1C1
downregulated gene list but, in the cellular component category, the “cell leading edge”
term was significantly enriched, suggesting that also knockdown of DYX1C1 affects
genes important for cell migration. We also looked for enrichment in the Kyoto
Encyclopedia of Genes and Genomes pathways (KEGG) and found overrepresentations
for genes in “cell cycle pathway” for both experiments. Interestingly, the “focal
adhesion pathway” was also upregulated significantly in the overexpression cell line.
Given that focal adhesion constitutes a core machinery of cell migration (Lock et al,
2008), this further strengthens the notion that DYX1C1 controls cell migration.
Another significant term present in both experiments was “pathways in cancer”,
connecting to the previous suggestion of DYX1C1 being involved in brest and colon
cancers (Chen et al, 2009; Kim et al, 2009).
To better characterize DYXC1’s function and involvement in pathways, we looked for
its protein interacting partners using co-immunoprecipitation combined with protein
identification with nano–liquid chromatography coupled with tandem mass
spectrometry (LC-MS/MS). We identified 66 new proteins associated with DYX1C1,
24 of which were identified in at least two independent experiments. To infer the
DYX1C1 protein interaction network, we searched Pathways commons database
(Cerami et al, 2011) and found that 43 of the proteins in the DYX1C1 interactome have
27
previously been shown to interact with each other. The high connectivity of the proteins
suggested that DYX1C1 might participate in multiprotein complexes. Again, we
checked for GO term enrichment and found that “microtubule based process” and
“microtubule organizing center organization” were among the most significant
biological processes, again pointing toward a role for DYX1C1 in cell migration. The
analysis of GO category “cellular component” showed a significant overrepresentation
of cytoskeletal proteins, more specifically microtubule proteins among the DYX1C1
associated proteins. Centrosomal proteins such as CEP170, CENPJ, and NPM1 were
among them and in other results we could also find that iDYX1C1 localizes to the
centrosome when overexpressed. These characteristics are similar to those of other
neuronal migration genes that promote the recruitment, stabilization, and organization
of microtubules and actin that eventually drive neuronal migration and cell division
(Liu SJ, 2011).
Additionally in this work, we identified a novel highly conserved protein domain in
DYX1C1 of 43 residues that we called the “DYX1 domain”. Position specific iterated-
blast searches did not detect this domain in any other protein family.
8.3 THE PROMOTER LEVEL ATLAS OF SPECIFIC TRANSCRIPTS AS
WELL AS SPATIO-TEMPORAL COMPARISONS IN HUMAN BRAIN (PAPER III)
As part of the FANTOM5 project, a set of 15 brain regions from post-mortem
individuals, one infant and 3 adults, were sequenced using CAGE on the Heliscope
single molecule sequencer.
Using the advantage of all FANTOM5 samples profiled with the same technology, we
compared the brain samples to all the other samples in the FANTOM5 human tissue
collection. Using multi-dimensional scaling, we could see clear difference between
brain samples and all the other samples. Looking at data subsets, such as only
expression TF, enhancer expression, non-coding transcripts or expression coming from
repeat regions, we were able to consistently observe this difference between brain and
other tissues. These results show that the brain specific expression signature is
distinctive with respect to other tissues, not only on the level of coding genes but also
on non-coding transcripts or transcriptional regulators.
Attempting to explain these differences, we compared the cumulative distribution of
tags accounted for by the 10,000 most highly expressed TSSs in each tissue sample.
The obtained results suggest that brain has a more complex and diversified
28
transcriptome compared to other tissues, which is additionally proven with calculations
of transcriptional complexity where brain samples significantly different from and
score higher than other tissues. Through differential expression analysis between brain
and other tissues, we observe that one third of all transcripts are more highly expressed
in brain and thus brain-specific. GO term analysis in this set reveals the terms for
neurological system processes and transmission of nerve pulse. Additional important
differences between brain and other tissues are brain specific alternative promoters. We
identified 589 mRNA isoforms for genes expressed in brain but not in other tissues
including some TFs.
Our samples comprised of one infant individual and 3 adults. To look for detailed
differences on the temporal level, we performed again differential expression analysis
between these two groups. Notably, over a quarter of the genes expressed in brain
contain at least one differentially expressed TSS; most of these genes display both an
infant or adult specific TSS as well as a non differentially expressed TSS (82.1%),
while the remaining TSSs are exclusively expressed in one of the two age extremes.
This shows that alternative TSS usage importantly contributes to the differences
observed between infant and adult transcriptomes and suggests that the expression of
specific mRNAs is differentially regulated in the two age extremes. Another interesting
result is that about 20% of differentially expressed TSSs originate from non-coding
RNA loci and 11% from intergenic regions, meaning that a lot of the difference comes
from previously uncharacterized TSSs or those stemming from genes with unknown
function.
In order to assess individual differences in expression between brain regions in the
adult, we performed differential expression analysis between all the pairs of regions
available. The brain region with the largest number of differentially expressed TCs and
the largest fold changes is cerebellum. We observed that expression signatures were not
characteristic of a single region but tended to be shared by groups of regions with
related developmental derivation, functions or projections, consistent with previous
reports (Hawrylycz et al, 2012). We separated the signal then in 4 distinct groups, each
of them containing genes that are known markers for the regions they are expressed in:
1) frontal, temporal, parietal and occipital lobes, hippocampus and amygdala (cortex-
limbic system) 2) caudate and putamen (striatum), 3) cerebellum, 4) thalamus, globus
pallidus, substantia nigra, locus coeruleus, spinal cord and medulla oblongata (brain
stem-basal ganglia). For each of these groups we identified TFs that are differentially
expressed. Often these TFs were enriched in more than one group but these differences
29
were driven by group specific alternative promoters. We also built regulatory
interaction networks for each TF group and were able to confirm known interactions
for the majority of TFs in the group (average of 66%).
Overall we have classified brain specific expression signal on the promoter level into
different sections (adult, infant, brain region group), which leaves us with 67% of genes
that are highly expressed in brain when compared to other tissues as the brain
expression signal not explained by any other comparison. We have also pointed out that
many of the differences in brain expression result from poorly annotated or poorly
characterized regions of the genome. Further research in this regions could give novel
findings of brain specific genes.
8.4 CHARACTERIZING RETT DISEASE GENES ON THE PROMOTER
LEVEL (PAPER IV)
In contrast to the previous study that was based on characterizing various aspects of and
contrasting a vast amount of, data, in this study we picked 3 genes specific for Rett
syndrome. We used the FANTOM5 data for human and mouse for in detail
characterization the promoters, regulators and expression patterns of these three genes.
First, we identified CAGE-derived TSSs for all 3 genes in both human and mouse. We
identified a novel main promoter in mouse for Foxg1. Both human and mouse had high
expression of Foxg1 in brain, but intriguingly, expression was absent in the cerebellum
samples. Analyzing ENCODE DNAse-I hypersensitive sites and active promoter
histone marks (H3K4me3) available for mouse, we found evidence of silencing of
FoxG1 by the PRC2 complex in the cerebellum. For Mecp2, we identified two TSSs in
both human and mouse (with an exception of a third lowly expressed TSS expressed
exclusively in blood primary cells, particularly in CD14 monocytes). We found Mecp2
to be ubiquitously expressed in all tissues and not just the brain. For Cdkl5 we also
found 2 TSSs for both species, also expressed ubiquitously.
We compared all the TSSs of these 3 genes for correlations in expression levels and
found that Mecp2 and Cdkl5 are more highly correlated to each other than they are to
Foxg1. Additionally, the expression of main TSSs of Foxg1 and Mecp2 are in contrast
to each .
Using Encode ChIP data we additionally characterized the mouse promoters for the
presence of enhancer or promoter markers. For all the main promoters of the 3 genes,
we find enhancer marks close by in the mouse, while for human, using the enhancer
30
data of FANTOM5, we find 4, 14 and 1 significantly correlated enhancers for FOXG1,
MECP2 and CDKL5 respectively.
When we characterized the promoter shapes of all the TSSs, we found that most of
them are broad, consistent with their connection to CpG islands. We also found a
strong conservation of promoter shape across species, particularly visible in the highest
expressed TSS of FOXG1.
We calculated also the probabilities of having the same TFs regulate the three genes.
Our data reveal that the sequence region around the main promoter of FOXG1 in
human is significantly enriched in binding sites for the RREB1 (p = 0.01), FOXP1 (p =
0.03), and NFY (p = 0.01) transcription factors. NFY is also predicted to regulate
MECP2 (p = 0.01) and possibly CDKL5 (p = 0.09). In mouse, for all three genes the
promoter regions are enriched for motifs associated with transcription factor NFY, as
well as Sp1.
FOXG1 and MECP2 both are TFs and thus binding DNA at the promoter regions.
Using the expression data of the whole FANTOM5 we checked their motif activities
(ref). Although FOXG1 is expressed mostly in brain tissues, its motif activity did not
show any significant difference between brain and other tissues in either human or
mouse (human p <= 0.2738, mouse p <= 0.3272). In contrast, the motif activity of
MECP2 is significantly lower in brain compared to other tissues both in human and
mouse (human p <= 1.019e-10, mouse p <= 0.0005343), consistent with a role of
MECP2 as a negative regulator in brain.
Our comprehensive analyses of the data from the FANTOM5 project reveal that
although the three genes are related by disease phenotype, their genomic architecture,
expression and regulation are independent of each other. Thus intersecting molecular
pathways likely cause the overlapping phenotypes seen in Rett patients.
31
9 CONCLUSIONS AND PERSPECTIVES Through these papers we used the power of CAGE in conjunction with next-generation
sequencing to define the promoter region of genes, regulatory element binding sites as
well as alternative promoter usage depending on different states.
In paper I we developed a method combining siRNA knockdown and sequencing based
CAGE to show we can accurately predict genomic loci where TFs are actively
regulating transcription. We then applied this same approach to a gene linked to a
disease but without completely known function and without a known DNA binding
site. Even without a TF function, we could still derive the downstream effects of
perturbing DYX1C1.
For papers III and IV we used the FANTOM5 database of tissues and cells. In paper III
we used this to make global conclusions about differences in regulation between i)
brain and other tissues, ii) adult and infant brain as well as iii) different adult brain
regions. Using an opposite approach, in paper IV we started with 3 previously not
associated genes and investigated their detailed promoter-level functionality using the
database of tissues and cells. This way we have shown how the same data repository
can be used for more global questions as well as specific questions such as the common
characteristics of three genes.
This approach has shown us that genome-wide studies and quantitative measures can
give a glance at to why the cells are different and what might be the underlying
mechanisms. To gain further details, additional studies that would involve
complementary methods such as RNA-Seq to give us an idea if the alternative TSS we
find do give different protein products in the end. Of course, in complex disorders we
should not forget the potential influences of other factors including non-coding RNAs,
enhancers, epigenetics or repeat regions.
The advent of next-generation sequencing has brought us into an era of vast biological
data. The advances in sequencing technologies and lowering of costs in general has
brought us closer to clinical application of these technologies. Main goal in this area is
to develop diagnostic tools that medical doctors can use in everyday work with patients
to quickly diagnose or classify a disease. This would particularly be necessary to end
32
the 'diagnostic odyssey': the grueling, painful, expensive and sometimes decades-long
journey from negative test to negative test, failing to diagnose a rare disease. Currently
methods are being developed with exome sequencing as a diagnostic tool with 25% of
diagnosis rate for now (Glusman G, 2013). Additional diagnostic methods can rely in
developing un-invasive ways to diagnose a patient that would normally require invasive
procedures, such as identifying markers in the blood that are quick to be checked by
clinical personnel. The miniaturization of sequencing machines is also leading to this
point that dektop sequencers for small samples would be available to clinicians.
Good communication needs to be established between the lab and the clinic for both to
profit from it. The clinician could this way provide valuable disease samples which in
turn could lead to better diagnostic methods or even potentially to identify intervention
points for drug treatment.
Another novel topic in this field, which arose due to lowering costs of sequencing and
the ability to take small amounts of RNA, is single cell sequencing. It is a common
perception that expression in a tissue is an average of the expression of all the single
cells making it up. First single cell studies have found genes can be highly expressed in
some cells while they are virtually not at all expressed in other cells of the same cell
type possibly resulting from expression bursts. Not only is the biology of single cells
still poorly understood but also the methods required to obtain single cells (often
manually) are complicated and it is hard to separate cells but still keep the information
about their cross-talk to be visible in the sequencing step.
The methods described here are basic science that is gradually turning toward clinical
samples and clinical application. Hopefully, the average patient will be able to soon
benefit from these services and have the diagnostics and treatment be speeded up with
these technologies.
33
10 ACKNOWLEDGEMENTS I am grateful to have been given the opportunity to work towards my PhD in a joint
graduate program of RIKEN, Japan and Department of Cell and Molecular Biology,
Karolinska Institutet, Sweden. This has been an amazing experience and I have been
lucky and fortunate to be working with such fantastic people all around the world.
First of all, to Carsten Daub, my supervisor. Thank you for being so positive from the
beginning and embarking on this long journey with me, bringing me to Japan and then
connecting me to Sweden. Thank you for your guidance, advice (both on science and
life) and discussions. This whole journey was a big learning experience and your calm
composure helped make it all possible and very fun. To Juha Kere, my mentor. Thank
you for your words of advice throughout these years and for encouraging me to push
forward. I am looking forward to our future plans. To Björn Andersson, my co-
supervisor, thank you for your support. To Matti Nikkola, head of studies at CMB.
Thank you for you support for this program through these years, you have always been
there to help us and show us the hoppi happy way. To Yoshihide Hayashizaki, thank
you for having me at your center and helping us out in realizing this joint graduate
program, I feel very privileged to have been able to do my work at the OSC.
Throughout my studies I have been supported by the International Program Associate
Grant from RIKEN and by a grant from the Frankopani Foundation. A special thank
you also goes out to the administrative staff that also made this collaboration possible,
especially Reiji Nagashima, from the GRO at RIKEN, thank you for your support of
this project and making the contract between RIKEN and KI possible.
I have had the best and most amazing Lab during my stay at the OSC. I will never
forget the great times I had with the bioinformatics group and the amazing people I
met, you were more than co-workers and without your support I would not have been
here today. Timo, thank you for your patience with me and teaching me the ropes in
that first year, I learned a lot about science and what to focus on to progress in it.
Alistair, thank you for your encouragement at tough times, scientific discussions and
overall positive support, I look forward to many more discussion over beer in the
future! Michiel, thank you for teaching me statistics on the serious side and for
exploring ‘culture’ with me on the fun side. I did miss the Yamathon this year, but I am

34
sure we can come up with some equivalent for it in Europe when we meet again. Erik,
thank you for always being so positive and encouraging, your words helped in the
tough times. Nicolas, thank you for the advice, doing weird configurations for me and
overall support. Kawaji-san, thank you for the support and student journal club
starting, I learned a lot in that seminar series about presentations and critical opinion.
My dear Marina, thank you so so much for being a great friend and co-worker through
these years, don’t know what I would have done without you! Keep up the good work
and I hope you find your shining star soon! Andrew, thank you for the one year of
awesome mayhem and for all the fun gaming, drinking and talking, some jokes will
never get old! Mickaël, don’t know what I would have done about that zombie
infestation without you! Thank you for the fun times, we need to meet up sometime to
finish the game. Jessica, thank you for your friendship, support and company during
the late working hours. I always enjoyed going to your DJs and talking about music and
life with you! Jordan, dude, it was short, but so much fun! Thank you for your
continued support and middle of the night messages of support during my writing
period. Jayson, though we did not hang out as much as we planned, I still enjoyed our
little talks and complaining sesions. Ohmiya-san, it was a great experience to work
with you on a project, I hope you get to work on many more interesting projects.
Hasegawa-san thank you for your support always and your bright attitude. Bogumil,
Serkan, Makis, thank you guys for your support over the short period we worked
together.
To some ex-lab members. Thierry, thank you for your company through all the
different activities. I am looking forward to making the Europe plans come true. Max,
thank you for teaching me things during your stay at the OSC, I wish you all the best in
your endeavors . Eivind and Joost, you guys made my first year in Japan, we has so
much fun, thank you also for waiting for me to finish my late evening entrance exam to
celebrate over some iconic doughnuts. Sylvia, I won’t forget our fun times when you
stayed with us and all the different stories we shared, I am looking forward to seeing
you again soon, XOXO. Owen, what can I say, not fair you coming to visit after I left,
hope we can make up for it somewhere in Europe. Sebastian, thank you for improving
my coding skills and enthusiasm for the small project. Nancy, it was nice to have you
with us for a short stay, hopefully we can enjoy a great Stockholm summer this year.
Jenny, thank you for your support during your short stay, I hope you also choose your
path and pursue it in the future. Helena, thank you for the pancakes and discussions!

35
To my Yuripong. It is hard now to imagine having lunch at work without you and your
calm perspective of things. Thank you for all your trust, support and humor over this
time, you helped me see the fun side of even the hardest moments.
Many other members of the OSC have contributed to make my stay in Japan more
enjoyable either scientifically or as friends. Piero, thank you for your support of my
ideas and guidance on the general perspective. I always enjoyed your enthusiasm for
science and I hope I can keep that spark going also in myself. Yuki-chan, you are
amazing and so sweet! Thank you for all the good times and the incredible support,
never change and good luck with your future projects! Dave, my basketball buddy, we
had so much fun at the practice and tournaments, please keep up the good work and the
trophy in our hands. Also, thank you for the bioinformaticy discussions and advice! To
a certain group of misfits whose natural habitat is the Fantom Bar, Hazuki, Ana, Ale,
Giovanni, Marco. Thank you for the sometimes very much needed distractions from
the gruelling science and for the fun beer and churrasco times we shared. Diane, thank
you for the super nice mousse and always being so positive. Kimura-san, thank you for
the basketball fun and overall sports discussions. Linda, draga moja hvala na svoj
pomoci i nadam se da ce ti daljni posao biti uspjesan! My and Hanna, thank you for
your help, support and enthusiasm through these years. Tsugumi-san, thank you for
your support, especially during the quake time, I really enjoyed your company.
I was also lucky to work with some amazing collaborators during my studies. Marghi,
I could not have wished for a more fun collaborator or a better friend, working with you
on ‘our’ projects was always both fun and intense, thank you for your continued
support and for cheering me on, so looking forward to meet again soon. Peter, thank
you having me work on your amazing data and for you support and advice. Alka, thank
you for the great support and work on the Rett project, I learned so much from you.
Also thank you for your ‘women in science’ perspective. Kristiina, thank you for the
dyslexia work and for your continued support. I hope we can still make some more nice
papers out of this collaboration. Isabel, thank you for the fun discussion and teaching
me so much more about dyslexia genes. Robin, thank you for the enhancer analysis for
the papers. Albin, thank you for your support for the papers and sharing advice with
me.

36
Finally, to my friends outside of work. Living these years in Japan I was a very lucky
person to meet absolutely fantastic friends in such a short time. My girls from pole
dance really made my free time so much more fun and cheerful, I will never forget the
farewell party in kimonos you organized and the way you escorted me to the airport
when I left Japan. Thank you for everything Momo, Chika, Juri, Rico, Rachel, Rena,
Yumi, Kanae, Tsuji-chan, Ai, Mariko, Sayo, Marzena,
みなさんのおかげで東京での⽣活が楽しい充実したものとなりました。
⼼から感謝しています。また会える⽇を楽しみにしています
My friends back home in Croatia, many of you came to visit me during the studies and
kept in touch through the years. I look forward to catching up with everyone again. A
big thank you to my Ana for always being there, even through Skype. We celebrate 20
years of friendship this year my dear, I look forward to welcoming you in Stockholm.
Damir, thank you for making the cover page for me and for making me laugh in the
hard times.
Finally, to my parents, thank you for being so supportive of me through my whole life
and especially for letting me embark on this dream. You have taught me some basic
values that I hope I will be able to live up to all my life. I hope we get to share many
many more happy moments together. Piceki, uspjeli smo!
37
11 REFERENCES Amir, R. E., Van den Veyver, I. B., Wan, M., Tran, C. Q., Francke, U., & Zoghbi, H. Y. (1999). Rett syndrome is caused by mutations in X-linked MECP2, encoding methyl-CpG-binding protein 2. Nature genetics, 23(2), 185–188.
Ariani, F., Hayek, G., Rondinella, D., Artuso, R., Mencarelli, M. A., Spanhol-Rosseto, A., et al. (2008). FOXG1 is responsible for the congenital variant of Rett syndrome. American journal of human genetics, 83(1), 89–93.
Ayub, M., & Bayley, H. (2012). Individual RNA base recognition in immobilized oligonucleotides using a protein nanopore. Nano letters, 12(11), 5637–5643.
Bailey, T. L., Williams, N., Misleh, C., & Li, W. W. (2006). MEME: discovering and analyzing DNA and protein sequence motifs. Nucleic acids research, 34(Web Server issue), W369–73.
Bentley, D. R., Balasubramanian, S., Swerdlow, H. P., Smith, G. P., Milton, J., Brown, C. G., et al. (2008). Accurate whole human genome sequencing using reversible terminator chemistry. Nature, 456(7218), 53–59.
Bork, P., & Copley, R. (2001). The draft sequences. Filling in the gaps. Nature, 409(6822), 818–820.
Branton, D., Deamer, D. W., Marziali, A., Bayley, H., Benner, S. A., Butler, T., et al. (2008). The potential and challenges of nanopore sequencing. Nature biotechnology, 26(10), 1146– 1153.
Brivanlou, A. H., & Darnell, J. E. (2002). Signal transduction and the control of gene expression. Science (New York, N.Y.), 295(5556), 813–818.
Carninci, P., Kasukawa, T., Katayama, S., Gough, J., Frith, M. C., Maeda, N., et al. (2005). The transcriptional landscape of the mammalian genome. Science (New York, N.Y.), 309(5740), 1559–1563.
Carninci, P., Sandelin, A., Lenhard, B., Katayama, S., Shimokawa, K., Ponjavic, J., et al. (2006). Genome-wide analysis of mammalian promoter architecture and evolution. Nature genetics, 38(6), 626–635.
Cerami, E. G., Gross, B. E., Demir, E., Rodchenkov, I., Babur, O., Anwar, N., et al. (2011). Pathway Commons, a web resource for biological pathway data. Nucleic acids research, 39(Database issue), D685–90.
Chahwan, R., Wontakal, S. N., & Roa, S. (2011). The multidimensional nature of epigenetic information and its role in disease. Discovery medicine, 11(58), 233–243.
Chen, Y., Zhao, M., Wang, S., Chen, J., Wang, Y., Cao, Q., et al. (2009). A novel role for DYX1C1, a chaperone protein for both Hsp70 and Hsp90, in breast cancer. Journal of cancer research and clinical oncology, 135(9), 1265–1276.
Cock, P. J. A., Fields, C. J., Goto, N., Heuer, M. L., & Rice, P. M. (2010). The Sanger FASTQ file format for sequences with quality scores, and the Solexa/Illumina
38
FASTQ variants. Nucleic acids research, 38(6), 1767–1771.
Collas, P. (2010). The current state of chromatin immunoprecipitation. Molecular biotechnology, 45(1), 87–100.
Crick, F. (1970). Central dogma of molecular biology. Nature, 227(5258), 561–563. D'Arcangelo, G., Homayouni, R., Keshvara, L., Rice, D. S., Sheldon, M., & Curran, T. (1999).Reelin is a ligand for lipoprotein receptors. Neuron, 24(2), 471–479.
de Hoon, M., & Hayashizaki, Y. (2008). Deep cap analysis gene expression (CAGE): genome- wide identification of promoters, quantification of their expression, and network inference. BioTechniques, 44(5), 627–8– 630– 632.
Deaton, A. M., & Bird, A. (2011). CpG islands and the regulation of transcription. Genes & development, 25(10), 1010–1022.
Dixit, R., Zimmer, C., Waclaw, R. R., Mattar, P., Shaker, T., Kovach, C., et al. (2011). Ascl1 participates in Cajal-Retzius cell development in the neocortex. Cerebral cortex (New York, N.Y. : 1991), 21(11), 2599–2611.
Djebali, S., Davis, C. A., Merkel, A., Dobin, A., Lassmann, T., Mortazavi, A., et al. (2012). Landscape of transcription in human cells. Nature, 489(7414), 101–108.
Elkon, R., Linhart, C., Sharan, R., Shamir, R., & Shiloh, Y. (2003). Genome-wide in silico identification of transcriptional regulators controlling the cell cycle in human cells. Genome research, 13(5), 773–780.
ENCODE Project Consortium, Birney, E., Stamatoyannopoulos, J. A., Dutta, A., Guigó, R., Gingeras, T. R., et al. (2007). Identification and analysis of functional elements in 1% of the human genome by the ENCODE pilot project. Nature, 447(7146), 799–816.
ENCODE Project Consortium, Dunham, I., Kundaje, A., Aldred, S. F., Collins, P. J., Davis, C. A., et al. (2012). An integrated encyclopedia of DNA elements in the human genome. Nature, 489(7414), 57–74.
FANTOM Consortium, Suzuki, H., Forrest, A. R. R., van Nimwegen, E., Daub, C. O., Balwierz, P. J., et al. (2009). The transcriptional network that controls growth arrest and differentiation in a human myeloid leukemia cell line. Nature genetics, 41(5), 553–562.
Frith, M. C., Ponjavic, J., Fredman, D., Kai, C., Kawai, J., Carninci, P., et al. (2006). Evolutionary turnover of mammalian transcription start sites. Genome research, 16(6), 713– 722.
Gerstein, M. B., Kundaje, A., Hariharan, M., Landt, S. G., Yan, K.-K., Cheng, C., et al. (2012). Architecture of the human regulatory network derived from ENCODE data. Nature, 489(7414),91–100.
Glusman G. (2013) Clinical applications of sequencing take center stage. Genome Biology, 14:303
Hawrylycz, M. J., Lein, E. S., Guillozet-Bongaarts, A. L., Shen, E. H., Ng, L., Miller, J. A., et al. (2012). An anatomically comprehensive atlas of the adult human brain
39
transcriptome. Nature, 489(7416), 391–399.
Hurwitz, J. (2005). The discovery of RNA polymerase. The Journal of biological chemistry, 280(52), 42477–42485.
Jolma, A., Kivioja, T., Toivonen, J., Cheng, L., Wei, G., Enge, M., et al. (2010). Multiplexed massively parallel SELEX for characterization of human transcription factor binding specificities. Genome research, 20(6), 861–873.
Jolma, A., Yan, J., Whitington, T., Toivonen, J., Nitta, K. R., Rastas, P., et al. (2013). DNA- binding specificities of human transcription factors. Cell, 152(1-2), 327–339.
Kanamori-Katayama, M., Itoh, M., Kawaji, H., Lassmann, T., Katayama, S., Kojima, M., et al. (2011). Unamplified cap analysis of gene expression on a single-molecule sequencer. Genome research, 21(7), 1150–1159.
Katayama, S., Tomaru, Y., Kasukawa, T., Waki, K., Nakanishi, M., Nakamura, M., et al. (2005). Antisense transcription in the mammalian transcriptome. Science (New York, N.Y.), 309(5740), 1564–1566.
Kim, Y.-J., Huh, J.-W., Kim, D.-S., Bae, M.-I., Lee, J.-R., Ha, H.-S., et al. (2009). Molecular characterization of the DYX1C1 gene and its application as a cancer biomarker. Journal of cancer research and clinical oncology, 135(2), 265–270.
Kodzius, R., Kojima, M., Nishiyori, H., Nakamura, M., Fukuda, S., Tagami, M., et al. (2006). CAGE: cap analysis of gene expression. Nature methods, 3(3), 211–222.
Ladunga, I. (2010). An overview of the computational analyses and discovery of transcription factor binding sites. Methods in molecular biology (Clifton, N.J.), 674, 1–22.
Langmead, B., Trapnell, C., Pop, M., & Salzberg, S. L. (2009). Ultrafast and memory-efficient alignment of short DNA sequences to the human genome. Genome biology, 10(3), R25.
Lee, M. L., Kuo, F. C., Whitmore, G. A., & Sklar, J. (2000). Importance of replication in microarray gene expression studies: statistical methods and evidence from repetitive cDNA hybridizations. Proceedings of the National Academy of Sciences of the United States of America, 97(18), 9834–9839.
Lee, W., Jiang, Z., Liu, J., Haverty, P. M., Guan, Y., Stinson, J., et al. (2010). The mutation spectrum revealed by paired genome sequences from a lung cancer patient. Nature, 465(7297), 473–477.
Lenhard, B., Sandelin, A., & Carninci, P. (2012). Metazoan promoters: emerging characteristics and insights into transcriptional regulation. Nature Reviews Genetics, 13(4), 233–245.
Leung, Y. F., & Cavalieri, D. (2003). Fundamentals of cDNA microarray data analysis. Trends in genetics : TIG, 19(11), 649–659.
Li, H., & Durbin, R. (2010). Fast and accurate long-read alignment with Burrows-Wheeler transform. Bioinformatics (Oxford, England), 26(5), 589–595.
40
Li, H., Handsaker, B., Wysoker, A., Fennell, T., Ruan, J., Homer, N., et al. (2009). The Sequence Alignment/Map format and SAMtools. Bioinformatics (Oxford, England), 25(16), 2078–2079.
Li, H., Ruan, J., & Durbin, R. (2008). Mapping short DNA sequencing reads and calling variants using mapping quality scores. Genome research, 18(11), 1851–1858.
Li, J.-W., Schmieder, R., Ward, R. M., Delenick, J., Olivares, E. C., & Mittelman, D. (2012). SEQanswers: an open access community for collaboratively decoding genomes. Bioinformatics (Oxford, England), 28(9), 1272–1273.
Lifton, R. P., Goldberg, M. L., Karp, R. W., & Hogness, D. S. (1978). The organization of the histone genes in Drosophila melanogaster: functional and evolutionary implications. Cold Spring Harbor symposia on quantitative biology, 42 Pt 2, 1047–1051.
Liu, J. S. (2011). Molecular genetics of neuronal migration disorders. Current neurology and neuroscience reports, 11(2), 171–178.
Liu, L., Li, Y., Li, S., Hu, N., He, Y., Pong, R., et al. (2012). Comparison of next-generation sequencing systems. Journal of biomedicine & biotechnology, 2012, 251364.
Lock, J. G., Wehrle-Haller, B., & Strömblad, S. (2008). Cell-matrix adhesion complexes: master control machinery of cell migration. Seminars in cancer biology, 18(1), 65–76.
Lüscher, B., & Eisenman, R. N. (1990). New light on Myc and Myb. Part II. Myb. Genes & development, 4(12B), 2235–2241.
Mardis, E. R. (2008). The impact of next-generation sequencing technology on genetics. Trends in genetics : TIG, 24(3), 133–141.
Marecki, S., & Fenton, M. J. (2000). PU.1/Interferon Regulatory Factor interactions: mechanisms of transcriptional regulation. Cell biochemistry and biophysics, 33(2), 127–148.
Margulies, M., Egholm, M., Altman, W. E., Attiya, S., Bader, J. S., Bemben, L. A., et al. (2005). Genome sequencing in microfabricated high-density picolitre reactors. Nature, 437(7057), 376– 380.
Massinen, S., Tammimies, K., Tapia-Páez, I., Matsson, H., Hokkanen, M.-E., Söderberg, O., et al. (2009). Functional interaction of DYX1C1 with estrogen receptors suggests involvement of hormonal pathways in dyslexia. Human molecular genetics, 18(15), 2802–2812.
Matys, V., Kel-Margoulis, O. V., Fricke, E., Liebich, I., Land, S., Barre-Dirrie, A., et al. (2006). TRANSFAC and its module TRANSCompel: transcriptional gene regulation in eukaryotes. Nucleic acids research, 34(Database issue), D108–10.
Meraro, D., Gleit-Kielmanowicz, M., Hauser, H., & Levi, B.-Z. (2002). IFN-stimulated gene 15 is synergistically activated through interactions between the myelocyte/lymphocyte-specific transcription factors, PU.1, IFN regulatory factor-
41
8/IFN consensus sequence binding protein, and IFN regulatory factor-4: characterization of a new subtype of IFN-stimulated response element. Journal of immunology (Baltimore, Md. : 1950), 168(12), 6224–6231.
Metzker, M. L. (2010). Sequencing technologies - the next generation. Nature Reviews Genetics, 11(1), 31–46.
Meyer, L. R., Zweig, A. S., Hinrichs, A. S., Karolchik, D., Kuhn, R. M., Wong, M., et al. (2013). The UCSC Genome Browser database: extensions and updates 2013. Nucleic acids research, 41(Database issue), D64–9.
Miller, M. B., & Tang, Y.-W. (2009). Basic concepts of microarrays and potential applications in clinical microbiology. Clinical microbiology reviews, 22(4), 611–633.
Nakano, M., Komatsu, J., Matsuura, S.-I., Takashima, K., Katsura, S., & Mizuno, A. (2003). Single-molecule PCR using water-in-oil emulsion. Journal of biotechnology, 102(2), 117–124.
Neph, S., Vierstra, J., Stergachis, A. B., Reynolds, A. P., Haugen, E., Vernot, B., et al. (2012). An expansive human regulatory lexicon encoded in transcription factor footprints. Nature, 489(7414), 83–90.
Neul, J. L., Kaufmann, W. E., Glaze, D. G., Christodoulou, J., Clarke, A. J., Bahi-Buisson, N., et al. (2010). Rett syndrome: revised diagnostic criteria and nomenclature. Annals of neurology, 68(6), 944–950.
Niedringhaus, T. P., Milanova, D., Kerby, M. B., Snyder, M. P., & Barron, A. E. (2011). Landscape of next-generation sequencing technologies. Analytical chemistry, 83(12), 4327– 4341.
Oliphant, A. R., Brandl, C. J., & Struhl, K. (1989). Defining the sequence specificity of DNA- binding proteins by selecting binding sites from random-sequence oligonucleotides: analysis of yeast GCN4 protein. Molecular and cellular biology, 9(7), 2944–2949.
Petryshen, T. L., & Pauls, D. L. (2009). The genetics of reading disability. Current psychiatry reports, 11(2), 149–155.
Pilpel, Y., Sudarsanam, P., & Church, G. M. (2001). Identifying regulatory networks by combinatorial analysis of promoter elements. Nature genetics, 29(2), 153–159.
Reiner, A., Yekutieli, D., & Benjamini, Y. (2003). Identifying differentially expressed genes using false discovery rate controlling procedures. Bioinformatics (Oxford, England), 19(3), 368–375.
Ronaghi, M., Karamohamed, S., Pettersson, B., Uhlén, M., & Nyrén, P. (1996). Real-time DNA sequencing using detection of pyrophosphate release. Analytical biochemistry, 242(1), 84–89.
Rothberg, J. M., Hinz, W., Rearick, T. M., Schultz, J., Mileski, W., Davey, M., et al. (2011). An integrated semiconductor device enabling non-optical genome sequencing. Nature, 475(7356), 348–352.
Sandelin, A., Carninci, P., Lenhard, B., Ponjavic, J., Hayashizaki, Y., & Hume, D. A.
42
(2007). Mammalian RNA polymerase II core promoters: insights from genome-wide studies. Nature Reviews Genetics, 8(6), 424–436.
Sanger, F., Nicklen, S., & Coulson, A. R. (1977). DNA sequencing with chain-terminating inhibitors. Proceedings of the National Academy of Sciences of the United States of America, 74(12), 5463–5467.
Schena, M., Shalon, D., Davis, R. W., & Brown, P. O. (1995). Quantitative monitoring of gene expression patterns with a complementary DNA microarray. Science (New York, N.Y.), 270(5235), 467–470.
Shendure, J., & Lieberman Aiden, E. (2012). The expanding scope of DNA sequencing. Nature biotechnology, 30(11), 1084–1094.
Shendure, J., Porreca, G. J., Reppas, N. B., Lin, X., McCutcheon, J. P., Rosenbaum, A. M., et al. (2005). Accurate multiplex polony sequencing of an evolved bacterial genome. Science (New York, N.Y.), 309(5741), 1728–1732.
Shiraki, T., Kondo, S., Katayama, S., Waki, K., Kasukawa, T., Kawaji, H., et al. (2003). Cap analysis gene expression for high-throughput analysis of transcriptional starting point and identification of promoter usage. Proceedings of the National Academy of Sciences of the United States of America, 100(26), 15776–15781.
Sikder, D., & Kodadek, T. (2005). Genomic studies of transcription factor-DNA interactions. Current opinion in chemical biology, 9(1), 38–45.
Smale, S. T., & Kadonaga, J. T. (2003). The RNA polymerase II core promoter. Annual review of biochemistry, 72, 449–479.
Smith, L. M., Fung, S., Hunkapiller, M. W., Hunkapiller, T. J., & Hood, L. E. (1985). The synthesis of oligonucleotides containing an aliphatic amino group at the 5' terminus: synthesis of fluorescent DNA primers for use in DNA sequence analysis. Nucleic acids research, 13(7), 2399–2412.
Smith, L. M., Sanders, J. Z., Kaiser, R. J., Hughes, P., Dodd, C., Connell, C. R., et al. (1986). Fluorescence detection in automated DNA sequence analysis. Nature, 321(6071), 674–679.
Storey, J. D., & Tibshirani, R. (2003). Statistical methods for identifying differentially expressed genes in DNA microarrays. Methods in molecular biology (Clifton, N.J.), 224, 149–157.
Thompson, J. F., & Steinmann, K. E. (2010). Single molecule sequencing with a HeliScope genetic analysis system. Current protocols in molecular biology / edited by Frederick M. Ausubel ... [et al.], Chapter 7, Unit7.10.
Threlkeld, S. W., McClure, M. M., Bai, J., Wang, Y., LoTurco, J. J., Rosen, G. D., & Fitch, R. H. (2007). Developmental disruptions and behavioral impairments in rats following in utero RNAi of Dyx1c1. Brain research bulletin, 71(5), 508–514.
Thurman, R. E., Rynes, E., Humbert, R., Vierstra, J., Maurano, M. T., Haugen, E., et al. (2012). The accessible chromatin landscape of the human genome. Nature, 489(7414), 75–82.
43
Timp, W., Mirsaidov, U. M., Wang, D., Comer, J., Aksimentiev, A., & Timp, G. (2010). Nanopore Sequencing: Electrical Measurements of the Code of Life. IEEE transactions on nanotechnology, 9(3), 281–294.
Tsuchiya, S., Yamabe, M., Yamaguchi, Y., Kobayashi, Y., Konno, T., & Tada, K. (1980). Establishment and characterization of a human acute monocytic leukemia cell line (THP-1). International journal of cancer. Journal international du cancer, 26(2), 171–176.
Tuerk, C., & Gold, L. (1990). Systematic evolution of ligands by exponential enrichment: RNA ligands to bacteriophage T4 DNA polymerase. Science (New York, N.Y.), 249(4968), 505–510.
Valen, E., & Sandelin, A. (2011). Genomic and chromatin signals underlying transcription start- site selection. Trends in genetics : TIG, 27(11), 475–485. doi:10.1016/j.tig.2011.08.001
van 't Veer, L. J., Dai, H., van de Vijver, M. J., He, Y. D., Hart, A. A. M., Mao, M., et al. (2002). Gene expression profiling predicts clinical outcome of breast cancer. Nature, 415(6871), 530– 536.
Vaquerizas, J. M., Kummerfeld, S. K., Teichmann, S. A., & Luscombe, N. M. (2009). A census of human transcription factors: function, expression and evolution. Nature Reviews Genetics, 10(4), 252–263.
Vickaryous, M. K., & Hall, B. K. (2006). Human cell type diversity, evolution, development, and classification with special reference to cells derived from the neural crest. Biological reviews of the Cambridge Philosophical Society, 81(3), 425–455.
Voorhoeve, P. M., & Agami, R. (2003). Knockdown stands up. Trends in biotechnology, 21(1), 2–4.
Wang, J.-C. (2005). Finding primary targets of transcriptional regulators. Cell cycle (Georgetown, Tex.), 4(3), 356–358.
Wang, Y., Paramasivam, M., Thomas, A., Bai, J., Kaminen-Ahola, N., Kere, J., et al. (2006). DYX1C1 functions in neuronal migration in developing neocortex. Neuroscience, 143(2), 515– 522.
Wasserman, W. W., & Sandelin, A. (2004). Applied bioinformatics for the identification of regulatory elements. Nature Reviews Genetics, 5(4), 276–287.
Weaving, L. S., Christodoulou, J., Williamson, S. L., Friend, K. L., McKenzie, O. L. D., Archer,H., et al. (2004). Mutations of CDKL5 cause a severe neurodevelopmental disorder with infantile spasms and mental retardation. American journal of human genetics, 75(6), 1079– 1093.