Embed Size (px)
Citation preview
Inference and Inferential Statistics
Methods of Educational Research
EDU 660
Inference
– Draw conclusions from the data– Allow researchers to generalize to a
population of individuals based on information obtained from a sample of those individuals
– Assesses whether the results obtained from a sample are the same as those that would have been calculated for the entire population
Probabilistic nature of inference
– How likely is it?– Are the results that we have seen due to
chance or some real difference?– Mean score for 2 different groups
Example
X1 = 23.5 X2 = 31.6
Is this a real difference between these
scores?
Normal distribution
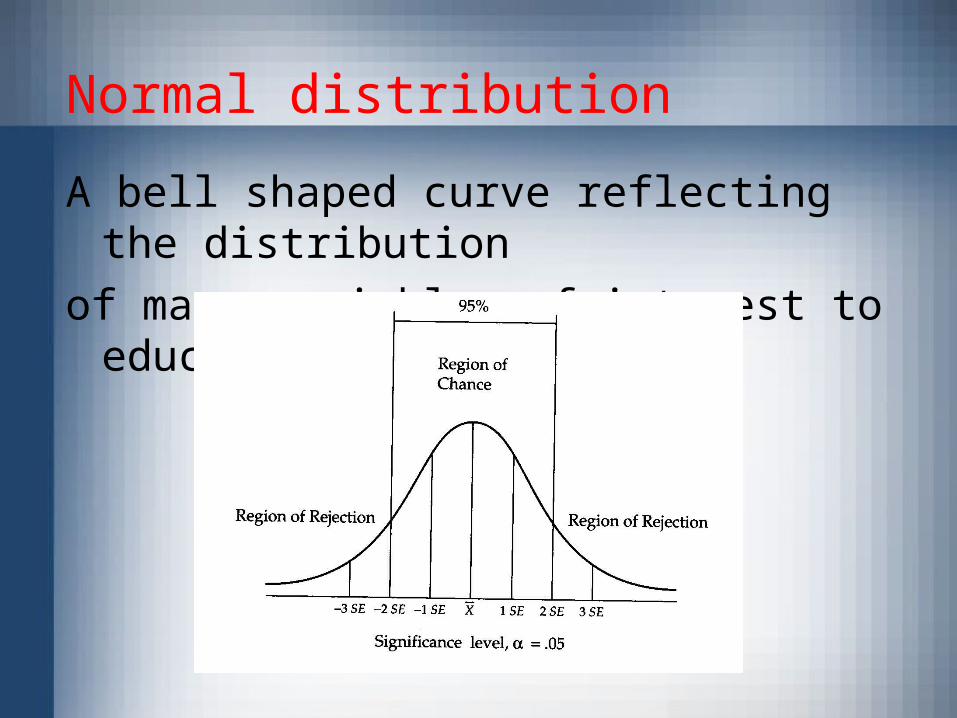
A bell shaped curve reflecting the distribution
of many variables of interest to educators
Normal distribution
Characteristics– 50% of the scores fall above the mean and 50%
fall below the mean– The mean, median, and mode are the same
valuesMost participants score near the mean; the further a score is from the mean the fewer the number of participants who attained that score– Specific numbers or percentages of scores fall between 1 SD, 68% 2 SD, 95 % 3 SD, 99%
Null and Alternative hypotheses
• The null hypothesis represents a statistical tool important to inferential tests of significance
• The alternative hypothesis usually represents the research hypothesis related to the study
Null and Alternative hypotheses
• Comparisons between groups– Null: no difference between the means scores
of the groups– Alternative: there are differences between the
mean scores of the groups• Relationships between variables
– Null: no relationship exists between the variables being studied
– Alternative: a relationship exists between the variables being studied
Test of Significance
• Statistical analyses to help decide whether to accept or reject the null hypothesis
• Alpha α level– An established probability or significance level
which serves as the criterion to determine whether to accept or reject the null hypothesis
– Common levels in education• α =.01 1% probability level• α =.05 5% probability level• α =.10 10% probability level
Type I and Type II Errors
• Correct decisions– The null hypothesis is true and it is accepted– The null hypothesis is false and it is rejected
• Incorrect decisions– Type I error - the null hypothesis is true and it
is rejected– Type II error – the null hypothesis is false and
it is accepted
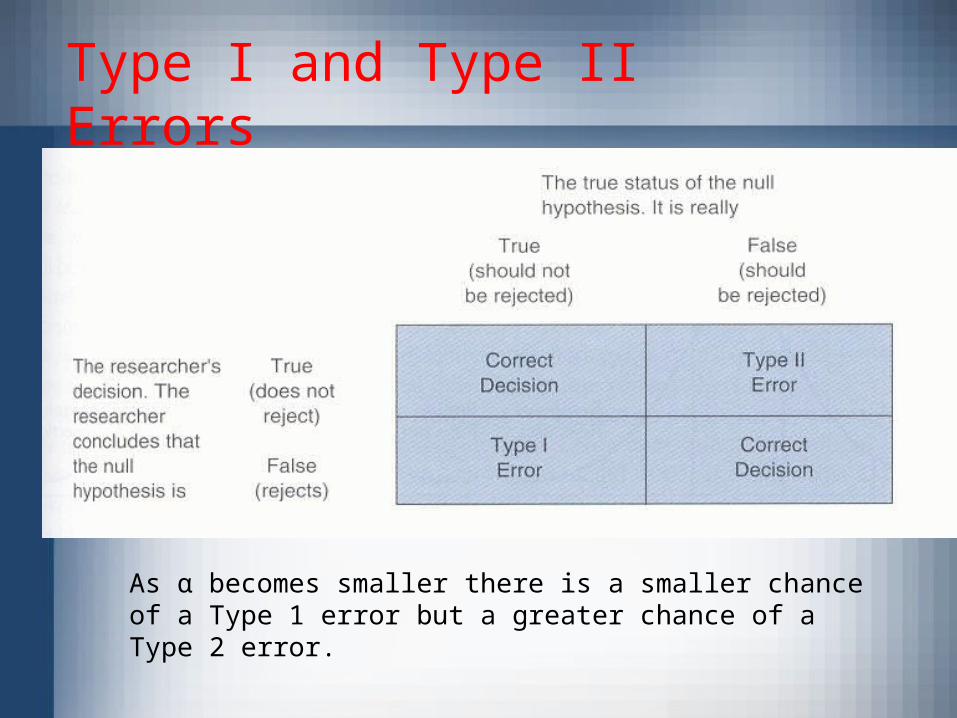
Type I and Type II Errors
As α becomes smaller there is a smaller chance of a Type 1 error but a greater chance of a Type 2 error.
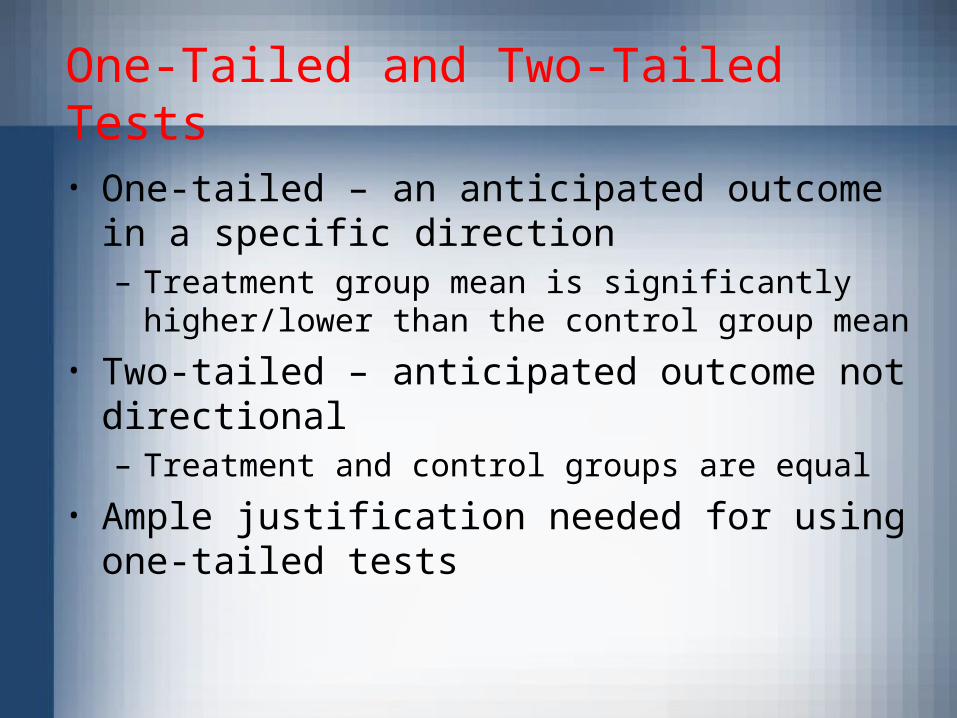
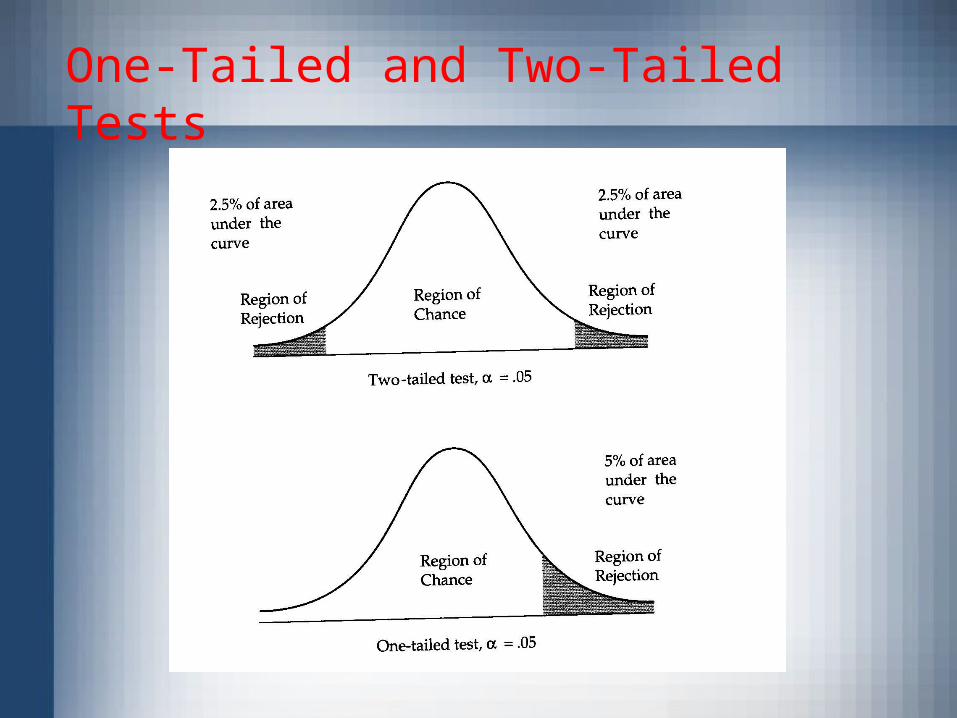
One-Tailed and Two-Tailed Tests
• One-tailed – an anticipated outcome in a specific direction– Treatment group mean is significantly higher/lower
than the control group mean
• Two-tailed – anticipated outcome not directional– Treatment and control groups are equal
• Ample justification needed for using one-tailed tests
One-Tailed and Two-Tailed Tests
Test of Significance
• Specific tests are used in specific situations based on the number of samples and the statistics of interest– One sample tests of the mean, variance,
proportions, correlations, etc.– Two sample tests of means, variances,
proportions, correlations, etc.
Test of Significance
• Types of inferential statistics– Parametric tests – more powerful tests
that require certain assumptions to be met• t - tests• ANOVA
– Non-parametric tests – less powerful• Chi-Square
Form a Null Hypothesis
H0: There is no significant difference in the mean scores for the 2 groups
• Acceptance of the null hypothesis– The difference between groups is too small to attribute it
to anything but chance• Rejection of the null hypothesis
– The difference between groups is so large it can be attributed to something other than chance (e.g., experimental treatment)
The t Test
• Used to test whether 2 means are significantly different at a selected probability
• The t test determines whether the observed difference is sufficiently larger than a difference that would be expected by chance

Types of t Tests
• t test for independent samples– The members of one sample are not related to
those of the other sample in any systematic way - come from the same population
Examples 1. Examine the difference between the mean
scores for an experimental and control group
2. Examine the mean scores for men and women in sample
Types of t Tests
t test for NonIndependent samples
– Used to compare groups that are formed to examine a sample’s performance on a single measure or multiple measures
– Example – examining the difference between pre-test and post-test mean scores for a single class of students
Analysis of Variance - ANOVA
ANOVA is used to test whether there isa significant difference between 2 ormore means at a specified significanceLevel (usually 5%)
Example: Is there a significant difference in the mean scores on a test (µ1, µ2, µ3) of 3 classes of college students?
ANOVA
Omnibus Null Hypothesis• H0: µ1 = µ2 = µ3
• Note: repeated use of numerous t tests for more than 2 means will result in an increased probability of type I errors
p = 1 - (1 – α)c where c is the number of t tests
Analysis of Variance - ANOVA
• If an ANOVA determines that there is a significant difference among a group of means, what then?
• Multiple comparison methods are used to determine what means are different – Scheffe test
Steps in Statistical Testing
• State the null and alternative hypotheses • Set alpha level - 0.05, 0.01 etc• Identify the appropriate test of significance• Identify the test statistic• Compute the test statistic and probability
level• Is the probability level less than the
specified probability?• Accept or reject hypothesis