Embed Size (px)
Citation preview
Inference about Two Population Proportions

DefinitionA sampling method is independent when the individuals selected for one sample do not dictate which individuals are to be in a second sample. A sampling method is dependent when the individuals selected to be in one sample are used to determine the individuals in the second sample. Dependent samples are often referred to as matched-pairs samples. It is possible for an individual to be matched against him- or herself.

Sampling Distribution of the Difference Between Two Proportions
Suppose a simple random sample of size n1 is taken from a population where x1 of the individuals have a specified characteristic, and a simple random sample of size n2 is independently taken from a different population where x2 of the individuals have a specified characteristic.

Sampling Distribution of the Difference Between Two Proportions (cont.)

Sampling Distribution of the Difference Between Two Proportions (cont.)
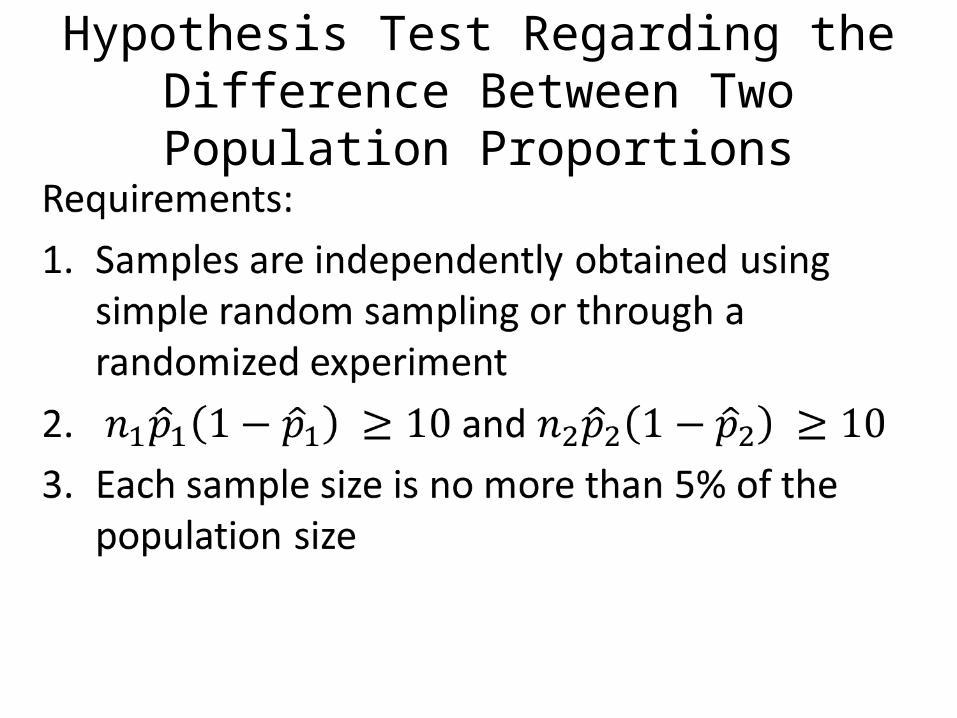
Hypothesis Test Regarding the Difference Between Two Population Proportions
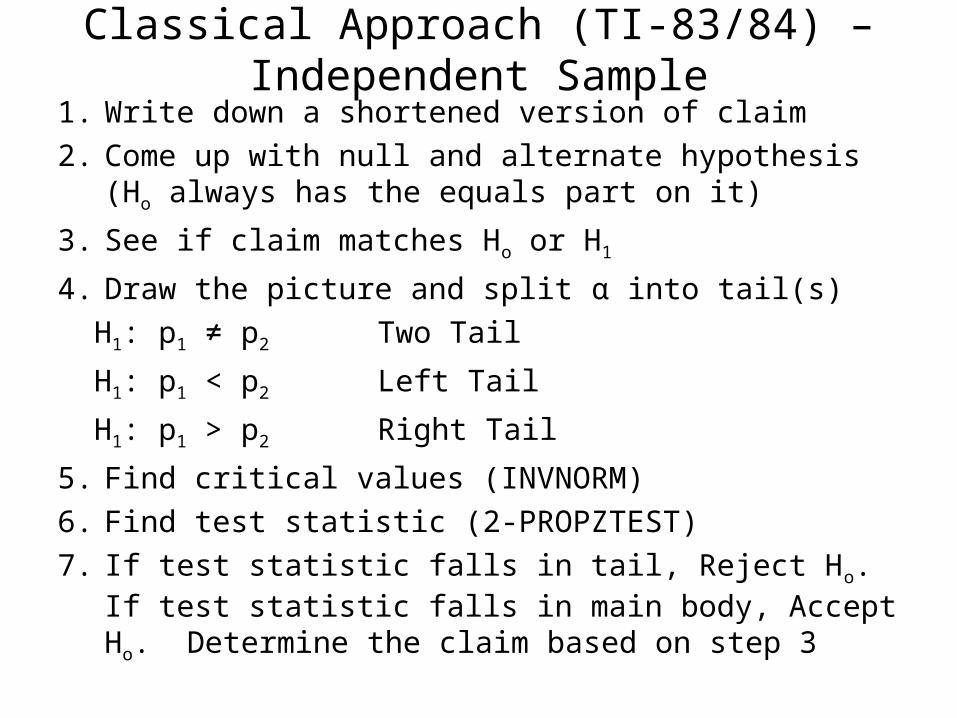
Classical Approach (TI-83/84) – Independent Sample1. Write down a shortened version of claim2. Come up with null and alternate hypothesis (Ho always has
the equals part on it)3. See if claim matches Ho or H1
4. Draw the picture and split α into tail(s)H1: p1 ≠ p2 Two Tail
H1: p1 < p2 Left Tail
H1: p1 > p2 Right Tail
5. Find critical values (INVNORM)6. Find test statistic (2-PROPZTEST)7. If test statistic falls in tail, Reject Ho. If test statistic falls in
main body, Accept Ho. Determine the claim based on step 3
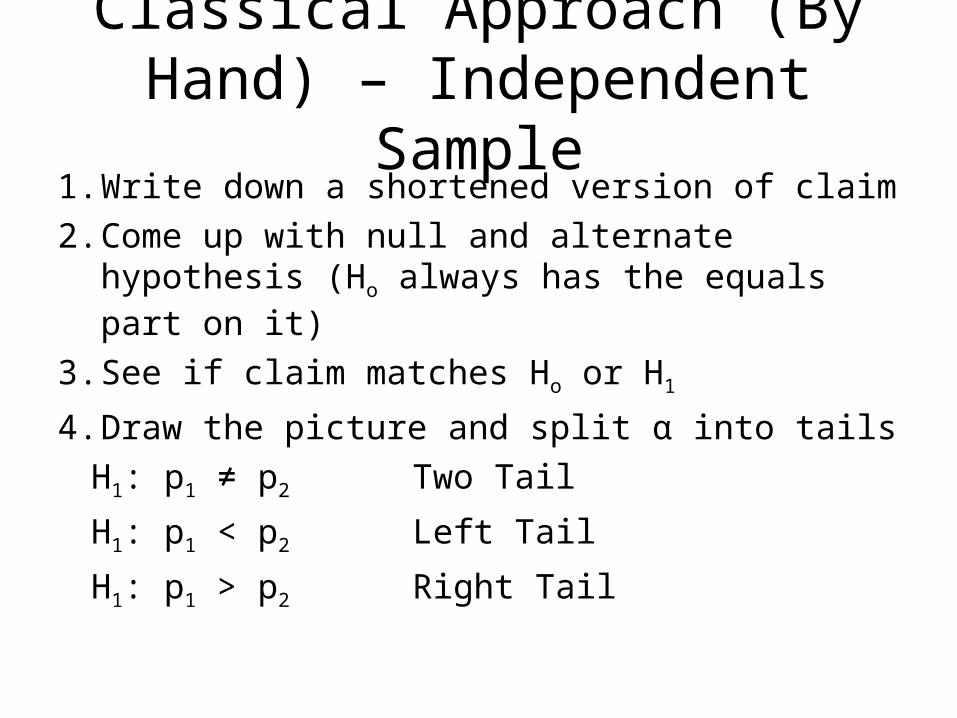
Classical Approach (By Hand) – Independent Sample
1. Write down a shortened version of claim2. Come up with null and alternate hypothesis
(Ho always has the equals part on it)
3. See if claim matches Ho or H1
4. Draw the picture and split α into tailsH1: p1 ≠ p2 Two Tail
H1: p1 < p2 Left Tail
H1: p1 > p2 Right Tail

Classical Approach (By Hand) – Independent Sample (cont.)

P-Value Approach (TI-83/84) – Independent Sample
1. Write down a shortened version of claim2. Come up with null and alternate
hypothesis (Ho always has the equals part on it)
3. See if claim matches Ho or H1
4. Find p-value (2-PROPZTEST)5. If p-value is less than α, Reject Ho. If p-
value is greater than α, Accept Ho. Determine the claim based on step 3

P-Value Approach (By Hand) – Independent Sample
P-Value Approach (By Hand) (cont.)
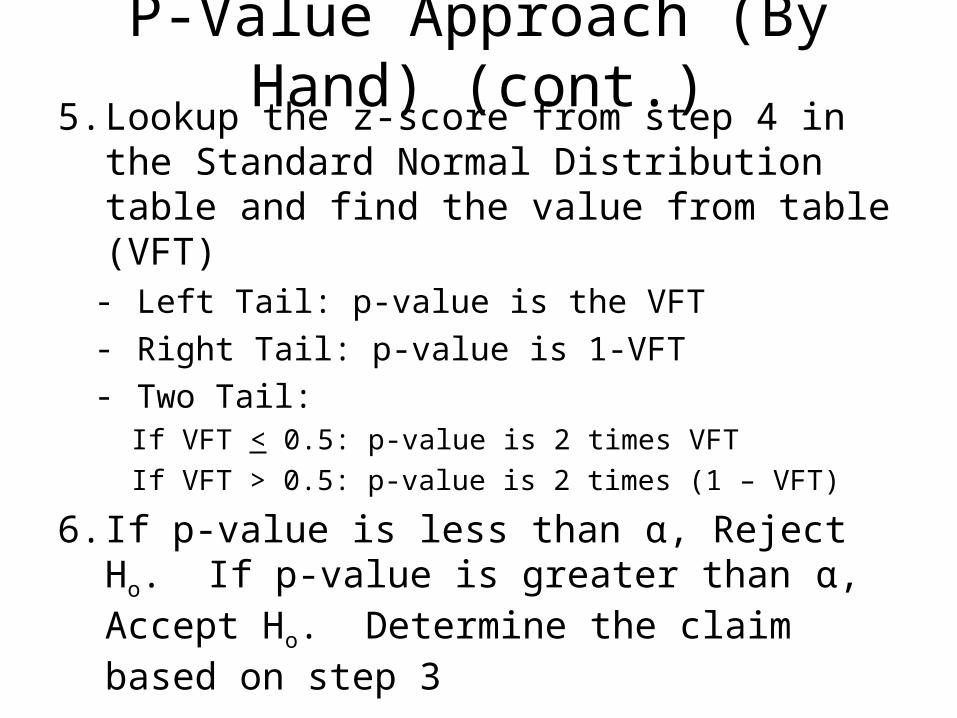
5. Lookup the z-score from step 4 in the Standard Normal Distribution table and find the value from table (VFT)
- Left Tail: p-value is the VFT- Right Tail: p-value is 1-VFT- Two Tail:
If VFT < 0.5: p-value is 2 times VFTIf VFT > 0.5: p-value is 2 times (1 – VFT)
6. If p-value is less than α, Reject Ho. If p-value is greater than α, Accept Ho. Determine the claim based on step 3

1. Claim
In testing a new drug (Zizar) there was a concern of migraines occurring during usage. 300 out of 1000 people in the Zizar group experienced migraines while 250 out of 1000 people in the placebo group experienced migraines. Is the proportion of people getting migraines greater for those taking Zizar than those taking the placebo at the α = 0.05 level of significance?
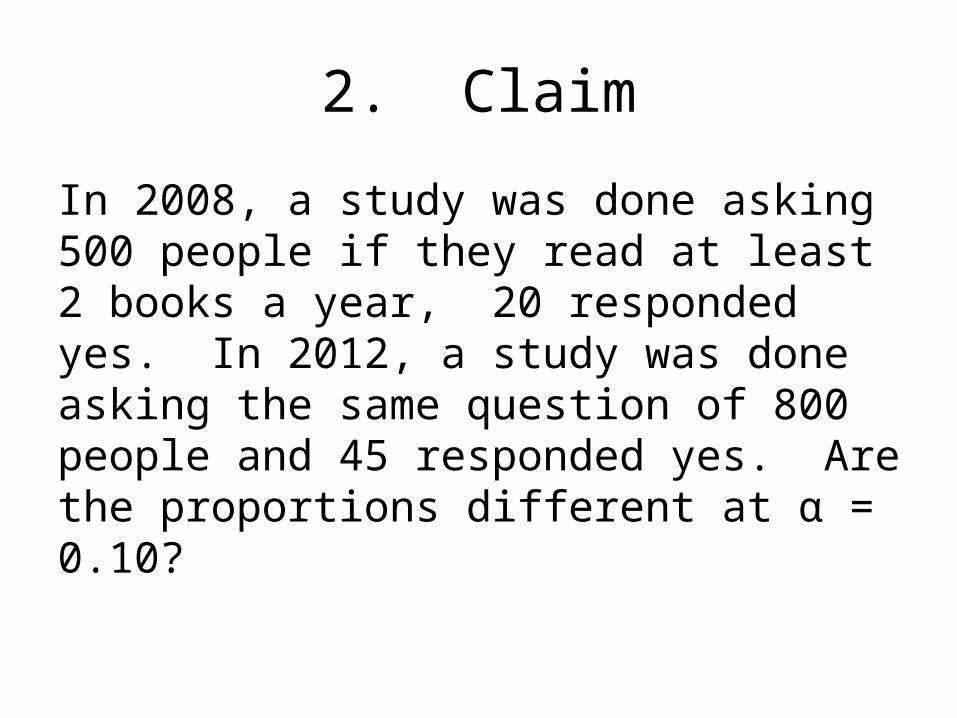
2. Claim
In 2008, a study was done asking 500 people if they read at least 2 books a year, 20 responded yes. In 2012, a study was done asking the same question of 800 people and 45 responded yes. Are the proportions different at α = 0.10?

Constructing a Confidence Interval for the Difference between Two Population Proportions
(Independent Samples)

TI-83/84 Instructions

3. Confidence Intervals
In a poll of 1000 men, 200 said they believed in UFO’s. In a poll of 780 women, 100 said they believed in UFO’s. Construct a 95% confidence interval for the difference between the two population proportions, pmen – pwomen
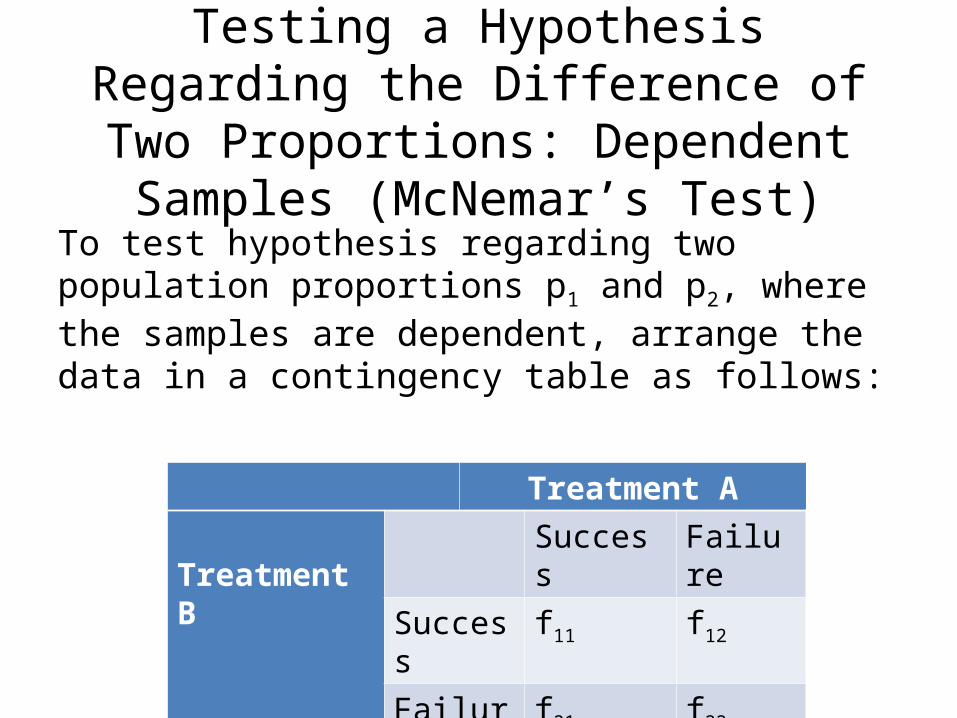
Testing a Hypothesis Regarding the Difference of Two Proportions: Dependent
Samples (McNemar’s Test)
To test hypothesis regarding two population proportions p1 and p2, where the samples are dependent, arrange the data in a contingency table as follows:
Treatment A
Treatment BSuccess Failure
Success f11 f12
Failure f21 f22

Requirements
1. Samples are dependent and are obtained randomly
2. Total number of observations where the outcomes differ must be greater than or equal to 10. That is f12 + f21 > 10
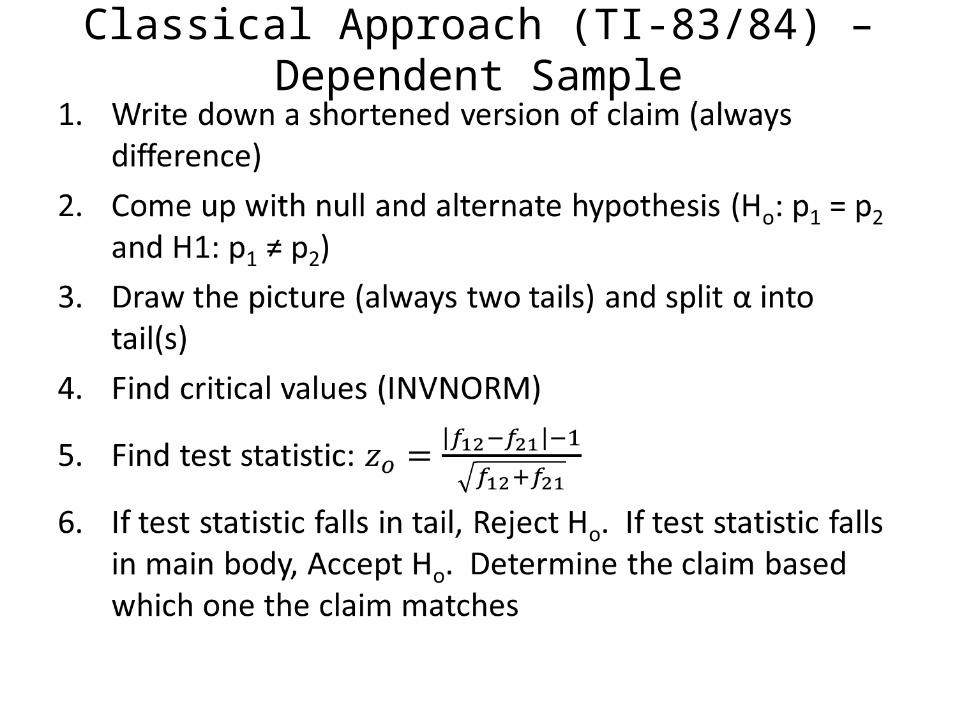
Classical Approach (TI-83/84) – Dependent Sample
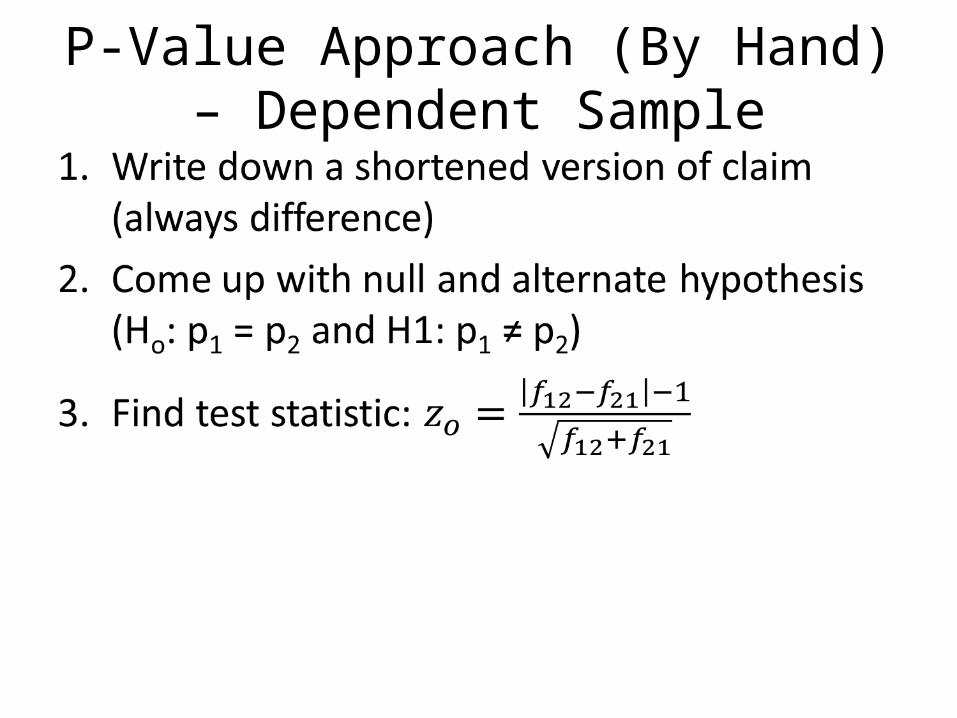
P-Value Approach (By Hand) – Dependent Sample

P-Value Approach (By Hand) (cont.)
4. Lookup the z-score from step 3 in the Standard Normal Distribution table and find the value from table (VFT)
- Left Tail: p-value is the VFT- Right Tail: p-value is 1-VFT- Two Tail:
If VFT < 0.5: p-value is 2 times VFTIf VFT > 0.5: p-value is 2 times (1 – VFT)
5.If p-value is less than α, Reject Ho. If p-value is greater than α, Accept Ho. Determine the claim (remember always matches H1 in these claims)

4. ClaimGiven a survey of 1000 adults, they were asked whether they believe in UFO’s and whether they believe in ESP. Given the table below, is there a significant difference in the proportion of adults who believe in UFO’s and believe in ESP at α = 0.05.
Believe in UFO’s(success)
Don’t Believe in UFO’s
(failure)Believe in ESP
(success)100 400
Don’t Believe in ESP(failure)
200 300
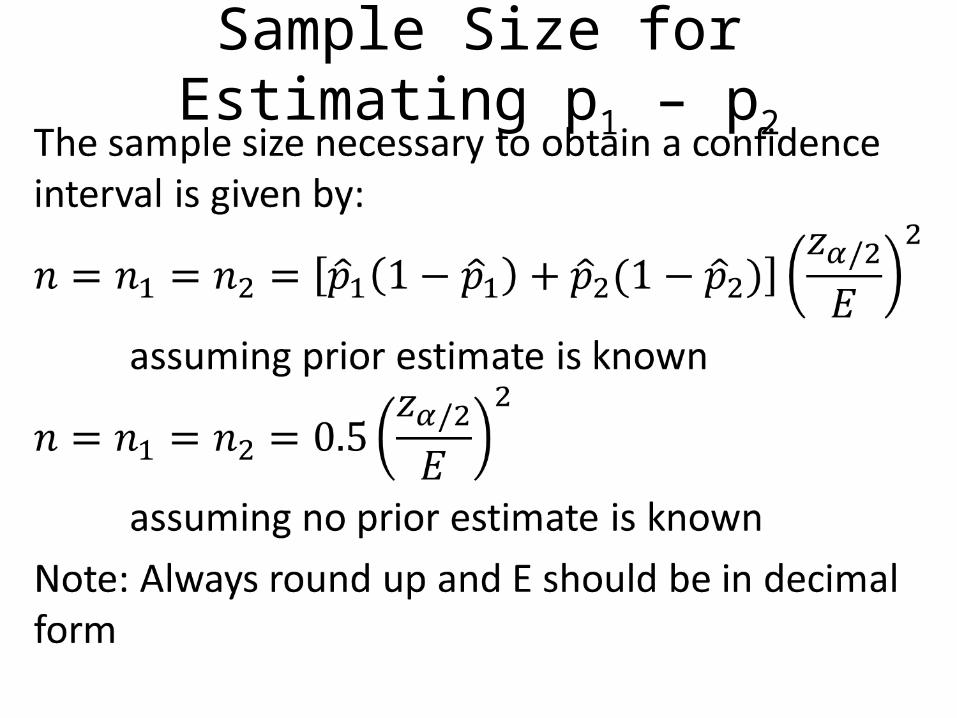
Sample Size for Estimating p1 – p2
5. Sample Size
We want to determine the difference in the proportion of men versus the proportion of women who believe in UFOs. What sample size should be obtained with 95% confidence within 5 percentage points:a)Assuming a prior estimate of 20% for men and 17% for womenb)Assuming no prior estimate