Embed Size (px)
Citation preview

25
© Woodhead Publishing Limited, 2012
2 Inertia friction welding (IFW) for aerospace
applications
M. M. ATTALLAH , University of Birmingham, UK and
M. PREUSS , University of Manchester, UK
Abstract : The use of inertia welding in the aerospace industry has been steadily increasing owing to the signifi cant improvements it provides in joint quality, compared with the use of fusion welding. This chapter introduces the process, with respect to its operation, parameters, differences from other friction welding techniques and equipment. It also explains the application of the technique and the selection of the process parameters, and the different mathematical, analytical and numerical approaches that are used to model the thermal fi elds and residual stress development. Details of the microstructural, mechanical properties and residual stress development in inertia friction-welded Ni-based superalloys, titanium alloys, steels and other alloys are also discussed.
Key words : inertia friction welding, nickel superalloys, titanium alloys, steel, fi nite element modelling, microstructure, residual stresses.
2.1 Introduction
The need for high-quality joints, combined with the inherent diffi culty in
welding most aerospace materials, has fostered the use of solid-state friction-
based welding techniques within the past decade in the aerospace industry,
such as: friction stir welding (FSW), linear friction welding and rotary fric-
tion welding (RFW) with its two variants; continuous-drive friction welding
(CDFW) and inertia friction welding (IFW) (Kallee et al ., 2003 ). Except for
FSW, friction-based welding processes can be described as self-cleaning as
a result of the ejection of the plasticised material in the form of fl ash at the
end of the welding cycle, which carries alongside any surface contamina-
tion or oxides, making it unnecessary to use shielding gas during welding.
Among the friction-based welding processes, the use of inertia welding in
the aerospace industry has been steadily increased in the past two decades,
especially in joining nickel-based superalloys, titanium alloys and steel aero
engine cylindrical components, owing to the signifi cant improvements it
provides in the joint quality, compared with the use of fusion welding. This
chapter contains six themes. The fi rst theme introduces the process, with
respect to its operation, parameters, differences from other friction welding

26 Welding and joining of aerospace materials
© Woodhead Publishing Limited, 2012
techniques and equipment. The second theme explains the application of
the technique and the selection of the process parameters, and the different
mathematical, analytical and numerical approaches that are used to model
the thermal fi elds and residual stress development. The third and fourth
themes discuss the microstructural and mechanical property development
respectively, in inertia friction-welded Ni-based superalloys, titanium alloys,
steels and other alloys. The impact of the process on the residual stress
development is discussed in the fi fth theme, focusing on the application of
neutron and synchrotron X-ray diffraction in measuring the residual stress
development. Finally, the chapter is concluded with a section outlining the
future trends and possible developments in IFW.
2.1.1 Process development
Although it is believed that the interest in using rotary frictional heat-
ing for joining dates back to a late nineteenth-century U.S. patent, fur-
ther developments in the fi rst half of the twentieth century resulted in the
development of commercially applicable RFW techniques (Oberle et al .,
1967 ). Concurrent yet separate efforts by Russian and American engineers
resulted in the development of the two variants of RFW in the second half
of the twentieth century. Around 1954–1957, Russian engineers Chudikov
and Vill were fi rst to suggest an RFW technique for joining cylindrical sec-
tions mounted on a modifi ed lathe, which was later termed direct or con-
tinuous-drive friction welding (Chudikov, 1956 ; Houldcroft, 1977 ). Upon
successful commercialisation of this technique in Russia, the concept of
RFW became familiar with American and British engineers. Pioneering
work at the Caterpillar Tractor Company led to the development of iner-
tia (fl ywheel) friction welding (IFW), which was U.S. patented in 1965
(Houldcroft, 1977 ; Oberle, 1968 ; Oberle et al ., 1967 ). Because of this, IFW
remains more commonly used in the USA until today, while CDFW is
mostly used in Europe and Japan.
2.1.2 Inertia friction welding (IFW) process description
In IFW, the kinetic energy stored in a rotating fl ywheel is conserved into
frictional thermal energy to mostly join two components of cylindrical
geometry; one component is clamped to the fl ywheel, while the other com-
ponent is clamped in a non-rotating chuck connected to a hydraulic ram.
During welding, once the fl ywheel is brought to a certain rotation speed, the
motor is disengaged, and a forging pressure is applied to the hydraulic ram
to bring the two components to contact. Following the initial contact, the
fl ywheel speed starts to decelerate owing to the conservation of the stored

Inertia friction welding (IFW) for aerospace applications 27
© Woodhead Publishing Limited, 2012
energy into thermal energy, causing the temperature to increase sharply at
the interface owing to the generated friction. Ultimately, a plasticised layer
forms between the two components, where consolidation occurs. The appli-
cation of pressure causes the plasticised material to fl ow outside the joint
line forming a fl ash, which dissipates some of the weld energy causing the
interface region to cool slightly even before the rotating part has come to a
halt (Anon, 1979 ; Oberle et al ., 1967 ).
IFW thus differs from CDFW in the braking mechanism. In CDFW, braking
is performed by declutching the spindle from the hydraulic or electric motor
that ‘continuously’ drives the rotating component, followed by applying the
brakes upon the application of the forging force for a certain time (Anon,
1979 ). In IFW, braking occurs upon the dissipation of the energy stored in the
fl ywheel, which occurs gradually during IFW, with the maximum energy trans-
fer occurring upon the fi rst touch between the two interfaces (Kallee et al .,
2003 ). This difference affects the application of the power input to the weld
throughout the process; where the power input in IFW changes to supply the
required power to fi rst plasticise the interface and then to forge the compo-
nents, while the power input in CDFW is limited by the power rating of the
motor. The main differences between the IFW and CDFW systems are shown
in Fig. 2.1 .
2.1.3 IFW process parameters
Both IFW and CDFW processes differ in the parameters that control the
process (Anon, 1979 ). IFW is controlled by two main parameters, which are
MotorFlywheels Chuck Non-rotating vise
Spindle WorkpiecesHydraulic
cylinder
Hydraulic cylinderBrakeClutchSpindleMotor
(a)
(b)
2.1 Schematic diagrams for the set-ups of the welding systems for (a) inertia welding and (b) CDFW (Anon, 1979).

28 Welding and joining of aerospace materials
© Woodhead Publishing Limited, 2012
the welding energy (rotation speed and fl ywheel inertia) and the forging
pressure, while CDFW is controlled by the rotation speed and the time-
pressure cycle to be used, including the braking time ( Fig. 2.2 ). It is impor-
tant to mention that the spindle speed (and hence the power input) gradually
decreases from the maximum (set) value following contact in IFW, whereas
the spindle speed is mostly constant in CDFW (Houldcroft, 1977 ). For fur-
ther details on CDFW (e.g. process parameters, machine specifi cations and
applications), the reader is directed to other references that fully discuss
CDFW (Anon, 1979 ; Ellis, 1972 ; Hollander et al ., 1964 ).
2.1.4 IFW process stages
A three-stage model is generally used to defi ne the IFW stages depend-
ing on the fl uctuation in the frictional torque owing to the contact between
the rotating components (Wang and Lin, 1974 ), or four stages if an initial
stage is added during which the fl ywheel reaches the desired rotation speed
Welding starts
Welding
speed
(a)
(b)
Welding speed
Forge force
Friction forceAcc
ele
rate
Acc
ele
rate
Time Completion
or welding
Completion
or welding
Total upset length
Total upset length
Time
Single or dual welding force
2.2 A comparison between the welding cycle for (a) inertia welding and (b) CDFW. (Courtesy of Manufacturing Technology, Inc.)

Inertia friction welding (IFW) for aerospace applications 29
© Woodhead Publishing Limited, 2012
(D’Alvise et al ., 2002 ). According to the three-stage model ( Fig. 2.3 ), the
three stages are described as follows:
Stage I ( • initial contact ): the two components are brought in contact,
which results in a rapid increase in the frictional torque, a deceleration
in the rotation speed and accordingly a sizeable dissipation of the stored
energy owing to the dry friction between the interfaces. The friction also
leads to the removal of any surface irregularities and asperities, similar
to what happens during wear, until perfect contact is reached. With the
increase in temperature, a decrease in the torque occurs at the end of this
stage, owing to the softening of the material and adhesion of asperities
at the interface, forming a plasticised layer ( Fig. 2.4a ). The high torque
that is experienced and the high rotation speed at start mean that the
maximum power input is achieved within this stage.
Stage II ( • transition stage ): the friction-induced thermomechanical defor-
mation makes the material at the thin interface fully plasticised (vis-
co-plastic). Thus, the process reaches a transitional steady-state condi-
tion, where the strain hardening is overcome by frictional heating. This
is manifested in a roughly constant torque, and a gradually decreasing
Stage I Stage II
P P
PP
Stage III
Torque (T)
Weld load (P)
Cool orhold time
WeldingcompleteWeldingcomplete
Upset
Time
Weldspeed
Speed (
rpm
)
Weldingstarts
2.3 The stages of inertia welding, showing the variation in process variables (Anon, 1979; Wang and Lin, 1974).

30 Welding and joining of aerospace materials
© Woodhead Publishing Limited, 2012
rotation speed (and power). A gradual increase in the upset also occurs
owing to burn-off and the initiation of fl ash formation at the interface.
However, continuous frictional heating leads to the widening of the
plasticised region (Fig. 2.4b).
Stage III ( • forging stage ): with the decrease in rotation speed while the
forging pressure is still being applied, the torque increases to another
peak to overcome the cooling and hardening. This increase in torque
is believed to refi ne the joint microstructure at this fi nal stage, as well
as the ejection of the fl ash that carries along any oxides or inclusions
(Oberle et al ., 1967 ). The upset increases and more fl ash is formed, lead-
ing to further cooling of the interface (Fig. 2.4c). After reaching the
maximum upset, the forging load is kept applied until the weld cools.
2.1.5 IFW production machines
IFW machines are generally classifi ed according to the forge force capacity,
which ranges from a fraction of a ton to 4500 ton lb (~8896 kN). The choice
of the machine depends on the application geometry and material, which
accordingly controls the required process parameters. Typical machines and
products are shown in Figs. 2.5 and 2.6 . For relatively small aerospace com-
ponents (e.g. pistons, pipes, turbine wheels and shafts), machines with forg-
ing force capacity ~1–50 ton lb (~2–250 kN) are normally used ( Fig. 2.5 ). For
larger aero engine assemblies (e.g. compressor-rotor, disk-to-cone, drum-
drive compressor and disk-to-shaft assemblies), machines with large capaci-
ties are used to provide the required energy (MTI, 2009 ) ( Fig. 2.6 ).
(a) (b)
(c)
2.4 The stages of inertia welding in a drill-pipe weld (a) initial contact, (b) transitional stage and (c) forging. (Courtesy of Manufacturing Tech-nology, Inc.)

Inertia friction welding (IFW) for aerospace applications 31
© Woodhead Publishing Limited, 2012
Major suppliers of IFW machines include Manufacturing Technology Inc.
(MTI), Blacks equipment, Thompson friction welding, Swanson industries,
AI Welders, Kuka and the Welding Institute (TWI). Most IFW machines
are horizontal and driven with hydraulic systems, although there are some
machines (mostly with small forging force capacity) that run with DC or AC
motors (Anon, 1979 ). In the hydraulic-driven machines, the spindle-fl ywheel
assembly is operated using a hydraulic pump. The pump itself is operated
with an electric motor, which switches off once the desired rotation speed
(a)
(b)
2.5 Typical IFW machines and products (a) 15 ton welder, (b) 40 ton welder, (c) light-weight piston for aircraft pump produced by the 15 ton welder and (d) turbine wheels produced by the 40 ton welder. (Courtesy of Manufacturing Technology, Inc.)

32 Welding and joining of aerospace materials
© Woodhead Publishing Limited, 2012
is reached. In the electric motor-driven machines, the motor is directly con-
nected to the spindle, and is either declutched or switched off when the
required speed is reached.
2.1.6 Advantages and disadvantages of IFW
The use of IFW provides several advantages, either from a manufacturing
viewpoint or with respect to the weld structural integrity. Compared with
fusion welding, the process is fully automated and repeatable, and does
not require the use of a fi ller material, shielding gases or vacuum owing
to its self-cleaning mechanism (i.e. fl ash formation) (Kallee et al ., 2003 ).
The process control and optimisation is also simple as it is controlled by
only two variables (weld energy and forging pressure) (Anon, 1979 ), or
three variables if the weld energy is separated into the fl ywheel inertia and
rotation speed. Similar, dissimilar and components of different geometries
(c)
(d)
2.5 Continued

Inertia friction welding (IFW) for aerospace applications 33
© Woodhead Publishing Limited, 2012
are also weldable using IFW. In addition, the process results in a more
effi cient material utilisation, weight reduction and a longer component life
compared with using bolted joints (Heberling, 1990 ). Moreover, the solid-
state nature means that any solidifi cation defects are avoided. The joint
possesses several unique characteristics, with respect to its microstructure
and mechanical properties, as will be discussed later. Finally, IFW is a safe
and environmentally friendly technique as it does not produce any harm-
ful gases, fumes, etc.
Nonetheless, IFW requires a remarkable capital investment in the
machinery and tooling, although the capability of the IFW machine can
be tailored according to the geometry of the application required (Benn,
2000 ). Still, the introduction of new applications can be expensive and
requires a long lead time. In addition, there is a shortage in qualifi ed weld-
ers as it is a very specialised process. Thus, if only a limited number of IFW
joints are required, acquiring an IFW machine might not be economically
sustainable.
(a)
(b)
2.6 (a) A 2000 ton forge force inertia welder (model 2000B) and (b) a titanium low-pressure rotor assembly for an aero engine produced using the 2000 ton welder. (Courtesy of Manufacturing Technology, Inc.)

34 Welding and joining of aerospace materials
© Woodhead Publishing Limited, 2012
2.2 Process parameters, heat generation and modelling
2.2.1 Process parameters and joint design
The selection of the welding parameters in IFW is dependent upon the com-
ponent material and geometry, which is then used to determine the required
welding energy. Manufacturers of IFW machines have typically produced
charts that determine the required energy based on the section diameter for
solid cylinders, or the wall thickness for tubular sections. Owing to the origin
of IFW being in the USA, most IFW variables, parametric tables and charts
are available in imperial units, although modern inertia welders follow the
metric system.
The stored energy ( E , lb/ft 2 ) in the fl ywheel of inertia ( Wk 2 , lb/ft 2 ) and
rotation speed ( N , rpm) is given as :
E ( )Wk NWW(WkWWkWW 2 2N
5873 [2.1a]
In SI units, the above equation becomes:
EI N
=2
182 38. [2.1b]
where I is the inertia (kg.m 2 ) .
The linear speed of the outer diameter is presented as surface feet per
minute (s.f.p.m.), which is calculated using:
s.f.p.m. = 2πN r× [2.2]
where r is the outer radius in feet.
It is usually required to calculate the energy per unit area ( E / A ) and load
applied per unit area ( L / A ), which is performed by dividing over the con-
tact area. The following example illustrates the methods for the calcula-
tion of the IFW process parameters. The material data and parameters are
based on the information supplied in the manual of the M120 inertia welder,
Manufacturing Technology Inc. (MTI, 1974 ).
Example
Most machine manuals include charts similar to the one shown in Fig. 2.7 ,
which can be used to determine the energy and load required for weld-
ing tubular sections or bars of mild steel. For any material other than mild
steel and any geometry other than bar-to-bar or tube-to-tube, material

Inertia friction welding (IFW) for aerospace applications 35
© Woodhead Publishing Limited, 2012
factors (e.g. for Al, Ti, Ni alloys) and geometry factors (e.g. bar-to-tubes, bar-
to-plate, tube-to-plate, etc.) are used to calculate the required energy and
load, whereby:
E = energy for mild steel × material factor × geometry factor [2.3a]
L = load for mild steel × material factor × geometry factor [2.3b]
To weld a 3/4 inch (19.05 mm) mild-steel bar, a weld energy of E = 15 000
ft.lbs (20.3 kJ) and a load of L = 7250 lbs (32.25 kN) are required. For the
same alloy, a speed (s.f.p.m.) range of ~1200–1800 ft/min (365–548 m/min)
can be possibly used. As the used chart was for bars of mild steel, both the
material and geometry factors are reduced to unity.
To calculate the inertia and rotation speed required based on the energy
required, machine manufacturers suggest two approaches. In the fi rst
approach, an average value of the typical rotation-speed range to weld a
specifi c material is used to calculate the inertia required using Equation
[2.1]. As the fl ywheels available for each machine have specifi c inertias that
most likely do not match the theoretical inertia, the nearest fl ywheel assem-
bly is used. Finally, the rotation speed is recalculated based on the inertia of
the available fl ywheel. It is important to point out that the energy is more
sensitive to changes in the rotation speed than the inertia (Equation [2.1]).
In the second approach, a chart for the total energy plotted against the spin-
dle speed is used for each of the fl ywheels or fl ywheel combinations avail-
able as shown in Fig. 2.8 . This approach eliminates the need to recalculate
the rotation speed.
Diameter (φ)
Energ
y Energy LoadLoad
2.7 A typical ‘process-parameters’ determination chart.

36 Welding and joining of aerospace materials
© Woodhead Publishing Limited, 2012
To ensure reliable forging between the two parts, machines are equipped
with displacement transducers to control the amount of upset, as a minimum
upset is required to ensure that any inclusions or oxides are fully ejected out
of the weld in the form of fl ash. The following formulae give an approximate
estimate for the target upset to yield an acceptable weld (Benn, 2000 ):
Target upset = 0.15” (3.81 mm) + 0.2 × tube thickness [2.4a]
= 0.05” (1.27 mm) + 0.2 × bar diameter [2.4b]
Knowing that there is a reasonable range of welding parameters that
can be used for different materials, the increase in a certain parameter can
change the extent of upset and the morphology of the welding region. Upon
increasing the fl ywheel energy, the amount of fl ash and upset are known
to increase. For the peripheral speed, the morphology of the weld region
develops from being concave to convex on increasing the speed, with the
weld performed at low speed having poor quality at the centre. This is also
the case with the welds performed with a high forging pressure (Elmer and
Kautz, 1993 ).
2.2.2 Heat generation
An important issue in modelling friction welding is the mathematical rep-
resentation for heat generation. Early analytical models utilised the actual
power measured by the welding machine after subtracting the idle power
Spindle speed (RPM)
Flywheel (1)
Flywheel (2)
Flywheel (3)
Flywheel (4)
Energ
y
2.8 An alternative chart for the determination of the rotation speed and inertia.
Inertia friction welding (IFW) for aerospace applications 37
© Woodhead Publishing Limited, 2012
(Cheng, 1962 ), until Cheng ( 1963 ) suggested that the power input can be
described using the instantaneous measured value of the torque ( M t ) and
rotation speed ( N t ) such that:
qK
M Nt tN=2π
[2.5]
where q is the power input, and K is a constant.
On modelling IFW, Wang and Nagappan ( 1970 ) suggested a friction-
induced heat-generation model, where the power input at a certain radial
position, r , can be represented by:
q K prNrI tprNrrµpp [2.6]
where K I is a constant, µ is the coeffi cient of friction, and p is the forging
pressure. The total heat generation for an annular element or thickness dr
can be represented as:
Q K p N r dr dtII t
RT
( )r t ⋅ ( )r t ⋅N dr∫∫ µ p)t r
0
2
0
[2.7]
where K II is a constant. The friction coeffi cient was also suggested to be
varying with position and time as given by:
µK( )r t, =
( )N rt2 [2.8]
This formulation, although analytically correct, results in a complicated
computation to estimate the heat input. Thus, it was suggested that the prod-
uct µp is constant throughout the welding process, which is calculated from
the average value of the heat generation. Equation [2.7] can be integrated
after substituting N t with a second-order polynomial function for the varia-
tion of N with time.
It is apparent that the spatial variation in the friction coeffi cient, as well
as with temperature, resulted in making the measured power-input-based
approaches more popular than the friction-based approach. Other pow-
er-input (Johnson et al ., 1966 ) models were suggested for IFW, where the
actual power input was modelled in two functions (stages). The fi rst stage
represents the initial contact stage, followed by the decrease in power in the
second stage, as shown in Fig. 2.9 :
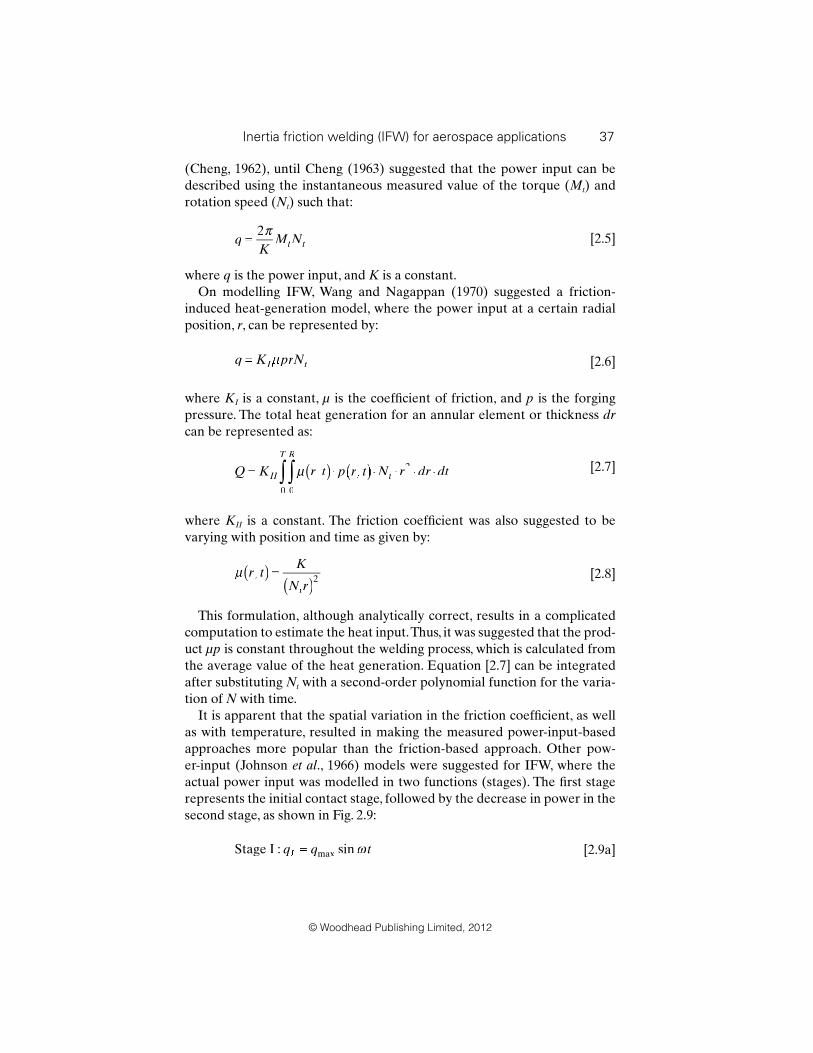
Stage I : sinmaxq q tI ω [2.9a]
38 Welding and joining of aerospace materials
© Woodhead Publishing Limited, 2012
Stage II : qk c
T tSTT( )t =
−ρcc
π
1 21 2
[2.9b]
where q max is the maximum power input, T s is the maximum interface tem-
perature, c is the specifi c heat, ρ is the density, t is time and k is the thermal
conductivity. A review of other models that rely on the measured power
input is available elsewhere (Davé et al ., 2001 ).
2.2.3 Analytical and numerical (fi nite-difference) modelling
Early IFW modelling efforts focused on developing thermal analytical
models, prior to the wider application of the fi nite element method for ther-
mal and thermomechanical modelling in recent years. A review of the early
analytical models for friction welding, which were mostly generated in the
former Soviet Union, is available elsewhere (Davé et al ., 2001 ). These mod-
els rely on obtaining closed-form solutions for the two-dimensional heat-
transfer differential equation:
∂
∂
∂
∂
∂
∂ α
∂
∂
2∂∂2
2∂2
1 1∂ ∂2∂∂T
r∂∂ r
∂∂
r∂∂ z∂
T∂∂
t∂∂+ + = [2.10]
This approach uses some assumptions to simplify obtaining the mathemati-
cal solution (e.g. assuming a semi-infi nite solid, constant thermophysical
100
75
50
25Theore
tical P
ow
er,
HP
/in
2
00 .1 .2 .3
Time, sec.
Stage I
qI = qmax sinω t
Stage II
q(t) = Tst–
1/21/2( (kρc
π
For 304 Stainless steel
.4 .5
2.9 Power-input-based modelling for inertia welding according to Johnson et al. model (Wang and Lin, 1974).

Inertia friction welding (IFW) for aerospace applications 39
© Woodhead Publishing Limited, 2012
properties and constant heat fl ux). The resulting solutions are given by
equations in the form of:
Tq
kt ierfc
x
tt tO
ht=
⋅ t
≤ ≤t2
20αttt
αtt; [2.11]
where T is the temperature, q O is the surface heat fl ux, k is the thermal
conductivity, α is the thermal diffusivity, x is the distance from the weld line,
t is the time and t h is the total time for the heat-fl ux application. It is not
clear though how the heat fl ux is calculated based on the welding param-
eters. Further details on this approach can also be found elsewhere (Grong,
1997 ).
Later, Cheng was the fi rst to develop numerical (fi nite-difference) solu-
tions for a one-dimensional heat-transfer equation, including in the model
a melt (moving) boundary at the interface (Cheng, 1962 , 1963). The calcu-
lated thermal fi elds were compared with thermocouple measurements dur-
ing CDFW that showed that the model underestimated the temperatures
in the initial heating phase, prior to decreasing the under-shoot by the end
of the heating cycle. Cheng also investigated the infl uence of using variable
and constant thermophysical properties (Cheng, 1962 ), and compared the
numerical results with the heat-balance (closed-form) integral method. The
concept of the melting interface was later disproved by performing thermo-
couple measurements across a mild-steel inertia friction weld (Wang and
Nagappan, 1970 ) and using analytical fl ow modelling (Davé et al ., 2001 ). This
also becomes clearer by investigating the weld microstructure as will be dis-
cussed later. Most of the aforementioned modelling attempts were mainly
for CDFW, which was the more familiar RFW process in the 1960s. Thus,
it was not until the 1970s when Cheng’s numerical approach was applied
to model IFW (Wang and Lin, 1974 ; Wang and Nagappan, 1970 ). A two-
dimensional numerical formulation was used, with temperature-dependent
thermophysical properties. Nonetheless, the models also showed a deviation
from the thermocouple measurements, which was more noticeable towards
the centre of the welded section.
2.2.4 Thermal and thermomechanical modelling
With the advance in using the fi nite-element (FE) method, several models
were developed to model the thermal fi elds (Bennett et al ., 2007 ; D’Alvise et
al ., 2002 ; Jeong et al ., 2007 ; Fu et al ., 2003 ; Grant et al ., 2009 ; Liwen et al ., 2004 ;
Moal and Massoni, 1995 ; Soucail et al ., 1992 ; Wang et al ., 2005 ), deforma-
tion stresses (D’Alvise et al ., 2002 ; Fu et al ., 2003 ; Moal and Massoni, 1995 ;
Soucail et al ., 1992 ) and residual stress development (Bennett et al ., 2007 ;
D’Alvise et al ., 2002 ; Grant et al ., 2009 ; Wang et al ., 2004 , 2005). The main

40 Welding and joining of aerospace materials
© Woodhead Publishing Limited, 2012
factor in assessing the quality of an FE model is the performance of the
validation using the measured process variables (e.g. welding time, tempera-
tures, upset and weld (fl ash) morphology), as well as the weld properties
(e.g. microstructural development and residual stresses). Nonetheless, early
models did not suffi ciently characterise the microstructure or the residual
stress characterisation.
Among the early models, Moal and co-workers established a two-
dimensional FE code (INWELD) to model the thermal and strain-fi eld
development, owing to IFW in the Astroloy powder metallurgy Ni-based
superalloy (Moal and Massoni, 1995 ; Soucail et al ., 1992 ). Their model was
complemented with in-depth mechanical (torsion) testing and microstruc-
tural characterisation to model the high-temperature deformation, dissolu-
tion/precipitation and rapid-heating kinetics of the γ ′ dissolution process
(Soucail et al ., 1992 ). The mechanical characterisation was used to construct
the rheological thermomechanical constitutive equations for the material
using Norton-Hoff law. The microstructural studies were used to predict
the thermal fi elds owing to IFW based on the γ ′ precipitates develop-
ment, which suggested that the temperature at the weld centre approached
~1280°C (above the γ ′ solvus but well below melting temperature). The heat
generation in the model was friction-induced using Coulomb’s friction law
developing to viscous fl ow at high temperatures. This required the calcula-
tion of the rotational velocity at each step, with the temperature and stress/
strain fi elds being computed simultaneously. Validation was performed
using the total upset, temperature (pyrometer) measurements and welding
time. Their later work (Moal and Massoni, 1995 ) included further validation
using the rotational speed. In spite of the model potential, it was not further
tested nor validated. Later, D’Alvise et al . developed a two-dimensional
coupled thermomechanical IFW model using FORGE2®, which is capa-
ble of predicting the temperature, stress/strain fi elds and residual stresses
in similar and dissimilar welds (D’Alvise et al ., 2002 ). The model used the
same heat-generation scheme as the previous model. However, the model
was only validated using temperature measurements, the weld upset, fl ash
morphology and the rotational speed, with reasonable agreement between
the model’s prediction and experimental data. Nonetheless, some features
of the reported model were not discussed or validated (e.g. residual stresses
and plastic strains), while the microstructural development was not even
considered.
Following the earlier models, several researchers utilised available FE
packages (e.g. MSC Marc and DEFORM 2D) to model the thermal and
stress/strain fi elds due to IFW, yet model validation was always limited
(mostly thermal, rotation speed and weld morphology) without considering
the microstructure nor the residual stress development (Fu et al ., 2003 ; Jeong
et al ., 2007 ; Liwen et al ., 2004 ). Yet, with the advance in electron microscopy

Inertia friction welding (IFW) for aerospace applications 41
© Woodhead Publishing Limited, 2012
and in residual stress characterisation using neutron diffraction, it became
possible to further validate the FE models using the residual stress pre-
dictions with measured stress profi les (Grant et al ., 2009 ; Wang et al ., 2004 ,
2005).
The work by Wang et al . focussed on modelling the residual stress devel-
opment in RR1000 (a high γ ′ Ni-based superalloy) welds using DEFORM,
and comparing it with residual stress data obtained using neutron diffrac-
tion (Wang et al ., 2004 , 2005). Their energy-input FE models were two-di-
mensional axisymmetric models, with a visco-plastic material model and
using a frictional heat fl ux ( q ), which is given by:
q
A
dE
dt A
dI
dt AI
d
dt( )t = =
( )t
= ( )t ( )( )t1
2
1
2
2 1
2
2
η ηdE 1
ω
ηω
[2.12]
where η is the effi ciency, A is contact interface area, I is the moment of
inertia, ω is the rotational velocity and t is the time. The model used the cal-
culated thermal fi elds to perform the residual stress analysis by perform-
ing creep (elastic) analysis during cooling. Generally, the predicted trends
matched the measured ones, whereby a bending moment was predicted in
the axial direction, while the hoop direction showed very high stress lev-
els that approached the yield strength, compared with the radial direction
that showed minimal stresses. Nonetheless, the predictions were ~15–35%
higher than the measured stresses, which was attributed to the lack of high
temperature creep data (>750°C) and the infl uence of the fl ash machining
(Wang et al ., 2005 ). Further validation was also performed through micro-
structural characterisation of the γ ′ precipitates development in three dif-
ferent welds, and comparing it with the model thermal predictions. The
work of Wang et al . was further improved by Grant et al . ( 2009 ), using a
larger material property database (up to 1150°C), better representation of
the heat generation model and the forging force application, and using an
elasto-plastic analysis of the stress development. Validation of the model
was performed using microstructural characterisation of base-metal speci-
mens that were thermally cycled using the model predictions, and the
residual stress measurements. The predicted residual stresses were both
spatially and quantitatively similar to the measured stresses, especially in
the hoop direction, although the model failed to predict the axial stresses
with the same accuracy ( Fig. 2.10 ). The radial stresses were generally neg-
ligible, especially considering the accuracy in the stress analysis using neu-
tron diffraction (±70 MPa).
Grant et al . also used their model to perform parametric simulations
investigating the infl uence of the forging pressure on the thermal fi elds. It

42 Welding and joining of aerospace materials
© Woodhead Publishing Limited, 2012
was found that the increase in the forging pressure leads to a slight increase
in the maximum temperature, resulting in steep thermal gradients ( Fig.
2.11a ). Nonetheless, by calculating the residual stress development, it was
evident that the increase in pressure only affected the location of the maxi-
mum hoop stress resulting in a narrower heat-affected zone (HAZ), but did
not affect the maximum stress quantity ( Fig. 2.11b ).600
600
500
500
800
800
800
700
600
900
900
900
900
1.000
1.0
00
1.1
00
1.100
1.200
600
600
600
700700
800
900
900
900
–600–300–300
–200–200
–100–100
0 00
100100
200 200
300300
400
–600–500 –500
–400–400–300–200–100
100 100200200
300 300400400
500500600
–100
–100
–150
–50
–50
00
0
50
–50 0
0
050
50
–50
–50
100
100
100
501
00
100
150
150
150
50
50
600
–1000
00
–300–200
1.0
001.1
00
1.1
001.2
00
1.00
0
800
800
700
700
2
1
0
–1
Wall
thic
kn
ess (
R)
(mm
)
Wall
thic
kn
ess (
R)
(mm
)
–2
2
1
0
–1
Wall
thic
kness (
R)
(mm
)
–2
2
1
0
–1
Wa
ll th
ickness (
R)
(mm
)
–2
2
1
0
–1
Wa
ll th
ickness (
R)
(mm
)
–2
2
1
0
–1
Wall
thic
kness (
R)
(mm
)
–2
2 2.0
1.0
–1.0
–2.0
0.0
2.0
1.0
–1.0
–2.0
0.0
Hoop (h)
Axial (z)
Radial (r)
1
0
–1
–2
2
1
0
–1
–2
2
1
0
–1
–2
2
1
0
–1
–2
2
1
0
–1
–2
0 1
Axial displacement (Z) (mm)
2 3 4 5
0 1 2 3 4 5
0 1
Axial displacement (Z) (mm)
2 3 4 5
0 1 2 3
Measured residual stresses Predicted residual stresses
4 5 0 1 2 3 4 5
0 1 2 3 4 5
0 1
Axial displacement (Z) (mm)
2 3 4 5
0 1 2 3 4 5
0 1
Axial displacement (Z) (mm)
2 3 4 5
0 1
Axial displacement (Z) (mm)
2 3 4 5 0 1
Axial displacement (Z) (mm)
2 3 4 5
0 1 2 3 4 5
600
600
500
500
800
800
800
700
600
900
900
900
900
1,000
1,0
00
1,1
00
1,100
1,200
600
600
600
700700
800
900
900
900
–600–300–300
–200–200
–100–100
0 00
100100
200 200
300300
400
–600–500 –500
–400–400–300–200–100
100 100200200
300 300400400
500500600
–100
–100
–150
–50
–50
00
0
50
–50 0
0
050
50
–50
–50
100
100
100
501
00
100
150
150
150
50
50
600
–1000
00
–300–200
800
800
700
700
1,1
00
1,2
00
1,0
00
1,1
00
1,00
0
2.10 A comparison between the measured and predicted residual stresses in RR1000 IWs using Grant et al. model (2009).

Inertia friction welding (IFW) for aerospace applications 43
© Woodhead Publishing Limited, 2012
0
Axia
l p
ositio
n Z
Axia
l p
ositio
n Z
Axia
l p
ositio
n Z
–8(a)
(b)
–6 –4 –2 0 2 4 6 8
–8 –6
1,750
1,500
1,250
1,000
750
500
Str
ess M
Pa
250
0
–250
–5000 5 10 15 20
Weld-L - 1.00
Weld-M - 1.37
Weld-H - 1.87
Distance from weldline (Z) mm
–4 –2 0
Radial position R
2 4 6 8
1
2
3
4
5Weld-L
Weld-M
Weld-H
0
1
2
3
4
5
0
1
2
3
4
5
0
1
2
3
4
5
0
1
2
3
4
5
0
1
2
3
4
5
650700 700 700
700750
750750800800 800
800
850850850900
900 900900
9509509501,000 1,000 1,000
1,050
1,0501,0501,050
1,15
0
1,150
1,200
1,200
1,200
1,200
1,250
1,150
700 700 700750
750750750
800 800 800850
850850850
900900 900
900
950
9509509501,0001,000 1,000
1,0501,050
1,0501,100
1,1
50
1,150 1,150
750 750 750 750800800800800
850 850900 900 900900
950 950 950 950
1,0001,0001,000
1,0501,1001,150 1,150 1,150 1,150 1,150
1,201,100 1,100 1,100
1,1
1,050 1,050 1,050
00
850 85
1,150 1,150
1,150
1,200
1,2
001,150
1,100 1,100 1,100
1,11,000
1,150 1,1501,150
1,1
1,1001,100 1,100 1,100
650 650
2.11 Infl uence of the forging pressure on (a) the thermal fi elds and (b) hoop stress (forging pressure low (L), medium (M) and high (H)) (Grant et al., 2009).
Recent IFW modelling reports used new numerical approaches (e.g.
Eigenstrain FE modelling (Korsunsky, 2009 )), but still focus on Ni-based super-
alloys welds. There are only a limited number of reports on IFW models when
joining other materials than Ni-based superalloys. In ferritic steels, a phase
transformation occurs during cooling after welding (e.g. martensitic or bainitic

44 Welding and joining of aerospace materials
© Woodhead Publishing Limited, 2012
transformation), resulting in a volumetric change affecting the residual stress
evolution in this region (Moat et al ., 2009 ). In their model, Bennett et al . stud-
ied the residual stress development in SCMV steel welds using a DEFORM
2D model (Bennett et al ., 2007 ), validated using the rotation speed, upset and
thermocouple measurements. At the end of the IFW cycle, the residual stress
development was traced throughout the martensitic transformation, where
the fraction transformed and a volumetric change parameter were calculated,
which was then used to investigate the infl uence of the transformation on the
residual stress development. Their fi ndings showed that the occurrence of the
transformation resulted in a signifi cant drop in the residual stresses owing to
the volumetric increase during cooling ( Fig. 2.12 ). Although this model is the
fi rst to investigate the infl uence of the phase transformation on the residual
stress development, the residual stress capability was not validated.
2.3 Microstructural development
Because of the nature of IFW, the resulting joint demonstrates a unique yet
localised microstructural residual stress, and mechanical properties develop
across the joint. Although it is generally believed that CDFW and IFW result
in a similar microstructural development (Kallee et al ., 2003 ), early IFW
literature suggested that the use of the fl ywheel results in circumferential
fl ow lines at the weld plane, compared with radial fl ow lines in non-fl ywheel
welds (Oberle et al ., 1967 ). It was argued that such a metallurgical difference
1.25
1.00
0.75
0.50
HAZ
σ /
σ ys
0.25
0.000 5
Interface 0.25mm
OD
No phase
transformations
With phase
transformations
Flash
10 15
Distance from weld interface (mm)
2.12 Infl uence of the phase transformation on the von Mises residual stress distribution (Bennett et al., 2007).

Inertia friction welding (IFW) for aerospace applications 45
© Woodhead Publishing Limited, 2012
would result in better fatigue properties of IFW welds owing to the spiral-
ling of the fl ow lines that become almost tangential to the surface, compared
with being normal to the surface in CDFW. Nonetheless, no comparative
studies have ever been performed to quantitatively assess the metallurgical
differences between IFW and CDFW to date. In the following sections, the
infl uence of IFW on the microstructural development in Ni-based superal-
loys, titanium alloys, steels and aluminium alloys will be discussed.
2.3.1 Nickel-based superalloys
The majority of the microstructural studies on Ni-based superalloy iner-
tia friction welds focussed on the development of the precipitate structure
in commonly used aerospace alloys, especially RR1000, IN718, U720Li,
Astroloy, and Waspaloy ( Table 2.1 ).
According to Adam ( 1982 ), inertia friction welds of Ni-based superal-
loys can be classifi ed into fi ve regions from the centre outwards (based on
Astroloy):
Fine grain region: this is the weld line where dynamic recrystallisation •
occurs.
Deformed and rotated grain region: where the intense plastic deforma-•
tion leads to the rotation and re-orientation of the grains.
Deformed grain region: where plastic deformation has occurred, with-•
out rotating the grain structure. HAZ: where the material is only thermally affected. •
Base (unaffected) metal: where the material is thermally and mechani-•
cally unaffected.
Conversely, Preuss et al . (2002a) found in RR1000 IFWs that weld-line
microstructure is actually not heavily deformed, showing coarse recrystal-
lised grain structure, followed by fi ne grains within 0.5 mm of the weld line .
Beyond the central region, the material was plastically deformed, with the
temperature insuffi cient to lead to recrystallisation.
Table 2.1 Chemical compositions (wt %) of selected aerospace Ni-based superalloys
Alloy Ni Cr Co Mo W Nb Ti Al Fe C Other
RR1000 52.3 15.0 18.5 5.0 – – 3.6 3.0 - 0.027 0.015B, 2Ta, 0.06Zr, 0.5Hf
Astroloy 56.5 15.0 15.0 5.25 – – 3.5 4.4 <0.3 0.06 0.03B, 0.06Zr U 720Li 57.0 16.0 15.0 3.0 1.25 – 5 2.5 - 0.025 0.03Zr IN718 52.5 19.0 - 3.0 – 5.1 0.9 0.5 18.5 0.08 0.15 max Cu Waspaloy 57.0 19.5 13.5 4.3 – – 3.0 1.4 2.0 0.07 0.06B, 0.09Zr
Source: Donachie and Donachie, 2002.

46 Welding and joining of aerospace materials
© Woodhead Publishing Limited, 2012
Owing to the nature of the precipitation strengthening mechanism in
Ni-based superalloys, several IFW studies investigated the development of
the γ ′ precipitate (Ferte, 1993 ; Huang et al ., 2007 ; Preuss et al ., 2002a , 2004,
2006; Soucail et al ., 1992 ; Wang et al ., 2005 ), and γ ′′ precipitate (Huang et al .,
2007 ; Preuss et al . 2006 ; Roder et al ., 2005 , 2006) structures using scanning
electron microscopy (SEM), transmission electron microscopy (TEM) and
synchrotron X-ray diffraction. Limited studies investigated the develop-
ment of grain boundary (GB) carbides/borides (Ferte, 1993 ; Montay et al .,
2007 ) and microtexture (Preuss et al ., 2002a ). Qualitatively, Huang et al .
investigated the precipitate development at the vicinity of the weld region
in a IN718-U U720Li weld using SEM and TEM (Huang et al ., 2007 ). In the
IN718 side ( Fig. 2.13 ), it was clear that the thermal fi elds experienced dur-
ing welding led to complete dissolution of the γ ′′, γ ′, or δ precipitates as far
as 2.1 mm from the weld centre, and also created a low dislocation density
structure. This led to a hardness drop observed in the IN718 side of the weld.
At 4 mm from the weld centre, evidence of the presence γ ′′ precipitate was
found. Similar observations were reported by Roder et al ., who investigated
the extent of dissolution of the γ ′′ and δ phase (Ni 3 Nb phase for grain-size
control), (Roder et al ., 2005 ). It was reported that whereas the γ ′′ phase was
fully dissolved up to ~500 µm from the weld centre, the δ phase was dis-
solved up to only ~300 µm from the weld centre.
2.13 The γ′′ precipitate development in IN718 (AW) at (a) 0.2 mm, (b) 0.7 mm, (c) 2.1 mm and (d) 4 mm from the weld line (Huang et al., 2007).
Inertia friction welding (IFW) for aerospace applications 47
© Woodhead Publishing Limited, 2012
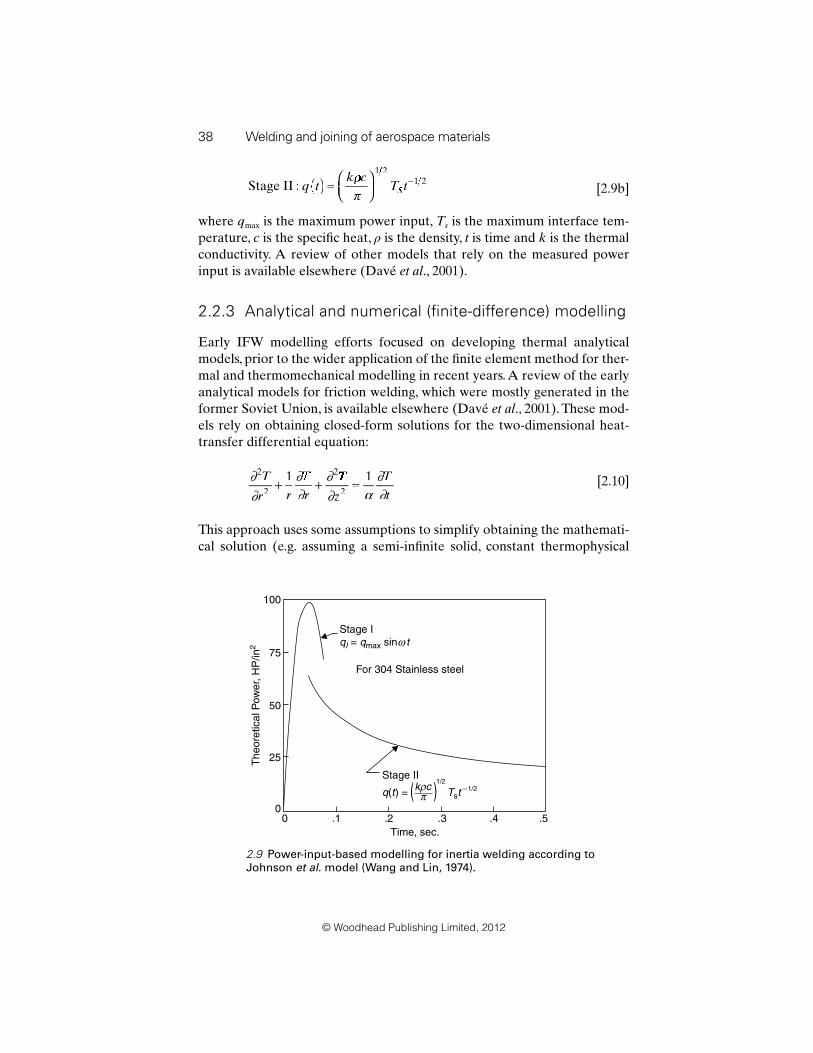
In highly γ ′-strengthened alloys (Astroloy (Soucail et al ., 1992 ), RR1000
(Preuss et al ., 2002a ), and U720Li (Huang et al ., 2007 )) a different develop-
ment in the weld centre was observed owing to the fast precipitation kinet-
ics of γ ′ and the high levels of γ ′′ stabilisers (this excludes Waspaloy). For
instance, at the weld centre U720Li IFW, a high fraction of reprecipitated γ ′
was observed ( Fig. 2.14a ), which has decreased dramatically only 1 mm from
the weld line ( Fig. 2.14c ) (Preuss et al ., 2004 ).
Preuss and co-workers used both synchrotron X-ray diffraction and image
analysis to map the γ ′ and γ ′′ fraction development in RR1000, IN718, and
U720Li IFWs across the weld line (Huang et al ., 2007 ; Preuss et al ., 2002a ,
2004, 2006). It was evident that IFW led to the dissolution of the strengthen-
ing precipitates in the weld region, which ranges from full dissolution of γ ′′
in the case of IN718, to dissolution and reprecipitation of γ ′ in RR1000 and
U720Li ( Fig. 2.15 ). These measurements show that IFW disturbs the precip-
itate volume fraction within a region of ±3 mm from the weld line, resulting
in hardness peaks caused by reprecipitation during cooling in the presence
of a strong driving force for reprecipitation in RR1000 and U720Li, or
hardness troughs caused by partial or full dissolution (Preuss et al ., 2002a ).
(a) (b)
(c)
100 nm 100 nm
100 nm
2.14 The γ′ precipitate development in U720Li (AW) (a) at the weld line, (b) 0.5 mm and (c) 1 mm from the weld line (Preuss et al., 2004).

48 Welding and joining of aerospace materials
© Woodhead Publishing Limited, 2012
By correlating the γ ′ distribution with the microhardness distribution in
RR1000 (Preuss et al ., 2002a ) and U720Li (Preuss et al ., 2004 ), it becomes
evident that the hardness variation is controlled by a combination of
strengthening mechanisms (precipitate strengthening, GB strengthening
and work hardening), as correlated through measurements of the grain
size, tertiary γ ′ volume fraction and γ / γ ′ misfi t, although the contributions of
these effects have not been quantifi ed (Preuss et al ., 2002a ). In inertia fric-
tion welded Astroloy, Soucail et al . (1992) found a high dislocation density,
with tangled dislocations, Orowan loops and sheared particles with varying
extents depending on the distance from the weld centre . Electron backscatter
diffraction (EBSD) maps also showed regions of high stored energy about
1 mm from the weld line in inertia friction-welded RR1000 (Preuss et al .,
2002a ). This demonstrates that a region exists adjacent to the recrystallised
region where material has been deformed signifi cantly, but the stored energy
was not suffi cient to result in dynamic recrystallisation.
In addition to the microstructural investigations of the precipitate struc-
ture, other microstructural features of interest include the development
of the GB carbides (Ferte, 1993 ; Montay et al ., 2007 ). The high tempera-
ture experienced during welding (~1200°C) is suffi cient to dissolve (fully
or partially) any existing carbides, which subsequently reprecipitate at the
grain boundaries during cooling or post-weld heat treatment (PWHT). The
morphology of the GB carbides has a strong infl uence on the ductility and
fatigue properties, where discrete or globular carbide particles are benefi cial
as they act as obstacles for GB motion, while continuous carbide fi lms are
1.2
1.0
0.8
0.6
I(100)/
I(200)
0.4
0.2
0.0–1 0 1 2 3 4 5 6 7
z /mm
Inconel 718
Alloy 720 LI
RR1000
2.15 The normalised integrated intensity (±0.04 accuracy) of the γ′ superlattice refl ection as a function of the distance from the weld line (z) in the AW condition of IN718, 720Li and RR1000 IWs (Preuss et al., 2006).

Inertia friction welding (IFW) for aerospace applications 49
© Woodhead Publishing Limited, 2012
harmful (Li et al ., 2007 ). Li et al . detected the formation of continuous fi lms
of M 23 C 6 carbides with a relatively high Cr content close to the weld region
within the primary γ ′-free zone in the U720Li side of a IN718-U720Li IFW
following PWHT (Li et al., 2007 ) ( Fig. 2.16 ). As it is known that the high Cr
content of the carbides results in a localised depletion of Cr in their vicinity,
this is expected to result in poor oxidation damage resistance in these welds.
The formation of the carbides was reported to have a negative infl uence on
the fatigue-crack propagation (FCP) properties of Ni-superalloy welds as
will be discussed later (Daus et al ., 2007 ; Li et al ., 2007 ).
It was suggested that performing a solution-plus-aging treatment to redis-
tribute the carbides could solve the problem of the continuous GB carbides.
Following this approach, Ferte compared three PWHT conditions in N18
IFWs, where it was found that on increasing the PWHT time from 4 to 8 h
at 800°C, grain boundaries became increasingly decorated with Cr-Mo car-
bides (Ferte, 1993 ). However, on performing a solution treatment plus aging
PWHT, a bimodal γ ′ precipitate structure was obtained in the weld centre,
70
Cr Ni
Al W
Mo Co Ti
60
50
40
30
20
10
0–4 –3 –2 –1 0 1 2 3 4
Analysis number
We
igh
t p
erc
en
t
(a) (b)
(c) (d)
2.16 GB carbides (M23C6) precipitation in 720 Li in the primary γ′ free zone following PWHT (a) SEM, (b) bright and dark-fi eld TEM with SAD pattern, (c) and (d) chemical analysis across a carbide particle (Li et al., 2007).

50 Welding and joining of aerospace materials
© Woodhead Publishing Limited, 2012
whose sizes are similar to those of the parent metal. Although this latter
treatment led to a signifi cant improvement in the FCP resistance, it also
led to large grain growth in the HAZ, which can be attributed to the large
stored energy present in some parts of the HAZ. It is also worth noticing
that a solution heat treatment of large welded components is economically
not viable.
2.3.2 Steels
The majority of the microstructural studies on steel IFW dealt with ferritic
steels. During IFW of ferritic steels, the temperature of the material at the
interface exceeds the austenisation temperature, which, alongside the ther-
momechanical deformation, results in a very unique microstructure and tex-
ture. The temperature decreases gradually from the weld centre towards the
HAZ and the parent metal. Upon cooling, the microstructure shows varying
amounts of ferrite, martensite, bainite or retained austenite across the weld
regions, depending on the cooling rates and the stresses.
Among the most notable IFW applications in the aerospace industry is
the dual drive shaft (dissimilar SCMV-AerMet100 IFW joint) (Moat et al .,
2008 , 2009; Robotham et al ., 2005 ), which received the most thorough char-
acterisation among the ferrous welds. SCMV (0.3% C, 3.15% Cr, 1.6% Mo,
0.1% Va, 0.6% Si) is used at the turbine (high-temperature) end of the aero
engine drive shaft, while Aermet 100 (0.2% C, 2.5% Cr, 10.1% Ni, 12.7%
Co, 1.37% Mo, 3.26% Nb, 0.01% Mn) is used at the compressor end of the
shaft, where a high-strength alloy is required to withstand the high torque
(Robotham et al ., 2005 ). Moat et al . (2008) divided the weld into four regions
( Fig. 2.17 ) :
the weld (bond) line (interface): where a slight banding between the two •
alloys was observed, yet without full mixing
Weld line
HAZ HAZ
2 mm
AerMet100 SCMV
TMAZ TMAZ
2.17 Microstructural zones in the AerMet100-SCMV IW. (Courtesy of R. J. Moat.)
Inertia friction welding (IFW) for aerospace applications 51
© Woodhead Publishing Limited, 2012
the (partially or fully) deformed zone or the thermomechanically •
affected zone (TMAZ): where varying thermomechanical effects result
in the deformation of the parent microstructure, but not to annihilate it
completely
the HAZ: where the microstructure experiences only thermal effects, •
resulting in the formation of a recrystallised equiaxed grain structure,
with some coarsening (Robotham et al ., 2005 )
the unaffected parent metal. •
The width of the regions is dependent on the process parameters with
the forging pressure having a major impact on HAZ (high pressure nar-
rows HAZ) and TMAZ (high pressure increases extent of deformation).
Conversely, the increase in the rotation speed (also weld energy) widens the
HAZ accompanied with a relatively coarse grain morphology. As a result,
a two-stage pressure can be occasionally used to refi ne the grain structure,
by applying a higher pressure following the stop of the spindle (Robotham
et al ., 2005 ).
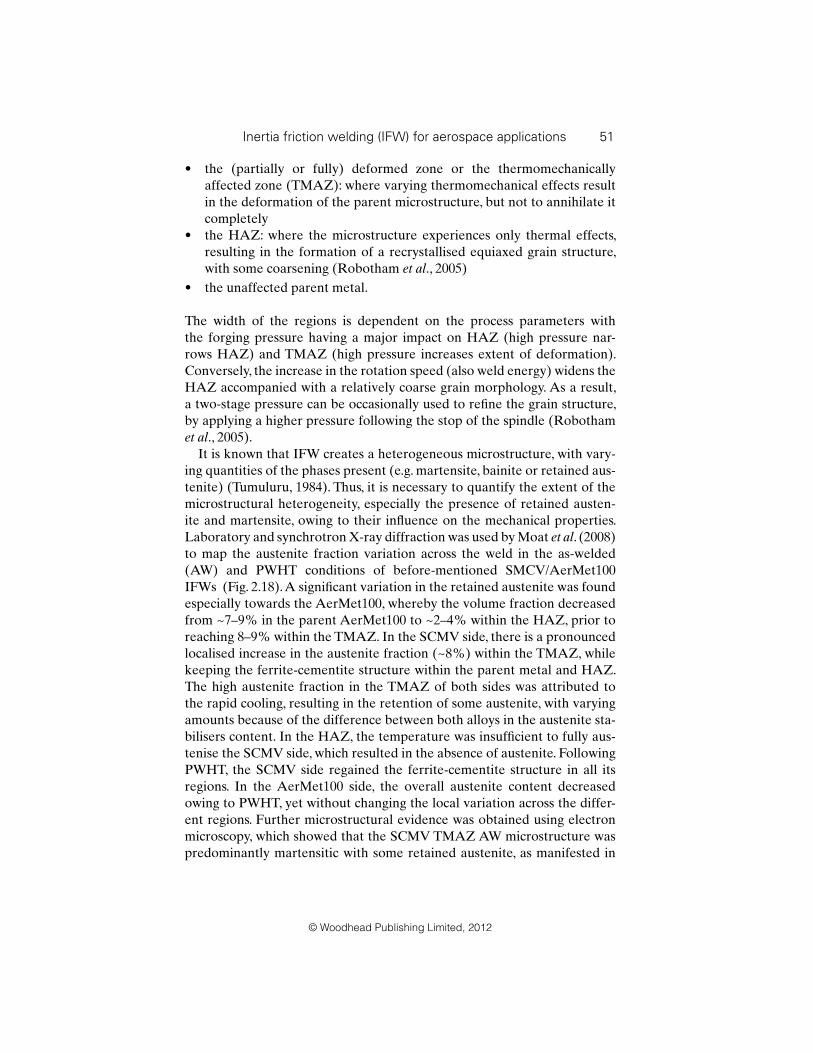
It is known that IFW creates a heterogeneous microstructure, with vary-
ing quantities of the phases present (e.g. martensite, bainite or retained aus-
tenite) (Tumuluru, 1984 ). Thus, it is necessary to quantify the extent of the
microstructural heterogeneity, especially the presence of retained austen-
ite and martensite, owing to their infl uence on the mechanical properties.
Laboratory and synchrotron X-ray diffraction was used by Moat et al . (2008)
to map the austenite fraction variation across the weld in the as-welded
(AW) and PWHT conditions of before-mentioned SMCV/AerMet100
IFWs ( Fig. 2.18 ). A signifi cant variation in the retained austenite was found
especially towards the AerMet100, whereby the volume fraction decreased
from ~7–9% in the parent AerMet100 to ~2–4% within the HAZ, prior to
reaching 8–9% within the TMAZ. In the SCMV side, there is a pronounced
localised increase in the austenite fraction (~8%) within the TMAZ, while
keeping the ferrite-cementite structure within the parent metal and HAZ.
The high austenite fraction in the TMAZ of both sides was attributed to
the rapid cooling, resulting in the retention of some austenite, with varying
amounts because of the difference between both alloys in the austenite sta-
bilisers content. In the HAZ, the temperature was insuffi cient to fully aus-
tenise the SCMV side, which resulted in the absence of austenite. Following
PWHT, the SCMV side regained the ferrite-cementite structure in all its
regions. In the AerMet100 side, the overall austenite content decreased
owing to PWHT, yet without changing the local variation across the differ-
ent regions. Further microstructural evidence was obtained using electron
microscopy, which showed that the SCMV TMAZ AW microstructure was
predominantly martensitic with some retained austenite, as manifested in

52 Welding and joining of aerospace materials
© Woodhead Publishing Limited, 2012
the laths and the absence of carbides. In the AerMet100, the thermal expo-
sure led to some precipitation of the M 2 C carbides, with varying degrees.
These complicated developments resulted in a unique microhardness devel-
opment as will be discussed in the section ‘Microhardness development’.
2.3.3 Titanium alloys
The microstructural investigations of inertia-friction-welded aerospace tita-
nium alloy are very limited, and do not provide suffi cient information on the
several classes of titanium alloys ( α , α + β and β alloys). Among the earliest
reports on IFW of α + β titanium alloys, Nessler et al . performed preliminary
microstructural investigations of Ti-8Al-1V-1Mo and Ti-6Al-4V (Nessler
et al ., 1971 ). No evidence of melting was found, although a narrow alpha-
case region was observed at the centre of the fl ash. Generally, the weld
region was narrow (~3 mm) and mostly composed of a highly deformed
structure with fi ne grains. At the weld centre, martensitic α′ was observed,
which apparently resulted from rapid cooling from above the β -transus tem-
perature (~1000°C). In a different investigation, the HAZ microstructure in
Ti-6Al-4V IFW was also found to contain Widmanstätten α (transformed
β grains) (English, 1995 ). Similarly, inertia friction welded Ti-6Al-2Sn-
4-Zr-2Sn also displayed a refi ned lamellar α structure in the weld region
(Barussaud and Prieur, 1996 ).
8 SCMV
as-welded +
cryogenic treated PWHT’ed
Weldline
Aermet 100
6
4
2
0
–2
Axia
l / m
m
Axia
l / m
m
–4
–6
–8
–10
8
9
8
7
6
5
4
3
2
1
0 Volu
me p
erc
ent auste
nite / %
6
4
2
0
–2
–4
–6
–8
–10
–18 –13
Radial / mm Radial / mm
–8 8 13 18
2.18 A two-dimensional map for the austenite fraction in SCMV- AerMet100 IWs (AW and PWHT conditions) as measured by high- energy synchrotron X-ray diffraction (Moat et al., 2009).

Inertia friction welding (IFW) for aerospace applications 53
© Woodhead Publishing Limited, 2012
Baeslack III et al . studied an IFW of a rapidly solidifi ed titanium alloy
(Ti-6.4Al-3.2Sn-3.0Zr-2.7Er -2.5Hf-1Nb-0.33Ge-0.3Ru-0.15Si) (Baeslack
III et al ., 1991 ). The weld regions were classifi ed into an inner heat and defor-
mation zone (HDZ), which is ~25 µm wide with dynamically recrystallised
fi ne β grains with fi ne Er-rich dispersoid (100–350 nm) precipitates along
the grain boundaries and an outer HDZ (~500 µm wide) that contained
transformed β grains with α colonies. The unique composition of this exper-
imental alloy makes it diffi cult to generalise the fi ndings of this study.
A single report by Roder et al . (2003) is available on the microstructural
development of inertia-friction-welded Ti-6Al-2Sn-4Zr-6Mo, an α + β Ti alloy
that is more heavily β -stabilised than Ti-6Al-4V . Upon welding, four unique
microstructural zones were observed ( Fig. 2.19 ):
region I (centre to 175 µm): showing recrystallised • β grains (~20 µm in
size)
region II (175–275 µm): showing recrystallised • β grains (~10 µm in size),
and deformed β grains (>20 µm in size), which are elongated, in the
radial direction
region III (275–525 µm): showing deformed • β grains similar to those in
region II
region IV (525–1500 µm): showing a deformed parent microstructure. •
An interesting feature in Ti-6246 IFWs is the observation of the so-called
ghost α plates in region III, which are α P plates from the base metal that was
heated up to the β -phase fi eld, without allowing suffi cient time for diffusion
to homogenise the chemical composition. Following PWHT, fi ne α needles
precipitated within the β grains in all the regions (I–IV).
It is important to note that the publically available investigations do not
provide detailed information on the microstructure development in inertia-
friction-welded titanium alloy. Several alloys need to be further investigated
(e.g. Ti-64 and Ti-6246) and the feasibility of welding alloys such as Ti-5553
IV IVCentre
200 µm2h 6
40
°Cw
ithout
PW
HT
III IIIII III I
2h 6
40
°Cw
ithout
PW
HT
2.19 Microstructural zones in a Ti-6246 IW (AW and PWHT) (Roder et al., 2003).

54 Welding and joining of aerospace materials
© Woodhead Publishing Limited, 2012
need to be pursued to increase the opportunities of using titanium IFW in
the aerospace industry.
2.3.4 Other alloys
There are few preliminary reports in the literature on the weldability of
other alloys using IFW, including B2 aluminides (Whittenberger et al .,
1987 ), aluminium-based alloys (Hou and Baeslack III, 1990 ; Koo et al .,
1991 ), metal-matrix composites (Lienert et al ., 1996 ) and dissimilar welds
(Jeong et al ., 2007 ; Zhu et al ., 2009 ). The interest in iron and nickel alu-
minides as potential high-temperature materials in the mid-1980s led to
an interest in performing investigations of their weldability. Whittenberger
et al . (1987) investigated a dissimilar FeAl and NiAl IFW . In contrast to
fusion welding, IFW of these alloys did not lead to cracking or porosity for-
mation, but instead it was composed of fi ne equiaxed grains. Nonetheless,
upon performing post-weld annealing at 1027°C for 16 h, recrystallisation
occurred leading to grain coarsening, which was detrimental for high-
temperature creep strength. This initial report was never followed by any
other investigations for the metal aluminides.
Preliminary studies were performed in the early 1990s to investigate the
inertia friction weldability of rapidly solidifi ed alloys, Al-Fe-Mo-V (Hou
and Baeslack III, 1990 ) and Al-Fe-V-Si (Koo et al ., 1991 ), which involved
microstructural characterisation of the weld regions using electron micros-
copy and mechanical testing. This work was further extended by studying
SiC-reinforced Al-Fe-V-Si alloy, which showed that composites are also
weldable using IFW. Nonetheless, beyond these studies, the interest of IFW
of Al alloys has not been revived again for over a decade.
There has been some recent interest in investigating the weldability
of dissimilar superalloy-steel IFWs. Jeon et al . performed a preliminary
microstructural and mechanical property characterisation of a Nimonic
80A/SNCrW IFW (Jeong et al ., 2007 ). Although there is a lack of extensive
mixing at the weld interface, the welds had mechanical properties (strength
and fatigue) better than the properties of SNCrW. In another report, Zhu
et al. (2009) investigated a Nimonic 80A/4Cr 10 Si 2 Mo dissimilar weld using
electron microscopy . Chemical analysis by X-ray spectroscopy was used
to characterise the extent of mixing at the weld interface that showed that
there is a central mixing zone (equivalent to the weld line) of ~100 µm
width. The weld line was composed of austenite grains of 3–5 µm size, with
fi ne carbides (50 nm in size). Beyond the mixing region, a high disloca-
tion density region was found, similar to that described earlier for inertia-
friction-welded Ni-based superalloys called, in this case, the pure shearing
region.

Inertia friction welding (IFW) for aerospace applications 55
© Woodhead Publishing Limited, 2012
As it was discussed, the studies on alloys other than Ni-based superalloys,
steel and titanium are very limited. Although IFW is known to have been
applied to other aerospace materials, the majority of the welds produced
are mostly for Ni-based superalloys, and only recently on steel and titanium.
Further work is needed to investigate the utility of IFW in welding new
aerospace materials and particularly the ability to join dissimilar metals and
alloys.
2.4 Development of mechanical properties
2.4.1 Ni-based superalloys
Microhardness development
Owing to the nature and the volume fraction of the strengthening phases,
differences in the microhardness distribution were observed between iner-
tia friction welds of advanced Ni-based alloys with a high γ ′ volume fraction
(e.g. RR1000, U720Li, etc.) and welds of superalloys with a volume fraction
of about 20–25% precipitates, such as Waspaloy and the γ ′+ γ ′′-strengthened
IN718. In general, the latter class of superalloys tends to display a signif-
icant hardness trough in the weld region in the AW condition, towing to
either a complete absence or at least signifi cantly reduced volume fraction
of strengthening precipitates (Waspaloy Fig. 2.20a ) (Adam, 1982 ; Roder
et al ., 2005 ). However, in alloys with γ ′-volume fractions around 40–50%
(e.g. RR1000 (Preuss et al ., 2002a , 2006), N18 (Ferte, 1993 ), U700 (Adam,
1982 ), U720Li (Preuss et al ., 2004 , 2006) and Astroloy (Ferte, 1993 ), with
~50% γ ′), both the region close to the weld centre and the HAZ show hard-
ness peaks even in the AW condition (RR1000, Fig. 2.20b). This behaviour
was attributed to the higher levels of γ′-stabilising alloying elements such
as Al and Ti found in such alloys compared with, for example, Waspaloy
providing a high driving force of γ ′ reprecipitation during rapid cooling fol-
lowing welding (Preuss et al ., 2002a ). However, a small hardness trough, as
shown in Fig. 2.20b, can still be observed attributed to the partial γ ′ dissolu-
tion during welding not providing a suffi ciently high driving force for repre-
cipitation during cooling. Following PWHT in γ ′-rich alloy inertia friction
welds, additional γ ′ precipitation occurs resulting in an overall increase in
hardness, with the maximum hardness occurring towards the weld centre
(tertiary γ ′), and decreasing towards the base metal with a change in the
slope in the previously observed hardness trough in the AW condition (Fig.
2.20b) (Preuss et al ., 2002a ). Similar PWHT hardness trends were observed
in other γ ′-rich alloys inertia friction welds (e.g. U700 (Adam, 1982 ), U720Li
(Preuss et al ., 2004 , 2006), and N18 (Ferte, 1993 )).

56 Welding and joining of aerospace materials
© Woodhead Publishing Limited, 2012
In the γ ′+ γ ′′-strengthened alloy IN718 following a PWHT, the hardness
of the weld region is either slightly or fully regained depending on whether
a low temperature anneal or a complex multistage PWHT was undertaken
( Fig. 2.21 ) (Roder et al ., 2005 ). In fact, the latter PWHT led to a slight hard-
ness increase in the weld region compared with the base metal, which was
attributed to superposition of precipitate and grain-size strengthening.
In dissimilar inertia friction welds, Daus et al . (2007) studied the infl uence
of the process parameters on the hardness development in RR1000-IN718
welds . Three welds were investigated, representing different parameter
combinations ( Fig. 2.22a ). It was evident that the hardness traces created a
combination of the typical trends in the welds of γ ′ and γ ′+ γ ′′-strengthened
alloys as previously discussed, with the RR1000 side showing two peaks
550
HV1(b)
(a)
525
500
475
450
425
400
450
350
250
5 10
Distance (mm)
5
HV3 (Kg/mm2)
54 43 32 1 2
0 2 4
AM
PWHTA
6 8 10
Distance from weld centreline (mm)
2.20 The effect of the γ′ content on the microhardness development (mid-thickness) in IFWs of Ni-based superalloys: (a) low γ′ Waspaloy (Adam, 1982), and (b) high γ′ RR1000 (Preuss, 2002a).

Inertia friction welding (IFW) for aerospace applications 57
© Woodhead Publishing Limited, 2012
with a small trough in between, while the IN718 side showed a signifi cant
hardness trough in the weld region. The dissimilar hardness trend follow-
ing PWHT was observed in U720Li-IN718 welds (Huang et al ., 2007 ) (Fig.
2.22b). Following PWHT, the hardness of the weld region (±6 mm from
the weld centreline) generally increased to a maximum of ~550 H V in the
U720Li side and ~490 H V in the IN718 side, with the weld region in each
side showing hardness values above its respective base metal. It was also
found that the increase in PWHT time led to the parent IN718 being over-
aged, while the hardness of the U720Li side remained roughly unchanged.
It was generally recommended that PWHT of IN718 is performed either by
full annealing at 955°C to avoid heterogeneous aging effects (Donachie and
Donachie., 2002 ), or below 732°C to maximise the weld strength. However,
U720Li requires signifi cantly higher temperatures between 760°C (Huang
et al ., 2007 ) and 1135°C (Donachie and Donachie., 2002 ) to relieve the high
stresses that result from the welding process. This highlights one of the fun-
damental issues when joining Ni-base superalloys with different temperature
capability. While a low-temperature PWHT might avoid overaging of the
alloy with the comparatively low temperature capability, such heat treat-
ment is unlikely to be effective in terms of relieving residual stresses in the
alloy with high-temperature capability. In contrast, if the high-temperature
alloy guides the PWHT procedure, it is likely that the ‘low’-temperature
alloy will get overaged resulting in low strength. This demonstrates the
importance of considering microstructure/mechanical property develop-
ment together with residual stress mitigation particularly in dissimilar welds
when identifying appropriate PWHTs. Further dissimilar microhardness
traces for IN718-X (X: U720Li, Incoloy909, René88) including the infl u-
ence of different PWHT, can be found in the work of Roder and co-workers
(Roder et al ., 2005 , 2006).
–5 –4 –3
Hard
ness
–2 –1 0 1 2 3 4 5
Distance from weld centreline (mm)
200
250
300
350
400
450
500
200
250
300
350
400
450
500PWHT2
PWHT1
AW
2.21. Microhardness distribution (mid-thickness) in γ′+γ′′-strengthened IN718 (Roder et al., 2005).

58 Welding and joining of aerospace materials
© Woodhead Publishing Limited, 2012
Tensile properties
To measure the cross-weld mechanical properties, Preuss et al . used electron
speckle-pattern interferometry (ESPI) to measure the proof-stress distri-
bution across the weld in IN718, RR1000 and U720Li alloys IFWs (Preuss
et al ., 2006 ) ( Fig. 2.23 ). The distribution shows a soft-weld region in IN718,
with a yield strength of ~650 MPa. Although the proof-stress traces agree
qualitatively with the microhardness profi les, they provide further quanti-
tative information on the local tensile properties of the weld regions. To
investigate the effect of the test temperature, Roder and co-workers mea-
sured the PWHT tensile strength and ductility in similar and dissimilar
–10
–12 –10 –8 –6 –4
HAZ
AS-weldedPWHT 2hPWHT 4hPWHT 8hPWHT 24h
HAZ
IN718720Li
–2 0 2 4 6 8 10 12
d/mm
–8
560(b)
(a)
540
520
500
480
460
440
420
400
380
360
340
320
300
280
260
560
540
520
500
480
460
440
420
400
380
360
INC
ON
EL 7
18/H
V1
340
320
300
280
260
UD
IME
T 7
20Li/H
V1
–6 –4 –2 0200
250
300300
350
400
450
500
550IN718
Hard
ness (
HV
)
RR1000
2 4 6 8
Weld A
Weld B
Weld C
10
Axial distance to weld line (mm)
2.22 Hardness distribution in dissimilar IN718-X IFWs. (a) IN718-RR1000 (AW) (Daus et al., 2007), (b) U720Li-IN718 (Huang et al., 2007).

Inertia friction welding (IFW) for aerospace applications 59
© Woodhead Publishing Limited, 2012
IN718 welds (Roder et al ., 2005 , 2006). It was found that failure generally
occurred in the IN718 side of the weld, except for Incoloy909 alloy. A drop
in tensile strength (200–300 MPa from strength at 20°C) was observed for
IN718 welds tested at high temperature (650°C), yet strength was generally
within the typical range for IN718. However, in IN718-U720Li welds failure
occurred at strength levels below the typical levels for IN718 and U720Li
regardless of the PWHT parameters.
Fatigue-crack propagation (FCP)
Limited work is available on the FCP measurements in similar Ni-superalloy
inertia friction welds, with a single report on N18 welds (Ferte, 1993 ). The
majority of FCP measurements in Ni-superalloys inertia friction welds
were performed on dissimilar IN718-X welds (X: RR1000 or U720Li)
(Daus et al ., 2007 ; Li et al ., 2007 ). The FCP studies investigated the infl u-
ence of the PWHT parameters (Ferte, 1993 ), test temperature (Daus et
al ., 2007 ; Montay et al ., 2007 ) and the local FCP rates in different weld
regions (Montay et al ., 2007 ). For more general information on FCP in
Ni-based superalloys (especially RR1000), the reader is directed to other
references (Everitt et al ., 2007 ; Knowles and Hunt, 2002 ; Starink and Reed,
2008 ). Ferte ( 1993 ) showed that the PWHT parameters signifi cantly affect
the FCP rates in N18 IFWs. By increasing the PWHT duration from 4
to 8 h at 800°C, the FCP rates decreased owing to the precipitation of
(Cr,Mo)-rich carbides along the grain boundaries. By introducing a post-
weld solution stage at 1165°C for 4 h in the process, roughly full reten-
tion of the parent FCP rates was observed in the welded sections ( Fig.
2.24a ), which was attributed to the formation of a similar microstructure
1,300
1,200
1,100
1,000
900
800
700
600–10 –5 0 5 10
z/mm
Inconel 718
Alloy 720Ll
RR1000
0.2
% p
roof str
ess/M
Pa
2.23 Proof-stress (0.2%) distribution in AW IFWs of IN718, RR1000, and 720Li (average accuracy ±10–50 MPa) (Preuss et al., 2006).

60 Welding and joining of aerospace materials
© Woodhead Publishing Limited, 2012
to that of the parent metal. To consider the infl uence of the test tempera-
ture, Li et al . found that the FCP rates increased with the increase in tem-
perature in RR1000-IN718 PWHTed welds (Li et al ., 2007 ) ( Fig. 2.24b ). The
observed irregularity in the rates at 600 and 650°C was attributed to the
crack deviation from RR1000 to IN718, as discussed elsewhere (Daus et
al ., 2007 ). Moreover, the increase in test temperature was also associated
with the dominance of intergranular fracture, compared with fully trans-
granular failure for the test performed at 500°C. The transition temperature
(~600°C) between the transgranular and intergranular fracture supported
the suggestion that an oxidation damage mechanism exists in Ni-based
superalloys within this temperature range (Pint et al ., 2006 ). To identify the
causes for the poor FCP at 650°C, Li et al . further investigated the infl uence
10
da/dN (mm/cycle)(a)
(b)
Weld+1165°C(4hr)+700°C (24hr)
1
0.1
0.01
0.001
0.000110
da/d
N (
mm
/cycle
)
100
650°C in air
550°C in air500°C in air
600°C in air
∆K (MPa.m1/2)
∆K (MPa√m)
Base metal
Weld+700°C (24hr)
+800°C (8hr)
Weld+700°C (24hr)
+800°C (4hr)
2.24 FCP in Ni-superalloy inertia friction welds, showing the infl uence of (a) PWHT tested at room temperature and (b) the test temperature (following PWHT). (a) N18 (Ferte, 1993), (b) RR1000-IN718 (Li et al., 2007).

Inertia friction welding (IFW) for aerospace applications 61
© Woodhead Publishing Limited, 2012
of the starting parent metal on the FCP rate, as well as the infl uence of the
sample location with respect to the weld. When testing welds of alloys of
similar γ ′ fraction (RR1000 and U720Li), it was found that the worst FCP
condition in the U720Li weld half, corresponding to the primary γ ′-free
zone (PGF), had a faster FCP rate compared with the similar condition in
RR1000 weld ( Fig. 2.25a ). Moreover, the FCP rates were generally lower
when tested in vacuum, with the highest rates occurring in the PGF zone,
followed by the TMAZ ( Fig. 2.25b ).
2.4.2 Steels
Microhardness development
Depending on the type of the alloy, the microhardness development in steel
IFWs showed several trends. In a low-carbon steel solid inertia friction weld,
the hardness was generally highest at the weld centre, and decreased until
it reached the base-metal hardness (Wang and Lin, 1974 ) ( Fig. 2.26a ). The
hardness decreases from the centre of the weld interface outwards owing
to the concavity of the weld region. In mild-steel tubular welds, the hard-
ness was also high at the weld centre, yet it sharply decreased beyond the
weld line within the HAZ, prior to increasing again as the base metal was
approached ( Fig. 2.26b ).
In dissimilar steel inertia friction welds (e.g. SCMV-AerMet100 (Moat
et al ., 2008 ; Robotham et al ., 2005 )), the joining process results in a more
complex microhardness distribution ( Fig. 2.27 ). In an SCMV-AerMet100
IFW the three typical distinct zones, TMAZ, HAZ and base material, were
Worst 720Li PGF
(a) (b)
Worst RR1000 PGF
RR1000 Parent
720Li Parent
da
/dN
(m
m/c
ycle
)
da
/dN
(m
m/c
ycle
)
∆K (MPa√m) ∆K (MPa√m)
650°C in air 650°C
720Li P,
air
IN718 PAZ,
air
720Li PGF, air
720Li PAZ, air
IN718 P,
air
720Li PGF,
vacIN718 P, vac
720Li P,
vac
2.25 FCP in Ni-based superalloy inertia PWHT welds (Li et al., 2007), showing the infl uence of (a) the parent material (IN718/RR1000 or 720Li welds), (b) the crack location (IN718–720Li).

62 Welding and joining of aerospace materials
© Woodhead Publishing Limited, 2012
identifi ed on each weld side. While in SCMV the hardness of the HAZ was
lower than the base metal, in AerMet100 the hardness was actually higher
than the base metal. Conversely, in the TMAZ of SCMV the hardness was
higher than the base metal, while in AerMet100 it was lower. Following
the PWHT, the extent of heterogeneity of the microhardness distribution
950
(a)
(b)
177
Periphery
213
215
Interface
239
261
281
Knoop h
ard
ness
Centerline ofspecimen
850
750
650
600–10 –5 0 5
Average error bars for:
Vickers hardness
ESPI
IC
Hardness profileESPI profileIC profile
10
Distance from weld centre line (mm)
Ha
rdn
ess (
HV
), 0
.2%
pro
of str
ess (
MP
a)
700
800
900
2.26 Microhardness development in steel inertia welds. (a) A quarter of a 3/8” (9.5 mm) diameter solid low-carbon steel weld section, showing the local variations across the weld line and the depth (Wang and Lin, 1974), and (b) microhardness distribution in a mild steel inertia weld, alongside local mechanical properties (Fonseca et al., 2004).

Inertia friction welding (IFW) for aerospace applications 63
© Woodhead Publishing Limited, 2012
decreased, with each side retaining a roughly uniform hardness distribution,
except for a localised drop in hardness in the HAZ of both sides. These dif-
ferences were attributed to the variation in the fractions of the phases pres-
ent (e.g. martensite, austenite, ferrite and cementite) across the weld regions,
depending on the alloy, cooling rates and temperatures experienced, as well
as the heterogeneous plastic deformation at the TMAZ and aging of the
M 2 C carbides in the AerMet100 side.
2.4.3 Titanium alloys
Tensile properties
Early work by Nessler et al . (1971) studied the infl uence of IFW on the
tensile, low-cycle fatigue (LCF) and reverse high-frequency bending prop-
erties of titanium-alloy inertia friction welds . It was shown that certain weld-
ing parameters (welding speed, forging pressure, surface roughness, joint
squareness and concentricity) did not have a statistically signifi cant infl u-
ence on the mechanical properties. Nonetheless, on investigating the infl u-
ence of the weld upset on the tensile properties, it became clear that both
the tensile strength and ductility improved with the increase in upset ( Fig.
2.28 ). The properties were generally reproducible in Ti-6Al-4V and Ti-6Al-
2Sn-4Zr-2Mo IFWs once they were welded with the parameters that pro-
duced an upset of ~4 mm. Roder et al . (1999) also investigated the tensile
strength of Ti-6246 IFWs at 20 and 300°C . The base-metal tensile strength
8
as-welded +
cryogenic treated
PWHT′ed
SCMV
Weldline
Aermet 100
575
700
575
550
575
009
500
500
475
6
4
2
0
Axia
l / m
m
Axia
l / m
m
HV
0.5
–2
–4
–6
–8
–10
8
750
725
700
675
650
625
600
575
550
525
500
475
450
425
400
375
350
6
4
2
0
–2
–4
–6
–8
–10
–18 –13 –8 8 13 18
Radial / mm Radial / mm
2.27 Microhardness distribution in the AW, and PWHT conditions for a SCMV-AerMet100 (Moat et al., 2009).
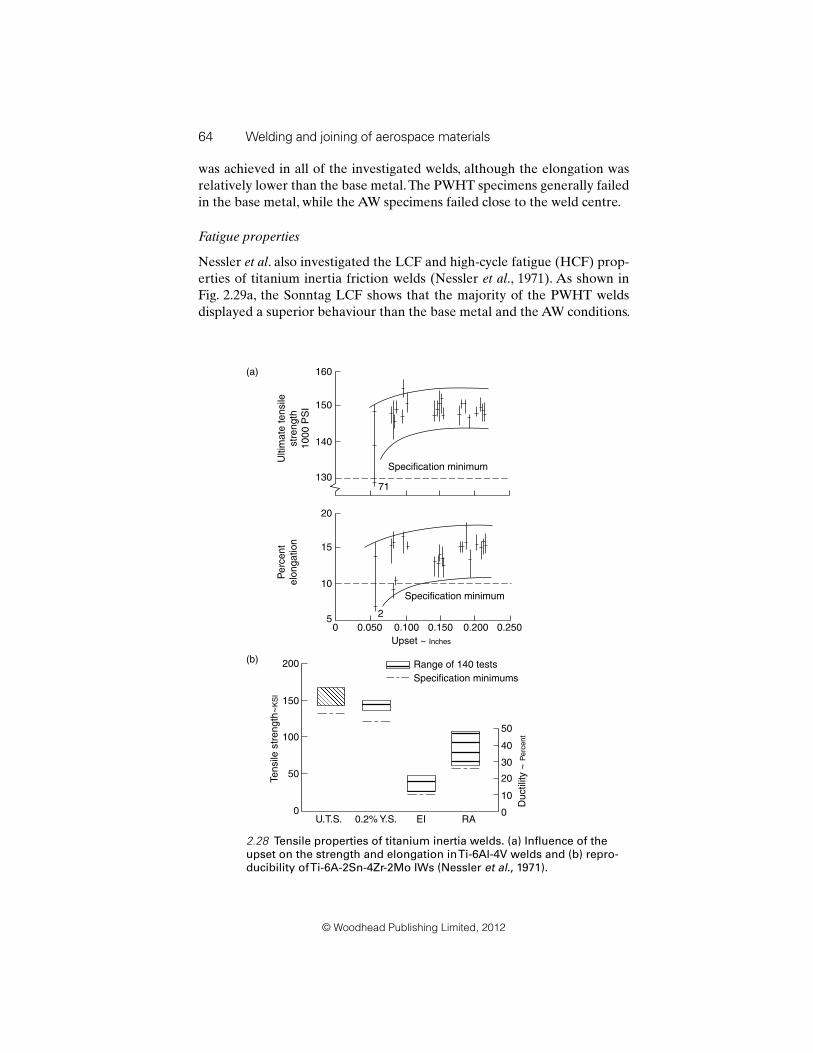
64 Welding and joining of aerospace materials
© Woodhead Publishing Limited, 2012
was achieved in all of the investigated welds, although the elongation was
relatively lower than the base metal. The PWHT specimens generally failed
in the base metal, while the AW specimens failed close to the weld centre.
Fatigue properties
Nessler et al . also investigated the LCF and high-cycle fatigue (HCF) prop-
erties of titanium inertia friction welds (Nessler et al ., 1971 ). As shown in
Fig. 2.29a , the Sonntag LCF shows that the majority of the PWHT welds
displayed a superior behaviour than the base metal and the AW conditions.
160(a)
(b)
Ultim
ate
te
nsile
str
en
gth
10
00
PS
I
Pe
rce
nt
elo
ng
atio
n
150
140
13071
2
Specification minimum
Specification minimum
20
15
10
5
200
150
100
Tensile
str
ength
~K
SI
50
0U.T.S. 0.2% Y.S. EI RA
50
40
30
20
10
0
Ductilit
y ~
Perc
en
t
0 0.050 0.100 0.150 0.200 0.250
Upset ~ Inches
Range of 140 tests
Specification minimums
2.28 Tensile properties of titanium inertia welds. (a) Infl uence of the upset on the strength and elongation in Ti-6Al-4V welds and (b) repro-ducibility of Ti-6A-2Sn-4Zr-2Mo IWs (Nessler et al., 1971).
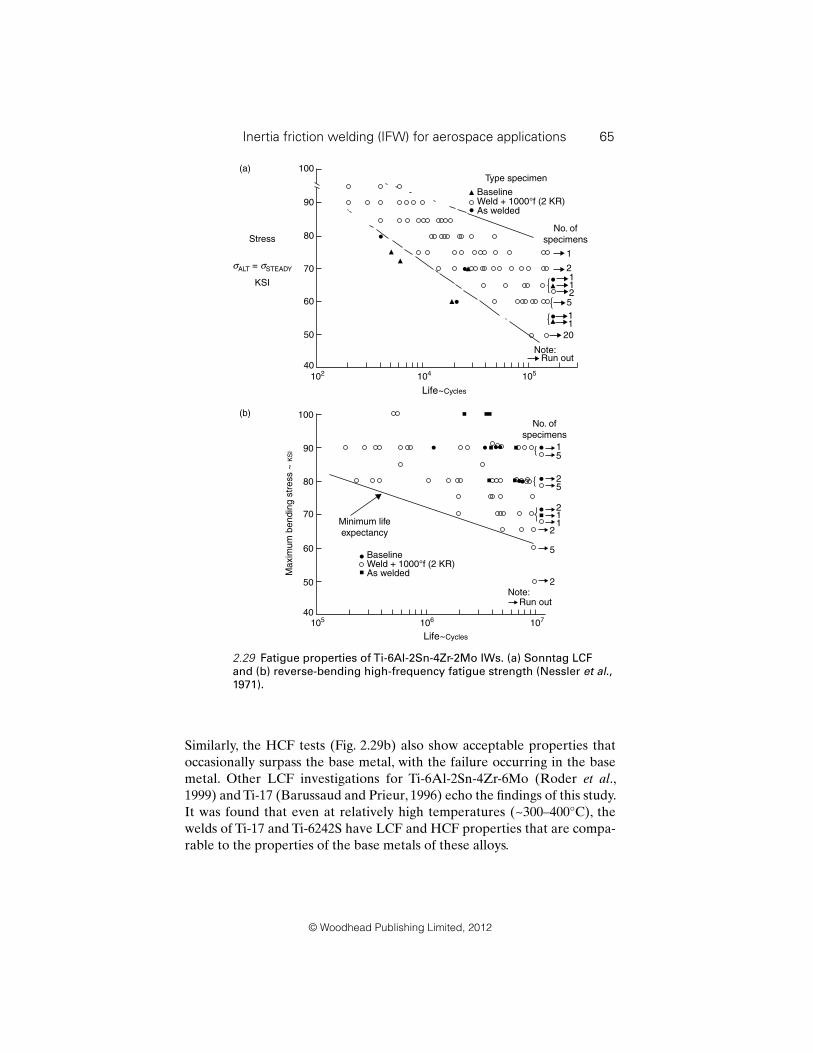
Inertia friction welding (IFW) for aerospace applications 65
© Woodhead Publishing Limited, 2012
Similarly, the HCF tests ( Fig. 2.29b ) also show acceptable properties that
occasionally surpass the base metal, with the failure occurring in the base
metal. Other LCF investigations for Ti-6Al-2Sn-4Zr-6Mo (Roder et al .,
1999 ) and Ti-17 (Barussaud and Prieur, 1996 ) echo the fi ndings of this study.
It was found that even at relatively high temperatures (~300–400°C), the
welds of Ti-17 and Ti-6242S have LCF and HCF properties that are compa-
rable to the properties of the base metals of these alloys.
100(a)
(b) 100
90
80
70
60
50
40105 106 107
Maxim
um
bendin
g s
tress ~
KS
I
Stress
σALT = σSTEADY
KSI
90
80
70
60
50
40102 104
Type specimen
No. of
specimens
BaselineWeld + 1000°f (2 KR)As welded
Baseline
15
5
5
2
2
2
2
11Minimum life
expectancy
Weld + 1000°f (2 KR)As welded
105
1
1
11
20
Note:Run out
Note:Run out
125
2
No. of
specimens
Life~Cycles
Life~Cycles
2.29 Fatigue properties of Ti-6Al-2Sn-4Zr-2Mo IWs. (a) Sonntag LCF and (b) reverse-bending high-frequency fatigue strength (Nessler et al., 1971).

66 Welding and joining of aerospace materials
© Woodhead Publishing Limited, 2012
2.5 Residual stress development
Within the past decade, neutron and synchrotron X-ray diffraction have
been extensively used to characterise the residual stress development in
inertia friction welds owing to its capability of obtaining in-depth measure-
ments, as opposed to hole drilling, which is only capable of performing sur-
face measurements. Residual stress characterisation by diffraction involves
measuring the change in the lattice parameters or interplanar spacing by
measuring peak shift, and comparing it to the unaffected metal. The strains
are then calculated using:
ε = =d d−
d
a a−a
0dd
0dd0
0 [2.13]
where d and a are the d -spacing and the lattice parameter, respectively, with
the subscript ‘0’ indicating the strain-free values. Following the measure-
ment and calculation of the strain in all three directions (axial, radial and
hoop), a stress component can be calculated using:
σ ε υHoop Hoop= ( )υ ( )υ( )υ− + υ( )ε εRadial Axial+εRadial
E
)υ+ ( [2.14]
When undertaking such measurements great care has to be taken when
determining the strain-free value d 0 . Microstructural changes across the
weld mean that the chemical compositions of the phases present in a mul-
tiphase engineering alloy have changed too. Consequently, d 0 is unlikely to
be constant across the weld region requiring separate measurements of the
d 0 variation or using stress-balance conditions (Preuss et al ., 2002b ). Further
details on residual stress characterisation and d 0 correction can be found
elsewhere (Withers, 2001 , Withers and Bhadeshia, 2001a , 2001b; Withers
et al ., 2007 ).
Studies on the residual stress characterisation in tubular Ni-based superal-
loy inertia friction welds generally agree that the highest stresses in the weld
occur in the hoop direction ( Fig. 2.11 ), being tensile at the weld centre espe-
cially close to the inner diameter, and being limited by the yield strength of
the alloy (Preuss et al ., 2006 ). In the axial direction, a lower stress intensity
than in the hoop direction was measured but generated a bending moment.
This bending moment was attributed to either the difference in temperature
between the outer and inner diameters (Wang et al ., 2004 ), a tourniquet
effect from the hoop stress owing to its cross thickness variation (Preuss et
al ., 2006 ) or the infl uence of the clamping forces of the tooling ( Fig. 2.30 )
(Pang et al ., 2003 ). It was also suggested that the infl uence of the tooling
on the residual stress development could possibly be larger than the effect
of the process parameters. Finally, minimal stresses occurred in the radial
direction of these IFWs, which had a wall thickness of 8–11 mm.

Inertia friction welding (IFW) for aerospace applications 67
© Woodhead Publishing Limited, 2012
Although different Ni-based superalloys generally have roughly similar
spatial stress distribution and relative stress levels, differences in the magni-
tude of the stresses are normally found that are caused by the nature of the
alloy microstructure and chemistry. Preuss et al . compared the residual stress
development in RR1000, IN718, and U720Li ( Fig. 2.31 ). The three welds
had low radial stresses (±100 MPa), while the axial stresses all showed the
before-mentioned bending profi le with the maximum tensile and compres-
sive stresses being ±350 MPa, ±450 MPa, and ±600 MPa in IN718, U720Li
and RR1000, respectively. In the hoop direction, maximum tensile stresses
of 700 MPa, 1000 MPa, and 1500 MPa were calculated in IN718, U720Li and
RR1000, respectively. By calculating an equivalent stress using Von Mises
equation, it was found that the equivalent stress in RR1000 weld centre
exceeded the yield stress, suggesting that the stresses close to the weld line
are limited by the local yield stress. In IN718 and U720Li, the weld stresses
were generally lower than the yield stress (~0.8 σ ys ). This difference in the
magnitude of stresses was attributed to the relatively poor short-term creep
properties in IN718 and U720Li, allowing the misfi t strains in these alloys to
be reduced more during cooling than in RR1000. Upon performing PWHT,
the major part of the stresses observed gets annihilated, although the hoop
stresses remain generally high (~300–500 MPa) (Preuss et al ., 2006 ), while
the axial and radial stresses decrease to ~±100 MPa (the experimental error
in these measurements is ±60 MPa).
In contrast, residual stress characterisation studies of inertia friction
welds produced of other materials (e.g. steels, titanium and aluminium
alloys) are very limited, with a single report only available on dissimilar
SCMV-AerMet100 steel welds (Moat et al ., 2009 ; Section 11.3.2). Ferritic
steels differ from Ni-based superalloys in that IFW results in a phase
Clamping force(a) (b) (c)Clamping force
Clamping force
Rotate
Clamping forceCompressive
axial stress
Compressive
axial stress
Tensile axial stress
2.30 A schematic illustration for the development of the bending stresses in the axial direction. (a) Clamping leads to bending of the tube sections (exaggerated) prior to welding, (b) clamping is still applied during welding, and (c) upon the removal of the clamping forces, the ends are released, resulting in the formation of the axial stresses (Pang et al., 2003).

© Woodhead Publishing Limited, 2012
–200
500
500
400
400300200
60
0–100
–100
–200
00
100
300
–50
–500
0
00
–50
–50
00 400
300
200
200
100
–100
–200
–200
–300
800
700 600500400
300
200
100
0
–400
–300
100
00
0
0
50
0
100 50
0
0
0
50
50
50
–50
–100
500
200
200 0
0
0
100
1,1
00
1,0
00
900
800
700
700600
500400
300
200
100
–100
–200
–400
–300
–500
–500
–300
–100
100
200
400
300
–50
100
–50
300
100
200
200
0
45
6
z/m
m
78
32
10
45
6
z/m
m
78
32
10
45
67
83
21
0
45
6
z/m
m
78
32
10
45
6
z/m
m
78
32
10
45
6
z/m
m
78
32
10
45
6
z/m
m
78
32
10
45
6
z/m
m
78
32
10
45
67
83
21
0
45
67
83
21
0
4
Inconel 718
Radia
l
str
ess
Axia
l
str
ess
Hoop
str
ess
Allo
y 7
20Li
RR
10
00
56
78
32
10
(a)
(d)
(g)
(b)
(e)
(h)
(c)
(f)
(i)
45
67
83
21
0
45
67
83
21
0
45
67
83
21
0
–2
–1 0 1 2
–2
–1
0 1 2
R/mm
–2
–1 0 1 2
–2
–1
0 1 2
R/mm
–2
–1 0 1 2
–2
–1
0 1 2
–2
–1
0 1 2
R/mm
–2
–1 0 1 2
R/mm
–2
–1
0 1 2
–2
–1 0 1 2
R/mm
45
6
z/m
m
78
32
10
45
67
83
21
0
–2
–1
0 1 2
–2
–1 0 1 2
R/mm
45
6
z/m
m
78
32
10
45
67
83
21
0
–2
–1
0 1 2
–2
–1 0 1 2
R/mm
–2
–1
0 1 2
–2
–1 0 1 2
R/mm
–2
–1
0 1 2
–2
–1 0 1 2
R/mm
2.3
1 R
esid
ua
l str
ess c
on
tou
rs i
n I
N7
18
(a
–c),
U7
20
Li
(d–f)
an
d R
R10
00
(g
–i)
(P
reu
ss e
t a
l., 2
00
6).

Inertia friction welding (IFW) for aerospace applications 69
© Woodhead Publishing Limited, 2012
transformation during heating (ferrite to austentite), followed by the mar-
tensitic or bainitic phase transformation upon rapid cooling depending on
the cooling rate and is affected by the wall thickness. As the formation of
martensite is associated with a volume increase, this alters the stresses to
become compressive near the weld line instead of the typical tensile stresses
observed in this region. This can be viewed in the SCMV-AerMet100 hoop
stress ( Fig. 2.32 ), where the weld region (±2 mm) was predominantly com-
pressive, as opposed to the Ni-based superalloys, which was tensile. Small
stresses (100–300 MPa) were observed in both the radial and axial direc-
tions. Following PWHT, the stresses in AerMet100 generally dropped to
acceptable levels, while almost no change was observed in the SCMV. These
differences are because of the nature of the selected PWHT, and the differ-
ences between the two alloys in their thermal stability.
2.6 Future trends
Considering that IFW has been around for over half a century, it is clear that
it can be classifi ed as a mature technique, especially with respect to IFW of
Ni-based superalloy aero engine parts. Nonetheless, there is a need for more
extensive studies on IFW of steels, titanium and aluminium alloys owing to
their potential applications in the aerospace industry. By browsing through
the recent patents that are associated with IFW, several trends can be identi-
fi ed as potential future applications. There is an interest in using IFW to weld
cylindrical components to thin non-cylindrical components, and dissimilar
materials. The PWHT processes in several alloy inertia friction welds seem
600
400
200
0
–200
Resid
ual str
ess / M
Pa
–400
–600
–20 –10 0 10 10
Axial position / mm
SCMVAermet
As welded PWHT
2.32 AW and PWHT hoop residual stress distribution in SCMV- AerMet100 (Moat et al., 2009).
70 Welding and joining of aerospace materials
© Woodhead Publishing Limited, 2012
to be a concern, as it is crucial to use a PWHT that results in the retention
of the mechanical properties, especially the fatigue-resistance properties.
Several patents also suggested new applications, including aircraft actuator
pistons, gas turbine parts and crankshafts.
2.7 Source of further information and advice
For further information on IFW, especially machines and products, the
reader is directed to the following web sites:
Interface Welding: http://www.interfacewelding.com/ •
Manufacturing Technology, Inc. : http://www.mtiwelding.com •
MTU Aeroengines: http://www.mtu.de/en/technologies/manufacturing_•
processes/inertia_friction_welding/index.html
Swanson Industries: http://www.swansonindustries.com/inertiawelding.•
php
• The Welding Institute (TWI Ltd.): http://www.twi.co.uk
• Thompson Friction Welding: http://www.thompson-friction-welding.co.uk/
2.8 References
Adam, P. (1982) ‘Material response during inertia welding of superalloys’. Zeitschrift fuer
Werkstofftechnik , 13 , 258–262.
Anon (1979) ‘Inertia welding: simple in principle and application’. Welding and Metal
Fabrication , 10 , 585–589.
Baeslack III, W. A., Phillips, D., English, C. and Woodfi eld, A. P. (1991) ‘Inertia-friction
welding of an advanced rapidly solidifi ed titanium alloy’. Journal of Materials Sci-
ence Letters , 10 , 1401–1408.
Barussaud, A. and Prieur, A. (1996) ‘Structure and properties of inertia welded assem-
blies of Ti-based alloy disks’. Titanium ‘95 – Science and technology; the 8th World
Conference on Titanium . Birmingham, United Kingdom.
Benn, B. (2000) ‘Inertia welding’ (unpublished).
Bennett, C. J., Hyde, T. H. and Williams, E. J. (2007) ‘Modelling and simulation of the
inertia friction welding of shafts’. Proceedings of the Institution of Mechanical Engi-
neers , Part L : Journal of Materials : Design and Applications , 221 , 275–284.
Cheng, C. J. (1962) ‘Transient temperature distribution during friction welding of two
similar materials in tubular form’. Welding Journal , 41 , 542S–550S.
Cheng, C. J. (1963) ‘Transient temperature distribution during friction welding of two dis-
similar materials in tubular form’. Welding Journal , 42 , 233S–240S.
Chudikov, A. I. (1956) ‘Friction Welding’. Russian Patent , RU106270 .
D’Alvise, L., Massoni, E. and Walloe, S. J. (2002) ‘Finite element modelling of the inertia
friction welding process between dissimilar materials’. Journal of Materials Process-
ing Technology , 125–126 , 387–391.
Daus, F., Li, H. Y., Baxter, G., Bray, S. and Bowen, P. (2007) ‘Mechanical and micro-
structural assessments of RRiooo to IN718 inertia welds – effects of welding param-
eters’. Materials Science and Technology , 23 , 1424–1432.