Embed Size (px)
Citation preview

Inequality of Opportunity in Asia and the Pacific
Children’s Nutrition
SOCIAL DEVELOPMENT POLICY PAPERS #2018-04

The shaded areas of the map indicate ESCAP members and associate members.
The Economic and Social Commission for Asia and the Pacific (ESCAP) serves as the United Nations’ regional hub promoting cooperation among countries to achieve inclusive and sustainable development. The largest regional intergovernmental platform with 53 Member States and 9 associate members, ESCAP has emerged as a strong regional think-tank offering countries sound analytical products that shed insight into the evolving economic, social and environmental dynamics of the region. The Commission’s strategic focus is to deliver on the 2030 Agenda for Sustainable Development, which it does by reinforcing and deepening regional cooperation and integration to advance connectivity, financial cooperation and market integration. ESCAP’s research and analysis coupled with its policy advisory services, capacity building and technical assistance to governments aims to support countries’ sustainable and inclusive development ambitions.
Copyright © United Nations, 2018All rights reservedPrinted in ThailandST/ESCAP/2841
Disclaimer
The views expressed in this policy paper are those of the authors and do not necessarily reflect the views and policies of the United Nations. The policy paper has been issued without formal editing. Reproduction and dissemination of material in this policy paper for educational or other non-commercial purposes are authorized without prior written permission from the copyright holder, provided that the source is fully acknowledged. For further information on this paper, please contact:
Social Development Division Economic and Social Commission for Asia and the Pacific United Nations Building Rajadamnern Nok Avenue Bangkok 10200, Thailand Email: [email protected] Website: www.unescap.org

Inequality of Opportunity in Asia and the Pacific
Children’s Nutrition

Acknowledgements
This paper was prepared under the leadership of Patrik Andersson, Officer-in-charge, Social Development Division. The drafting team, led by Ermina Sokou, consisted of Imogen Howells, Nina Loncar and Le Hai Yen Tran. The statistical and econometric analysis was undertaken by Yichun Wang and Predrag Savić. Valuable comments and inputs were provided by Arun Frey, Li Qiaoxi, Orlando Zambrano Roman and Pornnipa Srivipapattana.
ESCAP is profoundly grateful to Christiane Rudert, Regional Advisor for Nutrition at UNICEF East Asia and Pacific Regional Office, who reviewed the paper and provided valuable comments.
The graphic design was done by Daniel Feary.
The policy papers on Inequality of Opportunity in Asia and the Pacific are prepared under an interregional project entitled “Promoting Equality: Strengthening the capacity of selected countries to design and implement equality-oriented public policies and programmes”.
2

Table of contentsAcknowledgements 2
About the inequality of opportunity papers 4
1. Introduction and scope 5
2. Why does inequality in children’s access to nutrition matter? 8
3. A new approach to identifying the furthest behind 10
4. Who are those left behind? 12
5. Understanding overall inequality in access to adequate nutrition 17
6. Does ethnicity matter for determining the furthest behind? 21
7. Recommendations for closing the gaps 24
Annex: Methodology for identifying gaps in access to opportunities 25
References 31
List of figuresFigure 1: A framework for understanding malnutrition 6
Figure 2: Classification tree highlighting differences in prevalence of stunting among children, Pakistan, 2013 11
Figure 3: Gaps in stunting among children 0–5 years of age, latest year 12
Figure 4: Relationship between average stunting levels and gaps between groups with highest and lowest stunting prevalence in children 0–5 years of age, latest year 13
Figure 5: Gaps in wasting among children 0–5 years of age, latest year 13
Figure 6: Gaps in overweight among children 0–5 years of age, latest year 14
Figure 7: Distance of the worst-off group in stunting from country’s average, children 0–5 years old, earliest and 2010s 16
Figure 8: D-indices and average rates of stunted children, latest year 18
Figure 9: Inequality in adequate nutrition among children (non-stunted) and its decomposition, grouped by the most important circumstance in shaping inequality, latest year 19
Figure 10: The role of caste, ethnicity, religion or language in shaping inequality in children’s access to adequate nutrition, latest year 23
List of tablesTable 1: Growth problems in children 5
Table 2: The shared circumstances of children with highest stunting, wasting and overweight levels 15
Table 3: Stunting rates for different linguistic, ethnic and/or religious groups 21
Table A1: List of countries and survey years 26
Table A2: Selected indicators and factors 29
Table A3: Logit model results: stunting 30
3

About the inequality of opportunity papers
i All policy papers follow the same methodology using the latest publicly available DHS and MICS data, except for decent work, where slight modifications are due to the use of a different dataset.
ii Time for Equality: The Role of Social Protection in Reducing Inequalities in Asia and the Pacific (UN ESCAP) (2015). Available from: https://www.unescap.org/sites/default/files/SDD%20Time%20for%20Equality%20report_final.pdf (accessed on 27/06/18).
The ESCAP Inequality of Opportunity papers place men and women at the heart of sustainable and inclusive development. The papers do so by identifying seven areas where inequality jeopardizes a person’s prospects, namely: education; women’s access to health care; children’s nutrition; decent work; basic water and sanitation; access to clean energy; and financial inclusion. Each of these opportunities are covered by specific commitments outlined in the 2030 Agenda for Sustainable Development and addressed in a separate thematic report covering 22 countries throughout Asia and the Pacific.i
ESCAP first discussed inequality of opportunity in its 2015 report Time for Equality, establishing the distinction between inequality of outcome and inequality of opportunity.ii While the former depicts the consequences of unequally distributed income and wealth, the latter is concerned with access to key dimensions necessary for fulfilling one’s potential.
The papers build on the work of many scholars and the findings from Time for Equality. They apply a novel approach to analysing household surveys with the aim of identifying the groups of individuals with the lowest access to the above-referenced opportunities. These groups are defined by common circumstances over which the individual has no direct control.
In addition to identifying the furthest behind, the Inequality of Opportunity papers also explore the gaps between in-country groups in accessing the key opportunities, as well as the extent to which these have narrowed or widened over time. These inequalities are then analysed to identify the impact and importance each key circumstance plays.
Ultimately, these findings are of direct use for generating discussion on transformations needed to reach the “furthest behind first” as pledged in the 2030 Agenda.
4

1. Introduction and scope
iii The Prevalence of Undernourishment indicator is produced by FAO, with data derived from official country data on food supply, food consumption, and energy needs (taking into consideration demographic characteristics such as age, sex and levels of physical activity).
Approximately 3 million children around the world die each year because of hunger. Following a short period of decline in undernourishment, world hunger started increasing again in 2015.iii The Asia-Pacific region followed this global trend and is currently home to around 520 million undernourished people.1
There are multiple facets of malnutrition, including undernutrition and overweight.2 Malnutrition refers to deficiencies, excesses or imbalances in a person’s intake of energy or nutrients. According to the World Health Organization (WHO), the term malnutrition covers two broad groups of conditions. The first group is “undernutrition”—
which includes stunting (low height for age), wasting (low weight for height), underweight (low weight for age) and micronutrient deficiencies or insufficiencies (a lack of important vitamins and minerals). The second condition is overweight, obesity and diet-related noncommunicable diseases (such as heart disease, stroke, diabetes and cancer).3
Stunting, wasting and overweight therefore can all demonstrate insufficient access to adequate nutrition. However, while the first two denote a lack of calories and micronutrients, overweight is a different form of malnutrition associated with the overconsumption of non-nutritious food. Furthermore, due to intragenerational changes in diets it is possible to find coexistence or overlap of overweight and undernutrition, or greater heterogeneity of nutritional status within individuals, households and populations.4 Table 1 depicts the WHO definitions of these three terms, focusing on children’s growth patterns.
“The Asia-Pacific region is currently
home to around 520 million
undernourished people”
TABLE 1Growth problems in children
Z-SCORE LENGTH/HEIGHT FOR-AGE WEIGHT-FOR AGEWEIGHT-FOR LENGTH/HEIGHT BMI-FOR-AGE
Above 3 See note 1 See note 2 Obese Obese
Above 2 Overweight Overweight
Above 1 Possible risk of overweight (See note 3)
Possible risk of overweight (See note 3)
0 (median)
Below -1
Below -2 Stunted (See note 4) Underweight Wasted Wasted
Below -3 Severely stunted (See note 4)
Severely underweight (See note 5)
Severely wasted Severely wasted
Note 1: A child in this range is very tall. Tallness is rarely a problem, unless it is so excessive that it may indicate an endocrine disorder such as a growth-hormone-producing tumor. Refer a child in this range for assessment if you suspect an endocrine disorder (e.g. if parents of normal height have a child who is excessively tall for his or her age).Note 2: A child whose weight-for-age falls in this range may have a growth problem, but this is better assessed from weight-for-length/height or BMI-for-age.Note 3: A plotted point above 1 shows possible risk. A trend towards the 2 z-score line shows definite risk.Note 4: It is possible for a stunted or severely stunted child to become overweight. It is also possible for a stunted child to also be wasted.Note 5: This is referred to as very low weight in IMCI training modules. (Integrated Management of Childhood Illness, In-service training. WHO, Geneva, 1997).Source: Adapted from: World Health Organization, Training Course on Child Growth Assessment. WHO Child Growth Standards. Module C; Interpreting Growth Indicators. Available online at: http://www.who.int/childgrowth/training/module_c_interpreting_indicators.pdf?ua=1
5

Globally, an estimated 41 million children under the age of 5 years are overweight or obese, while some 159 million are stunted and 50 million are wasted.5 It is quite common to find undernutrition and overweight within the same community, household or even individual – it is possible to be both overweight and micronutrient deficient, for example. 6
iv The five UN ESCAP subregions are East and North-East Asia, North and Central Asia, Pacific, South and South-West Asia, and South-East Asia.
The Asia-Pacific region is home to around 97 million stunted children.7 Among all ESCAP subregions, South and South-West Asia has the highest prevalence of stunted children at 36 per cent, compared with East and North-East Asia at 9 per cent.iv Furthermore, despite the region’s rapid economic growth in recent years, it also still makes up almost two-thirds of the world’s wasted children.8 Less than 1 per cent of cases of severe acute malnutrition are treated in Indonesia, the Lao People’s Democratic Republic and the Philippines.9 In addition, half of the world’s overweight children are in Asia and the Pacific. In the Pacific subregion, childhood obesity is particularly common and results in adolescent obesity rates of up to 60 per cent in some of the countries.10
“The Asia-Pacific region is
home to around 97 million
stunted children”
FIGURE 1A framework for understanding malnutrition
Source: UNICEF (2013). Improving Child Nutrition: The achievable imperative for global progress. United Nations Children’s Fund.
BASIC CAUSES
UNDERLYINGCAUSES
IMMEDIATECAUSES
Social, cultural, economic and political context
Inadequate �nancial, human, physical and social capital
Household food security
Inadequate dietary intake
Short-term consequences:Mortality, morbidity, disability
Intergenerational consequences
Long-term consequences:Adult height, cognitive ability, economic productivity, reproductive performance, overweight and obesity, metabolic and
cardiovascular diseases
Diseases
MATERNAL AND CHILD UNDERNUTRITION
Inadequate care and feeding practices
Unhealthy household environment and
inadequate health services
Household access to adequate quantity and quality of resources:Land, education, employment, income, technology
6
1. IntroductIon and scope

This paper will focus on stunting, because of its particularly high prevalence in the region and its profound consequences for physical and cognitive development. Relevant statistics on wasting and overweight are also reported, where possible, to provide a more complete picture of malnutrition.
States parties to the Convention on the Rights of the Child (CRC) are committed to combating malnutrition through the provision of adequate nutritious foods and clean drinking water11 and the UN Decade of Action on Nutrition (2016 – 2025) also aims to reverse negative trends.
As part of the 2030 Agenda for Sustainable Development, governments have also pledged to end hunger, achieve food security, improve nutrition and promote sustainable agriculture (SDG2). In line with SDG targets 2.1 and 2.2, this paper therefore measures inequality of access to nutrition among children by calling for an end to all forms of malnutrition, including stunting, wasting and overweight.
Access to adequate nutrition is also strongly related to many other parts of the sustainable development agenda.12 Malnutrition, according to the UNICEF conceptual framework of malnutrition, results not just from a lack of access to nutritious food but also from a host of other factors, including health, education, gender equality, social protection, climate change, energy, water and sanitation (Figure 1). Inequality in access to adequate nutrition is therefore closely linked to other social and economic opportunities. 13
The overall aim of this paper is to: i) outline why policymakers need to reduce inequality in access to nutrition for children; ii) introduce a new way of analysing survey data by identifying the shared circumstances of those “furthest behind”; and iii) analyse observed inequality by the relative contribution of each circumstance.
“Access to adequate nutrition
is strongly related to many
other parts of the sustainable
development agenda”
7
1. IntroductIon and scope

2. Why does inequality in children’s access to nutrition matter?
Inequality among children matters because proper nutrition provides a foundation upon which developmental progress is built. However, as demonstrated by the mixed-progress made under Millennium Development Goal 1, poverty reduction alone does not result in progress on nutrition. That is particularly worrisome, because chronic malnutrition has an adverse impact on morbidity, mortality, and physical as well as cognitive capacity.
2.1Physical and cognitive outcomes are linked to adequate nutrition
Accessing adequate nutrition is essential to fulfilling a child’s right to a healthy life. Globally, poor nutrition causes almost half of all deaths in children under 5 years of age.14 For young children, the impact of even short periods of undernutrition carries lifelong consequences for development.
The first 1,000 days of a child’s life are crucial from a nutritional perspective. When children under 2 years of age are stunted, the impact is largely irreversible and lasts a lifetime, with blunted educational outcomes and loss to future productivity and income.15 Insufficient nutrition, even for shorter periods, can cause slower cognitive-, motor- and language development among children. As a result, children who are malnourished, of which many are stunted, often perform worse in school and may eventually,
drop out of school all together. Inequality in access to adequate nutrition is therefore responsible for locking in advantage or disadvantage among children very early on, creating intergenerational cycles of poverty.
As these links are well documented, the long-term economic benefits of investing in child nutrition are also well established. In fact, nutrition interventions aimed at reducing childhood stunting have some of the highest returns on investment. Research on combining stimulation and nutrition among infants and toddlers shows impacts 20 years later, including higher IQs and 50 per cent higher earnings.16
2.2Adequate nutrition contributes to increased economic productivity
At the aggregate level, a well-nourished, healthy population is more productive. A study of 40 countries demonstrates that for every USD 1 invested in measures aimed at reducing stunting yields approximately USD 16 in returns through gains in productivity (also depicted in Figure 1).17 This cost-benefit ratio is comparable to investments in hard infrastructure, such as roads and irrigation, as well as in health.
“…nutrition interventions aimed
at reducing childhood stunting
have some of the highest
returns on investment”
“…every USD 1 invested in
measures aimed at reducing
stunting yields approximately
USD 16 in returns through
gains in productivity”
8

2.3A manifestation and cause of intergenerational inequalities
A non-trivial concern for many households in both developed and developing countries is the affordability of nutritious food. Over the past few years, prices of fruit and vegetables have been rising more than the price of most other foods, including energy-dense processed foods in emerging and developed economies alike.21 The resulting relative decline in the price of less nutritious food also shapes much of the inequality in access to adequate nutrition explored in this paper.
Income inequality among households therefore breeds intergenerational inequality, as children of poorer households receive poorer nutrition and are therefore more likely to face the consequences of malnutrition in the long-term.
“…children of poorer households receive
poorer nutrition and are therefore
more likely to face the consequences
of malnutrition in the long-term”
At the same time, the economic costs of malnutrition can be high. Overweight and obesity, for example, are associated with higher rates of cardiovascular and other non-communicable diseases. In addition to the human toll, the economic cost of addressing obesity ranges from 0.13 per cent of GDP in Thailand to over 2 per cent of GDP in China.18
Stunting also brings high economy-wide costs, because stunted children perform less well in school and suffer reduced productivity. The per capita income penalty a country incurs for not having eliminated stunting when today’s workers were children is around 7 per cent, and can be up to 10 per cent in South Asia.19
On the other hand, improvements in nutrition have an opposite, positive aggregate effect on economies. In China, the reduction in stunting prevalence from 32.7 per cent to 14.4 per cent is estimated to have resulted in economic productivity gains of a RMBv 101 billion from 1991 to 2002.20 At the same time, gains of another RMB 20 billion had been expected for further reduction in stunting, which was to be achieved by 2014.
v RMB stands for Renminbi.
9
2. Why does InequalIty In chIldren’s access to nutrItIon matter?

3. A new approach to identifying the furthest behind
vi The analysis excludes Afghanistan, Indonesia, the Philippines, Timor-Leste and Viet Nam due to lack of datasets or other concerns with regards publicly available DHS and MICS.
vii Please see Annex on the decision to use the bottom-40 top-60 split.
viii Please see Annex for a detailed description of the methodology and Annex Table A2 for the selection of indicators and circumstances.
A new methodological approach to ascertain the gaps in children’s nutrition can bolster efforts to meet the 2030 Agenda. This paper analyses household level data from both the Demographic and Health Surveys (DHS) and Multiple Indicator Cluster Surveys (MICS) for 17 countries in Asia and the Pacific to identify the children most excluded from accessing nutrition.vi
The paper uses three indicators to identify gaps in access to adequate nutrition: stunting; wasting; and overweight rates among children under 5 years of age.
The classification tree approach is then used to identify the circumstances shared by those children most likely to show a higher prevalence in any of the three malnutrition indicators. In this new methodological approach, an algorithm splits the value of each indicator into groups based on predetermined circumstances, namely: household wealth (split into bottom 40 and top 60)vii; residence (urban and rural); sex (male or female); mother’s highest education; and the number of children under 5 years of age in the household.viii
In each iteration, the classification tree ascertains significantly different groups and identifies those that are most and least advantaged for each indicator. The identified groups consist of households sharing common circumstances, e.g. all belonging to the bottom 40 of the wealth distribution and residing in rural areas. For countries with information on language, religion or ethnicity, the analysis is repeated using also these shared circumstances (see section 6).
To illustrate how different circumstances interact and produce a disadvantage (or advantage) in access to nutrition, the example of Pakistan is used (Figure 2). As shown, 45 per cent of all children in the sample are stunted and are therefore deemed to lack access to adequate nutrition.
Moreover, the first split is a result of mother’s education. In total, 53 per cent of all children with primary-educated mothers are stunted, as compared with 24 per cent for those with secondary- or higher-educated mothers.
The second split is made between those with secondary-educated mothers and higher-educated mothers. Among the less advantaged group, the sample is split based on household wealth, and then for a third time based on whether the family lives in a rural or urban area (for the top 60) and whether the child is a boy or a girl (for the bottom 40). Overall, stunting is most prevalent among boys from poorer households with primary-educated mothers.
“[In Pakistan] 53 per cent of
all children with primary-
educated mothers are stunted,
as compared with 24 per cent for
those with secondary- or higher-
educated mothers”
10
More than 65 per cent of all boys belonging to this most disadvantaged group are stunted and make up 20 per cent of all children in the 0–5 cohort. The most advantaged group, with the lowest rate of stunting of 21 per cent, consists of children with higher-educated mothers and represents 9 per cent of their age cohort in Pakistan.
The classification tree analysis is repeated for the 17 countries with children’s weight and height data, for all three nutrition-related indicators: stunting, wasting and overweight. This exercise,
ix Classification trees for all countries are available upon request.
when repeated for two points in time, produces over 70 classification trees (for the full list of all surveys used for this analysis, see Annex Table A1).ix The trees hide in them stories of progress but also of stagnation. These more nuanced stories need to be explored further by policymakers and researchers working at the national level on child nutrition. Potentially, national datasets could be used to improve the analysis. The following section presents key findings from publicly available DHS and MICS at the time of writing.
FIGURE 2Classification tree highlighting differences in prevalence of stunting among children, Pakistan, 2013
Source: ESCAP calculations, using data from the latest DHS and MICS surveys.
6Size: 9%Prevalence: 21%
CHILDREN WHOSE MOTHER HAS HIGHER EDUCATION
5Size: 19%Prevalence: 25%
CHILDREN WHOSE MOTHER HAS SECONDARY EDUCATION
4Size: 19%Prevalence: 43%
3Size: 14%Prevalence: 47%
2Size: 20%Prevalence: 54%
1Size: 20%Prevalence: 65%
10
20
30
40
50
60
70
STU
NTI
NG
PR
EVA
LEN
CE
RA
TE (P
ERC
ENTA
GE)
TOP 60Size: 32%Prevalence: 45%
MOTHER'S EDUCATION AT SECONDARY OR HIGHER LEVELSize: 28%Prevalence: 24%
Population size: 100%Average prevalence: 45%
MOTHER'S EDUCATION AT PRIMARY LEVEL Size: 72%Prevalence: 53%
BOTTOM 40Size: 40%Prevalence: 60%
CHILDREN IN RICH AND RURAL HOUSEHOLDS WHOSE MOTHER HAS PRIMARY EDUCATION
CHILDREN IN RICH AND URBAN HOUSEHOLDS WHOSE MOTHER HAS PRIMARY EDUCATION
GIRLS IN POOR HOUSEHOLDS WHOSE MOTHER HAS PRIMARY EDUCATION
BOYS IN POOR HOUSEHOLDS WHOSE MOTHER HAS PRIMARY EDUCATION
MOTHER'S EDUCATIONAT SECONDARY LEVEL
MOTHER'S EDUCATION AT SECONDARY OR HIGHER LEVEL
MOTHER'S EDUCATIONAT PRIMARY LEVEL
MOTHER'S EDUCATIONAT TERTIARY LEVEL
GIRLS
RURAL
URBAN
BOYS 1
2
3
4
5
6
11
3. a neW approach to IdentIfyIng the furthest behInd

4. Who are those left behind?
Ample evidence demonstrates that many children in Asia and the Pacific are still being left behind. This reality contrasts starkly with the principle of universalism permeating the 2030 Agenda. Policymakers therefore need to identify those being left behind and make these groups, households and children the focus of their efforts.
4.1How large are the gaps?
The tree analysis described above allows for comparison of gaps across countries. This analysis was undertaken for all 17 countries and the results are summarized in Figures 3, 4, 5 and 6 for stunting, wasting and overweight, respectively.
Stunting
In Figure 3, for example, the upper lines of each bar represent stunting rates of the most disadvantaged group – those with lowest access to adequate nutrition – for each country. The lower lines represent stunting rates of the most advantaged group (highest access to adequate nutrition). The middle line is the national average stunting rate by which the countries are sorted.
Overall, average rates of stunting are high in the Asia-Pacific region, but range from 45 per cent in Pakistan to 8 per cent in Kazakhstan (Figure 3). While Kazakhstan and Turkmenistan also have smaller gaps in stunting prevalence, Bangladesh, Lao People’s Democratic Republic, Pakistan and Viet Nam exhibit gaps of 30 to 45 percentage points between the most advantaged and disadvantaged groups.
The relationship between average stunting levels and the access gap can be further illustrated by using a binomial equation graph (Figure 4). The graph shows the predicted gaps between the least and most marginalized groups for different countries.
Typically, where there is very low overall stunting prevalence, the gaps between groups are small. Gaps are higher in countries with high overall stunting rates, indicating that even in high-stunting countries there are always advantaged groups.
The average stunting rate of India and Lao People’s Democratic Republic are among the highest in the world, higher than in most African countries.22
FIGURE 3Gaps in stunting among children 0–5 years of age, latest year
Source: ESCAP calculations based on latest DHS and MICS surveys for countries in the Asia-Pacific region.
Lowest stunting rate Average stunting rate Highest stunting rate
0
20
40
60
80
Paki
stan
Lao
PDR
Indi
a
Nep
al
Bang
lade
sh
Cam
bodi
a
Bhut
an
Mya
nmar
Tajik
ista
n
Vanu
atu
Mal
dive
s
Kyrg
yzst
an
Thai
land
Turk
men
ista
n
Arm
enia
Mon
golia
Kaza
khst
an
PREV
ALE
NC
E O
F ST
UN
TIN
G(P
ERC
ENTA
GE)
12

Figure 4 reveals that India sits under the predicted line, indicating that the gap between groups is narrower than predicted, given its average level of stunting. Lao People’s Democratic Republic, on the other hand, sits above the curve, demonstrating a wider-than-expected gap, whereby advantaged groups have much lower prevalence of stunting than disadvantaged ones.
“Countries in South Asia have the highest
prevalence of wasting of any subregion
in the world”
FIGURE 4Relationship between average stunting levels and gaps between groups with highest and lowest stunting prevalence in children 0–5 years of age, latest year
Source: ESCAP calculations based on latest DHS and MICS surveys publicly available for countries in the Asia-Pacific region.
R2= 0.92745
0
10
20
30
40
50
0 10 20 30 40 50 60
GA
P IN
STU
NTI
NG
PR
EVA
LEN
CE
(PER
CEN
TAG
E PO
INTS
)
AVERAGE STUNTING LEVELS (%)
Armenia
Pakistan
Lao People’s Democratic Republic
Myanmar
Bangladesh
Cambodia Bhutan
Tajikistan
Vanuatu
Nepal
Maldives
Kyrgyzstan Thailand
Turkmenistan
Mongolia Kazakhstan
India
FIGURE 5Gaps in wasting among children 0–5 years of age, latest year
Source: ESCAP calculations based on latest DHS and MICS surveys for countries in the Asia-Pacific region.
Lowest wasting rate Average wasting rate Highest wasting rate
0
10
20
30
Indi
a
Bang
lade
sh
Paki
stan
Mal
dive
s
Tajik
ista
n
Cam
bodi
a
Nep
al
Mya
nmar
Thai
land
Bhut
an
Lao
PDR
Vanu
atu
Turk
men
ista
n
Arm
enia
Kaza
khst
an
Kyrg
yzst
an
Mon
golia
WA
STIN
G P
REV
ALE
NC
E(P
ERC
ENTA
GE)
Wasting
Childhood wasting is usually the result of a recent and acute weight loss or poor weight gain. Wasting is also accompanied by a higher risk of disease and even death. Countries in South Asia have the highest prevalence of wasting of any subregion in the world. India also has the highest average level of wasting, affecting more than one in five children under 5 years of age. In contrast, only 1 per cent and 3 per cent of children are affected by wasting in Mongolia and Kyrgyzstan, respectively. Pakistan and Vanuatu also exhibit the widest gap in wasting between groups, at about 10 percentage points (Figure 5).
13
4. Who are those left behInd?
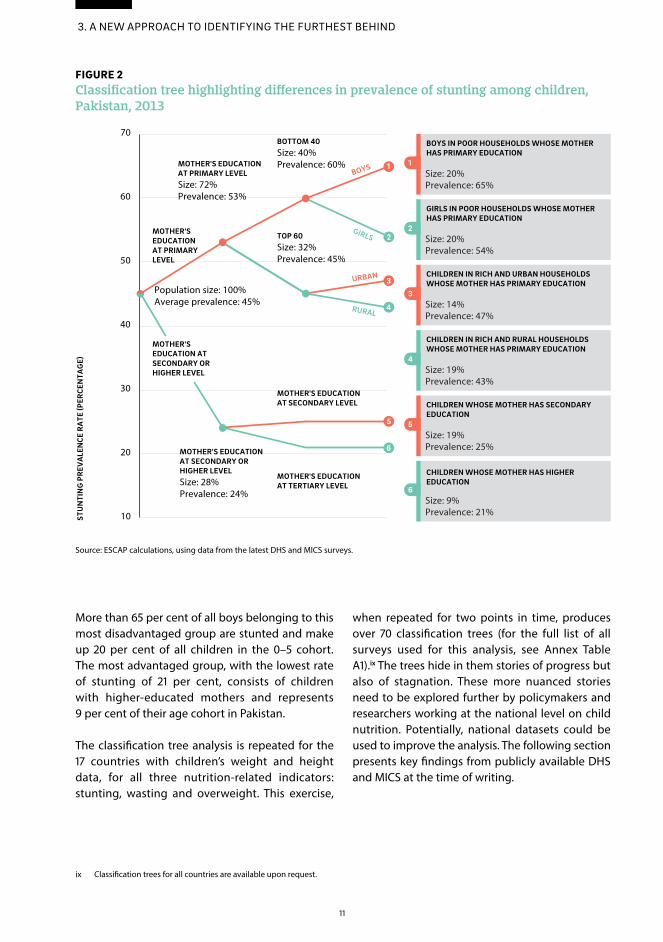
Overweight
Childhood overweight reflects chronic and excessive weight gain and is a rising problem in almost all regions of the world. Obesity is an additional concern in the Asia-Pacific region with the fastest rising levels in South-East Asia and in the Pacific.23 Currently, half of the world’s overweight children are in Asia.24 Overweight children suffer from higher risks of type 2 diabetes, high blood pressure and asthma.
Among the 17 countries studied, six have childhood overweight rates above the global average of 6 per cent.25 Armenia, Mongolia and Thailand have particularly high levels at over 10 per cent. However, since overweight occurs at lower levels than stunting and wasting, the intergroup gaps are less pronounced. Still, gaps in Armenia, Kazakhstan, Thailand and Vanuatu are all quite pronounced.
4.2Identifying those left behind
Tackling stunting and other manifestations of malnutrition requires first identifying the shared circumstances of those without access to adequate nutrition. This section narrows the focus onto the most disadvantaged groups in each country to identify the circumstances they share. Although these circumstances are not identical across the 17 countries analysed, some commonalities exist.
For example, being in a poorer family (bottom 40 per cent of the wealth distribution), with a mother having a lower level of education, and living in a rural area, result in a higher prevalence of stunted children (Table 2). Mother’s education features prominently among the most disadvantaged groups in half of the countries, with most mothers having a primary level education or below.
Poverty (belonging to bottom 40 households) is associated with stunting in 14 of the 17 countries and living in a rural area in five countries. Compared to urban children, children dwelling in rural areas are less likely to have well-nourished and educated mothers who received adequate prenatal and birthing care. They also have less access to clean water and basic sanitation. Thus, rural infants are more susceptible to malnutrition.26
Having one or more siblings features as an important factor in seven countries. There could be many reasons for this finding, including the impact of narrow spacing between births, which results in worse health outcomes, the higher a child’s birth order. Finally, being a boy is associated with higher rates of stunting in six countries, confirming similar findings in other regions.27
The size of the most disadvantaged group is also important to note. In some countries, like in Lao People’s Democratic Republic, stunting is particularly concentrated in a smaller group of children, those from bottom 40 households with
FIGURE 6Gaps in overweight among children 0–5 years of age, latest year
Source: ESCAP calculations based on latest DHS and MICS surveys for countries in the Asia-Pacific region.
Lowest overweight rate Average overweight rate Highest overweight rate
PREV
ALE
NC
E O
F O
VER
WEI
GH
T(P
ERC
ENTA
GE)
0
5
10
15
20
25
Arm
enia
Thai
land
Mon
golia
Kaza
khst
an
Kyrg
yzst
an
Bhut
an
Mal
dive
s
Turk
men
ista
n
Tajik
ista
n
Vanu
atu
Paki
stan
Lao
PDR
Indi
a
Cam
bodi
a
Bang
lade
sh
Mya
nmar
Nep
al
14
4. Who are those left behInd?

less educated mothers, who make up 9 per cent of their age cohort. In Cambodia, on the other hand, almost all children belonging to the bottom 40 group make up the highest stunting prevalence group, and among them 40 per cent are stunted (Table 2).
There are marked similarities between groups that have high incidence of stunting and wasting. Households that are poor, living in rural areas with many children in the households and where mother’s education is relatively low, have higher incidence of wasting. However, the circumstances can also differ. Belonging to top 60 of the wealth distribution is associated with higher wasting rates in three countries, as is living in an urban area. Hence, wasting is not occurring exclusively amongst the poorest.
In contrast, the shared circumstances of the most disadvantaged group for overweight children are noticeably different from those for stunting and wasting. Only in two countries are overweight children most concentrated in bottom 40 households, while mothers have secondary or higher level of education in 9 out of 17 countries.
4.3Are the gaps in access to adequate nutrition falling over time?
Measuring progress in access to nutrition produces mixed results. For 12 of the countries, household surveys were conducted at multiple points in time, thereby allowing for comparisons of how access to nutrition has developed.
TABLE 2The shared circumstances of children with highest stunting, wasting and overweight levels
CO
UN
TRY
WEA
LTH
MO
THER
’S E
DU
CAT
ION
RES
IDEN
CE
NU
MB
ER O
F SI
BLI
NG
S
SEX
SHA
RE
OF
STU
NTE
D
CH
ILD
REN
IN G
RO
UP
SIZE
OF
GR
OU
P (S
HA
RE
OF
ALL
CH
ILD
REN
0-5
)
WEA
LTH
MO
THER
’S E
DU
CAT
ION
RES
IDEN
CE
NU
MB
ER O
F SI
BLI
NG
S
SEX
SHA
RE
OF
WA
STED
C
HIL
DR
EN IN
GR
OU
P
SIZE
OF
GR
OU
P (S
HA
RE
OF
ALL
CH
ILD
REN
0-5
)
WEA
LTH
MO
THER
’S E
DU
CAT
ION
RES
IDEN
CE
NU
MB
ER O
F SI
BLI
NG
S
SEX
SHA
RE
OF
OV
ERW
EIG
HT
CH
ILD
REN
IN G
RO
UP
SIZE
OF
GR
OU
P (S
HA
RE
OF
ALL
CH
ILD
REN
0-5
)
Armenia T60 Rur 17% 9% Low or sec Rur 7% 29% Low or high
Rur 19% 19%
Bangladesh Low Rur B 50% 14% B40 B 19% 21% High 3% 9%
Bhutan B40 Low 37% 34% T60 Low or sec Rur B 8% 14% Sec 12% 20%
Cambodia B40 40% 44% B40 B 12% 22% Urb 3% 14%
India B40 Low 3+ 53% 21% B40 B 24% 24% High 4% 10%
Kazakhstan Sec 1+ 11% 30% T60 Sec 4% 27% High Urb 1 14% 14%
Kyrgyzstan B40 2+ B 25% 17% Sec or high Urb 4% 22% B40 1-3 11% 18%
Lao PDR B40 Low 58% 9% B40 Low or sec B 9% 12% 3-9 3% 12%
Maldives B40 2+ 26% 23% B40 Low Rur 3-6 15% 15% Sec or high
3-7 9% 29%
Mongolia B40 Rur 1-2 18% 11% Low or higher
Rur 1-10 B 2% 15% High 1 13% 26%
Myanmar B40 B 38% 26% Urb 9% 21% Sec or high
B 2% 17%
Nepal B40 Low 2+ 52% 14% T60 Low 12% 28% B40 Sec 2% 12%
Pakistan B40 Low B 65% 20% B40 4-10 15% 16% High 6% 9%
Tajikistan B40 31% 41% Low 13% 9% T60 Rur 1-3 9% 23%
Thailand B40 Rur 24% 31% Low or sec B 9% 22% T60 Low or high
Rur 15% 17%
Turkmenistan 2+ 14% 25% Rur 1 5% 20% T60 2-7 7% 36%
Vanuatu Low B 32% 32% Urb G 12% 8% Urb B 11% 10%
Source: ESCAP calculations using data from the latest DHS and MICS surveys for countries in the Asia-Pacific region.Low = Lower education (no or primary education), Sec = Secondary education, High = Higher education, Urb = Urban areas, Rur = Rural areas, B = Boys, G = Girls, B40 = Bottom 40% households, T60 = Top 60% households.
15
4. Who are those left behInd?

Average stunting rates declined in most countries (Figure 7).x Most countries also saw a reduction in the gap between the groups with the highest levels of stunting and the average stunting rates.xi This convergence towards the mean suggests that the furthest behind shared the progress.
In Mongolia, the universal and non-conditional Child Money Programme (initially a targeted and conditional programme) is considered to have had an important contribution to this development. In Cambodia, public health initiatives focusing on increasing the interval between births and reduction in the maternal use of tobacco have made some contribution to the drop in stunting prevalence in the past decade.28
In India, the state of Maharashtra achieved an unprecedented decline of 15 percentage points in stunting rates within a span of six years by empowering women, improving maternal health and having the political will to improve nutrition.29 The Alive & Thrive programme in Bangladesh is associated with significant improvements in breastfeeding and complementary feeding practices, thereby reducing the average child stunting rate in the country.30
x “Average” is the average rate of access in a respective year. “Stunting rate of the most disadvantaged group” is the access rate of that group in the respective year to adequate nutrition, although the size and composition of that group may vary.
xi Figure 7 reveals that average stunting rates increased in Thailand from 2005 to 2012. However, based on most recent data not yet publicly available at the time of print, the trend has been reversed and average stunting rate as of 2016 is 11 per cent.
xii This information can be obtained by observing and analyzing the classification trees for each country, available to interested researchers upon request.
Having said that, Armenia, Bangladesh, India, Lao People’s Democratic Republic, Pakistan and Thailand all saw an increase in the distance between the groups with the highest stunting rates and the country’s average. The stunting rate of the most disadvantaged Laotian, Pakistani and Thai children even increased over the examined period.
The size of the most disadvantaged groups increased in Cambodia, Kazakhstan, Myanmar, Thailand and Turkmenistan. Such an increase, if coupled with an overall fall in the stunting rate of that group, could simply indicate that stunting is less concentrated than before. In this case, to draw a definitive conclusion with regards to inequality, it is necessary to explore the exact composition of the most disadvantaged groups by looking at relevant classification trees. For example, in the case of Thailand, the most marginalized group is the same in both years and consists of rural children belonging to the bottom 40 of the wealth distribution, pointing to an increased concentration and the inability of rural areas to catch up with the progress in urban parts of the country.xii
FIGURE 7Distance of the worst-off group in stunting from country’s average, children 0–5 years old, earliest and 2010s
Source: ESCAP calculations based on latest DHS and MICS surveys for countries in the Asia-Pacific region.
Average stunting rate Stunting rate of the worst-o� group
8 pp 19 pp 8 pp 13 pp 11 pp 14 pp 8 pp 7 pp 8 pp 18 pp 14 pp 8 pp 15 pp 6 pp 11 pp 8 pp 4 pp 7 pp 4 pp 7 pp 4 pp 2 pp 4 pp 3 pp0
10
20
30
40
50
60
70
1991
2013
2000
2014
2006
2016
2000
2014
2000
2011
2000
2016
1997
2012
2000
2013
2010
2016
2005
2012
2006
2015
2006
2015
Pakistan Bangladesh India Cambodia Lao PDR Myanmar Kyrgyzstan Mongolia Armenia Thailand Turkmenistan Kazakhstan
STU
NTI
NG
PR
EVA
LEN
CE
(% O
F C
HIL
DR
EN)
16
4. Who are those left behInd?

5. Understanding overall inequality in access to adequate nutrition
xiii In general, the D-index measures the distribution of a positive outcome, which stunting is clearly not. To overcome this challenge, the rate of “non-stunted children” is used as an indicator, analyzing which groups of children are “healthiest”, defined as not stunted. Obviously, the assumption in this notation is that not being stunted indicates adequate nutrition, which may not be always the case. The resulting D-Index for access to adequate nutrition is a positive measure of child population health, using the distribution of non-stunted children in a population as an indicator.
Beyond identifying the most disadvantaged, this section calculates overall levels of inequality in accessing adequate nutrition by measuring the proportion of children who are not stunted. In the following analysis, not being stunted is used as a proxy indicator for access to adequate nutrition.xiii The calculated inequality in access to adequate nutrition can also be decomposed by circumstances, thereby capturing the individual impact of each circumstance for every country. Policymakers can follow this analysis to identify the overall factors aggravating inequality in their own country.
5.1Calculating overall inequality
The first step to measuring overall inequality in access to adequate nutrition is to identify all possible groups of children and their levels of stunting. The Dissimilarity Index (D-index) of access to adequate nutrition is then determined by taking the access distances for each of these groups and comparing them to the average access level for each country (Box 1). The calculated D-index is used to represent the overall inequality in access to adequate nutrition.
“…two countries with identical average
rates of non-stunted children may
have a very different D-indices
depending on how equitably access to
adequate nutrition is distributed”
BOX 1Calculating the Dissimilarity Index
The dissimilarity index, or D-index, measures how all different groups of young children fare in terms of accessing adequate nutrition. For example, two countries with identical average rates of non-stunted children may have a very different D-indices depending on how equitably access to adequate nutrition is distributed (e.g. among boys and girls, from households with different incomes, and with mothers with different levels of education). To obtain the D-index for each country, inequalities in access to adequate nutrition (defined here as non-stunted children) among all possible population groups are calculated using the following equation:
where is the weighted sampling proportion of group , (sum of equals 1), is the average access rate in the country and is the level of access of population group , and takes values from 0 to 1. There is n number of groups. Each group is defined by using the interactions of the circumstances selected for the analysis. In the case of stunting, five circumstances are used to determine the number and composition of the population groups: wealth (2 groups); residence (2 groups); sex (2 groups); education (4 groups); and number of children under 5 years of age in the household (5 groups). This produces n=160 groups (2×2×2×4×5), covering the entire sample population.
17

5.2Where is overall inequality highest?
Overall inequality in access to adequate nutrition is highest in countries with high average rates of stunted children. For example, Pakistan and Lao People’s Democratic Republic have high D-index of non-stunted children (Figure 8). Kazakhstan and Turkmenistan, in comparison, have low D-indices below 0.02, respectively.
There can be cases, however, where two countries have similar average rates of stunting, but quite different levels of inequality (D-indices). For example, India and Lao People’s Democratic Republic have similar average rates of stunted children at around 40 per cent, but very different D-indices, reflecting also the findings from section 4 (Figure 3) that explored the gap between the most extreme groups. Among the countries with healthier children (low levels of stunting), the variation of the D-indices is also lower (lower left quadrant, Figure 8).
5.3What circumstances matter more in accessing nutrition?
Building on the calculation of the D-index, the contribution of each of the children’s group circumstances to inequality is estimated. This analysis follows a methodology called the Shapley decomposition (Box 2).
From a policymaking perspective, understanding the relative importance of various circumstances can inform priorities for intervention, particularly if the goal is to “leave no one behind”. As measured by the D-index, the relative contribution that specific circumstances make to inequality varies across the region. For example, being in a poorer household (bottom 40 of the wealth distribution) contributes the largest share of inequality in more than half of the countries (Figure 9). The level of education of the mother is an important factor in most countries and the most prominent contributor to this inequality in 4 out of 17 countries. Being a boy is most important in Vanuatu. In Armenia, Kyrgyzstan and Turkmenistan – countries with low inequality and relatively lower rates of stunting among children – inequality is mainly driven by the number of young children in the family.
“…being in a poorer household
(bottom 40 of the wealth
distribution) contributes
the largest share of inequality”
FIGURE 8D-indices and average rates of stunted children, latest year
Source: ESCAP calculations using data from the latest DHS and MICS surveys for countries in the Asia-Pacific region.
Nepal
BhutanMaldives
Kazakhstan
Vanuatu
Pakistan
Lao People’s Democratic Republic
Bangladesh
India
CambodiaMyanmarTajikistan
ThailandMongolia
KyrgyzstanArmenia
Turkmenistan0.00
0.02
0.04
0.06
0.08
0.10
0.12
0.14
0.16
0 10 20 30 40 50 60AVERAGE RATES OF STUNTING (PERCENTAGE)
D-I
ND
ICES
0.06
29%
18
5. understandIng overall InequalIty In access to adequate nutrItIon

BOX 2Shapley decomposition
The Shapley decomposition method estimates the marginal contribution of each circumstance to inequality in accessing adequate nutrition, as measured by the rates of non-stunted children in each group. The basic idea behind this decomposition, taken from cooperative game theory, is measuring how much the estimated D-index changes when a circumstance is added to a pre-existing set of circumstances. The change in inequality caused by the addition of a new circumstance would be a reasonable indicator of its contribution to inequality.31
The impact of adding circumstance A (e.g., wealth) is given by the following formula:
Where N is the set of all n circumstances; and S is the subset of N circumstances obtained after omitting the circumstance A. D(S) is the D-index estimated with the sub set of circumstances S. D(SU{A}) is the D-index calculated with set of circumstances S and the circumstance A.
The contribution of characteristic A to the D-index is then formula:
The critical property satisfied by the Shapley decomposition is that the sum of contributions of all characteristics adds up to 1 (100%).
FIGURE 9Inequality in adequate nutrition among children (non-stunted) and its decomposition, grouped by the most important circumstance in shaping inequality, latest year
Source: ESCAP calculations using data from the latest DHS and MICS surveys for countries in the Asia-Pacific region.
0.00
0.02
0.04
0.06
0.08
0.10
0.12
0.14
Nep
al
Bhut
an
Mal
dive
s
Kaza
khst
an
Vanu
atu
Paki
stan
Lao
PDR
Bang
lade
sh
Indi
a
Cam
bodi
a
Mya
nmar
Tajik
ista
n
Thai
land
Mon
golia
Kyrg
yzst
an
Arm
enia
Turk
men
ista
nMOTHER'S EDUCATION IS THE MOST IMPORTANT FACTOR
SEX (BOY) IS THE MOST IMPORTANT FACTOR
WEALTH IS THE MOST IMPORTANT FACTOR
RESIDENCE AND NUMER OF SIBLINGS UNDER-5 ARE THE MOST IMPORTANT FACTORS
DEC
OM
POSI
TIO
N O
F D
-IN
DEX
Mother’s education Sex Wealth Other
19
5. understandIng overall InequalIty In access to adequate nutrItIon

5.4How does each circumstance contribute to determining access?
To bolster the analytical findings, logistic regressions are conducted to confirm the observed effects of circumstance variables on stunting prevalence in every country of the analysis. xiv
The logistic regression model is given by:
Where is a binary variable that assumes values:
and
where β0 ,..., n are logit model coefficients and X1 ,..., n are circumstance variables: X1 is household wealth, X2 is household residence, X3 is child’s sex, X4, X5, and X6 are dummy variables representing different educational levels of the mother (X4 for mother’s education at primary level, X5 for mother’s education at secondary level, and X6 for mother’s education at higher/tertiary level), and X7 is the number of children under 5 years of age in the household.
xiv A total of 17 logistic regressions are summarized in Annex Table A3.
Results from the estimations confirm that households in the bottom 40 per cent of the wealth distribution have a higher chance of having a stunted child. Residence is also statistically significant in many countries and the odds of having a stunted child are lower in urban than in rural households. Households with mothers having completed primary, secondary or higher education have lower odds of having a stunted child, as compared with mothers with no education. Boys have higher chances of being stunted than girls in most countries studied. Finally, having a stunted child increases with the number of children in the household.
Taking the example of Lao People’s Democratic Republic, the odds of having a stunted child in a bottom 40 household are 83 per cent higher than in top 60 households. The odds of having a stunted child in a rural household are 41 per cent higher than in urban households. With respect to educational attainment of the mother, the calculated odds ratios of having a stunted child are about halve for mothers with secondary or higher education compared to mothers with no education, indicating the importance of mother’s education on a child’s health. Finally, for every additional child in the household, the odds of having a stunted child increase by 7 per cent.
20
5. understandIng overall InequalIty In access to adequate nutrItIon

6. Does ethnicity matter for determining the furthest behind?
In many countries marginalized groups are defined by a non-dominant, common ethnic or religious identity. Unfortunately, there is a general lack of survey data detailing how ethnicity and faith shape inequality and create marginalized pockets within countries.
6.1How does a minority identity add to the disadvantage?
Seven countries covered in this paper include questions on ethnicity, language or religion in their surveys, thereby opening a small, but unique window for understanding these interactions (Table 3). Repeating the classification tree analysis and including caste, ethnicity, religion and language as circumstance variables alters the composition of the furthest behind groups in four countries: India (2016), Lao People’s Democratic Republic (2011), Kazakhstan (2006), and
“…there is a general lack of survey
data detailing how ethnicity and
faith shape inequality”
TABLE 3Stunting rates for different linguistic, ethnic and/or religious groups
OVERALL WORST-OFF: OVERALL BEST-OFF: COMPARABLE:
CIRCUMSTANCES AND STUNTING RATE OF THE LEAST ADVANTAGED GROUP (1)
CIRCUMSTANCES AND STUNTING RATE OF THE MOST ADVANTAGED GROUP (2)
WORSE-OFF LINGUISTIC, ETHNIC, RELIGIOUS MINORITY (3)
BETTER-OFF LINGUISTIC, ETHNIC, OR RELIGIOUS MINORITY (4)
India (2016) Scheduled caste and other backward caste children from poorer households whose mothers have only primary education and who live in households with three or more children: 54%
Children from richer households whose mothers have higher education: 20%
Scheduled caste and other backward caste children whose mothers have only primary education and who live in poorer households with three or more children: 54%
Not identified caste children whose mothers have only primary education and who live in poorer households with three or more children: 50%
Lao People’s Democratic Republic (2000)
Ethnic Kammu, Hmong, all other ethnicity, or minor ethnicity children whose mothers have only primary education: 55%
Ethnic Lao or Phoutai, who live in urban areas and whose mothers have completed primary or secondary education: 27%
Ethnic Kammu, Hmong, all other ethnicity, or minor ethnicity: 49%
Ethnic Lao or Phoutai children: 36%
Lao People’s Democratic Republic (2011)
Poorer animists belonging to minority ethnic groups or other ethnic groups, whose mothers have no education: 61%
Richer ethnic Lao children living in urban areas: 19%
Richer ethnic Khmu, Hmong, minor or other ethnicity children: 37%
Richer ethnic Lao children: 23%
Kazakhstan (2006)
Ethnic Kazakh boys, with two siblings or more whose mothers with no/primary education: 25%
Other ethnicities/ ethnic Russian whose mothers have secondary or higher education: 12%
Ethnic Kazakh children: 20%
Other ethnicities or ethnic Russian children: 14%
Mongolia (2013)
Minor ethnicity or other ethnicity children from poorer households: 19%
Richer Buddhists: 5% Richer minor ethnicity or other ethnicity children: 19%
Richer Khalka children: 12%
Source: ESCAP calculations using data from the latest DHS and MICS surveys for countries in the Asia-Pacific region.
21

Mongolia (2013). In all these countries, several circumstances interact with minority status to form an additional disadvantage for the children belonging to these groups.
Columns 1 and 2 in Table 3 present the best and worst-off groups in those countries where these minority status circumstances shaped the classification tree. As columns 1 and 2 represent the extreme “branches” of the trees, which consist of variables selected by a statistical model, they are not usually comparable. Columns 3 and 4, on the other hand, present comparable splits, i.e. between groups with otherwise similar circumstances but different ethnic, religious, linguistic or caste-related identity. In that sense, the stunting rates of columns 3 and 4 highlight which ethnic or other identities influence most the prevalence of stunting among children. The gaps may not be very large, since these groups already share similar general circumstances, but every percentage point difference stems from the different identity.
For example, in Mongolia the worst-off group consists of minor ethnicity or other ethnicity children from poorer households, of which 19 per cent are stunted (column 1). The best-off group is determined based not on ethnicity, but religion: in richer Buddhist families, only 5 per cent of the children are stunted (column 2). A more straightforward comparison is given in columns 3 and 4, whereby ethnicity is the only dividing circumstance among richer children (belonging to the top 60 of the distribution): 12 per cent of richer Khakha children (dominant ethnicity in Mongolia) are stunted, compared with richer children from other minor ethnicities, 19 per cent of which are stunted.
In Lao People’s Democratic Republic, where data were collected for two different time periods, the composition of the worst-off group changed. In 2000 the worst-off group consisted of ethnic Kammu, Hmong, or other minor ethnicity children, whose mothers had only primary education, 55 per cent of which were stunted. In 2011, religion became more relevant and the worst-off group consisted of children living in poorer animist households and belonging to minority ethnic groups or other ethnic groups,
whose mothers had no education, 61 per cent of which were stunted. That group represented 10 per cent of the population of children under the age of 5.
In India in 2016 the worst-off group consisted of scheduled caste children from poorer households whose mothers had only primary education and who lived in households with more than three children, 60 per cent of which were stunted (column 1). The children whose mothers had higher education also had the lowest stunting rate of 20 per cent (column 2). In general, factors other than caste were more important in determining stunting in children in India, such as mother’s education and belonging to the bottom 40 or top 60 of the wealth distribution. For that reason, after controlling for lower education (primary only) and being in a poorer household, the difference in stunting rates between scheduled caste and other caste or no caste children were very small: 54 per cent for those from scheduled castes and 50 per cent for the rest (columns 3 and 4).
This analysis references the nutrition disadvantage of many ethnic and other minorities, but only relies on available DHS and MICS data. It is also limited to groups that represent at least 5 per cent of the total sample population, thus possibly missing smaller groups. Using stunting as a proxy indicator also conceals other health-related disadvantages faced by children of minority groups. Evidence suggests that poverty, social exclusion, inadequate health services, lack of education, environmental destruction all contribute to indigenous peoples having consistently lower health outcomes than
“This analysis references
the nutrition disadvantage
of many ethnic and other
minorities, but only relies
on available DHS and
MICS data”
22
6. does ethnIcIty matter for determInIng the furthest behInd?

their non-indigenous counterparts.32 For example, the gap in life expectancy between indigenous and non-indigenous is as high as 20 years in Nepal.33
6.2So what’s the impact on overall inequality?
Adding ethnicity and religion to the D-index calculation and decomposition have a significant influence on overall inequality in children’s access to adequate nutrition.
Ethnicity and religion are the largest contributors to inequality in Lao People’s Democratic Republic, responsible for some 38 per cent of this inequality (Figure 10). While other circumstances dominate in the remaining countries, ethnicity and religion are nonetheless responsible for 22 per cent of inequality in Mongolia, 21 per cent in Kazakhstan, 17 per cent in Thailand and 6 per cent in Vanuatu. In India, where data is collected on religion and caste, these circumstances contribute 13 per cent to inequality; and in Turkmenistan, where data is available on language, this circumstance makes up 18 per cent of inequality.
This brief assessment hints at the additional negative impact belonging to a minority can have on stunting among children in the Asia-Pacific region. It also reveals the general lack of comparable, reliable and consistently collected data on these population groups and the need to better include them in data collection efforts. The same gaps in data exists for migrants, slum dwellers, persons with disabilities and other difficult to reach groups.
“This brief assessment hints at
the additional negative impact
belonging to a minority can have
on stunting among children in the
Asia-Pacific region”
FIGURE 10The role of caste, ethnicity, religion or language in shaping inequality in children’s access to adequate nutrition, latest year
Source: ESCAP calculations using data from the latest DHS and MICS surveys for countries in the Asia-Pacific region.
0.00
0.02
0.04
0.06
0.08
0.10
0.12
0.14
0.16
Turkmenistan2015
No. of childrenunder 5
Kazakhstan2015
Mother’seducation
Mongolia2013
Wealth
Thailand2012
Wealth
Vanuatu2007
Gender (boy)
India2016
Wealth
Lao PDR2011
Ethnicityand religion
Wealth Residence Sex Mother’s education Children under 5 Ethnicity, religion, language, caste
DEC
OM
POSI
TIO
N O
F D
-IN
DEX
23
6. does ethnIcIty matter for determInIng the furthest behInd?

7. Recommendations for closing the gaps
Countries in the region face a range of challenges in securing access to adequate nutrition for all. Exploring inequalities in anthropometric measurements in children, the analysis shows that while some countries are drastically reducing stunting rates, others are still struggling with little to no change, or even seeing deterioration. Malnutrition during early childhood can have lifelong consequences.
This paper shows that those at the bottom end of the spectrum are children from poorer rural households, with mothers having lower levels of education. Action is therefore needed to raise awareness and offer nutrition-related interventions to those who need it most. Countries seeking to improve the nutritional status of children in an equitable manner could do so by prioritizing the disadvantaged groups identified.
While the paper does not discuss in length policy options for improving nutrition outcomes, the following are key considerations for policymakers when designing regulatory and other policies addressing nutrition access:
1 Identify the shared common circumstances shaping household choices. Unequal nutrition outcomes are strongly linked to unequal outcomes in other development objectives (e.g., mothers’ education). Understanding the key circumstances shaping household decisions is therefore paramount to addressing not only nutrition inequalities, but other opportunities as well. The impact of poverty, residence, level of mother’s education, as well as the number of siblings and ethnicity, on stunting levels vary across countries. Knowing the national circumstances faced by children with the highest levels of stunting, wasting and overweight, and the circumstances contributing to it, helps policymakers to prioritize and schedule more effective interventions.
2 Invest in girls’ education. Lower overall educational attainment of the mother is behind much of the inequality in stunting among children. This association underlines the importance of girls’ education not only for their own empowerment and independence, but also for the next generation.
3 Advertise the long term economic benefits of investing in child nutrition. There is a strong link between interventions increasing childhood access to nutrition and socioeconomic benefits. Every USD 1 invested in stunting reduction is estimated to bring approximately USD 16 in returns through gains in productivity.34 Relevant ministries should therefore bolster awareness of such returns and motivate multi-stakeholder action. Education and information campaigns targeting particularly pregnant and nursing mothers and young parents in general can have significant positive long-term impacts.
4 Encourage collaboration among ministries and agencies to strengthen access to adequate nutrition. To ensure adequate nutrition for all children a host of issues need to be addressed, including: the education of parents; nutritional status of the mother; child feeding practices; provision of clean water and encouragement of the use of improved sanitation facilities and handwashing practices; access to basic health care, including adequate reproductive health-care services; elimination of harmful cultural practices and traditions.35 Most importantly, agriculture and food systems should be nutrition-sensitive to ensure the production of a variety of affordable, nutritious, and safe foods to meet the dietary requirements of populations.36 To address the underlying causes of malnutrition, nutrition-sensitive social protection is another crucial strategy. Coordination is therefore necessary across many ministries and teams to share information and to design comprehensive and supportive policies to improve nutrition among pregnant mothers and their children.
5 Strengthen data collection efforts to understand how nutrition deficits impact communities. Existing household survey data do not provide a full understanding of how household choices and behaviour subsequently result in inequalities to nutrition among and within households. Granular data is therefore necessary for determining the extent of the connection between nutrition and overall development. Qualitative data is also necessary to gain information on social norms and cultural behaviours that shape people’s nutrition status and lifestyle habits.
24

Annex: Methodology for identifying gaps in access to opportunities
xv Access to the DHS datasets for three additional Pacific countries has been requested and the requests are still under consideration.
xvi The latest indicators for monitoring the SDGs can be found at: https://unstats.un.org/sdgs/iaeg-sdgs/
Inequality of opportunity
To measure inequality of opportunity, this series of policy papers identify core opportunities and measure the gaps among different population groups in accessing those opportunities. To define the population groups, a set of circumstances is selected from available variables in the DHS and MICS datasets. The circumstances are conditions over which the individuals or households have no or little control.
In this paper, those circumstances are used in the classification tree analysis to identify the most disadvantaged children in each country in terms of basic anthropometric measurements: highest rates of stunting, wasting and overweight. The composition of those groups varies from country to country, as does the size of the sample population they represent.
This approach differs from the use of “inequality of opportunity” in other recent literature, which instead uses regression analysis to explain the share of inequality of outcome (income inequality or consumption inequality) that can be attributed to circumstances over which individuals have no control, such as race and sex.
Given that the available datasets (DHS and MICS) do not include information on income or consumption (both classified as outcomes), these thematic policy papers do not include such regressions.
The data sources
This analysis in these papers uses the Demographic and Health Surveys (DHS) and the Multiple Indicator Cluster Surveys (MICS). DHS and MICS are publicly available for 22 Asian and Pacific countries as shown in Table A1.xv The DHS and MICS datasets are selected because of: a) the
comparability across countries; b) the accessibility of the data; and c) the extensive questions on health, demographic and basic socioeconomic data referencing both the household (e.g., water and sanitation, financial inclusion, electricity and clean fuels, ownership of mobile phones) and individuals (e.g., level of education, nutrition status).xvi Hence, certain countries have been excluded from this paper if DHS and MICS results are too outdated, even if national survey results exist for these countries.
The countries
Based on available surveys, 17 out of 22 countries are included in this paper. The paper does not include Afghanistan, Indonesia and the Philippines due to a lack of data from DHS and MICS. In total, 11 countries have surveys representing two different points in time. Table A1 provides the full list of 18 countries and survey years (latest and earliest).
The indicators and circumstances
For the purpose of this analysis, the indicators depicting inequality in health outcomes and access to adequate nutrition among children are stunting, wasting and overweight rates among children under 5 years of age. As reported by the Interagency Group on SDG Indicators (IAEG-SDGs), their connection to the Sustainable Development Goals (SDGs) were the main criterion for selecting these indicators.37 The analysis in this paper focused on stunting, although some aggregate information on wasting and overweight was included.
The circumstances used are residence (rural or urban), wealth (belonging to the bottom 40 or top 60), sex (male or female), mother’s highest education (no education, primary, secondary and higher education) and the number of children in the household under 5 years of age.
25

The classification tree analysis
The primary goal of the household survey analysis is identifying the children’s groups with the worst and best nutrition outcomes by using the selected indicators. The indicators can be seen as “response variables”, while the factors characterizing the groups are defined as “circumstances”.
The analysis then uses a classification tree model and algorithm to identify the groups with highest or lowest access. A classification tree is an analytical structure representing groups of the sample population with different response values, or different levels of access to a certain opportunity.
TABLE A1List of countries and survey years
COUNTRY EARLIEST YEAR EARLIEST SURVEY LATEST YEAR LATEST SURVEY
Afghanistan 2010 MICS 2015 DHS
Armenia 2000 DHS 2010 DHS
Bangladesh 2000 DHS 2014 DHS
Cambodia 2000 DHS 2014 DHS
Indonesia 2003 DHS 2012 DHS
Kazakhstan 2006 MICS 2015 MICS
Kyrgyzstan 1997 DHS 2012 DHS
Lao People’s Democratic Republic 2000 MICS 2011 MICS
Mongolia 2000 MICS 2013 MICS
Nepal n/a n/a 2016 DHS
Pakistan 1991 DHS 2013 DHS
Philippines 1998 DHS 2013 DHS
Thailand 2005 MICS 2012 MICS
Turkmenistan 2006 MICS 2015 MICS
Bhutan n/a n/a 2010 MICS
India 2006 DHS 2016 DHS
Maldives n/a n/a 2009 DHS
Myanmar 2000 MICS 2016 DHS
Tajikistan n/a n/a 2012 DHS
Vanuatu n/a n/a 2007 MICS
Consider the following example:
Opportunity: Adequate nutrition
Indicator (“response variable”): “Stunting rate”
Factors (“circumstances”): The circumstances being considered are the following:
1 Residence (urban or rural),
2 Sex (male or female),
3 Number of children in the household under 5 years of age,
4 Household wealth (bottom 40 or top 60),
5 Mother’s highest education level (no education, primary, secondary, or higher).
26
annex: methodology for IdentIfyIng gaps In access to opportunItIes

To identify the groups with the highest or lowest access to adequate nutrition, a classification tree is constructed for each country using R, an open source statistical software. The root node of the tree is the entire population sample. The tree method algorithm starts by searching for the first split (or branch) of the tree. It does so by looking at each circumstance and separating the sample into two groups, so that it achieves the most “information reduction”. This information metric can be defined in a few ways, while the most common one, and the one used in this analysis, is the “entropy”.38
The tree representation
The tree method involves an algorithm that estimates stunting rates by partitioning the children in the sample into different groups based on the circumstances chosen:
Where Yi is the observed opportunity for the i-th household in the sample, X1i, ...., Xli are the circumstances for the child. In the example of stunting, Y is the stunting rate, X1, X2, X3, X4, X5 (where l = 5) are residence, sex, children under 5 years of age in the household, wealth and mother’s highest education level of household members, three circumstances of the household from the survey. A1, A2, ..... Am are the different partitions of the sample, also called end nodes, where:
and
This means the end nodes are mutually exclusive and complementary, and every child belongs to one and only one of the end nodes. I () only takes value 1 when the i-th household belongs to j-th end node, otherwise, I () takes value 0. The tree algorithm generates the end nodes, according to metrics that measure the effectiveness of the partition that it gives to different levels of access to nutrition.
Information theory and entropy are a very common choice for the metrics. Entropy for j-th end node can be calculated according to the definition:
The aggregated entropy for the tree is calculated by:
Where qj is the sample proportion of Aj. The actual algorithm that generates the end-nodes is step-by-step, starting from the entire sample. Each time the sample is partitioned new end-nodes are generated and the entropy is calculated and compared to the entropy before the new partition. Each partition (and hence the new end-nodes) is kept when the increment of entropy is bigger than a pre-set threshold. The algorithm stops when no more increments of entropy can be made by a new partition, or a set of pre-set conditions cannot be satisfied.
In addition to finding groups with significant differences in their access to nutrition, the classification tree algorithm also operates under the limitation that each group should have enough group members. To avoid a sub-sample size that is too small, the analysis sets the tree nodes to have a minimum size of at least 10 per cent of the total population and the split of tree is only made when an “information reduction” criterion is satisfied.
In section 6, which introduces caste, ethnicity, language and religion as circumstances, the minimum size of the population group criterion is reduced to 5 per cent of the population to capture minority religions and ethnicities.
Choice of circumstances
Out the many variables available in the DHS and MICS surveys, several determinant factors are considered to help identify the most excluded groups. The selection of variables is consistent across all surveys to maintain comparability of inequality across countries.
27
annex: methodology for IdentIfyIng gaps In access to opportunItIes
The classification tree includes these factors in the tree as branches only if they are found to reduce entropy. Ultimately, these circumstances (determinant factors) define the composition of the groups. However, circumstances should not be interpreted as “causes” of inequality, as the classification tree does not establish causality. Furthermore, there are many other factors that these models cannot consider, given the limited variables available in the datasets.
Ideally, researchers preferred to include only circumstances over which a household member has little control, such as the dominant religion in the respondent’s household, ethnicity or the existence of a disability, or education of both parents of the child. The majority of the DHS surveys did not ask these questions. Some MICS, however, did ask questions related to ethnicity, language, and religion and the results are presented in section 6. The DHS for India also included questions on caste.
Additional factors of interest for the study are geographical variables, such as province or region of a given country, but inclusion would have affected comparability across countries. Geographic variables can be analysed in future work focusing on one country only.
Gaps and limitations
The available datasets limit the scope of this analysis somewhat. First, several relevant circumstances, for example the access to food, its affordability etc., cannot be captured.
Furthermore, and consistent with similar studies on inequalities among groups, this analysis does not consider inequality within groups.39 Even within homogeneous groups, additional unobserved circumstances, or different levels of effort, may affect outcomes. This analysis only calculates observable average access to opportunity for each group, and thus draws conclusions on gaps and inequality based on these average observations.
xvii For more information see Demographic and Health Surveys (DHS) http://www.dhsprogram.com/programming/wealth%20index/DHS_Wealth_Index_Files.pdf
Finally, recent literature on inequality of opportunity also links inequality of outcome with inequality of opportunity by calculating the share of income inequality (inequality of outcome) that can be explained by the circumstances of each group.40 The analysis in these papers does not follow the same approach because the datasets do not include an income proxy besides the wealth index.
The wealth index and the bottom 40 – top 60 wealth split
Wealth, as used in this paper, is a composite index reflecting a household’s cumulative living standard developed by the DHS and MICS researchers and combines a range of household circumstances, including: a) ownership of household assets, such as TVs, radios and bicycles; b) materials used for housing; and c) types of water and sanitation facilities.
The wealth index is calculated by using the Principal Component Analysis which allows a relative ranking of households based on their assets.xvii The wealth index is not comparable across countries, however, as it consists of different assets in each country. Cross-country comparison of household access based on “wealth” should be understood with this caveat.
In these papers, the wealth index is employed as a circumstance to distinguish between different types of households. Although technically not a circumstance over which households have no control, wealth is still a proxy for many hidden conditions that may limit access to a certain opportunity, especially considering the lack of other determinant factors to explore, such as education of the father, ethnicity, prevalence of a disability or migrant status.
In this paper, children can belong to one of two possible groups based on the wealth index: the bottom 40 (sometimes labelled as “poorer”); and the top 60.
28
annex: methodology for IdentIfyIng gaps In access to opportunItIes

Several other possible cuts of the wealth index were considered, including by quintile, top 40 – bottom 40, and top 10 – bottom 40. These options were not selected because generally they produce more homogeneous groups, thus overshadowing other circumstances (e.g. education levels, rural – urban distinctions). The top 40 – bottom 40 approach (and its variation of top 10 – bottom 40) were also rejected because they eliminate 20 to 50 per cent of the sample population from the analysis; with a risk of missing some “middle class” groups with common characteristics (e.g., secondary education).
TABLE A2Selected indicators and factors
OP
PO
RTU
NIT
Y ST
UD
IED 1 2 3
OPPORTUNITY Stunting Overweight Wasting
SURVEY USED DHS/MICS DHS/MICS DHS/MICS
REFERENCE GROUP IN SURVEY Child aged 0–5 who has been measured
Child aged 0–5 who has been measured
Child aged 0–5 who has been measured
FAC
TOR
S U
SED
TO
DET
ERM
INE
EXC
LUD
ED G
RO
UP
S
FACTOR 1: WEALTH Bottom 40–Top 60 Bottom 40–Top 60 Bottom 40–Top 60
FACTOR 2: RESIDENCE Urban–Rural Urban–Rural Urban–Rural
FACTOR 3: MOTHER’S EDUCATION No or Primary–Secondary –Higher
No or Primary–Secondary –Higher
No or Primary–Secondary –Higher
FACTOR 4: SEX Boy–Girl Boy–Girl Boy–Girl
FACTOR 5: NO. OF CHILDREN Number of children <5 Number of children <5 Number of children <5
SDG
REF
EREN
CE
RELATED SDG INDICATOR 2.2.1 Prevalence of stunting (height for age <-2 standard deviation from the median of the World Health Organization (WHO) Child Growth Standards) among children under 5 years of age
2.2.2 Prevalence of malnutrition (weight for height >+2 or <-2 standard deviation from the median of the WHO Child Growth Standards) among children under 5 years of age, by type (wasting and overweight)
2.2.2 Prevalence of malnutrition (weight for height >+2 or <-2 standard deviation from the median of the WHO Child Growth Standards) among children under 5 years of age, by type (wasting and overweight)
SUR
VEY
REF
EREN
CE
SURVEY QUESTION (IN DHS/ MICS)
Height in centimeters for children age 0–5
Weight in kilograms and height in centimeters for children age 0–5
Weight in kilograms and height in centimeters for children age 0–5
DESCRIPTION If the height of the child is two standard deviations below the average of children of the same age, he/she is considered stunted
If the ratio of the weight over height of the child is more than two standard deviations of the average of children of the same age, he/she is considered overweight
If the ratio of the weight over height of the child is below two standard deviations of the average of children of the same age, he/she is considered wasted
SURVEY RECODE Personal Recode Personal Recode Personal Recode
Note: *Personal Recode
Narrowing the sample population to only half (top 10 – bottom 40) also runs the risk of not allowing for making statistically significant inferences. Moreover, neither the top node, the root of the tree, nor the size of the groups of the rest of the nodes would be representative of the population.
Finally, the wealth index in the DHS and MICS produces a distribution of households by wealth without any monetary values assigned to the distribution. Therefore, the comparisons of top 1 – top 10 – top 40 per cent do not have the same explanatory value as they would if the wealth index had taken continuous monetary values.
29
annex: methodology for IdentIfyIng gaps In access to opportunItIes
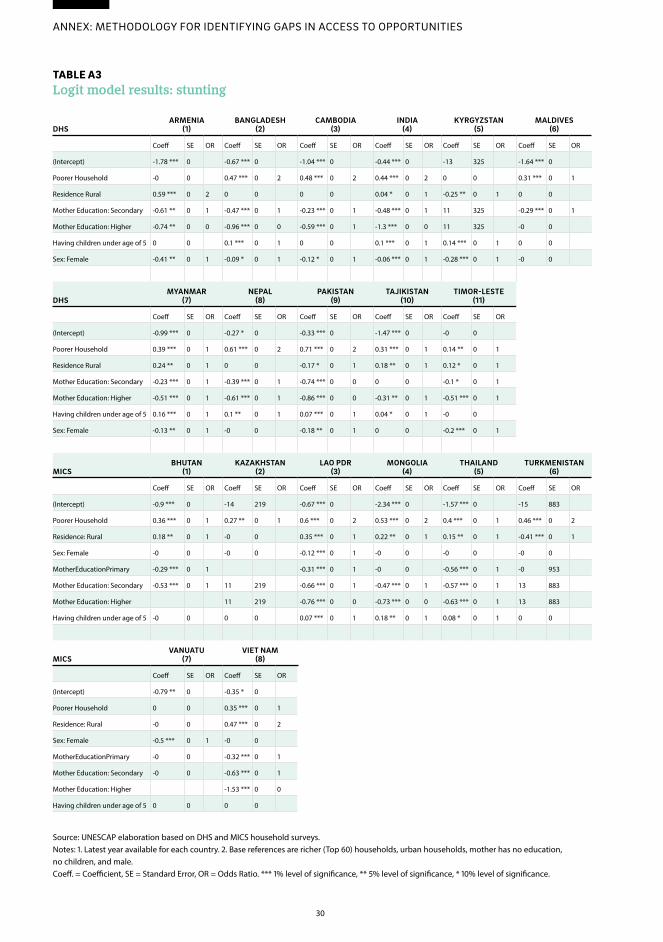
TABLE A3Logit model results: stunting
DHSARMENIA
(1)BANGLADESH
(2)CAMBODIA
(3)INDIA
(4)KYRGYZSTAN
(5)MALDIVES
(6)
Coeff SE OR Coeff SE OR Coeff SE OR Coeff SE OR Coeff SE OR Coeff SE OR
(Intercept) -1.78 *** 0 -0.67 *** 0 -1.04 *** 0 -0.44 *** 0 -13 325 -1.64 *** 0
Poorer Household -0 0 0.47 *** 0 2 0.48 *** 0 2 0.44 *** 0 2 0 0 0.31 *** 0 1
Residence Rural 0.59 *** 0 2 0 0 0 0 0.04 * 0 1 -0.25 ** 0 1 0 0
Mother Education: Secondary -0.61 ** 0 1 -0.47 *** 0 1 -0.23 *** 0 1 -0.48 *** 0 1 11 325 -0.29 *** 0 1
Mother Education: Higher -0.74 ** 0 0 -0.96 *** 0 0 -0.59 *** 0 1 -1.3 *** 0 0 11 325 -0 0
Having children under age of 5 0 0 0.1 *** 0 1 0 0 0.1 *** 0 1 0.14 *** 0 1 0 0
Sex: Female -0.41 ** 0 1 -0.09 * 0 1 -0.12 * 0 1 -0.06 *** 0 1 -0.28 *** 0 1 -0 0
DHSMYANMAR
(7)NEPAL
(8)PAKISTAN
(9)TAJIKISTAN
(10)TIMOR-LESTE
(11)
Coeff SE OR Coeff SE OR Coeff SE OR Coeff SE OR Coeff SE OR
(Intercept) -0.99 *** 0 -0.27 * 0 -0.33 *** 0 -1.47 *** 0 -0 0
Poorer Household 0.39 *** 0 1 0.61 *** 0 2 0.71 *** 0 2 0.31 *** 0 1 0.14 ** 0 1
Residence Rural 0.24 ** 0 1 0 0 -0.17 * 0 1 0.18 ** 0 1 0.12 * 0 1
Mother Education: Secondary -0.23 *** 0 1 -0.39 *** 0 1 -0.74 *** 0 0 0 0 -0.1 * 0 1
Mother Education: Higher -0.51 *** 0 1 -0.61 *** 0 1 -0.86 *** 0 0 -0.31 ** 0 1 -0.51 *** 0 1
Having children under age of 5 0.16 *** 0 1 0.1 ** 0 1 0.07 *** 0 1 0.04 * 0 1 -0 0
Sex: Female -0.13 ** 0 1 -0 0 -0.18 ** 0 1 0 0 -0.2 *** 0 1
MICSBHUTAN
(1)KAZAKHSTAN
(2)LAO PDR
(3)MONGOLIA
(4)THAILAND
(5)TURKMENISTAN
(6)
Coeff SE OR Coeff SE OR Coeff SE OR Coeff SE OR Coeff SE OR Coeff SE OR
(Intercept) -0.9 *** 0 -14 219 -0.67 *** 0 -2.34 *** 0 -1.57 *** 0 -15 883
Poorer Household 0.36 *** 0 1 0.27 ** 0 1 0.6 *** 0 2 0.53 *** 0 2 0.4 *** 0 1 0.46 *** 0 2
Residence: Rural 0.18 ** 0 1 -0 0 0.35 *** 0 1 0.22 ** 0 1 0.15 ** 0 1 -0.41 *** 0 1
Sex: Female -0 0 -0 0 -0.12 *** 0 1 -0 0 -0 0 -0 0
MotherEducationPrimary -0.29 *** 0 1 -0.31 *** 0 1 -0 0 -0.56 *** 0 1 -0 953
Mother Education: Secondary -0.53 *** 0 1 11 219 -0.66 *** 0 1 -0.47 *** 0 1 -0.57 *** 0 1 13 883
Mother Education: Higher 11 219 -0.76 *** 0 0 -0.73 *** 0 0 -0.63 *** 0 1 13 883
Having children under age of 5 -0 0 0 0 0.07 *** 0 1 0.18 ** 0 1 0.08 * 0 1 0 0
MICSVANUATU
(7)VIET NAM
(8)
Coeff SE OR Coeff SE OR
(Intercept) -0.79 ** 0 -0.35 * 0
Poorer Household 0 0 0.35 *** 0 1
Residence: Rural -0 0 0.47 *** 0 2
Sex: Female -0.5 *** 0 1 -0 0
MotherEducationPrimary -0 0 -0.32 *** 0 1
Mother Education: Secondary -0 0 -0.63 *** 0 1
Mother Education: Higher -1.53 *** 0 0
Having children under age of 5 0 0 0 0
Source: UNESCAP elaboration based on DHS and MICS household surveys.Notes: 1. Latest year available for each country. 2. Base references are richer (Top 60) households, urban households, mother has no education, no children, and male.Coeff. = Coefficient, SE = Standard Error, OR = Odds Ratio. *** 1% level of significance, ** 5% level of significance, * 10% level of significance.
30
annex: methodology for IdentIfyIng gaps In access to opportunItIes

References1 FAO, IFAD, UNICEF, WFP and WHO. The State of Food Security and
Nutrition in the World 2017. Building Resilience for Peace and Food Security. Rome, 2017.
2 UNICEF. Nutrition: The case for support. New York, 2017.
3 World Health Organization (2018). What is malnutrition? Online Q&A: Available at: http://www.who.int/features/qa/malnutrition/en/, accessed on 31 May 2018.
4 World Health Organization (2018). The double burden of malnutrition. Policy Brief WHO/NMH/NHD/17.3. Available from: http://apps.who.int/iris/bitstream/handle/10665/255413/WHO-NMH-NHD-17.3-eng.pdf;jsessionid=5738568E45ABA50204C1E4E6760C325C?sequence=1
5 World Health Organization (2018). What is malnutrition? Online Q&A: Available at: http://www.who.int/features/qa/malnutrition/en/, accessed on 31 May 2018.
6 World Health Organization (2018). What is malnutrition? Online Q&A: Available at: http://www.who.int/features/qa/malnutrition/en/, accessed on 31 May 2018.
7 United Nations, Economic and Social Commission for Asia and the Pacific (2017). Statistical Database. Available from http://data.unescap.org/escap_stat/
8 World Health Organization (2017). LEVELS AND TRENDS IN CHILD MALNUTRITION: Available at: http://www.who.int/nutgrowthdb/jme_brochoure2017.pdf, accessed on 21 June 2018.
9 UNICEF (2015). Prevention and Treatment of Severe Acute Malnutrition in East Asia and the Pacific: Available at: https://www.unicef.org/eapro/UNICEF_EAPRO_SAM_consultation_2015_report.pdf, accessed on 21 June 2018.
10 World Health Organization Western Pacific Region (WHO- WPRO). Childhood Obesity. Available online at: http://www.wpro.who.int/nutrition_wpr/topics/childhood_obesity/en/
11 Official Records of the General Assembly, Forty-Fourth Session, document A/RES/44/25.
12 UNICEF (2015). UNICEF’s approach to scaling up nutrition: Available at: https://www.unicef.org/nutrition/files/Unicef_Nutrition_Strategy.pdf, accessed on 21 June 2018.
13 Scaling Up Nutrition (2015). Nutrition at the heart of the SDGs: Available at: http://docs.scalingupnutrition.org/wp-content/uploads/2016/06/Nutrition-at-the-heart-of-the-SDGs_001.jpg, accessed on 21 June 2018.
14 World Hunger (2015). World Child Hunger Facts, July 2015. Available from https://www.worldhunger.org/world-child-hunger-facts/
15 FAO, IFAD, UNICEF, WFP and WHO. 2017. The State of Food Security and Nutrition in the World 2017. Building Resilience for Peace and Food Security. Rome, 2017.
16 Gertler, Paul and others. Labor market returns to early childhood stimulation: A 20 year follow up to an experimental intervention in Jamaica. National Bureau of Economic Research, Vol. 344, No. 6187 (30 May 2014).
17 UNICEF (2014). Global Nutrition Report 2014. New York, 2014.
18 UNICEF (2017). Nutrition: The case for support. New York, 2017.
19 Galasso, Emanuela and Wagstaff Adam, 2016. The Economic Costs of Stunting and How to Reduce Them*. Policy Research Note, World Bank Group. 22 September 2016. PRN/17/05. Available online at: http://pubdocs.worldbank.org/en/536661487971403516/PRN05-March2017-Economic-Costs-of-Stunting.pdf
20 Ross J, Chen CM, He W, et al. Effects of malnutrition on economic productivity in China as estimated by PROFILES. Biomed Environ Sci, 2003; 16, 195-205.
21 ODI (2015). The rising cost of a healthy diet Changing relative prices of foods in high-income and emerging economies. Available at: https://www.odi.org/sites/odi.org.uk/files/odi-assets/publications-opinion-files/9579.pdf
22 World Bank (2018). World Development Indicators. Last updated 1 March 2018. Accessed on 5 April 2018 from: https://data.worldbank.org/indicator/SH.STA.STNT.ZS?name_desc=false&view=chart
23 FAO, IFAD, UNICEF, WFP and WHO. The State of Food Security and Nutrition in the World 2017. Building Resilience for Peace and Food Security. Rome, 2017.
24 World Health Organization (2017). LEVELS AND TRENDS IN CHILD MALNUTRITION: Available at: http://www.who.int/nutgrowthdb/jme_brochoure2017.pdf, accessed on 21 June 2018.
25 FAO, IFAD, UNICEF, WFP and WHO. The State of Food Security and Nutrition in the World 2017. Building Resilience for Peace and Food Security. Rome, 2017.
26 International Food Policy Research Institute (2004). WHY IS CHILD MALNUTRITION LOWER IN URBAN THAN RURAL AREAS? EVIDENCE FROM 36 DEVELOPING COUNTRIES. Available at: http://ageconsearch.umn.edu/bitstream/16441/1/fc040176.pdf, accessed on 22 June 2018.
27 Wamani et al. (2007). Boys are more stunted than girls in Sub-Saharan Africa: a meta-analysis of 16 demographic and health surveys. BMC Pediatrics 2007, 7:17.
28 Ikeda, Nayu et.al (2013). Determinants of reduced child stunting in Cambodia: analysis of pooled data from three Demographic and Health Surveys. Bulleting of the World Health Organization. Volume 91, Number 5, May 2013, 313-388.
29 Haddad, L.; Nisbett, N.; Barnett, I. and Valli, E. (2014) Maharashtra’s Child Stunting Declines: What is Driving Them? Findings of a Multidisciplinary Analysis, Brighton: IDS.
30 Aguayo, V. M., & Menon, P. (2016). Stop stunting: improving child feeding, women’s nutrition and household sanitation in South Asia. Maternal & Child Nutrition, 12(Suppl Suppl 1), 3–11. http://doi.org/10.1111/mcn.12283
31 Shorrocks, Anthony F. Decomposition procedures for distributional analysis: a unified framework based on the Shapley value. Journal of Economic Inequality, Vol. 11, No. 1 (December 2013).
32 Molbech, Anette, ed. The Indigenous World 2000/2001. Copenhagen, Denmark: Eks-Skolens Trykker, 2001. And Harris, Ricci and others. Effects of self-reported racial discrimination and deprivation on Maori health and inequalities in New Zealand: cross-sectional study. The Lancet, Vol. 367, No. 9527 (17 June 2006).
33 Asia Indigenous Peoples Pact. Situation of the right to health of indigenous peoples in Asia. Thailand, 2016.
34 UNICEF. Global Nutrition Report 2014. New York, 2014.
35 FAO, IFAD, UNICEF, WFP and WHO. The State of Food Security and Nutrition in the World 2017. Building Resilience for Peace and Food Security. Rome, 2017.
36 Food and Agricultural Organization of the United Nations. Nutrition-sensitive agriculture and food systems in practice Options for intervention. Rome, 2017.
37 United Nations General Assembly Resolution A/RES/71/313. Work of the Statistical Commission Pertaining to the 2030 Agenda for Sustainable Development. 10 July 2017.
38 Kelleher, John D., Mac Namee, Brian and D’Arcy, Aoife. Fundamentals of Machine Learning for Predictive Data Analytics: Algorithms, Worked Examples, and Case Studies. Cambridge, Massachusetts: The MIT Press, 2015.
39 Ferreira, F and Gignoux, J. (2011). The Measurement of Inequality of Opportunity: Theory and Application to Latin America. Review of Income and Wealth. International Association for Research in Income and Wealth.
40 European Bank for Reconstruction and Development. Transition Report 2016-17: Transition for All: Equal Opportunities in an Unequal World. London, 2017.
31

Inequality of Opportunity in Asia and the Pacific: Children’s Nutrition
Reducing inequality in all its forms is at the heart of the 2030 Agenda for Sustainable Development. This is emphasized in the stand-alone Goal 10 “Reduce inequality within and among countries” and in other Goals that call for universality and for “leaving no one behind”. Reducing inequality advances human rights and social justice and is fundamental for all three dimensions of sustainable development.
The ESCAP Inequality of Opportunity policy papers identify seven basic opportunities where inequality jeopardizes a person’s life prospects, namely: education; women’s access to health care; children’s nutrition; decent work; basic water and sanitation; access to clean energy; financial inclusion. Each of these opportunities are covered by specific commitments outlined in the 2030 Agenda for Sustainable Development and addressed in a separate thematic paper covering some 22 countries throughout Asia and the Pacific.
This paper on Inequality of Opportunity in Children’s Nutrition explores gaps between in-country groups in nutrition outcomes, as well as the extent to which these gaps have narrowed or widened over time. In addition to identifying the furthest behind, inequalities are also analysed to identify the relative contribution of each underlying circumstance. Ultimately, these findings are of direct use for generating discussion on transformations needed to reach the “furthest behind first” as pledged in the 2030 Agenda.
Visit our webpage at:
www.unescap.org/our-work/social-development