Embed Size (px)
Citation preview

https://doi.org/10.1177/0268580918760430
International Sociology2018, Vol. 33(3) 357 –385
© The Author(s) 2018Reprints and permissions:
sagepub.co.uk/journalsPermissions.navDOI: 10.1177/0268580918760430
journals.sagepub.com/home/iss
Poor and powerless: Economic and political inequality in cross-national perspective, 1981–2011
Wade M ColeDepartment of Sociology, University of Utah, USA
AbstractThe relationship between economic and political inequality has long concerned social scientists, but research remains limited in scope. Most studies focus on isolated cases, highly restricted subsamples, or subunits within countries. Using data for up to 136 countries between 1981 and 2011, this study analyzes whether and how income inequality affects the distribution of political power for, and respect for the civil liberties of, a society’s rich and poor people. When income inequality is high, do rich people command greater political power and enjoy stronger civil liberties than poor people do? To answer these questions, the study uses both pooled regression analyses and two-stage models with instrumental variables to identify causal effects. The results are decisive: income inequality is inimical to both political and civil equality. These findings hold for developed as well as developing countries and for democratic as well as nondemocratic countries.
KeywordsCivil liberties, endogeneity, income inequality, political equality
We must make our choice. We may have democracy, or we may have wealth concentrated in the hands of a few, but we can’t have both.
Louis D Brandeis1
Is income inequality compatible with democracy, or does the uneven distribution of eco-nomic resources undermine the political influence and civil liberties of ‘have-nots’ in a society? Louis Brandeis, who served on the US Supreme Court during the Great
Corresponding author:Wade M Cole, Department of Sociology, University of Utah, 380 S 1530 E, Room 301, Salt Lake City, UT 84112, USA. Email: [email protected]
760430 ISS0010.1177/0268580918760430International SociologyColeresearch-article2018
Article

358 International Sociology 33(3)
Depression, warned that democracy cannot be sustained in the face of rampant economic inequality. To what extent are his fears warranted today?
Research gives little reason for optimism. In the United States, government policies usually align with preferences held by the most affluent citizens, whereas the vast major-ity of Americans affect policy decisions very little or not at all (Gilens, 2012). Gilens (2012: 1) worries that the ‘ideal of political equality is perhaps impossible to fully achieve in the face of economic inequality.’ The US government, he concludes, resem-bles a plutocracy more than a democracy. Winters and Page (2009) concur, but substitute ‘oligarchy’ for ‘plutocracy.’ Sounding an equally ominous alarm, Bartels (2016: 32) warns that ‘escalating economic inequality poses a crucial challenge to America’s demo-cratic ideals.’
Income inequality appears to have a similar effect in other economically advanced democracies. Rosset et al. (2013) report that economic inequality reduces political repre-sentation for low-income people in their sample of 24 democracies. As income inequality increases, ‘governments represent the middle- and especially the high-income group best’ (p. 825). Focusing on a similar set of 22 countries, Solt (2008) links income inequality to lower levels of self-reported political interest, political discussion, and electoral participa-tion, especially for low-income individuals. He suggests that, ‘because it increases the rela-tive power of richer citizens, economic inequality undermines political equality’ (p. 57).
Such findings comport with relative power theory, which views money as a political resource that can be used to influence powerholders or to exercise power directly. According to this theory, as the rich grow richer, their power and influence relative to the poor will also increase (Goodin and Dryzek, 1980; Solt, 2008). Contending theories expect economic inequality to elevate political engagement among poor people and hence magnify their influence. In this view, relative deprivation spurs the poor into action and compels powerholders to take notice (e.g., Meltzer and Richard, 1981). Still others invert the causal arrow between economic and political inequality, arguing that the latter produces changes in the former. A long line of theorizing reasons that political elites use their power to capture an ever-larger share of economic resources for themselves (e.g., Mills, 1956).
Despite widespread interest in these questions, research is limited by an intensive focus on single cases (typically the United States), a handful of countries (usually highly developed democracies), or subunits with countries (such as municipalities or states). These limitations hamper our ability to understand whether or how the distribution of income shapes access to political power or respect for civil liberties.
One thing is clear: within-country income inequality has grown appreciably in recent decades (Alderson and Nielsen, 2002; Goesling, 2001). Using data for up to 136 coun-tries between 1981 and 2011, I analyze the consequences of income inequality for the distribution of political power and respect for civil liberties by socioeconomic position. When income inequality is high, do rich people command greater political power and enjoy stronger civil liberties than poor people do? I conclude that they do. These effects, moreover, are often strongest in high-income and democratic countries – the very nations for which legal and political equality should be the strongest.
My analysis improves upon existing work in three respects. First, it greatly expands the number and type of countries under investigation. Rather than limit my focus to a

Cole 359
couple of dozen affluent democracies, my sample includes well over a hundred economi-cally and politically diverse nation-states. Second and related, it considers whether the relationship between economic and political inequality varies by economic development and regime type. Because most studies focus on economically advanced and highly dem-ocratic countries, we do not know whether patterns differ in rich and poor societies or in democratic and authoritarian polities. Finally, using two-stage regression models with instrumental variables, my analysis identifies the causal effect of economic inequality on civil and political inequality.
The relationship between economic and political inequality
Theories differ as to the causal ordering and polarity of the relationship between eco-nomic and political inequality. For some theorists, economic inequality shapes the distri-bution of political access and influence in a society, whereas others invert this relationship. These two processes are not necessarily mutually exclusive; rather, the difference is a matter of theoretical emphasis. Theorists who accord causal primacy to economic ine-quality nevertheless debate the polarity of the relationship. Does economic inequality generate or mitigate political inequality? I address these questions in turn.
The core premise: Economic inequality generates political inequality
The core theoretical premise animating my analysis holds that income inequality concen-trates political power in the hands of rich people and diminishes respect for poor people’s civil liberties (Solt, 2008). This premise assumes that income is useful in gaining access to, exercising, or otherwise influencing power. As Mills (1956: 162) put it, ‘Money pro-vides power and power provides freedom.’
Affluent individuals and groups use their economic resources to wield political influ-ence in myriad ways. They lobby or bribe government officials, contribute to political campaigns, underwrite policy-planning foundations and think tanks, and subsidize media outlets (Clawson, 2009; Domhoff, 2006). Economic resources also shape political engagement. Compared with their less-affluent counterparts, prosperous citizens are more likely to discuss politics, vote, affiliate with political organizations, and attend protest demonstrations (Gilens, 2012; Gilens and Page, 2014).
According to relative power theorists, these trends reflect subjective assessments of political efficacy (Goodin and Dryzek, 1980). In this view, people engage in politics when they perceive their chances of success to be reasonably high – that their partici-pation will contribute to a favored policy reform, electoral outcome, regime change, or so on. If they believe their chances of success to be low, people will rationally abstain from participating.
Relative power theorists argue that one’s relative economic power is an important indicator of political efficacy, based on the notion that ‘the relatively poor cannot hope to compete with the influence of the relatively rich’ (Goodin and Dryzek, 1980: 286). Given their disproportionate control of a society’s economic resources, rich people are confi-dent in their ability to win political contests. Conversely, poor people’s slim prospects for success discourage them from getting involved. By the same token, the theory holds that
360 International Sociology 33(3)
‘under conditions of approximate social equality, people should participate more fully in politics’ (Goodin and Dryzek, 1980: 286), because the likelihood of political success is also equal. Thus, relative power theory posits a direct causal relationship running from economic inequality to political inequality.
It might be conjectured that poor people could become a stronger political force by pooling their resources. However, it is presumably easier for a small elite to organize than for the poor masses to mobilize. Elites in a variety of domains – economic, political, and social – have become increasingly concentrated, centralized, and interlocked, ena-bling them to coordinate on behalf of their shared policy interests. The masses, in con-trast, remain more fragmented and disorganized, putting them at a distinct political disadvantage (Mills, 1956). The upshot is that ‘the poor have very little political power’ because their lack of resources renders them ‘politically invisible’ (Brady, 2009: 95–97).
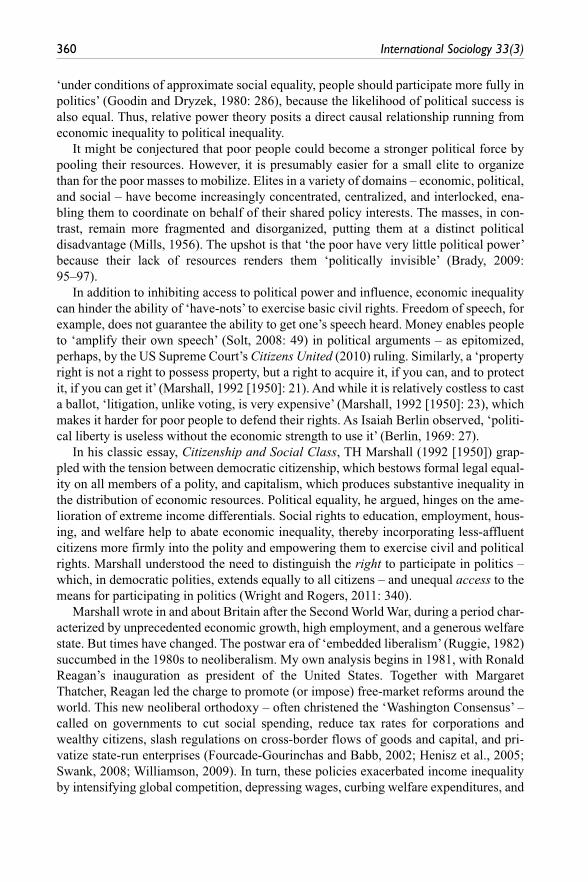
In addition to inhibiting access to political power and influence, economic inequality can hinder the ability of ‘have-nots’ to exercise basic civil rights. Freedom of speech, for example, does not guarantee the ability to get one’s speech heard. Money enables people to ‘amplify their own speech’ (Solt, 2008: 49) in political arguments – as epitomized, perhaps, by the US Supreme Court’s Citizens United (2010) ruling. Similarly, a ‘property right is not a right to possess property, but a right to acquire it, if you can, and to protect it, if you can get it’ (Marshall, 1992 [1950]: 21). And while it is relatively costless to cast a ballot, ‘litigation, unlike voting, is very expensive’ (Marshall, 1992 [1950]: 23), which makes it harder for poor people to defend their rights. As Isaiah Berlin observed, ‘politi-cal liberty is useless without the economic strength to use it’ (Berlin, 1969: 27).
In his classic essay, Citizenship and Social Class, TH Marshall (1992 [1950]) grap-pled with the tension between democratic citizenship, which bestows formal legal equal-ity on all members of a polity, and capitalism, which produces substantive inequality in the distribution of economic resources. Political equality, he argued, hinges on the ame-lioration of extreme income differentials. Social rights to education, employment, hous-ing, and welfare help to abate economic inequality, thereby incorporating less-affluent citizens more firmly into the polity and empowering them to exercise civil and political rights. Marshall understood the need to distinguish the right to participate in politics – which, in democratic polities, extends equally to all citizens – and unequal access to the means for participating in politics (Wright and Rogers, 2011: 340).
Marshall wrote in and about Britain after the Second World War, during a period char-acterized by unprecedented economic growth, high employment, and a generous welfare state. But times have changed. The postwar era of ‘embedded liberalism’ (Ruggie, 1982) succumbed in the 1980s to neoliberalism. My own analysis begins in 1981, with Ronald Reagan’s inauguration as president of the United States. Together with Margaret Thatcher, Reagan led the charge to promote (or impose) free-market reforms around the world. This new neoliberal orthodoxy – often christened the ‘Washington Consensus’ – called on governments to cut social spending, reduce tax rates for corporations and wealthy citizens, slash regulations on cross-border flows of goods and capital, and pri-vatize state-run enterprises (Fourcade-Gourinchas and Babb, 2002; Henisz et al., 2005; Swank, 2008; Williamson, 2009). In turn, these policies exacerbated income inequality by intensifying global competition, depressing wages, curbing welfare expenditures, and
Cole 361
diminishing the power of labor relative to capital (Alderson and Nielsen, 1999; Moller et al., 2003; Rudra, 2008).
If relative power theorists are correct, this upswing in income inequality will lead to increased civil and political stratification in societies, negatively affecting the distribu-tion of political power and respect for civil liberties between rich and poor citizens.
The obverse relationship: Political inequality generates economic inequality
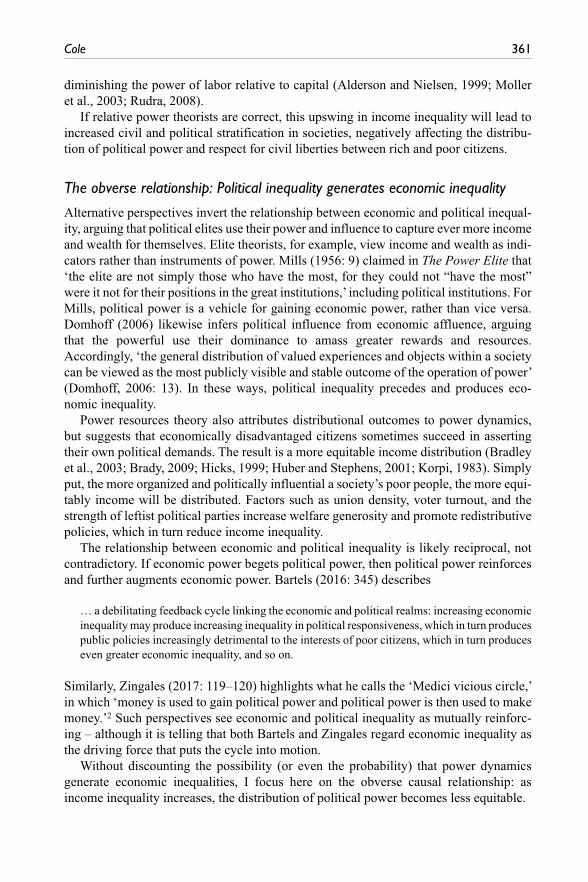
Alternative perspectives invert the relationship between economic and political inequal-ity, arguing that political elites use their power and influence to capture ever more income and wealth for themselves. Elite theorists, for example, view income and wealth as indi-cators rather than instruments of power. Mills (1956: 9) claimed in The Power Elite that ‘the elite are not simply those who have the most, for they could not “have the most” were it not for their positions in the great institutions,’ including political institutions. For Mills, political power is a vehicle for gaining economic power, rather than vice versa. Domhoff (2006) likewise infers political influence from economic affluence, arguing that the powerful use their dominance to amass greater rewards and resources. Accordingly, ‘the general distribution of valued experiences and objects within a society can be viewed as the most publicly visible and stable outcome of the operation of power’ (Domhoff, 2006: 13). In these ways, political inequality precedes and produces eco-nomic inequality.
Power resources theory also attributes distributional outcomes to power dynamics, but suggests that economically disadvantaged citizens sometimes succeed in asserting their own political demands. The result is a more equitable income distribution (Bradley et al., 2003; Brady, 2009; Hicks, 1999; Huber and Stephens, 2001; Korpi, 1983). Simply put, the more organized and politically influential a society’s poor people, the more equi-tably income will be distributed. Factors such as union density, voter turnout, and the strength of leftist political parties increase welfare generosity and promote redistributive policies, which in turn reduce income inequality.
The relationship between economic and political inequality is likely reciprocal, not contradictory. If economic power begets political power, then political power reinforces and further augments economic power. Bartels (2016: 345) describes
… a debilitating feedback cycle linking the economic and political realms: increasing economic inequality may produce increasing inequality in political responsiveness, which in turn produces public policies increasingly detrimental to the interests of poor citizens, which in turn produces even greater economic inequality, and so on.
Similarly, Zingales (2017: 119–120) highlights what he calls the ‘Medici vicious circle,’ in which ‘money is used to gain political power and political power is then used to make money.’2 Such perspectives see economic and political inequality as mutually reinforc-ing – although it is telling that both Bartels and Zingales regard economic inequality as the driving force that puts the cycle into motion.
Without discounting the possibility (or even the probability) that power dynamics generate economic inequalities, I focus here on the obverse causal relationship: as income inequality increases, the distribution of political power becomes less equitable.

362 International Sociology 33(3)
Reversing the polarity: Economic inequality reduces political inequality
Conflict theorists agree with relative power theorists that economic inequality is a causal driver of political outcomes, but they argue that inequality will result in a more equitable distribution of political engagement, influence, and power. For them, the more unequal the distribution of income in a society, the more politically active citizens on each end of the income distribution will be.
According to conflict-based approaches, rich and poor people hold incompatible pref-erences that galvanize them into political action. As the economic gulf between rich and poor widens, their political preferences also diverge. Poor people grow increasingly stri-dent in their demands for redistribution, while affluent citizens just as vociferously oppose those demands. Because the poor greatly outnumber the rich, conflict theorists expect poor people to have a louder voice, more representation, and greater influence in politics – at least in majoritarian systems, where self-interested politicians cater to the policy pref-erences of the poor in their own efforts to win elections (Meltzer and Richard, 1981).
A variant of this thesis contends that income inequality advances political equality not through the ballot box, but via the threat of rebellion and revolution (Acemoglu and Robinson, 2000, 2006; Przeworski, 2009). Economic inequality represents a major grievance that triggers social and political unrest among the poor. In a strategic bid to preempt or mitigate unrest, elites concede greater political influence to poor people – by removing property qualifications to the suffrage, for example – despite realizing that it will intensify demands for redistribution. There is, however, an important return on this costly investment: once incorporated (or coopted) into the mainstream polity, the poor abandon their insurrectionary tactics. As Proudhon once quipped, universal suffrage is a counter-revolutionary measure. Elites, in essence, decide that redistribution is more pal-atable than revolution.
In brief, conflict-based perspectives agree as to the causal ordering of the relationship I evaluate – that economic inequality generates political outcomes – but they reverse the polarity of the relationship. As such, they offer an alternative hypothesis to be tested: income inequality will result in lower levels of civil and political stratification, positively affecting the distribution of political power and respect for civil liberties between rich and poor citizens. The implied null hypothesis is that income inequality is not systemati-cally associated with civil and political inequality.
Limits of previous research
Despite long-standing interest in the relationship between economic inequality and polit-ical power, the causal nature and polarity of the association remains unsettled. One rea-son is the tendency to focus on one country (typically, the United States) or a highly restricted subsample of countries (usually, economically advanced democracies). Acemoglu et al. (2008: 183) recognized this limitation: ‘Even though it is typically asserted that economic and political inequality go hand in hand . . . this is not necessarily so everywhere in the world.’ They point to several countries in sub-Saharan Africa and East Asia that couple low levels of income inequality with ‘severe’ political inequality, as well as to cases such as Mauritius in which citizens enjoy relative political equality

Cole 363
despite rampant income inequality. Their own analysis of municipalities in late-nine-teenth-century Cundinamarca, a department of Colombia, established an inverse associa-tion between economic and political concentration. As inequality in land ownership increased, monopolization of political officeholding decreased. ‘Politics,’ they con-cluded, ‘was a career open to people of many backgrounds,’ regardless of income (Acemoglu et al., 2008: 186).
A related limitation is the paucity of research investigating whether political or eco-nomic factors condition the relationship between different forms of inequality. Do demo-cratic institutions mitigate the otherwise negative consequences of income inequality for political equality, as Marshall (1992 [1950]) hoped, or is the recent burst of scholarship lamenting the plutocratic tendencies of democracy (Bartels, 2016; Gilens, 2012; Winters and Page, 2009) more accurate? Do relative levels of income inequality affect political outcomes differently in countries with markedly disparate absolute incomes? Perhaps the same degree of income inequality poses a greater threat to political equality in poorer nations than it does in countries with higher aggregate incomes. Is it better, politically speaking, to be poor in a rich society? Or, as Nobel laureate Angus Deaton recently argued (Lowrey, 2017), might it be better to live in a poor village in India than in a trailer park in the Mississippi Delta or suburban Milwaukee?
I address these issues by analyzing the effect of income inequality on measures of political and civil equality for a large sample of countries, using estimators designed to establish causal directionality.
Materials and methods
My sample comprises 133 or 136 countries, depending on data availability for the out-comes of interest. Table A1 in the Appendix lists these countries. The observation period runs from 1981 to 2011, but the panels are unbalanced (i.e., countries do not always contribute observations for the entire 30-year period; the average record length per coun-try is 19.4 years). Descriptive statistics for all variables in the analysis appear in Table A2 in the Appendix.
Dependent variables: Political and civil inequality
To measure political and civil equality, I use two variables from the Varieties of Democracy database (Coppedge et al., 2017) that rely on country experts to assess the distribution of political power and respect for civil liberties by socioeconomic position.
The distribution of power by socioeconomic position considers whether economic inequality inhibits access to political power. Political power refers to active participation in politics (e.g., voting), representation in government, the ability to set political agen-das, and the ability to influence and implement political decisions. The original index underlying this measure comprises five ordered categories indicating whether rich peo-ple enjoy (1) a virtual monopoly on political power, (2) a dominant hold on political power, (3) a very strong hold on political power, (4) more political power than others, or (5) no more political power than poor people.

364 International Sociology 33(3)
Another variable, respect for civil liberties by socioeconomic position, ascertains whether poor people enjoy the same level of civil liberties as rich people.3 Civil liberties include access to justice, property rights, freedom of movement, and freedom from forced labor. The original index comprises five ordered categories indicating whether poor people enjoy (1) much fewer, (2) substantially fewer, (3) moderately fewer, (4) slightly fewer, or (5) the same level of civil liberties compared to rich people.
The researchers who compiled these data converted each ordinal index into an inter-val variable using a Bayesian item response theory measurement model (Coppedge et al., 2017; Pemstein et al., 2015). This conversion not only facilitates statistical analysis by generating variables suitable for linear estimators, it also addresses key measurement issues. Analysts have long noted that expert-based ratings of democracy are subject to biases (Bollen, 1980; Bollen and Paxton, 1998). Item response theory mitigates these biases by ‘treating coders’ ordinal ratings as imperfect reflections of interval-level latent concepts’ and ‘allow[ing] for the possibility that coders have different thresholds for their ratings’ (Coppedge et al., 2017: 26). Moreover, it ‘allow[s] for the possibility that coders will make non-systematic mistakes’ (Pemstein et al., 2015: 3) and ‘produce[s] estimates of rater precision’ that can be used ‘to quantify confidence in reported scores’ (Coppedge et al., 2017: 26). The Varieties of Democracy database includes low and high estimates for each set of interval-level scores. Supplementary analyses using these esti-mates (not reported but available upon request) produced results for the effect of income inequality that are similar in sign, size, and significance to those reported herein.
The political and civil equality scores lack a readily interpretable metric, so I stand-ardize each to have a mean of 0 and standard deviation of 1, with higher scores corre-sponding to greater equality in the distribution of power or respect for civil liberties between rich and poor people. Table 1 lists countries located at the top and bottom of the sample distribution for both variables, based on scores averaged over time. For refer-ence, the table also reports rankings and scores for the United States. Nordic countries score highly on both measures, with Sweden topping each list. European countries are overrepresented among the top performers, although nations such as Niger, Burundi, Argentina, and New Zealand also perform well, particularly for the distribution of politi-cal power. Countries falling toward the bottom of the distribution for each outcome are strewn across sub-Saharan Africa, the Middle East and Maghreb, Latin America, Southeast Asia, and the former Soviet Union. The United States scores better on the civil liberties measure (placed 27th out of 133) than on the political power variable (59th out of 136).
Independent variable: Economic inequality
Income inequality, expressed as Gini coefficients, constitutes the core independent vari-able in my analysis. This variable measures inequality in disposable household income after accounting for taxes and transfers (i.e., ‘net’ income). It comes from Solt’s (2009) Standardized World Income Inequality Database, which systematizes income distribu-tion data across countries over time.
Gini coefficients range from 0 to 100. A score of zero would denote that income is distributed evenly across a country’s population, with larger values indicating that

Cole 365
income is concentrated in a progressively smaller share of the population. Gini coeffi-cients in the study sample range from 15.4 (Mauritius in 2002) to 75.3 (Indonesia in 2000), with a global mean of 38.8 (SD = 10.2).
It is commonly alleged that the Gini index is most sensitive to transfers in the mid-dle of the income distribution, but some analysts challenge this claim. According to Gastwirth (2017: 9), ‘the criticism that [the Gini index] gives undue weight to changes in the middle of the distribution is inaccurate.’ Although the matter continues to be debated, the Gini index remains a widely used and comprehensive measure of income inequality in cross-national longitudinal research. For the sake of continuity and com-parability, I use it as well.
Control variables
The analyses include control variables pertaining to economic development and depend-ency, political conditions, and world society embeddedness. Gross domestic product (GDP) per capita is a proxy for overall level of economic development. It is rendered in constant 2005 US dollars and logged to reduce skew (World Bank, 2013).
There are three measures of economic dependence. Structural conditionalities tallies the number of mandated policy reforms imposed on recipients of International Monetary Fund (IMF) loans (Kentikelenis et al., 2016).4 Conditionalities are typically market-ori-ented reforms that require borrowing countries to privatize state-owned enterprises, deregulate labor markets, restructure tax systems, and reduce trade barriers. Such poli-cies have been shown to exacerbate income inequality (Oberdabernig, 2013; Vreeland, 2002), but research finds inconsistent effects on sociopolitical outcomes. Abouharb and Cingranelli (2007) conclude that basic human rights and workers’ rights conditions worsen in countries under IMF programs, even while respect for civil and political rights improves. In contrast, Brown (2009) finds that conditional IMF lending reduced civil and political liberties in Latin American countries.
Other dependency variables include exports (exports of goods and services as a per-centage of GDP) and foreign investment (inward stock of foreign direct investment [FDI] as a percentage of GDP), taken respectively from the World Bank (2013) and United Nations (2013). Income inequality is linked to dependence on foreign capital (Alderson and Nielsen, 1999; Mahutga and Bandelj, 2008), but the effects of trade open-ness are less robust. Sometimes, trade openness appears to reduce inequality (Reuveny and Li, 2003); other times, it seems to magnify it (Huber and Stephens, 2012). A coun-try’s level of economic development or location in the ‘world-system’ appears to condi-tion these effects (e.g., Balaev, 2009). Either way, it is necessary to control for it.
Three variables tap political conditions in a country. First, I gauge the degree of democracy using the revised polity score from the Polity IV database (Marshall et al., 2013). This score, which ranges from −10 (least democratic) to +10 (most democratic), indexes the competitiveness and openness of executive recruitment; the competitiveness and regulation of political participation; and the degree to which legislatures, courts, or other ‘accountability groups’ constrain the decision-making power of chief executives.
Democracy influences the distribution of power as well as income. Although democ-racy has an ‘equalizing effect’ by ‘extending political power to poorer segments of

366 International Sociology 33(3)
society’ (Acemoglu et al., 2015: 1890), rarely do rich and poor citizens enjoy equal access to power, even in democracies. Democratic institutions nevertheless afford trade unions, leftist parties, and other poor-friendly interest groups the opportunity to shape policy, leading Huber and Stephens (2012: 3) to conclude that ‘democracy is one of the most important determinants of redistributive social policy.’ Indeed, some studies show that democracy reduces income inequality (Muller, 1988; Reuveny and Li, 2003; Simpson, 1990).
Table 1. Sampled countries with the highest and lowest average political and civil equality scores.
Distribution of political power by socioeconomic position
Respect for civil liberties by socioeconomic position
Country Score Country Score
1. Sweden 1.91 1. Sweden 1.902. Norway 1.78 2. Finland 1.723. Netherlands 1.74 3. Norway 1.554. Finland 1.72 4. New Zealand 1.555. Belgium 1.68 5. Denmark 1.546. Slovenia 1.65 6. Spain 1.517. Denmark 1.62 7. Switzerland 1.458. Niger 1.54 8. Estonia 1.339. Spain 1.48 9. Austria 1.3210. Burundi 1.48 10. Lithuania 1.2811. Argentina 1.23 11. Iceland 1.2612. Canada 1.18 12. Italy 1.19...
.
.
.
.
.
.
.
.
.59. United States 0.12 27. United States 0.82...
.
.
.
.
.
.
.
.
.125. Djibouti −1.33 122. Honduras −1.38126. Congo, Republic of −1.34 123. Laos −1.39127. Kazakhstan −1.38 124. Nigeria −1.39128. Morocco −1.58 125. Mauritania −1.57129. Ukraine −1.62 126. Madagascar −1.64130. Lebanon −1.70 127. Thailand −1.74131. Cambodia −1.82 128. El Salvador −1.77132. Azerbaijan −2.04 129. Uzbekistan −1.77133. Chad −2.05 130. Sierra Leone −1.85134. Uzbekistan −2.14 131. Ukraine −1.86135. Honduras −2.14 132. Angola −1.99136. Egypt −2.16 133. Cambodia −2.39

Cole 367
A second political variable, left government, is an indicator from the Database of Political Institutions denoting whether the largest government party is leftist in orienta-tion (Cruz et al., 2016). Leftist parties include those defined as communist, socialist, or social democratic. The omitted reference group comprises parties defined as centrist, conservative, Christian democratic, right-wing, and so on. Left-leaning political parties are more likely to redistribute income and alleviate poverty through progressive taxation, welfare spending, minimum wage laws, and the like (Bradley et al., 2003; Brady et al., 2005; Hicks and Misra, 1993; Moller et al., 2003). Left partisanship may also be associ-ated with a stronger ideological commitment to distributing political power and civil liberties evenly across citizens irrespective of socioeconomic position.
The third political control variable is an index of workers’ rights from the Cingranelli–Richards (CIRI) Human Rights Dataset (Cingranelli et al., 2014). This index measures the extent to which countries honor the freedom of association, respect the right to bar-gain collectively, and enact laws regarding minimum wages, work hours, and occupa-tional safety. A score of 2 indicates that these rights are fully protected; 1, somewhat restricted; and 0, severely restricted. Political influence for workers is an indirect meas-ure of political equality that often translates into lower income inequality (Bradley et al., 2003; Hicks, 1999; Korpi and Palme, 2003).
A pair of variables tap integration into world society. The number of linkages a coun-try has to international nongovernmental organizations (INGOs) correlates with better human rights practices (Hafner-Burton and Tsutsui, 2005). I consider whether INGO linkages, defined as the total number of INGOs that count at least one citizen or domestic organization as a member, also promote civil and political equality. This variable, coded from yearbooks produced by the Union of International Associations (various years), is logged after adding a constant of 1 to reduce skew. A second variable is an indicator coded 1 after a country ratifies the International Covenant on Economic, Social, and Cultural Rights (party to the ICESCR), the only United Nations human rights treaty dedi-cated specifically to social and economic rights.
Estimators
I seek to estimate the causal effect of income inequality on the distribution of political power and respect for civil liberties by socioeconomic position. As previously discussed, however, some theoretical perspectives assume that causality runs in the opposite direc-tion, from political and civil inequality to income inequality. Given this concern, I esti-mate two-stage regression models by limited information maximum likelihood (LIML), using instrumental variables to identify the causal effect of income inequality (Schaffer, 2010). Compared with conventional two-stage least-squares estimators, LIML is less biased and more efficient, and it performs better in the presence of weak instruments (Angrist and Pischke, 2009; Stock and Yogo, 2005). Nevertheless, standard ordinary least-square (OLS) estimates are more efficient and less biased than those obtained using instrumental variables, so they are preferred when diagnostic tests show endogeneity bias not to be present.
I base all significance tests on Driscoll–Kraay standard errors, which are robust to both heteroskedasticity and autocorrelation (Driscoll and Kraay, 1998; Newey and West,

368 International Sociology 33(3)
1994). I also lag independent and control variables by one year relative to political and civil equality scores.
Results
Table 2 presents regression models analyzing the distribution of political power (Models 1 to 3) and respect for civil liberties (Models 4 to 6) by socioeconomic position. The first model for each outcome (Models 1 and 4) is estimated by LIML, using instrumental vari-ables to identify the causal effect of income inequality. The second models (Models 2 and 5) are estimated by OLS; these results are preferred to the corresponding LIML estimates when endogeneity is not present. The final models (Models 3 and 6), also esti-mated by OLS, remove income inequality to assess its explanatory power and impact on other factors in the analysis.
Political equality: Distribution of power by socioeconomic position
Model 1 uses instrumental variables to estimate the causal effect of income inequality on the distribution of political power by socioeconomic position. I selected three instru-ments for income inequality: the percentage of the population younger than 15 years of age, the percentage of the population 65 and older, and the infant mortality rate, defined as the number infants who die by age one per 1000 live births. All else being equal, ‘high proportions of young or elderly people in the population means greater inequality’ (Gustafsson and Johansson, 1999: 588; see also Bollen and Jackman, 1985; Simpson, 1990). The infant mortality rate, for its part, is often used as a proxy for poverty (Ross, 2006) and is linked to income inequality in cross-national research (Avendano, 2012; Lobmayer and Wilkinson, 2000). All three variables come from the World Development Indicators database (World Bank, 2013).
The LIML estimates are only as good as these instruments. Before considering the substantive results, we must therefore assess whether the instruments are sufficiently correlated with income inequality and uncorrelated with the error term of the structural equation for political equality. The first condition, relevance, can be observed directly, whereas the second condition, exogeneity, must be inferred because the error term is unobserved.
Diagnostic tests reported in the bottom rows of Table 2 confirm the relevancy and strength of the instruments for income inequality. The underidentification test evaluates the null hypothesis of zero correlation between the set of excluded instruments and the endogenous variable. The weak identification test then gauges whether this correlation, even if non-zero, is weak; rejection suggests that the instruments are strong.5 Each test indicates that the instruments are relevant and strongly correlated with income inequal-ity. A third diagnostic infers whether the selected instruments are exogenous. The overi-dentification test considers whether the instruments are uncorrelated with the error term in the structural equation of political equality scores and hence correctly excluded from it. This test fails to reject the null hypothesis, inspiring confidence that the instruments are exogenous as well as relevant.
Cole 369
Finally, a Hausman-like endogeneity test evaluates whether income inequality is endogenous to political equality. Under the null hypothesis, endogeneity bias is not pre-sent, such that income inequality can be treated as exogenous. Once again, failure to reject the null means that the corresponding OLS estimates are preferred. This test indi-cates that income inequality is exogenous to political equality (p = .14).6
We can now turn to the substantive findings. Model 1, estimated by LIML with instru-mental variables, suggests that a 1-point increase in income inequality reduces political equality scores by .046 standard deviations, holding other variables in the analysis con-stant. Model 2, estimated by OLS, points to a smaller reduction of .023. Although the OLS estimate is half the size of the corresponding LIML coefficient, it is more precise and preferred by the endogeneity diagnostics. The top panel of Figure 1 uses both sets of results to plot the estimated effect of income inequality on political equality scores, hold-ing control variables constant at their mean values and allowing income inequality to vary from its 10th to 90th percentiles. Both trends clearly demonstrate that countries with high levels of income inequality distribute political power unevenly by socioeconomic position. In other words, as income inequality increases, rich people enjoy greater access to political power than poor people do.
These findings lend considerable support to relative power theory, which predicts that economic inequality will result in greater levels of political stratification. Although the analysis does not rule out the possibility that political inequality in turn further exacerbates the unequal distribution of economic resources, it does offer compelling evidence that income inequality shapes the distribution of political power. Conflict perspectives, which posit that economic inequality reduces political inequality, find no support in this analysis.
Apart from the negative effect of income inequality, loan conditionalities are also associated with the uneven distribution of political power. Only political factors have an equalizing effect. Democracy, strong workers’ rights protections, and (in the OLS model) left partisan control of government are all associated with higher political equality scores.
Model 3 assesses the relative impact of income inequality by removing it from the analysis. When income inequality is not considered, the estimate on GDP per capita becomes statistically significant for the first time. Political power is distributed more evenly in wealthier countries than in poorer countries, but income inequality over-whelms this relationship. Removing income inequality also substantially reduces the explanatory power of the model, dropping the R-squared value from .425 in Model 2 to .392 in Model 3. The relationship between income inequality and political equality is clearly quite strong.
Civil equality: Respect for civil liberties by socioeconomic position
Models 4 to 6 analyze the effect of income inequality on respect for civil liberties by socioeconomic position. Selected instruments for income inequality in the LIML model include the percentage of the population younger than 15, infant mortality rate, and the annual percentage change in the share of a country’s population living in urban areas (World Bank, 2013). Diagnostic tests show these instruments to be relevant (i.e., they are statistically significant and strong predictors of income inequality) as well as exogenous

370 International Sociology 33(3)
Tab
le 2
. A
sses
sing
the
cau
sal e
ffect
of i
ncom
e in
equa
lity
on p
oliti
cal a
nd c
ivil
equa
lity,
198
1–20
11.
Dep
ende
nt v
aria
bles
D
istr
ibut
ion
of p
ower
by
soci
oeco
nom
ic
posi
tion
Res
pect
for
civi
l lib
ertie
s by
soc
ioec
onom
ic
posi
tion
M
odel
1(L
IML-
IV)
Mod
el 2
(OLS
)M
odel
3(O
LS)
Mod
el 4
(LIM
L-IV
)M
odel
5(O
LS)
Mod
el 6
(OLS
)
Inco
me
ineq
ualit
y (n
et G
ini)
−.0
46**
−.0
23**
*−
.048
**−
.032
***
(.017
)(.0
07)
(.016
)(.0
05)
G
DP
per
capi
ta (
ln)
−.0
67.0
28.1
20*
.167
*.2
29**
*.3
58**
*
(.091
)(.0
56)
(.057
)(.0
81)
(.043
)(.0
49)
IMF
stru
ctur
al c
ondi
tiona
litie
s−
.011
**−
.008
**−
.004
.001
.003
.008
*
(.004
)(.0
03)
(.003
)(.0
04)
(.003
)(.0
04)
Expo
rts
(% G
DP)
−.0
01−
.000
.001
−.0
03−
.002
−.0
01
(.004
)(.0
03)
(.003
)(.0
03)
(.002
)(.0
03)
FDI s
tock
(%
GD
P).0
00−
.001
−.0
02.0
02.0
02.0
00
(.002
)(.0
01)
(.002
)(.0
02)
(.001
)(.0
01)
Dem
ocra
cy s
core
.054
***
.047
***
.041
***
.017
.013
.005
(.0
15)
(.010
)(.0
10)
(.012
)(.0
08)
(.007
)Le
ft g
over
nmen
t (1
= y
es)
.165
.199
**.2
32**
.070
.089
.130
*
(.092
)(.0
69)
(.090
)(.0
71)
(.048
)(.0
59)
Wor
kers
’ rig
hts
som
ewha
t re
stri
cted
.0
87(.0
96)
.104
(.053
).1
20(.0
71)
.175
(.092
).1
83*
(.089
).2
00(.1
09)
Wor
kers
’ rig
hts
fully
pro
tect
ed.3
33*
.420
***
.505
***
.308
*.3
58**
.461
***
(.1
41)
(.097
)(.1
13)
(.124
)(.1
22)
(.139
)IN
GO
link
ages
(ln
).1
09.0
97.0
85.0
43.0
32.0
10
(.088
)(.0
77)
(.077
)(.0
54)
(.038
)(.0
42)

Cole 371
Dep
ende
nt v
aria
bles
D
istr
ibut
ion
of p
ower
by
soci
oeco
nom
ic
posi
tion
Res
pect
for
civi
l lib
ertie
s by
soc
ioec
onom
ic
posi
tion
M
odel
1(L
IML-
IV)
Mod
el 2
(OLS
)M
odel
3(O
LS)
Mod
el 4
(LIM
L-IV
)M
odel
5(O
LS)
Mod
el 6
(OLS
)
Part
y to
ICES
CR
−.0
25.0
88.1
96.1
03.1
82.3
46**
(.1
57)
(.115
)(.1
15)
(.138
)(.1
23)
(.129
)C
onst
ant
1.26
6−
.479
−2.
162*
**−
.112
−1.
240*
*−
3.57
2***
(1
.299
)(.5
59)
(.445
)(1
.141
)(.3
79)
(.442
)F
14.2
9***
18.2
7***
22.6
8***
32.2
9***
76.2
9***
64.6
1***
df11
1110
1111
10R-
squa
red
.389
.425
.392
.588
.603
.538
N c
ount
ry-y
ears
/ co
untr
ies
2640
/ 13
626
40 /
136
2640
/ 13
625
54 /
133
2554
/ 13
325
54 /
133
Und
erid
entif
icat
ion
test
(p
valu
e)a
15.2
8 (.0
0)14
.04
(.00)
W
eak
iden
tific
atio
n te
stb
20.8
315
.61
O
veri
dent
ifica
tion
test
(p
valu
e)c
3.29
(.1
9)2.
49 (
.29)
En
doge
neity
tes
t (p
val
ue)d
2.15
(.1
4).9
2 (.3
4)
*p <
.05,
**
p <
.01,
***
p <
.001
(tw
o-ta
iled)
.D
risc
oll–
Kra
ay s
tand
ard
erro
rs, r
obus
t to
het
eros
keda
stic
ity a
nd a
utoc
orre
latio
n, in
par
enth
eses
.LI
ML
= li
mite
d in
form
atio
n m
axim
um li
kelih
ood
with
inst
rum
enta
l var
iabl
es; O
LS =
ord
inar
y le
ast-
squa
res;
GD
P =
gro
ss d
omes
tic p
rodu
ct; I
MF
= In
tern
atio
nal M
on-
etar
y Fu
nd; I
NG
O =
inte
rnat
iona
l non
gove
rnm
enta
l org
aniz
atio
n; IC
ESC
R =
Inte
rnat
iona
l Cov
enan
t on
Eco
nom
ic, S
ocia
l, an
d C
ultu
ral R
ight
s.a K
leib
erge
n–Pa
ap r
k LM
sta
tistic
– H
0: ex
clud
ed in
stru
men
ts a
re n
ot c
orre
late
d w
ith t
he s
uspe
cted
end
ogen
ous
regr
esso
r.b K
leib
erge
n–Pa
ap r
k W
ald
F st
atis
tic –
H0:
equa
tion
is w
eakl
y id
entif
ied,
i.e.
, the
inst
rum
ents
are
onl
y w
eakl
y co
rrel
ated
with
the
end
ogen
ous
regr
esso
r; e
valu
ated
ag
ains
t St
ock
and
Yog
o (2
005)
cri
tical
val
ues:
10%
max
imal
LIM
L si
ze =
6.4
6.c H
anse
n’s
J sta
tistic
– H
0: in
stru
men
ts a
re u
ncor
rela
ted
with
the
err
or t
erm
in t
he s
truc
tura
l equ
atio
n an
d ar
e co
rrec
tly e
xclu
ded.
d End
ogen
eity
tes
t –
H0:
the
susp
ecte
d en
doge
nous
reg
ress
or c
an b
e tr
eate
d as
exo
geno
us.
Tab
le 2
. (C
ontin
ued)

372 International Sociology 33(3)
(i.e., they are uncorrelated with the error term in the structural equation of civil equality). The endogeneity test statistic in Model 4 (p = .34) suggests that income inequality is exogenous to civil equality.7
As with political equality, income inequality significantly reduces respect for the civil liberties of poor people. According to the OLS and LIML estimates, each 1-point increase in income inequality reduces civil rights equality scores by between .032 (Model 5) and .048 (Model 4) standard deviations, although as before the smaller but more precise OLS estimate is preferred. The bottom panel of Figure 1 plots these results. Again, the find-ings support relative power theory while contradicting conflict-based perspectives.
Few other variables bear significantly on civil equality. Income inequality represents the only negative predictor, whereas GDP per capita and workers’ rights are associated with greater socioeconomic equality in civil liberties. Model 6, which removes income inequality from the analysis, demonstrates its outsized effect. In the absence of income inequality, three control variables – being party to the ICESCR, left party control of gov-ernment, and IMF structural conditionalities – become positive and statistically signifi-cant. Taking income inequality into account eclipsed these relationships.
Contingent effects: Income inequality, development, and democracy
The foregoing analyses evaluated the average effects of income inequality across all countries in the analysis. I now consider whether the effects are contingent on economic development and political democracy. Table 3 uses OLS to estimate the relationship between economic inequality, on the one hand, and political and civil equality scores, on the other hand, for low-, middle-, and high-income countries. Table 4 does the same for autocratic, anocratic, and democratic countries. I classify countries on these dimensions as follows:
•• High- and low-income countries fall in the top and bottom quartile, respectively, of the worldwide distribution of per capita GDP during the observation period. Middle-income countries occupy the interquartile range. These analyses remove GDP per capita as a control variable.
•• Political classifications are based on countries’ polity scores (Marshall et al., 2013). Countries near the bottom of the distribution of polity scores (–6 to −10) are classified as ‘autocracies,’ whereas those at the top end (+6 to +10) are ‘democ-racies.’ ‘Anocratic’ countries – those with mixed or incoherent authority regimes – occupy the middle range of scores. These analyses remove democracy scores as a control variable.
I analyze contingent effects by interacting income inequality with indicators for each of these categories, save for the excluded reference groups (middle-income and autocratic countries). To render a score of zero for income inequality meaningful in these analyses, I standardize the Gini coefficient to have a mean of 0 and standard deviation of 1.
Table 3 considers whether economic development conditions the effect of income inequality on the distribution of political power (Model 7) and respect for civil liber-ties (Model 8) by socioeconomic position. To aid interpretation, the top panel of

Cole 373
Figure 2 plots the marginal effects of income inequality on political and civil equality scores for low-, middle-, and high-income countries. Income inequality is associated
Figure 1. Estimated effect of income inequality on (A) political and (B) civil equality.Note: Estimates are based on Models 1, 2, 4, and 5 in Table 2, with control variables set to their mean values. LIML-IV = limited information maximum likelihood with instrumental variables; OLS = ordinary least-squares. Shaded gray regions indicate 95% confidence intervals around LIML-IV estimates. Capped vertical lines indicate 95% confidence intervals around OLS estimates.

374 International Sociology 33(3)
Table 3. OLS analyses for the effect of income inequality on the distribution of political power and respect for civil liberties by socioeconomic position, as conditioned by level of economic development, 1981–2011.
Dependent variable Model 7: Distribution of power
Model 8: Respect for civil liberties
Net income inequality (standardized)
−.109 −.345***(.065) (.059)
Low-income countries (1 = yes) .429** −.162 (.138) (.107) × Income inequality −.173 .079 (.105) (.100)High-income countries (1 = yes) −.465 .516* (.246) (.212) × Income inequality −.916*** −.062 (.182) (.138)Democracy score .052*** .022** (.008) (.007)IMF structural conditionalities −.009*** .001 (.002) (.002)Exports (% GDP) .001 .000 (.003) (.002)FDI stock (% GDP) −.001 .002 (.001) (.001)Left government (1 = yes) .187** .088 (.059) (.048)Workers’ rights somewhat restricted
.100* .168(.045) (.088)
Workers’ rights fully protected .292*** .308* (.087) (.132)INGO linkages (ln) .129 .095 (.090) (.053)Party to ICESCR .084 .147 (.128) (.135)Constant −1.567** −1.235*** (.527) (.310)F 35.37*** 137.45***df 14 14R-squared .486 .597N country-years 2640 2555N countries 136 133
*p < .05, ** p < .01, *** p < .001 (two-tailed).Driscoll–Kraay standard errors, robust to heteroskedasticity and autocorrelation, in parentheses.GDP = gross domestic product; IMF = International Monetary Fund; INGO = international nongovernmen-tal organization; ICESCR = International Covenant on Economic, Social, and Cultural Rights.

Cole 375
Table 4. OLS analyses for the effect of income inequality on the distribution of political power and respect for civil liberties by socioeconomic position, as conditioned by degree of political democracy, 1981–2011.
Dependent variable Model 9: Distribution of power
Model 10: Respect for civil liberties
Net income inequality (standardized) −.056 −.182* (.148) (.078)Anocracy (1 = yes) .480** .202* (.173) (.079) × Income inequality −.151 −.181 (.122) (.115)Democracy (1 = yes) .715*** .232* (.188) (.111) × Income inequality −.228 −.174* (.139) (.089)GDP per capita (ln) .053 .236*** (.055) (.044)IMF structural conditionalities −.008** .003 (.003) (.003)Exports (% GDP) −.000 −.002 (.003) (.002)FDI stock (% GDP) −.001 .002 (.001) (.001)Left government (1 = yes) .207** .094 (.070) (.049)Workers’ rights somewhat restricted .129* .185* (.057) (.089)Workers’ rights fully protected .439*** .354** (.097) (.128)INGO linkages (ln) .100 .033 (.080) (.037)Party to ICESCR .082 .172 (.113) (.120)Constant −1.961*** −2.681*** (.454) (.340)F 15.21*** 37.01***df 14 14R-squared .417 .605N country-years 2640 2555N countries 136 133
*p < .05, ** p < .01, *** p < .001 (two-tailed).Driscoll–Kraay standard errors, robust to heteroskedasticity and autocorrelation, in parentheses.GDP = gross domestic product; IMF = International Monetary Fund; INGO = international nongovernmen-tal organization; ICESCR = International Covenant on Economic, Social, and Cultural Rights.

376 International Sociology 33(3)
with the inequitable distribution of political power in both low- and high-income countries; this effect is especially pronounced for highly developed nations. The mar-ginal effect for middle-income countries, while also negative, falls just shy of statisti-cal significance, as indicated by the confidence interval that overlaps with zero. Income inequality also curtails respect for civil liberties by socioeconomic position across all income groups, although the magnitude of this effect increases linearly with economic development.
In most cases, but particularly in affluent countries, economic inequality reduces both political and civil equality. Among middle-income countries, the negative effect of
Figure 2. Marginal effect of income inequality on political and civil equality, as conditioned by (A) economic development and (B) democracy.Note: Estimates are based on the results reported in Tables 3 and 4, with control variables set to their mean values. Dashed vertical lines delimit 95% confidence intervals.

Cole 377
income inequality is stronger for civil than for political equality, whereas for high-income countries the effect is stronger for political than for civil equality. In all, these findings suggest that relative levels of income inequality exert a stronger negative effect on politi-cal and civil equality when countries’ absolute incomes are high.
Table 4 analyzes how regime type conditions the foregoing relationships. The bottom panel of Figure 2 uses interaction terms from these models to plot marginal effects. Model 9 indicates that income inequality reduces socioeconomic equality in the distribu-tion of political power in both anocratic and democratic countries. These trends substan-tiate the dangers of inequality for democracy (e.g., Bartels, 2016; Gilens, 2012; Winters and Page, 2009). The insignificant relationship for autocracies may be attributable to a floor effect: political equality scores in these countries are already quite low and thus largely unaffected by income inequality.
Finally, the estimates in Model 10 point to an inverse relationship between income inequality and respect for civil liberties by socioeconomic position across regime types, including in democratic countries – the very countries that, in principle, are most com-mitted to equalizing respect for civil liberties. Democracy, pace TH Marshall, appears to be a flimsy bulwark for ensuring the civil liberties of poor people.
The effects of control variables in Tables 3 and 4 are generally consistent with the patterns observed in the previous analyses.
Discussion and conclusions
Income inequality has increased worldwide in recent decades, sparking renewed con-cerns over its political consequences. Many scholars worry that growing inequality is inimical to democracy. Nevertheless, what little empirical work has been done on this issue focuses on single cases or only a handful of countries. Other work traces the effects of income inequality on the distribution of political power historically – for example, by investigating the relationship between inequality and franchise extensions.
Using data for up to 136 countries between 1981 and 2011, I estimate the effect of income inequality on the distribution of political power and respect for civil liberties by socioeconomic position. The results are decisive: income inequality is detrimental to political and civil equality. As income inequality increases, rich people enjoy greater political power and respect for civil liberties than poor people do. These findings are robust to estimators that account for reverse causality as well as to a host of control vari-ables that capture levels of economic development, economic dependence, and democ-racy across countries.
Additionally, the analyses explore whether the effects of income inequality are condi-tioned by levels of economic development and types of political regimes. With few exceptions, income inequality reduces political and civil equality irrespective of eco-nomic development or democracy. If anything, the pernicious effects of income inequal-ity are most pronounced for high-income and democratic countries.
These results support relative power theory, which posits that as economic disparities increase, political power will concentrate in the hands of a small elite. My analyses extend this prediction beyond the realm of political power to consider the effect of income inequality on respect for civil liberties. Among a society’s poor, government

378 International Sociology 33(3)
respect for even the most basic of liberties – access to justice, freedom of movement, freedom from forced labor – diminishes as income inequality increases.
The results also confirm the fear Louis Brandeis expressed some eight decades ago. The concentration of wealth – or, in this case, the inequitable distribution of income – is at odds with democracy, insofar as it generates civil and political inequities. Gilens (2012: 1) points out that ‘democracy is commonly understood to entail a substantial degree of political equality, even in the face of social and economic inequalities,’ but my empirical findings belie this ideal.
Resurgent populisms on both sides of the ideological spectrum may be one conse-quence of these processes. Inspired by the Arab Spring uprisings, people around the world took to the streets in 2011, expressing frustration over income inequality and its political ramifications. The Occupy movement criticized ‘not only economic inequality but also the sense that power and participation in all manner of basic social institutions was organized on highly unequal bases. Politicians seemed a distant elite and political power organized to serve corporations and the wealthy not ordinary people’ (Calhoun, 2013: 33). Although many protestors rejected mainstream politics as inescapably corrupt and ineffective, support for Bernie Sanders and his call for a ‘political revolution’ during the US presidential primary campaign in 2016 reflected similar frustrations.
Economic inequality and a sense of powerlessness has also been credited with driving poor and working-class voters into the arms of right-wing populists. Economic insecu-rity undermines political trust (Wroe, 2016) and renders people susceptible to the over-tures of demagogues. Populist parties and politicians generally receive their greatest support from economically disadvantaged voters, and disaffection over rising inequality played a role in the United Kingdom’s decision to leave the European Union, Donald Trump’s election as president of the United States, and the recent wave of support for populist parties around the world (Inglehart and Norris, 2016).
Although equality in the exercise of political power and the enjoyment of civil rights represent fundamental democratic values, countries must address the uneven distribution of economic resources in their societies if these values are to be sustained and realized. Social and economic policies of income redistribution therefore go hand-in-hand with the equitable distribution of civil and political rights.
Funding
This research received no specific grant from any funding agency in the public, commercial, or not-for-profit sectors.
Notes
1. At: www.brandeis.edu/legacyfund/bio.html (accessed 19 June 2017).2. Zingales (2017) bases his term for this process on an apocryphal Medici family motto:
‘Money to get power, power to protect money.’3. This variable is labeled ‘social class equality in respect for civil liberty’ in the Varieties of
Democracy database. I substitute ‘socioeconomic position’ for ‘social class’ because the vari-able pertains to social stratification – comparing ‘rich’ and ‘poor’ people – rather than to class per se. Both outcome measures in my analysis adhere to a broadly Weberian view of class, understood as life chances or opportunities for income, rather than a Marxian conceptualiza-tion based on structural locations in the economy irrespective of wealth or income.

Cole 379
4. Although most highly developed countries are unaffected by conditionalities because they do not receive IMF loans, several OECD countries in my sample have been so targeted (e.g., Greece, Hungary, Iceland, Ireland, Mexico, Portugal, South Korea, Turkey). Countries with-out an IMF loan receive a score of 0 on this variable.
5. This statistic is evaluated against critical values proposed by Stock and Yogo (2005); the notes to Table 2 present these values. Estimators with instrumental variables are always more biased compared with standard OLS models, and this bias increases as the instruments become weaker. Rejection of the null suggests that the degree of bias is acceptably small.
6. To corroborate this finding, I implemented a two-step method for diagnosing endogeneity (Wooldridge, 2013: 534–535). The first step regresses the suspected endogenous regressor, income inequality, on all instrumental and control variables by OLS. The second step adds the residuals from this equation to the model analyzing political equality scores. The coefficient on these residuals was not statistically significant, suggesting that income inequality is indeed exogenous.
7. Wooldridge’s (2013: 534–535) two-step method for diagnosing endogeneity further suggests that income inequality is exogenous to civil equality.
References
Abouharb MR and Cingranelli D (2007) Human Rights and Structural Adjustment. Cambridge: Cambridge University Press.
Acemoglu D and Robinson J (2000) Why did the West extend the franchise? Democracy, inequal-ity, and growth in historical perspective. Quarterly Journal of Economics 115(4): 1167–1199.
Acemoglu D and Robinson J (2006). Economic Origins of Dictatorship and Democracy. New York: Cambridge University Press.
Acemoglu D, Bautista M, Querubín P and Robinson J (2008) Economic and political inequality in development: The case of Cundinamarca, Colombia. In: Helpman E (ed.) Institutions and Economic Performance. Cambridge, MA: Harvard University Press, pp. 181–245.
Acemoglu D, Naidu S, Restrepo P and Robinson J (2015) Democracy, redistribution, and inequal-ity. In: Atkinson A and Bourguignon F (eds) Handbook of Income Distribution. Oxford: Elsevier, pp. 1885–1966.
Alderson A and Nielsen F (1999) Income inequality, development, and dependence: A reconsid-eration. American Sociological Review 64(4): 606–631.
Alderson A and Nielsen F (2002) Globalization and the great U-turn: Income inequality trends in 16 OECD countries. American Journal of Sociology 107: 1244–1299.
Angrist J and Pischke J-S (2009) Mostly Harmless Econometrics: An Empiricist’s Companion. Princeton, NJ: Princeton University Press.
Avendano M (2012) Correlation or causation? Income inequality and infant mortality in fixed effects models in the period 1960–2008 in 34 OECD countries. Social Science Medicine 75(4): 754–760.
Balaev M (2009) The effects of international trade on democracy: A panel study of the post-Soviet world-system. Sociological Perspectives 52(3): 337–362.
Bartels L (2016) Unequal Democracy: The Political Economy of the New Gilded Age. Princeton, NJ: Princeton University Press.
Berlin I (1969) Four Essays on Liberty. London: Oxford University Press.Bollen K (1980) Issues in the comparative measurement of political democracy. American
Sociological Review 45(3): 370–390.Bollen K and Jackman R (1985) Political democracy and the size distribution of income. American
Sociological Review 50(4): 438–457.

380 International Sociology 33(3)
Bollen K and Paxton P (1998) Detection and determinants of bias in subjective measures. American Sociological Review 63(3): 465–478.
Bradley D, Huber E, Moller S et al. (2003) Distribution and redistribution in postindustrial democ-racies. World Politics 55: 193–228.
Brady D (2009) Rich Democracies, Poor People: How Politics Explain Poverty. Oxford: Oxford University Press.
Brady D, Beckfield J and Seeleib-Kaiser M (2005) Economic globalization and the welfare state in affluent democracies, 1975–2001. American Sociological Review 70: 921–948.
Brown C (2009) Democracy’s friend or foe? The effects of recent IMF conditional lending in Latin America. International Political Science Review 30(4): 431–457.
Calhoun C (2013) Occupy Wall Street in perspective. British Journal of Sociology 64(1): 26–38.Cingranelli D, Richards D and Clay KC (2014) Short variable descriptions for indicators in the
Cingranelli–Richards (CIRI) Human Rights Dataset. Available at: www.humanrightsdata.com (accessed 28 August 2014).
Citizens United v. Federal Electoral Commission, 558 U.S. 310 (2010).Clawson D (2009) Money and politics. In: Manza J and Sauder M (eds) Inequality and Society:
Social Science Perspectives on Social Stratification. New York: W.W. Norton, pp. 819–831.Coppedge M, Gerring J, Lindberg S et al. (2017) V-Dem methodology, version 7.1. Available at:
www.v-dem.net/media/filer_public/f2/82/f282f504-c3c8–4fff-8277-e9fda9d54934/method-ology_v71.pdf (accessed 3 January 2018).
Cruz C, Keefer P and Scartascini C (2016) Database of Political Institutions 2015: Codebook. Washington, DC: Inter-American Development Bank.
Domhoff GW (2006) Who Rules America? Power, Politics, and Social Change. Boston: McGraw Hill.
Driscoll J and Kraay A (1998) Consistent covariance matrix estimation with spatially dependent panel data. Review of Economics and Statistics 80(4): 549–560.
Fourcade-Gourinchas M and Babb S (2002) The rebirth of the liberal creed: Paths to neoliberalism in four countries. American Journal of Sociology 108(3): 533–579.
Gastwirth J (2017) Is the Gini index of inequality overly sensitive to changes in the middle of the income distribution? Statistics and Public Policy 4(1): 1–11.
Gilens M (2012) Affluence and Influence: Economic Inequality and Political Power in America. Princeton, NJ: Princeton University Press.
Gilens M and Page B (2014) Testing theories of American politics: Elites, interest groups, and average citizens. Perspectives on Politics 12(3): 564–581.
Goesling B (2001) Changing income inequalities within and between nations: New evidence. American Sociological Review 66: 745–761.
Goodin R and Dryzek J (1980) Rational participation: The politics of relative power. British Journal of Political Science 10(3): 273–292.
Gustafsson B and Johansson M (1999) In search of smoking guns: What makes income inequality vary over time in different countries? American Sociological Review 64(4): 585–605.
Hafner-Burton E and Tsutsui K (2005) Human rights in a globalizing world: The paradox of empty promises. American Journal of Sociology 110: 1373–1411.
Henisz W, Zelner B and Guillén M (2005) The worldwide diffusion of market-oriented infrastruc-ture reform, 1977–1999. American Sociological Review 70(6): 871–897.
Hicks A (1999) Social Democracy and Welfare Capitalism: A Century of Income Security Politics. Ithaca, NY: Cornell University Press.
Hicks A and Misra J (1993) Political resources and the growth of welfare in affluent capitalist democracies, 1960–1982. American Journal of Sociology 99(3): 668–710.

Cole 381
Huber E and Stephens J (2001) Development and Crisis of the Welfare State: Parties and Policies in Global Markets. Chicago: University of Chicago Press.
Huber E and Stephens J (2012) Democracy and the Left: Social Policy and Inequality in Latin America. Chicago: University of Chicago Press.
Inglehart R and Norris P (2016) Trump, Brexit, and the rise of populism: Economic have-nots and cultural backlash. In: American Political Science Association Annual Meetings, Philadelphia.
Kentikelenis A, Stubbs T and King L (2016) IMF conditionality and development policy space, 1985–2014. Review of International Political Economy 23(4): 543–582.
Korpi W (1983) The Democratic Class Struggle. London: Routledge and Kegan Paul.Korpi W and Palme J (2003) New politics and class politics in the context of austerity and globali-
zation: Welfare state regress in 18 countries, 1975–1995. American Political Science Review 97: 425–446.
Lobmayer P and Wilkinson R (2000) Income, inequality and mortality in 14 developed countries. Sociology of Health and Illness 22(4): 401–414.
Lowrey A (2017) Is it better to be poor in Bangladesh or the Mississippi delta? The Atlantic, 8 March. Available at: www.theatlantic.com/business/archive/2017/03/angus-deaton-qa/518880/ (accessed 13 July 2017).
Mahutga M and Bandelj N (2008) Foreign investment and income inequality: The natural experi-ment of Central and Eastern Europe. International Journal of Comparative Sociology 49(6): 429–454.
Marshall M, Gurr T and Jaggers K (2013) Polity IV Project: Dataset Users’ Manual. Vienna, VA: Center for Systemic Peace.
Marshall TH (1992 [1950]) Citizenship and Social Class. London: Pluto.Meltzer A and Richard S (1981) A rational theory of the size of government. Journal of Political
Economy 89(5): 914–927.Mills CW (1956) The Power Elite. New York: Oxford University Press.Moller S, Huber E, Stephens J et al. (2003) Determinants of relative poverty in advanced capitalist
democracies. American Sociological Review 68(1): 22–51.Muller E (1988) Democracy, economic development, and income inequality. American
Sociological Review 53(1): 50–68.Newey W and West K (1994) Automatic lag selection in covariance matrix estimation. Review of
Economic Studies 61: 631–653.Oberdabernig D (2013) Revisiting the effects of IMF programs on poverty and inequality. World
Development 46: 113–142.Pemstein D, Marquardt K, Tzelgov E et al. (2015) The V-Dem measurement model: Latent variable
analysis for cross-national and cross-temporal expert-coded data. Available at: www.v-dem.net/media/filer_public/67/30/6730d372–7952–4c41-ac15-cc3ad0111830/v-dem_working_paper_2015_21.pdf (accessed 3 January 2018).
Przeworski A (2009) Conquered or granted? A history of suffrage extensions. British Journal of Political Science 39(2): 291–321.
Reuveny R and Li Q (2003) Economic openness, democracy, and income inequality: An empirical analysis. Comparative Political Studies 36(5): 575–601.
Ross M (2006) Is democracy good for the poor? American Journal of Political Science 50(4): 860–874.
Rosset J, Giger N and Bernauer J (2013) More money, fewer problems? Cross-level effects of economic deprivation on political representation. West European Politics 36(4): 817–835.
Rudra N (2008) Globalization and the Race to the Bottom in Developing Countries. New York: Cambridge University Press.

382 International Sociology 33(3)
Ruggie J (1982) International regimes, transactions, and change: Embedded liberalism in the post-war economic order. International Organization 36(2): 379–415.
Schaffer M (2010) XTIVREG2: Stata module to perform extended IV/2SLS, GMM and AC/HAC, LIML and k-class regression for panel data models. Available at: http://ideas.repec.org/c/boc/bocode/s456501.html (accessed 7 November 2013).
Simpson M (1990) Political rights and income inequality: A cross-national test. American Sociological Review 55(5): 682–693.
Solt F (2008) Economic inequality and democratic political engagement. American Journal of Political Science 52(1): 48–60.
Solt F (2009) Standardizing the World Income Inequality database. Social Science Quarterly 90(2): 231–242.
Stock J and Yogo M (2005) Asymptotic distributions of instrumental variables statistics with many weak instruments. In: Andrews DWK and Stock JH (eds) Identification and Inference for Econometric Models. Cambridge: Cambridge University Press, pp. 109–120.
Swank D (2008) Tax policy in an era of internationalization: An assessment of a conditional diffu-sion model of the spread of neoliberalism. In: Simmons B, Dobbin F and Garrett G (eds) The Global Diffusion of Markets and Democracy. Cambridge: University of Cambridge Press, pp. 64–103.
Union of International Associations (UIA) (various years) Yearbook of International Organizations. Brussels: UIA.
United Nations (2013) UNCTAD Statistics. Geneva: United Nations Conference on Trade and Development.
Vreeland J (2002) The effect of IMF programs on labor. World Development 30(1): 121–139.Williamson J (2009) A short history of the Washington Consensus. Law and Business Review of
the Americas 15: 7–23.Winters J and Page B (2009) Oligarchy in the United States? Perspectives on Politics 7(4): 731–
751.Wooldridge J (2013) Introductory Econometrics: A Modern Approach. Mason, OH: Thompson
South-Western.World Bank (2013) World Development Indicators. Washington, DC: World Bank.Wright EO and Rogers J (2011) American Society: How It Really Works. New York: W.W. Norton.Wroe A (2016) Economic insecurity and political trust in the United States. American Politics
Research 44(1): 131–163.Zingales L (2017) Towards a political theory of the firm. Journal of Economic Perspectives 31(3):
113–130.
Author biography
Wade M Cole is Associate Professor of Sociology at the University of Utah. A macrosociologist, he conducts research in the areas of political, global, and transnational sociology, with a primary empirical focus on the causes and consequences of states’ human rights practices.
Résumé
Si les chercheurs en sciences sociales s’intéressent depuis longtemps au rapport entre inégalité économique et inégalité politique, la portée des recherches existantes reste cependant limitée. La plupart des travaux portent sur des cas isolés, des sous-échantillons extrêmement restreints ou des sous-unités à l’intérieur d’un pays. Sur la base de données concernant jusqu’à 136 pays entre 1981 et 2011, nous analysons dans cet article dans quelle mesure les inégalités de revenu

Cole 383
ont un effet sur la distribution du pouvoir politique pour les riches et les pauvres d’une société, et sur le respect qu’ils peuvent avoir pour les libertés publiques. Lorsque les inégalités de revenu sont importantes, les riches bénéficient-ils d’un plus grand pouvoir politique et de plus solides libertés publiques que les pauvres? Afin de répondre à ces questions, nous faisons appel à la fois à des analyses de régression groupées et à des modèles en deux étapes à variables instrumentales pour identifier les effets de causalité. Les résultats sont clairs: les inégalités de revenu sont préjudiciables à l’égalité aussi bien politique que civile, et ce, aussi bien dans les pays développés que dans les pays en développement, et dans les pays démocratiques autant que dans les pays non démocratiques.
Mots-clés Égalité politique, endogénéité, inégalités de revenu, libertés publiques
Resumen
La relación entre la desigualdad económica y política siempre ha preocupado a los científicos sociales, pero las investigaciones siguen siendo de alcance limitado. La mayoría de los estudios se centran en casos aislados, submuestras altamente restringidas o subunidades dentro de los países. Usando datos de hasta 136 países entre 1981 y 2011, este articulo analiza cómo y de qué manera la desigualdad de ingresos afecta a la distribución del poder político entre ricos y pobres en la sociedad y el respeto a las libertades civiles de ambos grupos. Cuando la desigualdad de ingresos es alta, ¿tienen los ricos un mayor poder político y disfrutan de libertades civiles más amplias que los pobres? Para responder estas preguntas, se utilizan análisis de regresión con datos agrupados y modelos de dos etapas con variables instrumentales para identificar los efectos causales. Los resultados son claros: la desigualdad de ingresos es contraria a la igualdad política y civil. Estos resultados son válidos tanto para países desarrollados como en desarrollo y tanto para países democráticos como no democráticos.
Palabras claveDesigualdad de ingresos, endogeneidad, igualdad política, libertades civiles

384 International Sociology 33(3)
Appendix
Table A1. Sampled countries.
Albania Denmark Korea, Republic of RomaniaAlgeria Djibouti Kyrgyzstan Russian FederationAngola Dominican Republic Laos RwandaArgentina Ecuadora Latvia SenegalArmenia Egypt Liberia SerbiaAustralia El Salvador Lithuania Sierra LeoneAustria Estonia Macedonia Slovak RepublicAzerbaijan Fiji Madagascar SloveniaBangladesh Finland Malawi South AfricaBelarus France Malaysia SpainBelgium Gabon Mali Sri LankaBenin Gambia Mauritania SwedenBhutan Georgia Mauritius SwitzerlandBolivia Germany Mexico SyriaBotswana Ghana Moldova TajikistanBrazil Greece Mongolia TanzaniaBulgaria Guatemalaa Morocco ThailandBurkina Faso Guinea Mozambique Timor-LesteBurundi Guinea-Bissau Namibia TogoCambodia Guyana Nepal Trinidad and TobagoCameroon Haiti Netherlands TunisiaCanada Honduras New Zealand TurkeyCape Verde Hungary Nicaragua TurkmenistanCentral African Republic Iceland Niger UgandaChad India Nigeria UkraineChile Indonesia Norway United KingdomChina Iran Pakistan United StatesColombia Ireland Panama UruguayCongo, Republic of Israel Papua New Guineaa UzbekistanCosta Rica Italy Paraguay VenezuelaCote d’Ivoire Japan Peru VietnamCroatia Jordan Philippines YemenCyprus Kazakhstan Poland ZambiaCzech Republic Kenya Portugal Zimbabwe
aCountry not included in the analysis of respect for civil liberties by socioeconomic position.
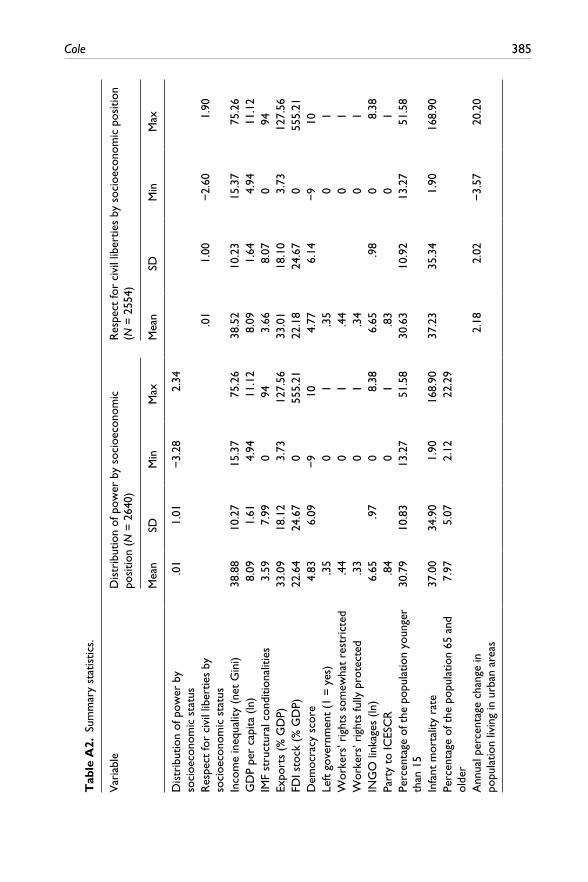
Cole 385
Tab
le A
2. S
umm
ary
stat
istic
s.
Var
iabl
eD
istr
ibut
ion
of p
ower
by
soci
oeco
nom
ic
posi
tion
(N =
264
0)R
espe
ct fo
r ci
vil l
iber
ties
by s
ocio
econ
omic
pos
ition
(N
= 2
554)
Mea
nSD
Min
Max
Mea
nSD
Min
Max
Dis
trib
utio
n of
pow
er b
y so
cioe
cono
mic
sta
tus
.01
1.01
−3.
282.
34
Res
pect
for
civi
l lib
ertie
s by
so
cioe
cono
mic
sta
tus
.01
1.00
−2.
601.
90
Inco
me
ineq
ualit
y (n
et G
ini)
38.8
810
.27
15.3
775
.26
38.5
210
.23
15.3
775
.26
GD
P pe
r ca
pita
(ln
)8.
091.
614.
9411
.12
8.09
1.64
4.94
11.1
2IM
F st
ruct
ural
con
ditio
nalit
ies
3.59
7.99
094
3.66
8.07
094
Expo
rts
(% G
DP)
33.0
918
.12
3.73
127.
5633
.01
18.1
03.
7312
7.56
FDI s
tock
(%
GD
P)22
.64
24.6
70
555.
2122
.18
24.6
70
555.
21D
emoc
racy
sco
re4.
836.
09−
910
4.77
6.14
−9
10Le
ft g
over
nmen
t (1
= y
es)
.35
01
.35
01
Wor
kers
’ rig
hts
som
ewha
t re
stri
cted
.44
01
.44
01
Wor
kers
’ rig
hts
fully
pro
tect
ed.3
30
1.3
40
1IN
GO
link
ages
(ln
)6.
65.9
70
8.38
6.65
.98
08.
38Pa
rty
to IC
ESC
R.8
40
1.8
30
1Pe
rcen
tage
of t
he p
opul
atio
n yo
unge
r th
an 1
530
.79
10.8
313
.27
51.5
830
.63
10.9
213
.27
51.5
8
Infa
nt m
orta
lity
rate
37.0
034
.90
1.90
168.
9037
.23
35.3
41.
9016
8.90
Perc
enta
ge o
f the
pop
ulat
ion
65 a
nd
olde
r7.
975.
072.
1222
.29
Ann
ual p
erce
ntag
e ch
ange
in
popu
latio
n liv
ing
in u
rban
are
as2.
182.
02−
3.57
20.2
0