Embed Size (px)
Citation preview

Inequality and Happiness: When Perceived Social Mobility and Economic Reality do not Match
Christian Bjørnskov Axel Dreher
Justina A.V. Fischer Jan Schnellenbach
CESIFO WORKING PAPER NO. 3216 CATEGORY 1: PUBLIC FINANCE
OCTOBER 2010
An electronic version of the paper may be downloaded • from the SSRN website: www.SSRN.com • from the RePEc website: www.RePEc.org
• from the CESifo website: Twww.CESifo-group.org/wp T

CESifo Working Paper No. 3216 Inequality and Happiness: When Perceived Social
Mobility and Economic Reality do not Match
Abstract
In this paper, we revisit the association between happiness and inequality. We argue that the interaction between the perceived and the actual fairness of the income generation process affects this association. Building on a simple model of individual labor-market participation under uncertainty, we predict that higher levels of perceived fairness cause higher levels of utility, and lower preferred levels of income redistribution. In societies with a low level of actual social mobility, income inequality is perceived more negatively with increased perceived fairness, due to the need for unexpected policy changes as a response to many unsuccessful investments of overly optimistic individuals. This effect becomes smaller as actual social mobility increases. Using data on happiness and a broad set of fairness measures from the World Values Survey, we find strong support for the negative (positive) association between fairness perceptions and the demand for more equal incomes (subjective wellbeing). We also find strong empirical support for the disappointment effect in countries with low social mobility. Consistent with our theoretical model, the results for high-mobility countries turn out to be ambiguous.
JEL-Code: I31, H40, D31, J62, Z13.
Keywords: happiness, life satisfaction, subjective well-being, inequality, income distribution, redistribution, political ideology, justice, fairness, World Values Survey.
Christian Bjørnskov Aarhus University Åbyhøj / Denmark
Axel Dreher University of Goettingen Goettingen / Germany [email protected]
Justina A.V. Fischer University of Rome
Rome / Italy [email protected]
Jan Schnellenbach Ruprecht-Karls-University Heidelberg
Heidelberg / Germany [email protected]
October 12, 2010 An earlier version was circulated under the title “On the relation between income inequality and happiness: do fairness perceptions matter?”. We thank Manfred Holler, Ekaterina Uglanova, participants at the 2007 IAREP conference (Ljubljana), and the 2008 CESifo workshop on Ethics and Economics (Munich) for comments on the earlier draft. Justina Fischer thanks the Marie Curie fellowship schemes (ENABLE, TOM) for financing this research; she thanks the Stockholm School of Economics, Thurgau Institute for Economics and the University of Hamburg for their hospitality.

2
Inequality is undoubtedly more readily borne, and
affects the dignity of the person much less, if it is
determined by impersonal forces than when it is
due to design.
Friedrich Hayek
(1944: 117)
1. Introduction
Since Abba Lerner’s classic contributions from the 1930s, welfare economics has argued that
income redistribution can increase overall welfare in a society with an unequal distribution of
incomes, due to the decreasing returns to income caused by an assumed strict concavity of
individual utility functions (Lerner, 1944). This view implies that most people in societies
characterized by a highly skewed income distribution should, all other things being equal, be
observed to experience lower levels of utility. With the advent of the economics of happiness,
it has become possible – and fashionable – to test this implication on individuals’ self-
reported life satisfaction, which is arguably a reliable proxy for the economic concept of
‘utility’.1 If Lerner’s implication – and indeed standard economic theory – is correct, we
would expect to see a clear negative association between income inequality and life
satisfaction of the average person. Such empirical results would be in line with the more
recent theoretical model by Fehr and Schmidt (1999), taking account of social (other-
regarding) preferences in individuals’ utility functions, equally predicting a negative relation
between inequality and happiness.
Even though this traditional, simple microeconomic approach predicts that overall and
average welfare in an economy decrease with income inequality, the empirical literature on
the association between income inequality and happiness2 has yielded ambiguous findings.3
1 For an overview of the economic, sociological and psychological concepts of subjective well-being and validity studies on its alternative measures, see Diener et al. (2008), Fischer (2009a), and Veenhoven (2000). 2 In this paper, we use the terms ‘happiness’, ‘subjective well-being’, and ‘well-being’ interchangeably. 3 In a related field of research Clark, Frijters and Shields (2008) and Layard, Mayraz and Nickell (2009), among others, use micro data to analyze income inequality effects through social comparisons where persons compare

3
One of the first empirical contributions, Alesina et al. (2004), identify a negative association
between income inequality and happiness for 12 European countries, but an association that is
not statistically significant for most U.S. states. Explaining their results, the authors
hypothesize that differences in perceived and actual social mobility exist between these two
continents. Extending the sample to 30 OECD countries, Fischer (2009b) reports a negative
association between individual life satisfaction and inequality in final income, but not for
market-generated income inequality – potentially indicating that it is actual consumption on
which social comparisons are based.4 In a world sample, however, the large-scale robustness
analysis in Bjørnskov, Dreher and Fischer (2008) suggests that the skewness of the income
distribution does not, in general, affect individual happiness.
In this paper, we investigate the relationship between inequality and happiness,
extending previous research in two dimensions: First, we allow individuals’ subjective
perceptions of ‘fairness’ attributed to the income generating process to affect the association
between life satisfaction and income inequality. In the words of Hopkins (2008), we aim at
differentiating between reward inequality (possibly caused by an unfair income generating
process even when endowments (skills) have been equal) and endowment inequality (which
exists prior to any market transaction, and is shown to persist even when the income
generating process is fair). Second, we allow for differences in the actual fairness of the
income generation process across countries, expecting that these affect how fairness
perceptions influence the inequality-happiness-relation. Indeed, Grosfeld and Senik (2009)
show that in the transition country Poland, at first, income inequality contributed positively to
people’s happiness from 1992 to 1996, possibly because it was associated with given and
perceived good economic opportunities. In contrast, in the later period from 1997 onwards, it
affected people’s happiness negatively, possibly because lower actual social mobility
mismatched with what people still expected it to be. Alesina et al. (2004) already conjectured
their income with a reference level. In our study, inequality rather refers to differences in absolute income across persons and the presence of redistributive government activities. 4 This is in line with Hopkins’ (2008) ‘rivalry model in conspicuous consumption’ according to which income inequality increases individual utility under certain conditions (high income and consumption levels, and a quite dense income distribution), as greater incentives to compete in consumption are generated.

4
that inequality may affect people with specific values and specific views on social mobility in
their societies differently, even if inequality in general is not associated with happiness.
We present a stylized theoretical model, which serves to illustrate our main arguments
and allows us to derive some testable hypotheses. This model analyzes individual labor-
market participation on the extensive and the intensive margin, depending on expected (i.e.,
perceived) fairness of the income-generating process. In the model, a society is considered
fairer the closer the relationship between individual effort and market outcome is. It can
therefore also be interpreted as a measure of social mobility, because with increasing fairness,
inherited social status loses relevance. Our model allows systematic incongruences between
actual and perceived fairness. The model predicts that persons with higher perceived fairness
will – on average, but not in every single case – experience higher levels of utility and be less
in favor of income redistribution.
According to the model, it is the congruence of actual social mobility and individual
fairness perceptions that determines how income inequality affects utility. In a country with
high actual and perceived social mobility, individuals will invest more in human capital and
thus, on average, realize more favorable economic outcomes – in terms of own income, but
also concerning general economic growth. For a country that is a utopian, limiting case of
perfect fairness, we expect that individuals with high fairness perceptions are not negatively
affected by increased income inequality. The reason is that in this case, individuals can not
overinvest into effort and there are no unexpected policy changes conditional on differences
between the actual and the expected income distribution.
In contrast, a low-mobility country, characterized by institutions impeding social
mobility, may suffer from the following problem: With actual social mobility being low, the
group of individuals who overestimate actual fairness tends to be larger relative to high
mobility countries. This leads to a need for (ex ante) unexpected adjustments in fiscal policy,
which in turn reduce utility for individuals who have invested and participate in the labor
market and pay taxes. Ex post, higher perceived fairness in countries with low actual upward
mobility will be negatively associated with income inequality, as inequality is increased
through increasing the number of transfer recipients and decreasing the number of taxpayers.

5
To explore the link between perceptions of fairness, social mobility, inequality, and
happiness empirically we use data from the World Values Survey 1997-2001 and estimate a
happiness function. We employ Gini coefficients to measure income inequality, four different
proxies for individuals’ perceived fairness of the income generating process, and the
interaction of inequality with these proxies. We employ measures of institutional quality to
approximate actual social mobility. The empirical analysis aims to explore whether and to
what extent perceived fairness mediates the potential effects of inequality, differentiating
between countries with low and high actual social mobility. We also investigate the relation
between fairness perceptions and the demand for redistribution, mediating the impact of
fairness on life satisfaction.
We find that persons who believe the income generating process in their society to be
fair appear to be happier and demand less income equalization (and redistribution) by the
government. As predicted by the model, we also find strong empirical support for the negative
effect of inequality for individuals with high fairness perceptions in countries with
unfavorable institutions hampering social mobility. Consistent with our model, for countries
where institutions facilitate equal investment opportunities and access to markets – thus
triggering a close relationship between individual effort and market outcomes – the effects of
income inequality and fairness perceptions appear rather disentangled in their interactions.
The interaction results are corroborated in smaller samples based on measures of actual
mobility through the education system.
Section 2 presents a literature review, and our stylized theoretical model motivating
the empirical analysis. From the model we then derive testable hypotheses. Data and methods
are described in Section 3, while Section 4 presents the results. The final section concludes
and discusses the implications of our findings.

6
2. Happiness, inequality and fairness: Theory
2.1. Preliminary considerations and the literature
In 1944, Austrian economist and social philosopher Friedrich Hayek (1944: 88) argued that
“To produce the same results for different people, it is necessary to treat them differently. To
give different people the same objective opportunities is not to give them the same subjective
chances.” From this follows, as Hayek suggested, that forcing individuals’ outcomes to be
identical and ‘fair’ implies treating people unequally, and, thus, ‘unfairly’. The relation
between what could be termed ‘fairness’ or other moral judgments of processes and outcomes
and social inequality is therefore far from simple and straightforward.
The treatment of ‘utility’ in the economics literature, both by the empirical research on
happiness as well as standard economic theory, has usually focused on pure outcomes and
neglected social comparisons. Yet, individuals do not only derive satisfaction from outcomes,
but probably compare themselves to others, and also enjoy ‘procedural utility’ (Veblen 1899,
Fehr and Schmidt, 1999; Frey and Stutzer, 2005). If people gain the impression that processes
affecting their own situation are ‘fair’, they are not only likely to directly derive procedural
utility from that fact, but also tend to evaluate the outcomes of these processes differently than
if their subjective perception of the process is that it is ‘unfair’. For example, most people
strongly dislike losing games or sports matches, but the impact of a loss is much stronger if
they have the – reasonable or unreasonable – impression that their opponent has not played by
the rules. Similarly, Stutzer and Frey (2003) show that two-thirds of the beneficial effects of
people’s influence in the political decision-making process is not through their impact on
resulting policy outcomes, but through the procedural utility gained from participation and
civic engagement. Experimental evidence tends to support Hayek’s broad argument: Recent
economic experiments reveal that inequality in profits is the more tolerated (by otherwise
generally inequity-averse individuals) the more the process leading to its generation was
perceived as ‘fair’. Experimental research has even identified the corresponding neurological
process in the reward center of the human brain (see Hopkins, 2008, for a summary).

7
To sum up, economic experiments show that if the process of reaching an outcome has
been fair, then subjects in general bear an adverse outcome more easily. In contrast to our
study, the set-up of these experiments is fairly simple, allowing actual fairness of the process
and perceived fairness of the distribution process to coincide. However, one decisive
contribution of our paper is to draw conclusions differentiating between actual and perceived
fairness, which may or may not overlap, reflecting more complex real-world characteristics,
which do not allow individuals to objectively observe actual social mobility in their societies.5
These theoretical and experimental arguments can be applied to individuals’
evaluations of the distribution of income in society. Their subjective evaluation of the
outcome – the inequality of incomes – is likely to depend on their perceptions of the processes
creating the distribution and their evaluations of the fairness of those processes. Such a
conjecture has already been made by Alesina et al. (2004) to explain the differential effect of
income inequality on happiness of survey respondents in the United States compared to those
in Western Europe. For a sample of 30 OECD countries in the WVS, Fischer (2009b) finds
that in a socially mobile society (from the interviewees’ points of view) the negative effect of
income inequality on well-being is mitigated, if not overcompensated. Likewise, in economic
laboratory experiments Mitchell et al. (1993: 636) find that “inequality becomes more
acceptable as people are better rewarded for their efforts,” which can be interpreted as an
indication for a mediating effect of the fairness of the distribution process of ‘rewards’, i.e.,
wage incomes, on the relationship between inequality and happiness.
In this paper, we define an income generating process as ‘fair’ if there is a direct link
between own investment in human capital, on-the-job effort and individual economic
outcome. The looser this link becomes, i.e., the more the individual outcome depends on
chance, the less fair the income generating process is. This would also be the case if income
differences were caused mainly by individual differences in innate talent or ability that cannot
be compensated by effort. Such initial endowments could also include inherited wealth. On
the other hand, if individuals’ perceptions of society indicate that ‘someone’ – either
individually or collectively (e.g., through political decision-making) – is responsible for the 5 Indeed, our model suggests that if perceived fairness is high and actual fairness has a corresponding level, the positive effect of inequality on subjective well-being rises with perceived fairness.

8
shape of the income distribution, moral judgments on fairness will arguably come to rest on a
different foundation.
Actual (objective) and perceived (subjective) fairness in the income generation process
is often not clearly distinguished by the early theoretical and empirical literature on happiness
or preferences for redistribution. Most studies implicitly – Alesina et al. (2004) even explicitly
– assume that subjectively perceived and objectively existing fairness in society correspond
perfectly. However, the empirical happiness analysis for 30 OECD countries by Fischer
(2009b) suggests that perceived and actual social mobility in society are not necessarily
strongly correlated. For this reason, we explicitly differentiate between actual and perceived
fairness and put them in a systematic relation. In particular, we hypothesize that whether the
happiness effects of income inequality are aggravated or reduced by fairness perceptions for
most of the population hinges on whether their perceived and the actual fairness coincide or
diverge.
Fairness perceptions can also be argued to diverge according to political convictions:
Left-wing parties place more weight on equity of outcomes (so-called ‘social justice’), while
right-wing governments place more weight on efficiency and equality in opportunities, as
voters’ definitions of fairness differ systematically across parties (Scott et al. 2001).
Fundamental differences in fairness perceptions would thus suggest that left-wing voters are
sensitive mainly to income inequality, but less to procedural fairness as a determinant of
market income (see also the empirical test in Fischer 2009b). In contrast, right-wing voters
have offsetting efficiency concerns, which lead them to focus more on equality of
opportunities, and to accept the resulting income inequality more easily. In a conservative
perspective, relatively large income differences might be seen as an indication that individuals
who work hard receive their just deserts. Indeed, Alesina et al. (2004) find that left-wing
voters are more concerned about income inequality than right-wing or centrist voters, both in
Europe and the United States We therefore employ the respondent’s political ideology as one
proxy of her fairness perception.
In the course of this analysis, we predict a negative relation between fairness
perceptions and the demand for income redistribution, which we also test against our data.

9
The relation between social mobility (perceptions) and the preference for equal incomes has
been analyzed in a couple of previous studies. Ravallion and Lokshin (2000), using Russian
micro data, were the first to show that self-assessed expected own social mobility, or the belief
of being on a rising income trajectory, leads to lower demand for redistribution. Corneo and
Gruener (2002) present a ‘public values effect’ model, concluding that “an individual who
believes in the importance of personal hard work [for income] is expected to oppose
redistribution” (ibidem: 86), preceding the similar arguments in Alesina et al. (2004). In
Corneo and Gruener’s (2002) logit regressions, run with about 30 countries in various
International Social Survey Programme (ISSP) waves on the question ‘Government should
reduce inequality’, both generalized fairness perceptions and perceived past social mobility
reduce the demand for equalizing incomes.6 In contrast, persons reporting that ‘they would
gain [from redistribution]’ are in favor of such government policy. Population preferences for
and against redistribution are captured by country fixed effects, an approach that we will
follow below. A negative relation between personal income and preferences for redistribution
is not only shown in Corneo and Gruener (2002), but also by Alesina and La Ferrara (2005).
Using U.S. General Social Survey (GSS) data, the latter corroborate the negative relation
between perceived equal opportunities, subjective income prospects, income, and a history of
past social mobility, with a preference for income redistribution.7 Exploiting the longitudinal
nature of their panel data, Alesina and La Ferrara (2005) construct two objective measures of
actual income prospects, at the individual and state level. They find both to be strongly
negatively related to individual demand for more equal incomes. Contrasting results are
reported in Clark and D’Angelo (2008) for the British Household Panel Survey (BHPS) who
identify a positive association between own experienced social mobility (‘having higher
6 Fairness perceptions are measured by the question ‘hard work is the key [to success]’, while social mobility experience is captured by the variable ‘better off than father’. 7 Preference for redistribution is measured by the question ‘Should government reduce income difference between rich and poor?’. Past history of social mobility is measured by ‘having a job prestige higher than father’s’, and subjective income prospects are proxied by ‘expect a better life’. Equal opportunities as source of economic success are approximated by the question ‘Get ahead: hard work’, while unequal opportunities are approximated with the statement ‘Get ahead: luck/help’.

10
socio-economic status than parents’) and being in favor of having capped incomes, or state-
ownership, and being left-wing.8
In the following, we develop a simple workhorse model, illustrating the potential
impact of income inequality and fairness perceptions on individual well-being.
2.2. The basic set-up of the model
Following, among others, Blanchflower and Oswald (2004), we assume that reported
subjective well-being or ‘happiness’ of an individual i is an increasing function of her
instantaneous, directly unobservable utility where i is an error-term:
(1) W i w(ui) i
The error term reflects unobservable differences across individuals, such as different
subjective interpretations of the ordinal scale on which individual well-being is reported. This
assumption allows us to focus on standard economic utility considerations in the theoretical
analysis, i.e., on the underlying economic forces that influence individual welfare.
We assume, without loss of generality, that utility is linear in income y i and that effort
invested to earn income has a negative and quadratic direct effect on utility.
(2) ui y i(ei) 12
ei2
where
(3) y i g(ei) 1 1 1 i .
8 This study employs the measure ‘The government should place an upper limit on the amount of money that any one person can make’, which is not fully comparable to that used in previous empirical analyses.

11
Income increases with effort according to the strictly concave function g. The
parameter [0,1] is a society-wide fairness parameter. The closer its value is to one, the
more reliable is the impact of individual effort on individual income. The value of this
parameter is identical for all individuals. On the other hand, i [0,1] is an idiosyncratic
parameter reflecting, for example, the family background or the place of birth of an
individual. In general, i captures anything in the personal background of an individual that
may make it more difficult for her to earn an income based upon her own effort.
We assume that the true value of is unknown to the individual decision-makers.
They can certainly observe the institutional framework of their society, but the web of formal
and informal institutions that characterizes any modern society is generally complex enough
to make any exact ex ante knowledge of the true value of extremely unlikely. Every
individual therefore bases her decisions on her own estimate ˜ i.9 The idiosyncratic parameter
i is assumed to be determined randomly. It is drawn from an individual-specific distribution
characterized by the continuous and unimodal pdf f i(i) with support 0,1 . Let ˆ i denote the
expected value of the idiosyncratic parameter for individual i. We assume that the distribution
of ˆ i over the population is skewed to the right, and also unimodal. We further assume that
their own ˆ i is known to all individuals. They do, however, not observe the value of i that is
eventually drawn. They only observe income and effort, but have no definitive knowledge
about how much of the result is due to bad (good) institutions, or an (un-)lucky draw of the
idiosyncratic parameter. Furthermore, we assume that ˆ i is inherited: Individuals from poorer
families or worse neighborhoods are characterized by lower values of ˆ i .10 However, even
individuals from unfavorable backgrounds have a chance to draw a favorable high i from the
distribution.
9 Piketty (1995) has shown in a model where individual income is also determined by societal fairness and individual influences that differences in fairness estimations may prevail in an equilibrium with full Bayesian rationality. 10 Note that there is emphatically no genetic inheritance assumed to be at work here. This approach simply captures the empirical regularity that individuals from low-income families often find it more difficult to rise into high-paying positions than those who already have a high-income background. In a utopian situation with completely fair institutions ( 1), the impact of the idiosyncratic parameter would be cancelled out completely.
12
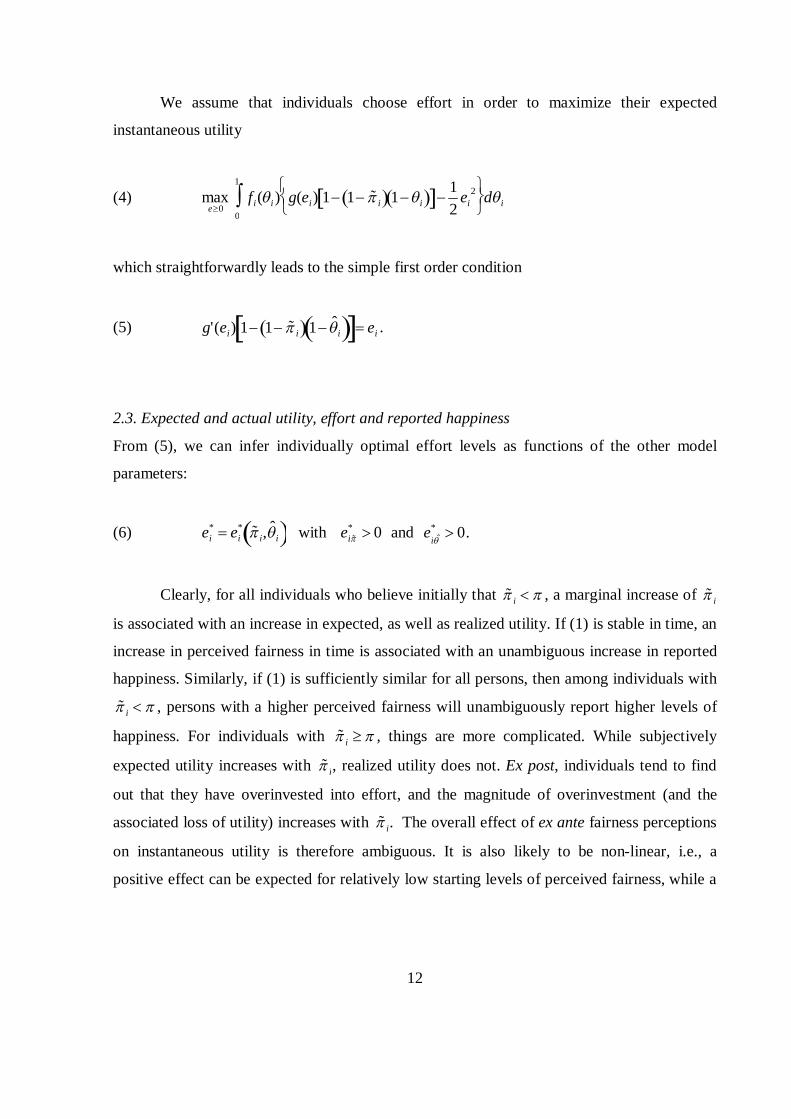
We assume that individuals choose effort in order to maximize their expected
instantaneous utility
(4) maxe0
f i(i) g(ei) 1 1 ˜ i 1i 12
ei2
0
1
di
which straightforwardly leads to the simple first order condition
(5) g'(ei) 1 1 ˜ i 1 ˆ i ei .
2.3. Expected and actual utility, effort and reported happiness
From (5), we can infer individually optimal effort levels as functions of the other model
parameters:
(6) ei* ei
* ˜ i, ˆ i with ei ˜ * 0 and ei ˆ
* 0.
Clearly, for all individuals who believe initially that ˜ i , a marginal increase of ˜ i
is associated with an increase in expected, as well as realized utility. If (1) is stable in time, an
increase in perceived fairness in time is associated with an unambiguous increase in reported
happiness. Similarly, if (1) is sufficiently similar for all persons, then among individuals with
˜ i , persons with a higher perceived fairness will unambiguously report higher levels of
happiness. For individuals with ˜ i , things are more complicated. While subjectively
expected utility increases with ˜ i, realized utility does not. Ex post, individuals tend to find
out that they have overinvested into effort, and the magnitude of overinvestment (and the
associated loss of utility) increases with ˜ i. The overall effect of ex ante fairness perceptions
on instantaneous utility is therefore ambiguous. It is also likely to be non-linear, i.e., a
positive effect can be expected for relatively low starting levels of perceived fairness, while a

13
negative marginal effect is more likely to prevail with starting levels of perceived fairness that
already are very high.
With effort determined and income revealed, it is easy for any individual to calculate
her value of 1 i 1i ex post, but individual knowledge is not sufficient to disentangle
these two effects. Deriving an indirect utility function V from (2) and using the envelope
theorem reveals that V ˜ i g(ei
*)(1 ˆ i) , i.e., expected utility is linear and increasing in ˜ i.
However, to any value of ˜ i corresponds a range of actually realized individual utility levels
in the population, each depending on the individually drawn values, i . How will i respond if
i ui(,i) Vi( ˜ i, ˆ i) 0? If i 0, it is reasonable (although not necessary for our
argument) to assume that the individual will claim the laurels for herself, believe in having
drawn i ˆ i and leave her ˜ i unchanged. If i 0, the opposite reaction is likely: ˜ i will be
revised downward towards ˆ i ˜ i for which ui(,i) Vi( ˆ i, ˆ i). For all observations that
initially lie below the Vi-line, individuals adjust their fairness perceptions such that these
observations eventually lie exactly on this upward-sloping line. This leads us to
Proposition 1. If individuals shift the responsibility for a negative difference between actual
and expected utility to the institutional framework by revising their fairness perceptions
downward, then an overall positive relationship between perceived fairness and self-reported
well-being is expected in populations of individuals that are heterogeneous with respect to
their marginal ability to earn incomes.
2.4. Preferences for income redistribution and reported happiness
Let there be a simple, redistributive tax and transfer system, which consists of a proportional
income tax with rate t levied on labor income, and of a guaranteed transfer income yT (t) paid
to those individuals who do not earn a market income. To keep matters simple, we assume
that government commands no screening technology that would allow it to distinguish

14
between voluntary and involuntary unemployment. Individuals therefore compare expected
utilities on and off the labor market, and participate only if
(7) (1 t) g(ei*) 1 (1 ˜ i)(1 ˆ i) 1
2ei
* yT (t) .
Thus, for any given tax and transfer system t, yT (t) in combination with an
individual belief ˜ i, there exists some threshold value iT where (7) holds with equality and
where for any ˆ i iT the individual decides in favor of labor market participation. Since
procedural fairness compensates for an unfavorable idiosyncratic parameter value, the value
of the threshold iT is strictly declining in perceived fairness. In other words, higher perceived
fairness yields higher planned (ex ante) labor market participation rates even in groups who
expect relatively lower values of i . With utility being linear in income, the insurance motive
for redistribution does not play a role. Redistribution is ex ante only in the interest of
individuals who plan not to participate in the labor market.
The relationship between preferences for redistribution and fairness perceptions is
reinforced if we also allow for ex post adjustments of fairness perceptions as discussed above.
Suppose the redistribution scheme is extended such that individuals who participate, but earn
a surprisingly low income, are paid a transfer until they reach a net income of yT . Those
benefiting from such a scheme would all be individuals with i 0, who revise their fairness
perceptions downward ex post. In other words, all transfer-recipients are characterized by low
fairness perceptions: Either because they already had them ex ante, and decided not to
participate in the labor market, or because they were disappointed by their individual market
outcome and accordingly revised their fairness perception downwards ex post. This revision
leads to an ex post fairness perception which lies below the ex ante threshold for labor market
participation. However, any investments into effort are obviously sunk and cannot be
retrieved. Thus follows
15
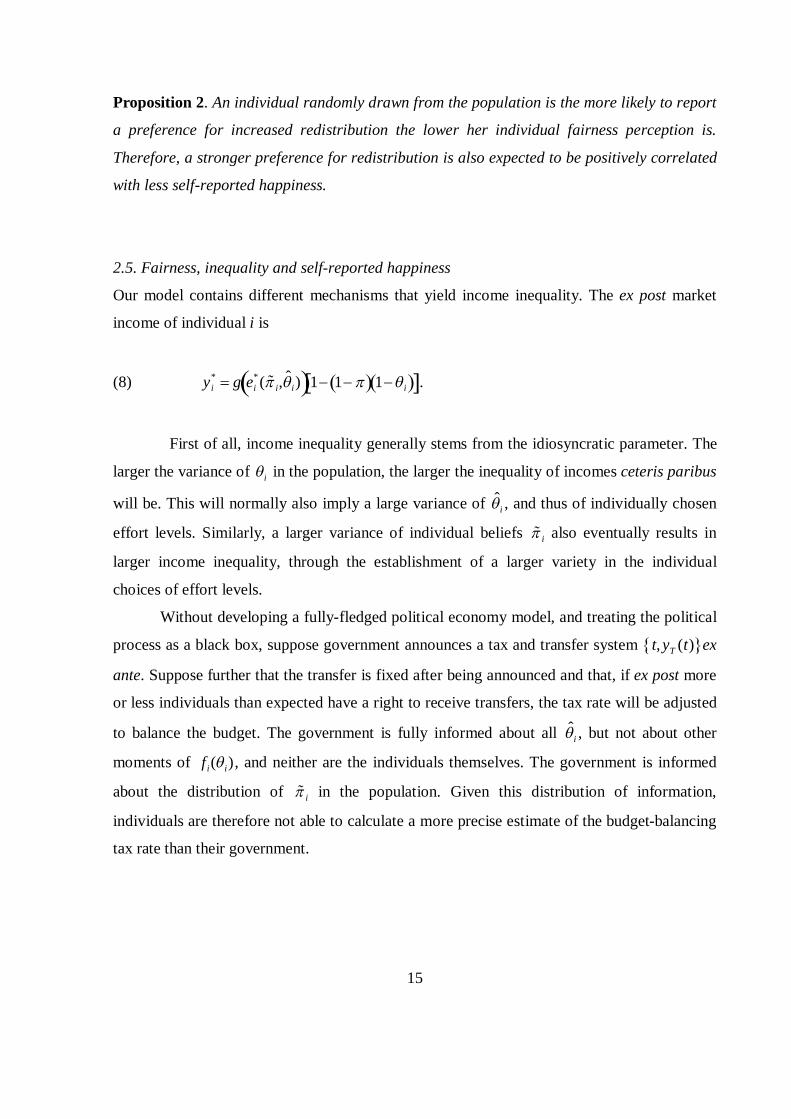
Proposition 2. An individual randomly drawn from the population is the more likely to report
a preference for increased redistribution the lower her individual fairness perception is.
Therefore, a stronger preference for redistribution is also expected to be positively correlated
with less self-reported happiness.
2.5. Fairness, inequality and self-reported happiness
Our model contains different mechanisms that yield income inequality. The ex post market
income of individual i is
(8) y i* g ei
*( ˜ i, ˆ i) 1 1 1 i .
First of all, income inequality generally stems from the idiosyncratic parameter. The
larger the variance of i in the population, the larger the inequality of incomes ceteris paribus
will be. This will normally also imply a large variance of ˆ i , and thus of individually chosen
effort levels. Similarly, a larger variance of individual beliefs ˜ i also eventually results in
larger income inequality, through the establishment of a larger variety in the individual
choices of effort levels.
Without developing a fully-fledged political economy model, and treating the political
process as a black box, suppose government announces a tax and transfer system t, yT (t) ex
ante. Suppose further that the transfer is fixed after being announced and that, if ex post more
or less individuals than expected have a right to receive transfers, the tax rate will be adjusted
to balance the budget. The government is fully informed about all ˆ i , but not about other
moments of f i(i), and neither are the individuals themselves. The government is informed
about the distribution of ˜ i in the population. Given this distribution of information,
individuals are therefore not able to calculate a more precise estimate of the budget-balancing
tax rate than their government.
16
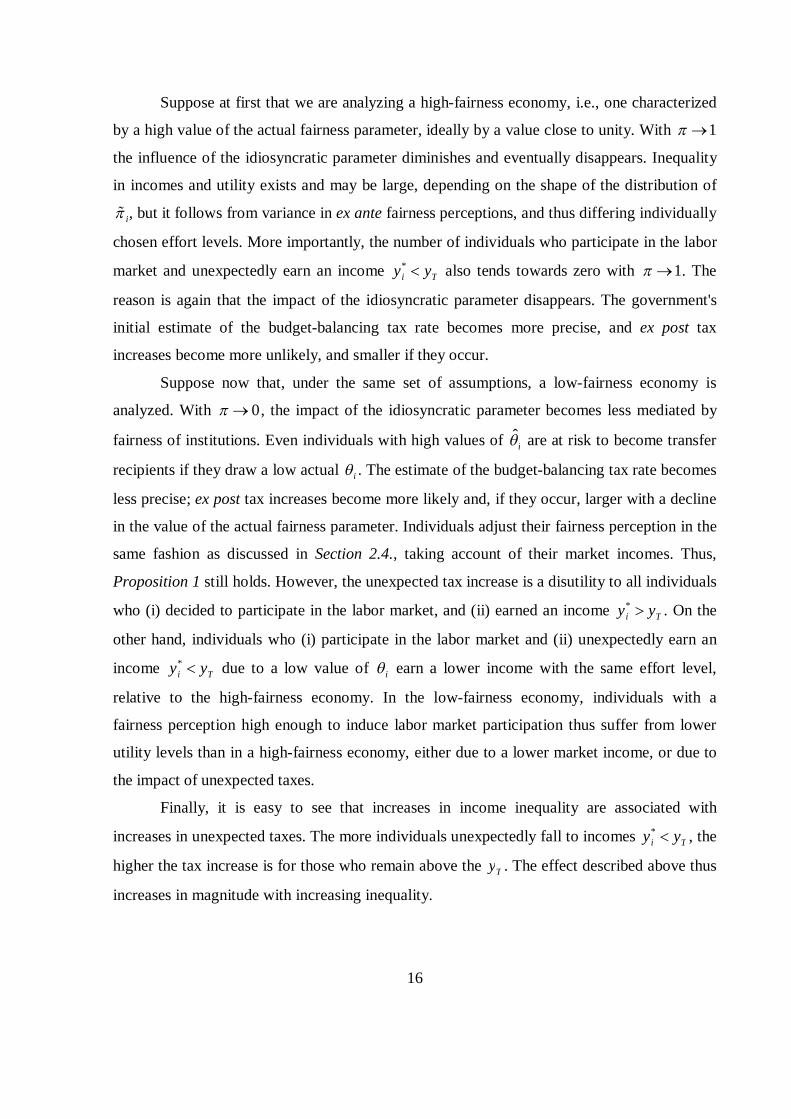
Suppose at first that we are analyzing a high-fairness economy, i.e., one characterized
by a high value of the actual fairness parameter, ideally by a value close to unity. With 1
the influence of the idiosyncratic parameter diminishes and eventually disappears. Inequality
in incomes and utility exists and may be large, depending on the shape of the distribution of
˜ i, but it follows from variance in ex ante fairness perceptions, and thus differing individually
chosen effort levels. More importantly, the number of individuals who participate in the labor
market and unexpectedly earn an income y i* yT also tends towards zero with 1. The
reason is again that the impact of the idiosyncratic parameter disappears. The government's
initial estimate of the budget-balancing tax rate becomes more precise, and ex post tax
increases become more unlikely, and smaller if they occur.
Suppose now that, under the same set of assumptions, a low-fairness economy is
analyzed. With 0 , the impact of the idiosyncratic parameter becomes less mediated by
fairness of institutions. Even individuals with high values of ˆ i are at risk to become transfer
recipients if they draw a low actual i . The estimate of the budget-balancing tax rate becomes
less precise; ex post tax increases become more likely and, if they occur, larger with a decline
in the value of the actual fairness parameter. Individuals adjust their fairness perception in the
same fashion as discussed in Section 2.4., taking account of their market incomes. Thus,
Proposition 1 still holds. However, the unexpected tax increase is a disutility to all individuals
who (i) decided to participate in the labor market, and (ii) earned an income y i* yT . On the
other hand, individuals who (i) participate in the labor market and (ii) unexpectedly earn an
income y i* yT due to a low value of i earn a lower income with the same effort level,
relative to the high-fairness economy. In the low-fairness economy, individuals with a
fairness perception high enough to induce labor market participation thus suffer from lower
utility levels than in a high-fairness economy, either due to a lower market income, or due to
the impact of unexpected taxes.
Finally, it is easy to see that increases in income inequality are associated with
increases in unexpected taxes. The more individuals unexpectedly fall to incomes y i* yT , the
higher the tax increase is for those who remain above the yT . The effect described above thus
increases in magnitude with increasing inequality.

17
Proposition 3. For individuals with fairness perceptions and mobility expectations ˜ i
sufficiently high to induce labor market participation and living in economies with low levels
of actual social mobility , a negative effect of income inequality on instantaneous utility and
self-reported well-being is expected. With actual social mobility approaching its maximum,
1, the effect disappears for the same individuals.
3. Data and Method
3.1. Data
In order to empirically test Propositions 1 to 3, we employ data from the pooled third and
fourth waves of the World Values Survey, covering the years 1994-2001 (Inglehart et al.,
2004). The availability of reliable and internationally comparable Gini data restricts our
choice of WVS data to around the year 1995. We follow the standard approach in the
literature by using individuals’ responses to the question “All things considered, how satisfied
are you with your life as a whole these days?" as proxy for (remembered) utility and the
dependent variable for Propositions 1 and 3. The responses are distributed on a ten-point scale
ranging from 1 (completely dissatisfied) to 10 (completely satisfied), with a sample mean of
about 6.3.11 In order to estimate a set of relevant personal characteristics forming the core of
individuals’ happiness functions, we rely on the robust baseline model in Bjørnskov, Dreher
and Fischer (2008) and Fischer (2009c). The country-level control variables include only
country fixed effects, to avoid biasing the impact of the inequality measure through the choice
of macro-controls. At the individual level, we include measures of age, gender, family type,
religion, religiosity and spirituality. The baseline model is complemented with a wave dummy
11 The WVS includes questions on both life satisfaction and happiness, but the correlation between happiness and satisfaction is surprisingly low (rho = 0.44). We opt for using the life satisfaction question since 1) translation problems seem to yield cross-country comparisons of answers to the other question less comparable and 2) the happiness question is more likely to capture the affective component of subjective well-being rather than its cognitive component (for a discussion, see Fischer 2009a).
18
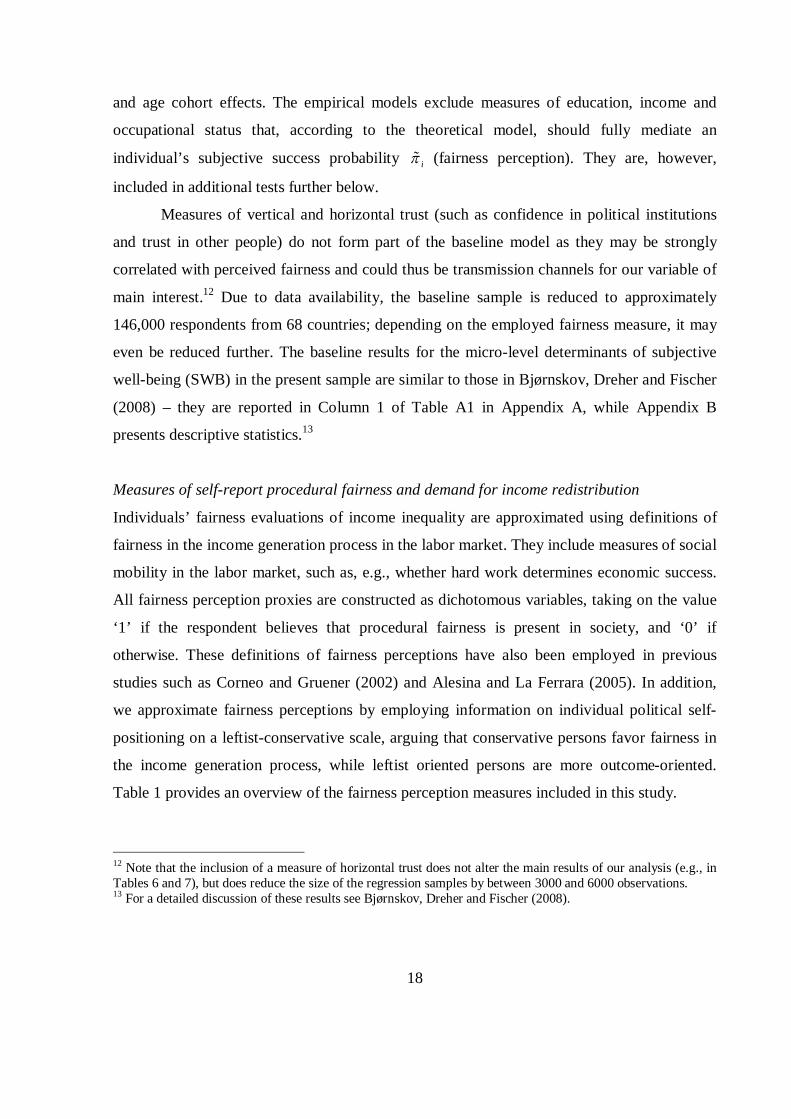
and age cohort effects. The empirical models exclude measures of education, income and
occupational status that, according to the theoretical model, should fully mediate an
individual’s subjective success probability ˜ i (fairness perception). They are, however,
included in additional tests further below.
Measures of vertical and horizontal trust (such as confidence in political institutions
and trust in other people) do not form part of the baseline model as they may be strongly
correlated with perceived fairness and could thus be transmission channels for our variable of
main interest.12 Due to data availability, the baseline sample is reduced to approximately
146,000 respondents from 68 countries; depending on the employed fairness measure, it may
even be reduced further. The baseline results for the micro-level determinants of subjective
well-being (SWB) in the present sample are similar to those in Bjørnskov, Dreher and Fischer
(2008) – they are reported in Column 1 of Table A1 in Appendix A, while Appendix B
presents descriptive statistics.13
Measures of self-report procedural fairness and demand for income redistribution
Individuals’ fairness evaluations of income inequality are approximated using definitions of
fairness in the income generation process in the labor market. They include measures of social
mobility in the labor market, such as, e.g., whether hard work determines economic success.
All fairness perception proxies are constructed as dichotomous variables, taking on the value
‘1’ if the respondent believes that procedural fairness is present in society, and ‘0’ if
otherwise. These definitions of fairness perceptions have also been employed in previous
studies such as Corneo and Gruener (2002) and Alesina and La Ferrara (2005). In addition,
we approximate fairness perceptions by employing information on individual political self-
positioning on a leftist-conservative scale, arguing that conservative persons favor fairness in
the income generation process, while leftist oriented persons are more outcome-oriented.
Table 1 provides an overview of the fairness perception measures included in this study.
12 Note that the inclusion of a measure of horizontal trust does not alter the main results of our analysis (e.g., in Tables 6 and 7), but does reduce the size of the regression samples by between 3000 and 6000 observations. 13 For a detailed discussion of these results see Bjørnskov, Dreher and Fischer (2008).

19
Table 1: Measures of fairness perceptions and income redistribution
Variable name Definition
Fairness in the education system and the labor market
Hard work Dummy that is ‘one’ for values below 5 on the question ‘In the long run, hard work usually brings success’ (which has a 10-point scale)
Laziness Dummy that is ‘one’ for individuals claiming ‘People are living in need because of laziness or lack of willpower’ and ‘zero’ when answering ‘People are living in need because of injustice in society’
Chance Dummy that is ‘one’ for individuals claiming that ‘people have a chance to escape poverty’. (alternative: ‘they have little chance’)
General meritocratic worldview
Conservative Dummy that is ‘one’ for values above or equal to 7 on a 10-point scale measuring conservative political ideology
Demand for income redistribution More equal incomes
Dummy that is ‘one’ for values below 5 on the question “Incomes should be more equal” (which has a 10-point scale)
Elimination Dummy that is ‘one’ for values 1 and 2 on a 5-point scale measuring the ‘importance of eliminating big income inequalities’ (ranging from ‘very important’ to ‘not at all important’).
Basic needs Dummy that is ‘one’ for values 1 and 2 on a 5-point scale measuring the ‘importance to guaranteeing basic needs’ (ranging from ‘very important’ to ‘not at all important’).
The demand for income redistribution is measured using three proxies derived from the
World Values Survey. These variables, originally recorded on a 10-point or, respectively, a 5-
point scale, were aggregated into dichotomous indicators (‘1’ = pro redistribution) in order to
facilitate the empirical analysis in the probit models and, particularly, the interpretation of the
results. They resemble the measures of income redistribution through governments employed

20
in Corneo and Gruener (2002) and Alesina and La Ferrara (2005). Table 1 provides on
overview of the variables employed and their exact codings.
Measures of actual social mobility
To test Proposition 3, perceived social mobility (perceived fairness/equal opportunities) needs
to be distinguished from actual social mobility. Unfortunately, cross-nationally comparable
social mobility measures are hardly available on a large scale. To exploit the large sample size
of up to 68 countries, we suggest using several proxies of actual social mobility. First, we
employ the Gastil index of civil liberties (Freedom House 2007) and the Fraser Index of
Economic Freedom (Gwartney and Lawson 2008). Second, following Fischer (2009b), we
employ measures of intergenerational mobility in terms of educational attainment, in
particular whether student performance depends on parental background. These direct
measures of social mobility are, however, only available for a small subsample of OECD
countries.
The rationale for using indices of economic freedom is that social mobility is only
possible in an institutional framework that allows for free choice of occupation in a liberalized
labor market, easy access to the national credit market (all measured by area 5 of the Fraser
index, ranging from 1 (lowest) to 10 (highest)), a government size not too large, triggering
modest taxation of capital and income (captured by area 1), and a sound monetary policy that
does not hamper investment (area 3). In addition, legal quality and the protection of property
rights (area 2) as well as openness to the international goods markets and access to foreign
capital (area 4) may equally be prerequisites for a socially mobile society and actual
procedural fairness in the income generation process. Similarly, the Gastil index of civil
liberties (range: 1 (highest) to 7 (lowest)) captures not only freedoms of expression and
religion, but also the economically important dimensions of freedom of assembly, association
(such as unions and firm cartels), and equal opportunities in education.
To test for the robustness of our results, we employ measures of actual social mobility.
We use a measure of educational mobility based on the PISA 2003 Mathematics results,
obtained from Fischer (2009b) and available for 27 countries in our baseline sample.

21
Educational mobility is the average advantage of having a high-education family background,
expressed in test score points. More specifically, it is the average difference between the
performance of students with such an advantageous family background compared to average
student performance. The closer this difference is to zero, the more independent is student
performance from parental background, and the more socially mobile is a country’s education
system. Appendix C presents the values of these actual social mobility measures for OECD
countries.
Measure of income inequality
The Gini coefficients for testing Proposition 3 are obtained from UNU (2006) and relate
roughly to the year 1995.14 We have chosen to obtain the Gini values from this specific
database because the authors undertook special care to use reliable, high-quality income
information to calculate the Gini coefficients to ensure its cross-country comparability; non-
comparability of Gini coefficients across countries constitutes a severe problem with
alternative income inequality information (e.g., from the World Development Indicators
database). As the Gini measure refers to a cross-section of countries only, its true effect
cannot be identified due to its multicollinearity with the country fixed effects. However,
Proposition 3 can be tested by interacting our fairness measures with the Gini coefficient.
Appendix C displays the values for the 68 countries in the baseline sample.
3.2. Method
Proposition 1 predicts a positive association of individual fairness perceptions ( ˜ i =
perceived fairness of individual i) with individual life satisfaction. For testing Proposition 1,
we simply add the four fairness perception measures to the baseline happiness model and
observe their relations with subjective well-being (SWBi = f(fairnessi, ...)). Vector
14 Gini coefficients all are calculated on the basis of gross income or earnings and are thus prior to any redistribution. However, Bergh (2005) shows for 11 OECD countries with high quality national statistics systems that the difference between pre-transfer and post-transfer Gini coefficients is not a reliable measure of actual government redistribution.

22
includes theindividual-level control variables, country fixed effects, a wave dummy and
cohort effects, as described above. According to the theoretical model, in equilibrium, the
effects of fairness perceptions should entirely run through own income, education and
occupational status, which we therefore exclude from the vector of the baseline
specification. We test whether these variables are transmission channels for our main
variables of interest and therefore also report specifications including them.
(9) SWBi = 'fairnessi +'+ ui
Proposition 2 predicts that perceiving the income generation process as fair lowers the
demand for income redistribution, while demanding more redistribution itself is predicted to
be negatively associated with subjective well-being. In other words, Proposition 2 views
equation (9) as a reduced function of the chained function (SWBi = f (REDi (fairnessi ...) …).
We test this hypothesis by, first, estimating a model of demand for income redistribution, with
the identical variable of interest and the same set of control variables as in equation (9). The
estimated coefficient ' indicates the effect of fairness perceptions on the probability to be in
favor of redistribution:
(10) Pr(RED)i= 'fairnessi '+ ui
In a second step, we relate subjective well-being to the demand for redistribution, expecting a
negative relation:
(11) SWBi = REDi '+ ui

23
To test Proposition 3, we add the interactions of the responses to one of those fairness
perception questions with income inequality in their home country as measured by the Gini
coefficient to equation (9).15
(12) SWBi = fairnessi + fairnessiGINI '+ u
In estimating the model of subjective well-being we follow the previous literature (see, e.g.,
Bjørnskov, Dreher and Fischer 2008), but employ OLS in which coefficient estimates also
represent marginal effects, facilitating the interpretation of the interaction terms. This
approach follows Ferrer-i-Carbonell and Frijters (2004), who show that OLS is a feasible
estimation procedure for a 10-point categorical happiness variable by employing the 10-
category life satisfaction question in the German Socio-Economic Panel, the analogue of
which we have obtained from the WVS.
Given the dichotomous nature of the measures of preference for income redistribution,
the model of redistributive preferences is estimated as probit model, which greatly facilitates
the calculation of the marginal effects (for the probability of reporting a pro-redistributive
political statement). Even though the analysis focuses on the direction of (significant)
influences of the fairness perceptions estimates, we also discuss their relative quantitative
effects.
The next section reports the results.
15 A potential worry with these data would arise if they simply proxied for individuals’ income positions. However, the responses are only weakly associated with individual incomes.

24
4. Results
4.1. Some basic correlations
Prior to turning to the multivariate analysis it may be worthwhile to investigate a couple of
simple correlations between individual life satisfaction and perceived and objective fairness,
or, respectively, social mobility.
Simple correlations between measures of fairness perceptions and individual life
satisfaction are rather low or moderate, with coefficient values ranging between roughly 0.05
(hard work) and 0.2 (chance to escape poverty). Correlations with measures of actual social
mobility are somewhat larger, for civil liberties (Gastil) and economic freedom (full Fraser
index), between 0.23 and 0.26 (in absolute terms). For the subsample of OECD countries,
measures of social mobility in terms of educational attainment show correlations similar in
size to that of economic freedom, with coefficients for maternal and paternal educational
dependence of 0.20 and 0.22, respectively. Finally, the correlation between income inequality
and life satisfaction is positive, but fairly small (0.06).
In general, correlations of roughly 0.4 to 0.6 are achieved when an aggregate measure
of happiness is employed in place of individual subjective well-being. Using the mean of life
satisfaction in a country, economic freedom shows a correlation of about 0.5 to 0.6, and social
mobility in education of about 0.6 – 0.7. Only the Gini coefficients still show a small
correlation of 0.14 with country means in life satisfaction, possibly indicating their
subsample-specific heterogeneous effect. Employing aggregated individual data on the four
fairness perceptions measures, correlations with country means in life satisfaction range from
0.06 to 0.4 and are, for at least two measures (poverty due to laziness and chance to escape
poverty), quite large.
4.2. Testing Proposition 1: Fairness perceptions and subjective well-being
Table 2 tests Proposition 1 by including the proxies for perceived fairness to the baseline
specification of the well-being model, one-by-one. Overall, Table 2 tests four fairness

25
measures, yielding four model variants. The table displays only the estimation results for the
fairness measure and the number of individual observations in the corresponding regression
samples; the full model estimations are displayed in the Appendix (Table A1, columns 2 – 5).
The constant in the regressions is in most cases around 8 SWB points (not reported), and the
adjusted R2 ranges between 0.2 and 0.25, depending on the model specification.16
Table 2: Relations between happiness and fairness perceptions
(1) (2) (3) (4) Hard work brings success in the long run 0.224*** number of observations 60730 People are poor due to laziness 0.570*** number of observations 62920 People have chance to escape poverty 0.483*** number of observations 59383 Conservative ideology 0.411*** number of observations 146752 Income, education, occupational status no no no No Other micro controls included yes yes yes Yes Country fixed effects included yes yes yes Yes
Notes: OLS estimation. Dependent variable is life satisfaction measured on a 10-point scale. All models include the baseline micro-variables, wave, cohort and country effects (not reported). Income, education and occupational status are excluded from the model. *, **, *** denote significances at the 10, 5 and 1 percent level, respectively.
First, note the positive signs of the perceived-fairness estimates, indicating that
persons with strong fairness perceptions (a high ˜ i) are indeed happier compared to those
who have a different view. As all four fairness estimates are significant at the 1 percent level,
the results are clearly in line with Proposition 1. The quantitative impact of these variables is
considerable, with coefficients ranging between 0.22 (hard work) and 0.57 (laziness).
16 The constant can be interpreted as the baseline SWB level of the reference group, which, in this specification, has low fairness perceptions, is male, has no children, is religious but not affiliated to a major religion, is divorced or separated from her partner, does not believe in a superior being, and never attends religious service.

26
Comparing these effects with those of other determinants of subjective well-being as reported
in the Appendix (Tables A1 and A2) shows that these effects are comparable with, e.g., taking
part in religious service once a month as compared to never (0.22) or being married as
compared to being divorced or separated (0.53). According to Table A2 in the Appendix, the
largest associations of about half a life satisfaction category are observable for labor market
mobility perceptions (‘people are poor due to laziness’ and ‘people have a chance to escape
poverty’) and ‘conservative ideology’. Further investigation shows that these relative
differences across fairness perception coefficients are not caused by changes in sample sizes
across regressions (not reported). In summary, our empirical results are in line with
Proposition 1, suggesting that persons who perceive the income generation process as fair
experience higher levels of subjective well-being.
Table 3: Relations between happiness and fairness perceptions – testing the transmission channels
(1) (2) (3) (4) hard work brings success in the long run 0.212*** number of observations 60730 people are poor due to laziness 0.501*** number of observations 62920 people have chance to escape poverty 0.433*** number of observations 59383 conservative ideology 0.363*** number of observations 146752 Income, education, occupational status yes yes yes yes Baseline micro controls included yes yes yes yes Country fixed effects included yes yes yes yes
Notes: OLS estimation. Dependent variable is life satisfaction measured on a 10-point scale. All models include the baseline micro-variables, wave, cohort and country effects (not reported). Income, education and occupational status are included. *, **, *** denote significances at the 10, 5 and 1 percent level, respectively.

27
According to the theoretical model above, perceived social mobility should have a
positive impact on individual human capital investments, expected life-time earnings and
occupational status in equilibrium, with perceived social mobility affecting subjective well-
being through these transmission channels. As our next step, we therefore test the same
empirical model specification including measures of education, income, and occupational
status. Table 3 reports the results and shows analogously to Table 2 that persons who perceive
themselves as living in a fair society experience higher levels of subjective well-being. In line
with our model, persons with higher income or better education are happier (for full
estimation results, again see Appendix Table A2). Comparing the fairness perception
estimates across models (Tables 2 and 3), we observe for all four fairness perception measures
smaller coefficient sizes in Table 3, with all differences statistically significant at the 1
percent level. For example, the coefficient on ‘people have the chance to escape poverty’ is
0.483 in Table 2, but only 0.433 in Table 3. Thus, the SWB effects of fairness and social
mobility perceptions are partly mediated through own human capital investment. This finding
is again in line with the theoretical model.
4.3. Testing Proposition 2: Fairness perception, demand for redistribution, and subjective
well-being
Table 4 tests the prediction of Proposition 2 that persons who perceive the income generating
process as fair are less favorable towards equalizing the income distribution, most probably
through redistribution from the rich to the poor. We estimate probit models for the four
fairness perception variables employed in the happiness models (Proposition 1) with three
dichotomous proxies of preference for income redistribution as dependent variables
(preference for ‘a more equal income distribution’, for ‘eliminating income inequality’, and
for ‘guaranteeing basic needs’, respectively). Due to missing observations in regressors and
regressants, not all 12 possible models could be estimated. For the larger samples, we observe
values of Pseudo R2 between 0.05 and 0.08, a reasonable size for comparable probit

28
estimations. Table 4 reports the coefficient estimates, its level of significance and the number
of observations in the regression sample.
Table 4: Fairness perceptions and the demand for income redistribution (1) (2) (3)
Incomes should be
more equal
importance to eliminate
income inequality
importance of guaranteeing basic needs
hard work brings success in the long run 0.097*** [8.44] marginal effect 0.035 number of observations 59325 Pseudo R2 0.0521
people are poor due to laziness, not injustice -0.230*** -0.311*** -0.249*** [20.79] [18.83] [10.92] marginal effect -0.082 -0.110 -0.034 number of observations 74588 28814 29114 Pseudo R2 0.0574
0.0792
0.063
people have chance to escape poverty -0.147*** [11.95] marginal effect -0.052 number of observations 57822 Pseudo R2 0.0505
conservative ideology -0.217*** -0.360*** -0.224*** [23.68] [19.69] [9.43] marginal effect -0.075 -0.134 -0.034 number of observations 128917 34193 34610 Pseudo R2 0.07
0.0847
0.0633
Country fixed effects included yes yes yes Income, education, occupational status no no no Baseline micro controls included yes yes yes
Notes: Probit estimations. Dependent variable is a dichotomous measure of preference for income redistribution. All models include other micro controls such as gender, age, family type, marital status, religion, religiosity, spirituality, cohort effects, country fixed effects and a wave dummy. Excluded from the model are measures of education, income, and occupational status. Missing regressions are due to insufficient sample sizes. *, **, *** denote significances at the 10, 5 and 1 percent level, respectively.

29
Almost all regressions in Table 4 suggest that people who perceive the income
generating process as fair are less in favor of redistribution through the government. This is
observable for the measures ‘poverty due to laziness’, ‘chance to escape poverty’ and
‘conservative ideology’. Notably, these individual ideology and perceived fairness effects are,
given that we employ country fixed effects, independent of 'national' beliefs and political
cultures. The marginal effects suggest that the effect of fairness perceptions decreases the
probability of demanding government activities by between 3 and 13 percent. Thus, the
results are in line with Proposition 2, suggesting that persons who believe in procedural
fairness oppose government redistribution.
Somewhat astonishing is the increase in the probability of favoring a more equal
income distribution expressed by persons who believe that ‘hard work brings success in the
long run’, possibly reflecting a modern version of Weber’s hypothesis of a Protestant work
ethic.17 Arguably, ‘having success’ is multidimensional, whereas ‘escaping poverty’ is one-
dimensionally related to gaining income only. However, as this variable can only be included
in model 1, we cannot draw a clear conclusion whether the positive sign is a statistical artifact
or indicates a generic relation.
Overall, the results in Table 4 support the prediction of Proposition 2 that perceived
social mobility reduces the demand for income redistribution from the rich to the poor.
Table 5 tests the second part of Proposition 2, which predicts a negative relation
between a preference for redistribution and individual welfare. This prediction translates into
our empirical model based on the WVS that persons with a preference for ‘a more equal
income distribution’, for ‘eliminating income inequality’, or for ‘guaranteeing basic needs’
(see Table 4) should report lower levels of subjective well-being. All three columns show
that, indeed, persons who demand a more equal income distribution (potentially through
government intervention) and guaranteed basic needs for everybody, are less satisfied with
their lives compared to those with no such preferences. With coefficient estimates between
17 In the traditional Calvinist view and according to their predestination theory, only the efforts of the ’blessed’ would yield economic success, in contrast to that by the ’lost souls’. Thus, economic success in ‘this world’ is perceived by Calvinists as a signal for being chosen to have a good afterlife.
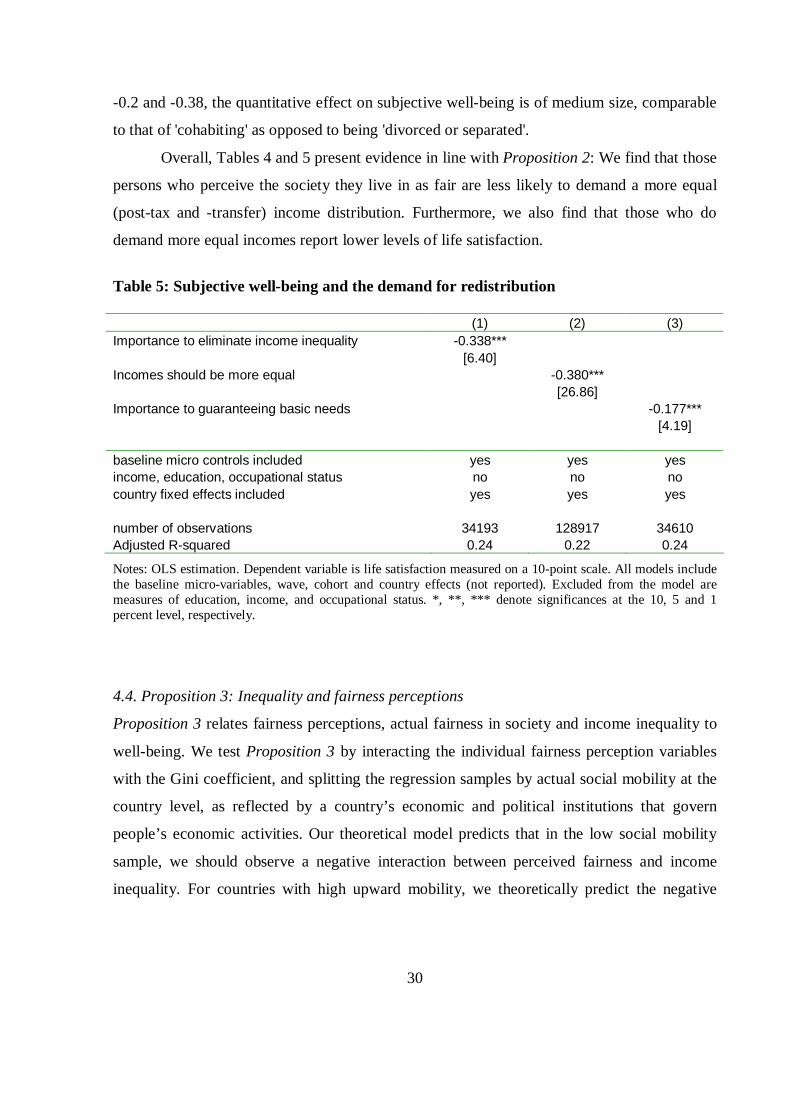
30
-0.2 and -0.38, the quantitative effect on subjective well-being is of medium size, comparable
to that of 'cohabiting' as opposed to being 'divorced or separated'.
Overall, Tables 4 and 5 present evidence in line with Proposition 2: We find that those
persons who perceive the society they live in as fair are less likely to demand a more equal
(post-tax and -transfer) income distribution. Furthermore, we also find that those who do
demand more equal incomes report lower levels of life satisfaction.
Table 5: Subjective well-being and the demand for redistribution
(1) (2) (3) Importance to eliminate income inequality -0.338*** [6.40] Incomes should be more equal -0.380*** [26.86] Importance to guaranteeing basic needs -0.177*** [4.19] baseline micro controls included yes yes yes income, education, occupational status no no no country fixed effects included yes yes yes number of observations 34193 128917 34610 Adjusted R-squared 0.24 0.22 0.24
Notes: OLS estimation. Dependent variable is life satisfaction measured on a 10-point scale. All models include the baseline micro-variables, wave, cohort and country effects (not reported). Excluded from the model are measures of education, income, and occupational status. *, **, *** denote significances at the 10, 5 and 1 percent level, respectively.
4.4. Proposition 3: Inequality and fairness perceptions
Proposition 3 relates fairness perceptions, actual fairness in society and income inequality to
well-being. We test Proposition 3 by interacting the individual fairness perception variables
with the Gini coefficient, and splitting the regression samples by actual social mobility at the
country level, as reflected by a country’s economic and political institutions that govern
people’s economic activities. Our theoretical model predicts that in the low social mobility
sample, we should observe a negative interaction between perceived fairness and income
inequality. For countries with high upward mobility, we theoretically predict the negative
31
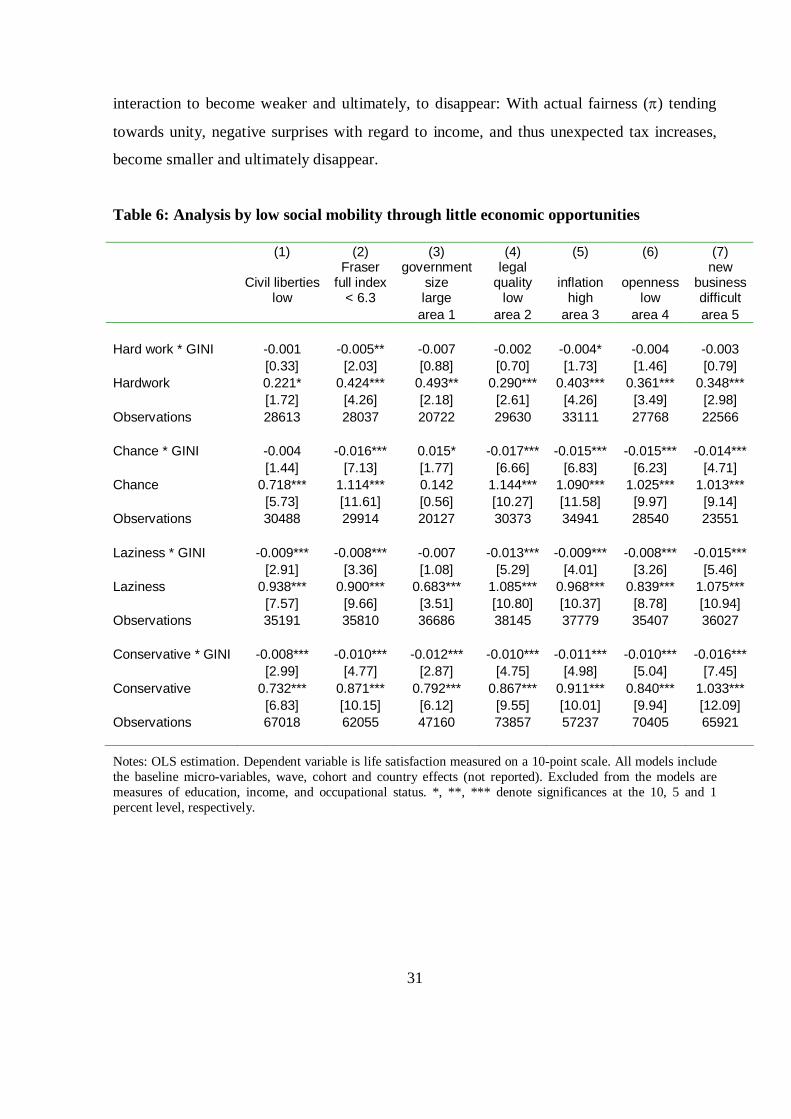
interaction to become weaker and ultimately, to disappear: With actual fairness () tending
towards unity, negative surprises with regard to income, and thus unexpected tax increases,
become smaller and ultimately disappear.
Table 6: Analysis by low social mobility through little economic opportunities (1) (2) (3) (4) (5) (6) (7)
Civil liberties
low
Fraser full index
< 6.3
government size large
legal quality
low inflation
high openness
low
new business difficult
area 1 area 2 area 3 area 4 area 5 Hard work * GINI -0.001 -0.005** -0.007 -0.002 -0.004* -0.004 -0.003 [0.33] [2.03] [0.88] [0.70] [1.73] [1.46] [0.79] Hardwork 0.221* 0.424*** 0.493** 0.290*** 0.403*** 0.361*** 0.348*** [1.72] [4.26] [2.18] [2.61] [4.26] [3.49] [2.98] Observations 28613 28037 20722 29630 33111 27768 22566 Chance * GINI -0.004 -0.016*** 0.015* -0.017*** -0.015*** -0.015*** -0.014*** [1.44] [7.13] [1.77] [6.66] [6.83] [6.23] [4.71] Chance 0.718*** 1.114*** 0.142 1.144*** 1.090*** 1.025*** 1.013*** [5.73] [11.61] [0.56] [10.27] [11.58] [9.97] [9.14] Observations 30488 29914 20127 30373 34941 28540 23551 Laziness * GINI -0.009*** -0.008*** -0.007 -0.013*** -0.009*** -0.008*** -0.015*** [2.91] [3.36] [1.08] [5.29] [4.01] [3.26] [5.46] Laziness 0.938*** 0.900*** 0.683*** 1.085*** 0.968*** 0.839*** 1.075*** [7.57] [9.66] [3.51] [10.80] [10.37] [8.78] [10.94] Observations 35191 35810 36686 38145 37779 35407 36027 Conservative * GINI -0.008*** -0.010*** -0.012*** -0.010*** -0.011*** -0.010*** -0.016*** [2.99] [4.77] [2.87] [4.75] [4.98] [5.04] [7.45] Conservative 0.732*** 0.871*** 0.792*** 0.867*** 0.911*** 0.840*** 1.033*** [6.83] [10.15] [6.12] [9.55] [10.01] [9.94] [12.09] Observations 67018 62055 47160 73857 57237 70405 65921
Notes: OLS estimation. Dependent variable is life satisfaction measured on a 10-point scale. All models include the baseline micro-variables, wave, cohort and country effects (not reported). Excluded from the models are measures of education, income, and occupational status. *, **, *** denote significances at the 10, 5 and 1 percent level, respectively.

32
Tables 6 and 7 present the estimates for perceived fairness and its interaction with
income inequality, the two main variables of interest, in subsamples split by measures of civil
liberties and economic opportunities.18 The measures we use to proxy for actual social
mobility are the Gastil index of civil liberties and the Fraser index of economic freedom.
Subindices of the full Fraser index cover aspects of government size, legal quality and
protection of property rights, inflation and the domestic financial market, trade openness and
access to foreign capital, and labor market regulation and other market rigidities that might
hamper entrepreneurial activities. In particular, column 1 employs the Gastil index of civil
liberties, while column 2 reports the results for the Full Fraser index. The remaining columns
employ subindices of the Fraser index that relate to the five specific areas described above.19
In the focus of our analysis are the interaction terms between income inequality and
perceived fairness. In line with Proposition 3, in the sample of countries with low economic
opportunities and rigid institutions (Table 6) we observe the expected negative effect, as
indicated by the negative interaction between GINI and the four fairness perception measures
(in most cases significant at the ten percent level at least). Given that the GINI coefficient
varies between 20 and 60 in the sample, the overall effect of fairness perception remains
positive, but is reduced in size as income inequality increases.
In Table 7, we report the results for the high social mobility countries. It turns out that
most coefficients are either statistically insignificant or negatively signed. The former would
be in line with our prediction for countries with near-utopian levels of actual fairness, while
the latter suggests that even countries with high values in the measures of economic
opportunities are still at a distance from the more utopian 1. However, the size of negative
effects is reliably and robustly smaller in high-fairness countries, which is very strongly in
line with our proposition 3, which predicted a weakening of the negative interaction.
Supporting the findings of Table 2, in both Tables 6 and 7 there is a positive association
between perceived fairness and the level of subjective well-being in most of the models.
18 The complete model also includes the other micro control variables, country fixed effects, and wave and cohort effects, with results similar to those reported in Table A1 in the Appendix. 19 For countries with high social mobility (Table 7), there is an insufficient number of observations for the subindices areas 1 and 2, so we cannot estimate these models.

33
Proposition 3 lets us expect a weakening of the negative interaction between fairness
perceptions and income inequality as actual social mobility in the countries increases, up to an
insignificant interaction in high mobility countries; the heterogeneous coefficient estimates in
Table 7 are thus consistent with our prediction. This finding is in line with Alesina et al.
(2004) who reported an insignificant impact of income inequality on people’s happiness in
socially very mobile U.S. states, but a negative one in less mobile European countries.
Table 7: Analysis by high social mobility through good economic opportunities (1) (2) (3) (4) (5)
Civil liberties
high
Fraser full index
> 6.2 inflation
low openness
high new business
easy area 3 area 4 area 5 Hard work * GINI -0.005** 0.001 0.001 -0.001 -0.005* [2.03] [0.21] [0.33] [0.17] [1.74] Hardwork 0.438*** 0.253** 0.22 0.315*** 0.436*** [4.98] [1.98] [1.57] [2.60] [3.82] Observations 31355 21319 16245 21588 26790 Chance * GINI -0.013*** 0.007** 0.005 0 -0.006** [5.78] [2.03] [1.15] [0.07] [2.10] Chance 0.929*** 0.097 0.165 0.486*** 0.620*** [9.77] [0.64] [1.00] [3.60] [4.90] Observations 28161 18535 13508 19909 24898 Laziness * GINI -0.002 -0.002 -0.007** -0.004 0.011*** [0.80] [0.71] [2.38] [1.24] [4.84] Laziness 0.508*** 0.407*** 0.573*** 0.515*** -0.03 [7.04] [4.37] [5.54] [5.31] [0.34] Observations 49436 38220 36251 38623 38003 Conservative * GINI -0.004** -0.004* -0.004** -0.002 0.004** [2.32] [1.86] [2.12] [0.87] [2.00] Conservative 0.527*** 0.454*** 0.468*** 0.440*** 0.218*** [8.20] [5.84] [6.13] [5.21] [2.82] Observations 78967 68787 73605 60437 64921
Notes: OLS estimation. Dependent variable is life satisfaction measured on a 10-point scale. All models include the baseline micro-variables, wave, cohort and country effects (not reported). Excluded from the model are measures of education, income, and occupational status. *, **, *** denote significances at the 10, 5 and 1 percent level, respectively. For area 1 and 2, the number of observations was too low.

34
4.5 Robustness tests using actual social mobility measures
The model in Tables 6 – 7 and the empirical corroboration of Proposition 3 hinges on the
assumption that social mobility, economic opportunities and economic freedom are
sufficiently correlated. As additional robustness test, we replicate the analyses using direct
measures of educational mobility. These direct measures are available for some OECD
countries only, implying the disadvantage that they substantially reduce the sample size.
Table 8 estimates the same model as in Tables 6 and 7 for two country samples split
by the degree of intergenerational educational mobility. We employ our measure of actual
educational mobility, defined as the educational advantage enjoyed by a person from a high-
education family (maternal or paternal education), which is available for a maximum of 27
OECD countries in our baseline sample. The sample is split at -22 and -27 test score points,
respectively. Again, we report only those regression results for which at least 10 countries
remain in each of the subsamples, resulting in two fairness perception measures (‘laziness’
and ‘conservative’). Columns 1 and 2 present the low educational mobility findings,
differentiated by either paternal or maternal family background (correlation coefficient: rho =
0.94); columns 3 and 4 display analogous regressions for countries with a high degree of
social mobility.
For all fairness perception measures, in low mobility countries the negative effect of
inequality for individuals with high fairness perceptions is clearly observable. Equally in line
with Proposition 3, in the high mobility country sample we observe insignificant or only
weakly significant interactions of inequality for the parents' educational background. The
positive sign of both coefficients can be interpreted as an indication that individuals who have
experienced upward social mobility in their family experience – and believe this to be the
result of fair institutions – experience an adverse impact of income redistribution on their
well-being. Again, we achieve corroborating results for those fairness perception measures
that are similar to those employed in previous empirical studies discussed above (e.g., Corneo
and Gruener, 2002, Alesina and LaFerrara, 2005).

35
Overall, the robustness test using educational mobility measures in Table 8 is well in
line with Proposition 3, with a negative interaction in low mobility countries, and
heterogeneous effects in the high mobility country sample.20
Table 8: Educational mobility, fairness perceptions and income inequality
(1) (2) (3) (4) Low mobility Low mobility High mobility High mobility father mother father mother Laziness 1.084*** 1.131*** 0.024 0.001 [7.72] [7.73] [0.14] [0.01] Laziness * GINI -0.022*** -0.023*** 0.007 0.008* [5.15] [5.21] [1.49] [1.75] Number of observations 22903 19951 13248 16200 Number of countries 14 13 10 11 Conservative 0.734*** 0.833*** 0.083 0.008 [5.58] [6.08] [0.61] [0.07] Conservative * GINI -0.009** -0.011*** 0.004 0.006* [2.37] [2.89] [1.12] [1.73] Number of observations 34835 30812 20180 24203 Number of countries 14 13 12 13
Notes: OLS estimation. Dependent variable is life satisfaction measured on a 10-point scale. All models include the baseline micro-variables, wave, cohort and country effects (not reported). Excluded from the model are measures of education, income, and occupational status. *, **, *** denote significances at the 10, 5 and 1 percent level, respectively.
To summarize, the empirical analysis clearly is in line with our theoretical hypotheses.
Individuals who perceive their society as unfair are less likely to be satisfied with their lives
(Proposition 1), and are more likely to oppose redistributive government activities
(Proposition 2). In low mobility countries, people fare the better, the more redistribution takes 20 In our view, it is not a coincidence that the process of industrialization and period of high growth in Europe and the United States (from 1790 on) was preceded by political reforms which abolished the competition-hindering and incentive-incompatible medieval guild system, which fixed production technology, prices for goods and wages for employees, and choice of profession. It is for this reason that we view GDP growth as a potential alternative measure of actual social mobility (correlation (GDP growth, social mobility): 0.4), in line with Hirschman and Rothschild (1973) who argue that in times of rapid economic growth income inequality is interpreted as higher opportunities. Regressions for country samples split by economic growth yield qualitatively identical findings compared to when more direct measures of social mobility are employed (see Appendix Table A3).

36
place, reflected in reduced income inequality. This effect is enlarged by lower mobility
perceptions: The positive effect of living in a fair society on well-being decreases as income
inequality rises. In contrast, in high mobility countries, we observe that people are more ready
to bear existing income inequalities and disfavor redistribution. Increasing perceived fairness
of the income generation process does not alter the well-being effects of income inequality
any more (Proposition 3). Because these findings provide an important qualification to some
standard results of elementary welfare economics, we proceed with a short discussion in the
concluding section.
5. Conclusions
The empirical literature on the relation between income inequality and happiness has yielded
ambiguous results. The starting point of this paper was that one of the potential reasons for
this confusion might be that people evaluate the fairness of the income distribution (i.e., the
distribution generation process) differently and that such subjective evaluations eventually
affect their subjective well-being. Extending the previous literature, we also make the case
that inequality assessments hinge on whether social mobility expectations meet actual societal
mobility or not.
We illustrate the relationship between inequality and subjective well-being in a small
formal model where individual effort and labor market participation depends on subjectively
perceived probabilities of success that, in turn, reflect fairness perceptions: The higher the
probability of success, the closer is the individually perceived connection between individual
effort and economic outcomes. We therefore in general expect a positive relationship between
perceived fairness and overall well-being, and a negative effect on the preference for
government redistribution. If ex ante fairness perceptions are sufficiently low, the individual
will choose an investment level of zero, and benefit from a reduction of income inequality
through taxes and transfers. We also distinguish between the effects of over- and
underestimation of the actual fairness of the income generating process. Low or high actual
fairness is associated with low or high upward mobility, respectively. We argue that in low

37
mobility countries, actual individual returns to effort are often lower than expected ones. This
leads to an unexpected increase of the budget-balancing tax burden, and thus to a negative
interaction between fairness perception and inequality for individuals who participate in the
labor market. In contrast, for high mobility countries, the model predicts an insignificant
coefficient for the interaction of fairness with inequality.
We test this model using combined individual-level data of the pooled third and fourth
waves of the World Values Survey (1994-2001), containing about 150’000 interviewed
individuals in 69 countries. According to the results, the respondents’ believe that income
inequality in society is the result of a comparably fair market process makes them
considerably more satisfied with their lives, while a demand for more government
redistribution for correcting the market-income distribution is negatively associated with
happiness. However, differentiating by level of actual social mobility in a country, in
countries with fewer economic opportunities we find evidence for a negative effect of
inequality for individuals with high fairness perceptions. In contrast, in countries with plenty
of economic opportunities and equal chances to success, the negative effect is either smaller
or disappears, depending on the measure used.
The findings obviously qualify the standard Lerner argument that more redistribution
and less income inequality leads to an increase in welfare of the average person, and thus, in
average welfare. Instead, the model and the empirical analysis suggest that for broad groups
of countries the potential effects of inequality depend on the interplay between perceived and
actual fairness of the institutional framework. The overall effect of inequality on subjective
well-being is thus much more ambiguous at the aggregate level of society than predicted by
many standard models. As such, our findings may hold implications for both policy and future
theorizing on the subject. Obviously, in terms of happiness there may be a substitutive effect
between developing institutions permitting fair market competition and social mobility, on the
one hand, and redistributive government activities, on the other: The latter are only essential if
actual social mobility is low but fairness perceptions are high. As human beings tend to be
overly optimistic in general, it would seem to be beneficial to overall welfare to implement
policies and institutions that foster competition and allow for equal opportunities and
38
economic freedom. This finding is quite in line with the definition of a just society often
brought forward by politically conservative persons, but also congruent with Hayek’s view of
a just world. Overall, our results suggest that creating a society with such equal opportunities
would be preferred over a paternalistic and overly redistributive state.

39
References
Alesina, A., R. DiTella and R. MacCulloch, 2004, Inequality and Happiness: Are Europeans
and Americans Different? Journal of Public Economics 88: 2009-2042.
Alesina, A. and E. La Ferrara, 2005, Preferences for redistribution in the land of
opportunities, Journal of Public Economics 89: 897-931.
Bergh, A., 2005, On the Counterfactual Problem of Welfare State Research: How Can We
Measure Redistribution? European Sociological Review 21, 4: 345-357.
Bjørnskov, C., A. Dreher and J.A.V. Fischer, 2008, Cross-country determinants of life
satisfaction: Exploring different determinants across groups in society, Social Choice
and Welfare 30: 119-173.
Blanchflower, D.G. and A.J. Oswald, 2004, Well-Being Over Time in Britain and the USA,
Journal of Public Economics 88: 1359-1386.
Clark, A.E., P. Frijters and M. Shields, 2008, Relative Income, Happiness, and Utility: An
Explanation for the Easterlin and Other Puzzles, Journal of Economic Literature 46:
95-144.
Clark, A. and E. D’Angelo, 2008, Upward Social Mobility, Wellbeing and Political
Preferences: Evidence from the BHPS, working paper, Paris School of Economics, 17
October 2008.
Corneo, G. and H.P. Gruener, 2002, Individual preferences for political redistribution,
Journal of Public Economics 83: 83-107.
Diener, E., R.E. Lucas, U. Schimmack and J. Helliwell, 2008, Well-Being for Public Policy,
Oxford, UK: Oxford University Press.
Dohmen, Th., A. Falk, D. Huffman, F. Marklein and U. Sunde, 2009, Biased Probability
Judgment: Evidence of Incidence and Relationship to Economic Outcomes from a
Representative Sample, Journal of Behavioral Organization, forthcoming.
Fehr, E. and K.M. Schmidt, 1999, A theory of fairness, competition, and cooperation,
Quarterly Journal of Economics 114: 817-868.
Ferrer-i-Carbonell, A. and P. Frijters, 2004, How Important is Methodology for the Estimates
of the Determinants of Happiness? The Economic Journal 114: 641–659.

40
Fischer, J.A.V., 2009a. Subjective Well-Being as Welfare Measure: Concepts and
Methodology, MPRA Paper 16619, University Library of Munich, Germany.
Fischer, J.A.V., 2009b, The Welfare Effects of Social Mobility, OECD Social, Employment
and Migration Working Papers 93, OECD, Directorate for Employment, Labour and
Social Affairs.
Fischer, J.A.V., 2009c, Happiness and Age Cycles – Return to Start...?: On the Functional
Relationship between Subjective Well-being and Age, OECD Social, Employment and
Migration Working Papers 99, OECD, Directorate for Employment, Labour and
Social Affairs.
Freedom House, 2007, Freedom in the World Country Ratings.
Frey, B. and A. Stutzer, 2005, Beyond outcomes: measuring procedural utility, Oxford
Economic Papers 57: 90-111.
Grosfeld I. and C. Senik, 2009, The emerging aversion to inequality - Evidence from long
subjective data, PSE Working Papers 2008-19, PSE (Ecole normale supérieure).
Gwartney, J. and R. Lawson, 2008, Economic Freedom of the World: 2008 Annual Report.
Hayek, F.A., 1944, The Road to Serfdom, Chicago: University of Chicago Press.
Hopkins, E., 2008, Inequality, Happiness and Relative Concerns: What Actually is their
Relationship? Journal of Economic Inequality 6: 351-372.
Hirschman, A. and M. Rothschild, 1973, The changing tolerance for income inequality in the
course of economic development, Quarterly Journal of Economics 87: 544-566.
Inglehart, R., M. Basañez, J. Díez-Medrano, L. Halman and R. Luijkx, 2004, Human Beliefs
and Values, Ann Arbor: University of Michigan Press.
Layard, R., G. Mayraz and S. Nickell, 2009, Does Relative Income Matter ? Are the Critics
Right? CEP Discussion Paper No 918, March 2009.
Lerner, A., 1944, The economics of control: principles of welfare economics, New York:
MacMillan.
Mitchell, G., P.E. Tetlock, B.A. Mellers and L.D. Ordóñez, 1993, Judgments of social justice:
compromises between equality and efficiency, Journal of Personality and Social
Psychology 65: 629-639.

41
Piketty, T., 1995, Social Mobility and Redistributive Politics, Quarterly Journal of Economics
110: 551-584.
Ravillion, M. and M. Lokshin, 2000, Who wants to redistribute? The tunnel effect in 1990s
Russia, Journal of Public Economics 76: 87-104.
Roemer, J.E., 1998, Theories of distributive justice, Harvard University Press: 1998.
Scott, J.T., R.E. Matland, P.A. Michelbach and B.H. Bornstein, 2001, Just deserts: an
experimental study of distributive justice norms, American Journal of Political
Science 45: 74-767.
Stutzer, A., and B.S. Frey, 2003, Institutions Matter for Procedural Utility: An Economic
Study of the Impact of Political Participation Possibilities, in: R. Mudambi et al.
(eds.), Economic Welfare, International Business and Global Institutional Change,
Edward Elgar, Cheltenham, 81-99.
UNU, 2006, World income inequality database v2.0. Helsinki: United Nations University-
World Institute for Development Economics Research.
Veblen, T., 1899, The Theory of the Leisure Class, New York: MacMillan.
Veenhoven, R., 2000, The four qualities of life: Ordering concepts and measures of the good
life, Journal of Happiness Studies 1: 1-39.
Appendix
To keep the CESifo working paper as short as possible, Appendix tables have been deleted from the manuscript. They can be found in the identical online-version version of the paper (MPRA Paper 25826) downloadable from http://ideas.repec.org or http://mpra.repec.org.

CESifo Working Paper Series for full list see Twww.cesifo-group.org/wp T (address: Poschingerstr. 5, 81679 Munich, Germany, [email protected])
___________________________________________________________________________ 3152 Lorenzo C. G. Pozzi, Casper G. de Vries and Jorn Zenhorst, World Equity Premium
Based Risk Aversion Estimates, August 2010 3153 Volker Grossmann, Thomas M. Steger and Timo Trimborn, Dynamically Optimal R&D
Subsidization, August 2010 3154 Alexander Haupt, Tim Krieger and Thomas Lange, A Note on Brain Gain and Brain
Drain: Permanent Migration and Education Policy, August 2010 3155 António Afonso and Christophe Rault, Long-run Determinants of Sovereign Yields,
August 2010 3156 Franziska Tausch, Jan Potters and Arno Riedl, Preferences for Redistribution and
Pensions. What can we Learn from Experiments?, August 2010 3157 Martin Kolmar and Andreas Wagener, Inefficient Group Organization as Optimal
Adaption to Dominant Environments, August 2010 3158 Kai Carstensen, Klaus Wohlrabe and Christina Ziegler, Predictive Ability of Business
Cycle Indicators under Test: A Case Study for the Euro Area Industrial Production, August 2010
3159 Horst Rottmann and Timo Wollmershäuser, A Micro Data Approach to the
Identification of Credit Crunches, August 2010 3160 Philip E. Graves, Appropriate Fiscal Policy over the Business Cycle: Proper Stimulus
Policies Can Work, August 2010
3161 Michael Binder and Marcel Bluhm, On the Conditional Effects of IMF Program Participation on Output Growth, August 2010
3162 Michael Binder, Qianying Chen, and Xuan Zhang, On the Effects of Monetary Policy
Shocks on Exchange Rates, August 2010
3163 Felix J. Bierbrauer, On the Optimality of Optimal Income Taxation, August 2010 3164 Nikolaus Wolf, Europe’s Great Depression – Coordination Failure after the First World
War, September 2010 3165 Dan Kovenock and Brian Roberson, Conflicts with Multiple Battlefields, September
2010 3166 Jean-Pierre Ponssard and Catherine Thomas, Capacity Investment under Demand
Uncertainty. An Empirical Study of the US Cement Industry, 1994-2006, September 2010

3167 Jørgen Juel Andersen, Jon H. Fiva and Gisle James Natvik, Voting when the Stakes are
High, September 2010 3168 Michael Hoel, Is there a Green Paradox?, September 2010 3169 Scott Alan Carson, Nineteenth Century US African-American and White Female
Statures: Insight from US Prison Records, September 2010 3170 Gil S. Epstein, Yosef Mealem and Shmuel Nitzan, Political Culture and Discrimination
in Contests, September 2010 3171 Sara Fisher Ellison, Jeffrey Greenbaum and Wallace P. Mullin, Diversity, Social Goods
Provision, and Performance in the Firm, September 2010 3172 Silvia Dominguez-Martinez, Randolph Sloof and Ferdinand von Siemens, Monitoring
your Friends, not your Foes: Strategic Ignorance and the Delegation of Real Authority, September 2010
3173 Marcus Dittrich and Beate Schirwitz, Union Membership and Employment Dynamics:
A Note, September 2010 3174 Francesco Daveri, Paolo Manasse and Danila Serra, The Twin Effects of Globalization
– Evidence from a Sample of Indian Manufacturing Firms, September 2010 3175 Florian Blöchl, Fabian J. Theis, Fernando Vega-Redondo and Eric O’N. Fisher, Which
Sectors of a Modern Economy are most Central?, September 2010 3176 Dag Morten Dalen, Marilena Locatelli and Steinar Strøm, Longitudinal Analysis of
Generic Substitution, September 2010 3177 Armin Falk, Stephan Meier and Christian Zehnder, Did we Overestimate the Role of
Social Preferences? The Case of Self-Selected Student Samples, September 2010 3178 Christian Fahrholz and Cezary Wójcik, The Bail-Out! Positive Political Economics of
Greek-type Crises in the EMU, September 2010 3179 Klaus Abberger and Wolfgang Nierhaus, The Ifo Business Cycle Clock: Circular
Correlation with the Real GDP, September 2010 3180 Walter Krämer and Gerhard Arminger, “True Believers” or Numerical Terrorism at the
Nuclear Power Plant, September 2010 3181 Bernard M.S. Van Praag, Dmitri Romanov and Ada Ferrer-i-Carbonell, Happiness and
Financial Satisfaction in Israel. Effects of Religiosity, Ethnicity, and War, September 2010
3182 Dimitrios Koumparoulis and Paul De Grauwe, Public Capital, Employment and
Productivity: An Empirical Investigation for Greece, September 2010

3183 John Whalley and Tanmaya Shekhar, The Rapidly Deepening India-China Economic
Relationship, September 2010 3184 Andreas Schäfer and Thomas Steger, History, Expectations, and Public Policy:
Economic Development in Eastern Germany, September 2010 3185 Thomas Eichner and Marco Runkel, Subsidizing Renewable Energy under Capital
Mobility, September 2010 3186 Konstantinos Angelopoulos and James Malley, Fear of Model Misspecification and the
Robustness Premium, September 2010 3187 Philip E. Graves, A Note on the Design of Experiments Involving Public Goods,
September 2010 3188 Glenn Ellison, How does the Market Use Citation Data? The Hirsch Index in
Economics, September 2010 3189 Barbara Hanel and Regina T. Riphahn, The Employment of Mothers – Recent
Developments and their Determinants in East and West Germany, September 2010 3190 Alexander Haupt and Silke Uebelmesser, Integration, Mobility, and Human Capital
Formation, September 2010 3191 Vincenzo Galasso and Paola Profeta, When the State Mirrors the Family: The Design of
Pension Systems, September 2010 3192 Stéphane Zuber and Geir B. Asheim, Justifying Social Discounting: The Rank-
Discounted Utilitarian Approach, September 2010 3193 Alexander Kemnitz, Educational Federalism and the Quality Effects of Tuition Fees,
September 2010 3194 Claudia M. Buch, Sandra Eickmeier and Esteban Prieto, Macroeconomic Factors and
Micro-Level Bank Risk, September 2010 3195 May Elsayyad and Kai A. Konrad, Fighting Multiple Tax Havens, September 2010 3196 Laszlo Goerke and Markus Pannenberg, Trade Union Membership and Dismissals,
September 2010 3197 Ferdinand Mittermaier and Johannes Rincke, Do Countries Compensate Firms for
International Wage Differentials?, September 2010 3198 John Boyd, Gianni De Nicoló and Abu M. Jalal, Bank Competition, Asset Allocations
and Risk of Failure: An Empirical Investigation, September 2010 3199 Guido Heineck and Bernd Süssmuth, A Different Look at Lenin’s Legacy: Trust, Risk,
Fairness and Cooperativeness in the two Germanies, September 2010

3200 Ingvild Almås, Tarjei Havnes and Magne Mogstad, Baby Booming Inequality?
Demographic Change and Earnings Inequality in Norway, 1967-2000, October 2010 3201 Thomas Aronsson and Sören Blomquist, The Standard Deviation of Life-Length,
Retirement Incentives, and Optimal Pension Design, October 2010 3202 Thorvaldur Gylfason and Eduard Hochreiter, Growing Together: Croatia and Latvia,
October 2010 3203 Ken Burdett and Melvyn Coles, Tenure and Experience Effects on Wages: A Theory,
October 2010 3204 Wendy Carlin, Good Institutions are not enough: Ongoing Challenges of East German
Development, October 2010 3205 Tobias König and Andreas Wagener, Tax Structure and Government Expenditures
under Tax Equity Norms, October 2010 3206 Daniel W. Sacks, Betsey Stevenson and Justin Wolfers, Subjective Well-Being, Income,
Economic Development and Growth, October 2010 3207 Mario Larch and Wolfgang Lechthaler, Why “Buy American” is a Bad Idea but
Politicians still Like it, October 2010 3208 Guglielmo Maria Caporale and Luis A. Gil-Alana, US Disposable Personal Income and
Housing Price Index: A Fractional Integration Analysis, October 2010 3209 Bruno S. Frey, Withering Academia?, October 2010 3210 Eva Mörk, Anna Sjögren and Helena Svaleryd, Childcare Costs and the Demand for
Children – Evidence from a Nationwide Reform, October 2010 3211 Dan Kovenock, Brian Roberson and Roman M. Sheremeta, The Attack and Defense of
Weakest-Link Networks, October 2010 3212 Shmuel Nitzan and Kaoru Ueda, Prize Sharing in Collective Contests, October 2010 3213 Erling Eide, Kristine von Simson and Steinar Strøm, Rank Dependent Utility, Tax
Evasion and Labor Supply, October 2010 3214 Thomas Eichner and Marco Runkel, Interjurisdictional Spillovers, Decentralized
Policymaking and the Elasticity of Capital Supply, October 2010 3215 Susan Athey and Glenn Ellison, Dynamics of Open Source Movements, October 2010 3216 Christian Bjørnskov, Axel Dreher, Justina A.V. Fischer and Jan Schnellenbach,
Inequality and Happiness: When Perceived Social Mobility and Economic Reality do not Match, October 2010