Embed Size (px)
Citation preview

Growth in Special Materials and Its Impact on EstimatingBy Hans LittooyVice President, Consulting and Professional
Services, Mitchell Auto Physical Damage
Industry Trends
Report
Published by Mitchell InternationalVolume Seventeen Number One Q1 2017
APD Edition
Volume Seventeen Number One
The Industry Trends Report is published by Mitchell.The information contained in this publication (i) was obtained from sources deemed reliable; (ii) is provided for informational purposes only; (iii) should not be construed as legal or regulatory advice on any specific subject matter; and (iv) Mitchell does guarantee the accuracy or completeness of the information provided. You should not act on the basis of any content in the publication without seeking legal or other professional advice to address a specific customer issue. This publication is intended to provide general information and may not reflect the most current legal or regulatory environment or address your situation specifically. Mitchell disclaims all liability for a customer’s acts or omissions related to the content of this publication. Mitchell and the Mitchell logo and all associated logos and designs are registered and unregistered trademarks of Mitchell International, Inc. All other trademarks, service marks and copyrights are the property of their respective owners.
Industry Trends
ReportTable of Contents
4 Five P&C Industry Hot Topics and the Trends Fueling them
10 Growth in Special Materials and Its Impact on Estimating
14 Average Length of Rental for Repairable Vehicles
18 Current Events in the Collision Industry
30 Motor Vehicle Markets
32 Mitchell Collision Repair Industry Data
39 Total Loss Data
40 Canadian Collision Summary
44 About Mitchell
45 Mitchell in the News

A Message from the CEO
What’s Hot in the P&C Industry?
Welcome to the Q1 edition of the 2017 Mitchell Auto Physical
Damage Industry Trends Report. As you may remember from
our last issue, we shared insights about top trends covered at
our annual conference. In this issue, we take a close look at
five hot topics in business today, explore the technology and
social trends that are fueling them, and share what they may
mean for the P&C industry and collision repairers.
In our feature article, Growth in Special Materials and Its
Impact on Estimating, author Hans Littooy provides an
overview of the growth of specialty materials and explains
that while they are new for U.S. and Asian brands, higher-end
European brands have been using them for decades. Hans
elaborates on the impact to estimating and repairs and
advises how shops and carriers can address the issue
of specialty materials.
Throughout the year, we’ll continue to follow the topics and
trends that impact your organization, both here on these
pages and on the Mitchell blog, and explore what they may
mean for the industry. I look forward to sharing more insights
with you in future issues and hearing how these topics and
trends are impacting your business.
Alex Sun President and CEO Mitchell
Q1 2017
Alex Sun President and CEO, Mitchell
View the Casualty Edition
FIVE P&C INDUSTRY HOT TOPICS AND THE TRENDS FUELING THEM
In this quarter’s Industry Trends Report, Mitchell takes a close look at five of the hottest topics in the Property & Casualty industry today and the technology and social trends that are fueling them.
Throughout the year, we’ll continue to follow these topics and trends, both here on these pages and on the Mitchell blog, and explore what they may mean for both the Property & Casualty industry and for collision repairers.

55
TECHNOLOGY TRANSFORMATION Does virtual reality have practical applications for the
P&C and collision repair industries? While it may be
too soon to say what the overall impact will be, we
are seeing interesting applications that go beyond
entertainment. Virtual reality is being used to train
doctors, create architectural models, and test the
safety of new car models in a virtual setting before
manufacturing them.
It’s easier to see the potential benefits of augmented
reality. It could, for instance, be used to guide
complex repairs in high-risk environments, possibly
minimizing injuries. In addition, as automotive repairs
become more complex, technology like this could
be used to ensure repairs are done correctly so that
vehicles are safe to return to the road.
Meanwhile, the Internet of Things is experiencing
explosive growth. Markets and Markets predicts a
compound annual growth rate of 33 percent
through 2021—an increase in market value of more
than $500 billion. Connected home devices can
enhance safety, security and energy efficiency, but
do they present a cybersecurity risk? And will people
need insurance for that? Wearables can help prevent
on-the-job injuries and facilitate a return to health,
but there is still much to be worked out in terms of
privacy and data ownership. And connected cars are
delivering real-time information about the status of
a vehicle as well as driving new insurance models
like usage-based insurance.
We’d be remiss if we didn’t mention autonomous
vehicles. We’re closely following both advancement
and adoption of the technology across the world.
In fact, a trial is getting underway here in
our hometown of San Diego, and we can’t help
but wonder what Glenn Mitchell would think!
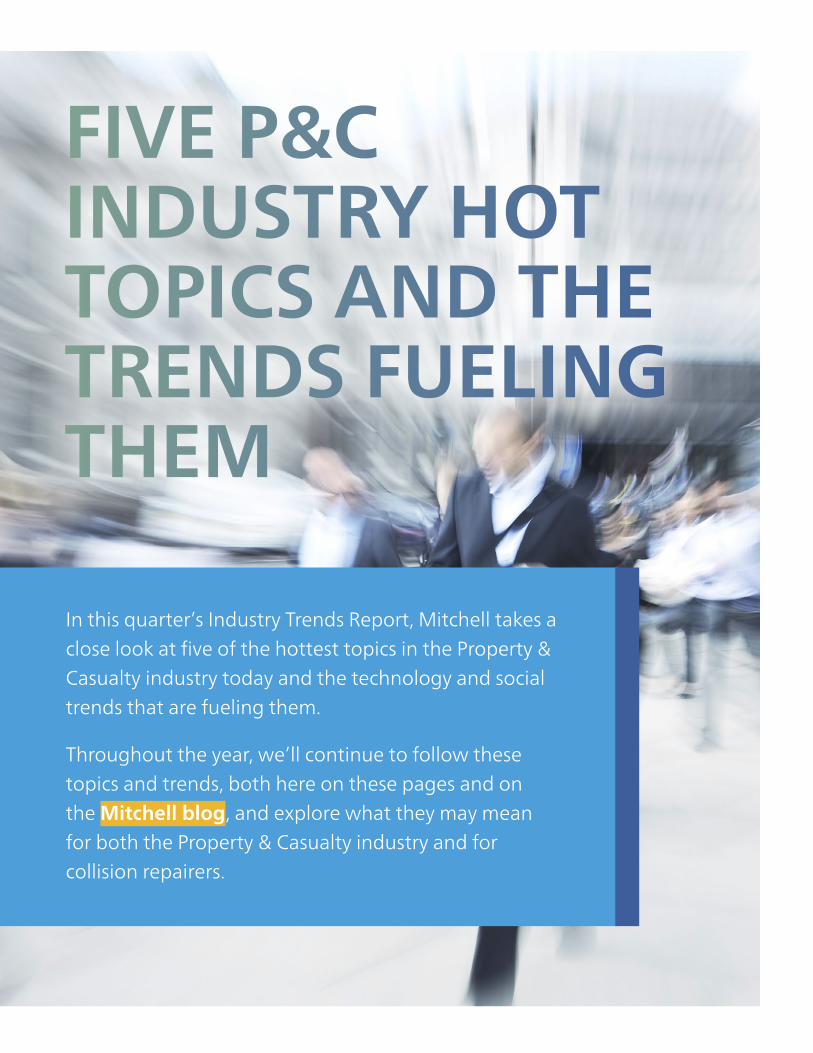
OPERATIONAL EXCELLENCE
It’s been four short years since IBM’s Watson
famously beat Ken Jennings at Jeopardy, and in
that time, it’s been commercialized and put to
practical use fighting cancer, building legal cases
and preventing cybercrime. Cognitive computing
technology like Watson is being used to make
sense of big data—and having a big impact across
verticals, including the insurance industry.
Closer to home, advanced analytics and visualized
data, when applied at key points throughout the
claims lifecycle, are helping insurers make more
informed decisions around claims. This could
potentially save time, reduce costs and lead to
better outcomes, both for their businesses and for
their customers.
Behind the scenes, insurers are moving both
legacy systems and back-office operations to
cloud infrastructure. DevOps is another IT-centric
trend. More of a cultural movement than
a methodology, DevOps encourages
communications and collaboration between
development and operations and uses automation
to deliver quality software quickly.
Trends that are not new but remain as relevant
as ever—insurers continue to seek ways to use
technology to streamline workflows, automate
simple, repetitive tasks, reduce administrative
costs and navigate an incredibly dynamic
regulatory environment.
And last, but by no means least, blockchain,
the distributed ledger technology behind the
digital currency Bitcoin, is finally coming into its
own. Deloitte named it a key trend for 2017,
saying, “Blockchain may improve data storage
and protection, and enable more efficient policy
execution via smart contracts.” IBM, for its part, is
building an entire ecosystem around it.
COGNITIVE COMPUTING
TECHNOLOGY LIKE WATSON IS
BEING USED TO MAKE SENSE
OF BIG DATA—AND HAVING
A BIG IMPACT ACROSS
VERTICALS, INCLUDING THE
INSURANCE INDUSTRY.

77
THE EVOLUTION OF WORK
Henry Ford wasn’t the first person
to institute the five-day workweek,
but he certainly popularized the
model when he implemented it in
his factories in 1916. A hundred
years or so later, manufacturers are
starting to turn from assembly lines to
automation. The impact of automation
is yet to be seen: a McKinsey study
suggests that while 45 percent of the
2,000 work activities they looked at
could be automated with currently
available technologies, less than five
percent of occupations can be entirely
automated. In addition, they caution
that those changes could take years.
Automation isn’t the only trend at
play. Fueled by technology, the gig
economy, the share economy and on-
demand workforce, in all their various
permutations, continue to grow. Intuit
predicts that more than 40 percent
of the workforce will be comprised of
contingent workers by 2020.
Adding to the complexity, the
insurance workforce is in flux.
70,000 insurance professionals are
expected to retire this year. One way
to combat that loss of institutional
knowledge and experience is to
embed access to relevant information
right there within the claims
workflows. And while this may help
incoming millennial talent get up
to speed, insurers will need to
implement new programs to attract
and retain them—especially since
65 percent of them do not have a
positive take on the industry.
Another thing to think about:
members of the enterprise, who as
consumers have on-demand access to
just about everything in their personal
lives, will demand the same of their
business applications.
70,000insurance professionals are expected to retire in 2017*
*EY 2017 Property-Casualty Insurance Outlook

CUSTOMER EXPERIENCE
In their 2017 U.S. Property & Casualty Insurance
Outlook, EY provides a strategic roadmap for driving
profitable growth. Number one among their four
priorities is a focus on customer-driven innovation.
Today, the average consumer owns 3.64 connected
devices. We all recognize that this ubiquity of digital
devices has changed the way consumers choose
to interact. Now, the nature of digital interactions
themselves is changing. The use of voice-first
browsing devices like Google Home and Amazon
Echo is on the rise: Gartner predicts that by 2020,
30 percent of web browsing will be done without a
screen at all.
Further, Gartner predicts that by 2020 there will
be a 20 percent decline in mobile app use. Instead,
more consumers are turning to chatbots that don’t
require an app interface. Chatbots use artificial
intelligence and natural language processing to
automate simple tasks and interactions, often
between company and customer. In many cases, the
experience is so authentic, that the customer might
not realize a chatbot is on the other end.
Will human interactions become a thing of the
past? Or perhaps we’ll see a premium placed on
them? One thing is certain—listening to customers
is more important than ever, as is nurturing a culture
of innovation that enables a rapid and effective
response to customers’ ever-evolving wants and
needs, both in the way they communicate and for
products and services.
20%
MOBILEAPPUSE
DECLINE BY 2020*
*Gartner's Top 10 Strategic Predictions for 2017 and Beyond

99
What the unprecedented pace of technology
transformation suggests is that companies of
all types, including those in the P&C insurance
ecosystem, must innovate to respond to changing
consumer wants and needs. Companies with a
culture of innovation may have a competitive
advantage in this regard.
According to a PWC report, engaged employees
put in 57 percent more effort on the job and are
87 percent less likely to resign than disengaged
employees, so an engaged workforce can have
an important impact on a company’s overall
success. But how do companies create an engaged
workforce? As MG Kristian, Senior Vice President
of Human Resources at Mitchell advises, “It takes a
conscious commitment from leadership across the
company and deliberate action to drive culture into
all aspects of the business.”
Engaging millennials is becoming more important
than ever. They are expected to make up 46 percent
of the U.S. workforce by 2020, and according to a
Deloitte study, tying corporate social responsibility
to their own values and volunteerism is an important
component of the engagement equation.
From an IT standpoint, CIOs and CTOs are also
under pressure to create a culture of innovation
that drives employee engagement. It’s a delicate
balance that Mitchell CTO Erez Nir sums up nicely:
“We are challenged to be technology visionaries,
to foster innovation and create an engaged and
effective workforce, and we must do all this while
also keeping pace with advances in technologies
and evolving modern infrastructure that supports
company strategy and objectives.”
CORPORATE CULTURE AS BUSINESS STRATEGY
CIOs and CTOs are challenged to be technology visionaries, to foster innovation and create an engaged and effective workforce.Erez Nir, Executive Vice President and Chief Technology Officer, Mitchell
1010
By Hans LittooyVice President, Consulting and Professional Services, Mitchell Auto Physical Damage
Growth in Special Materials and Its Impact on Estimating
Feature Article
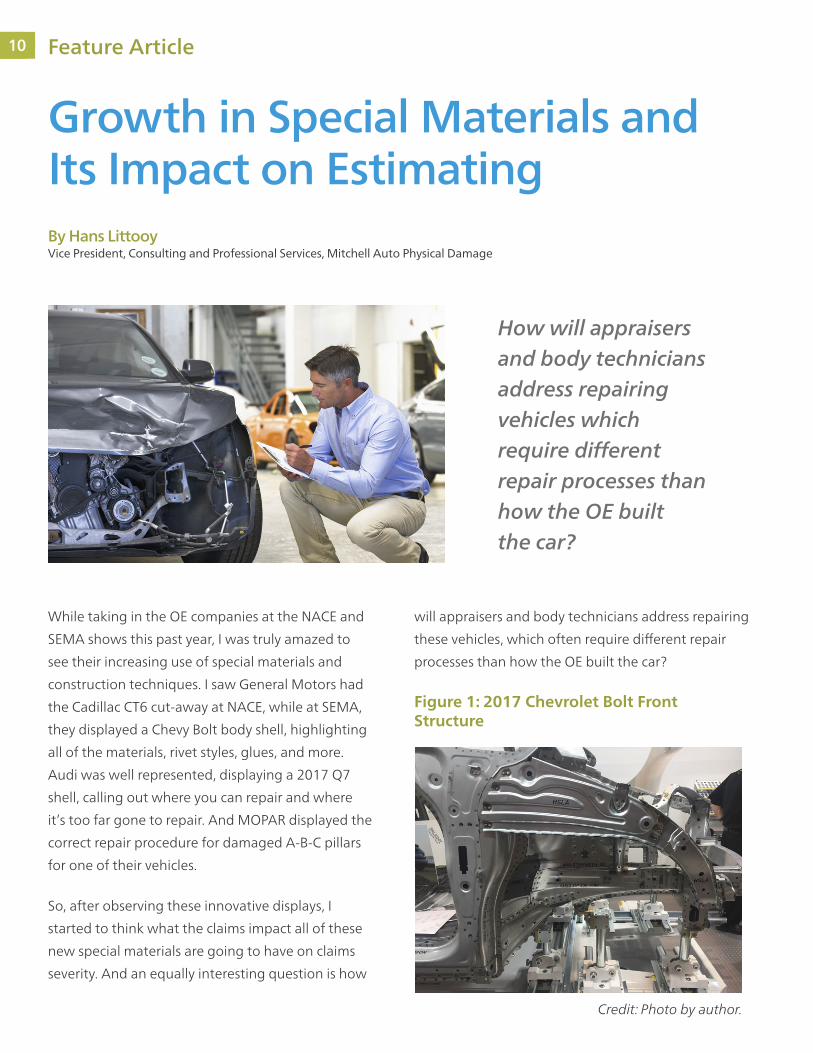
While taking in the OE companies at the NACE and
SEMA shows this past year, I was truly amazed to
see their increasing use of special materials and
construction techniques. I saw General Motors had
the Cadillac CT6 cut-away at NACE, while at SEMA,
they displayed a Chevy Bolt body shell, highlighting
all of the materials, rivet styles, glues, and more.
Audi was well represented, displaying a 2017 Q7
shell, calling out where you can repair and where
it’s too far gone to repair. And MOPAR displayed the
correct repair procedure for damaged A-B-C pillars
for one of their vehicles.
So, after observing these innovative displays, I
started to think what the claims impact all of these
new special materials are going to have on claims
severity. And an equally interesting question is how
will appraisers and body technicians address repairing
these vehicles, which often require different repair
processes than how the OE built the car?
How will appraisers and body technicians address repairing vehicles which require different repair processes than how the OE built the car?
Figure 1: 2017 Chevrolet Bolt Front Structure
Credit: Photo by author.
11

First, Let’s See Why Special Materials Are Used in Vehicle ConstructionDue to ever-increasing CAFE and vehicle safety
standards, the OEs are in an epic battle to create
lighter yet safer cars. For the equivalent weight,
aluminum crash energy absorption is twice that of
steel, permitting the design of larger crush zones
without weight penalties. And by using lighter and
stronger materials on vehicles—which permits
more efficient engines and safer structures—it’s
projected that drivers can save 5 billion gallons
of fuel by 2030.¹
If you look at the history of special materials used in
vehicles, the use of aluminum is not all that new. At
the end of WWII, a combination of steel shortages
and the observation of corrosion resistance led Land
Rover to utilize aluminum (actually Birmabright,
an aluminum/magnesium alloy) as the primary
metal for its body panels and has continued using
aluminum for body panels ever since. Other high-end
Euro models since the mid-90s have used aluminum,
starting with the 1993 Audi A8. What’s changed
though is within the past five years, the major US and
Lightweight Material Mass Reduction
Magnesium 30–70%
Carbon fiber composites 50–70%
Aluminum and Al matrix composites
30–60%
Titanium 40–55%
Glass fiber composites 25–35%
Advanced high-strength steel
15–25%
High-strength steel 10–28%
Table 1: Mass Reduction Benefits of alternative materials to conventional steel¹
Japanese auto manufacturers have started to use
high-strength steel, aluminum, and other materials
to improve fuel efficiency and vehicle safety.
Analyzing the Claims Data for Vehicles with Special MaterialsBased on Mitchell’s editorial database and claims
data, we have seen the following growth in vehicles
with special materials (HSLA, HSS, AHSS, Aluminum,
PHS and more):
As Table 2 shows on the next page, within the past
5 years, estimates written for vehicles with special
materials have grown from just over 3% to over 19%.
Also note the average severity difference between
vehicles with specialty materials vs conventional
vehicles. While the difference has decreased from
$576 premium per vehicle with specialty materials
in 2012 to $458 in 2017, this still represents a repair
severity premium of 15.7% for vehicles with special
materials.
Special Materials Mean Special Procedures When It Comes to Estimating and ReparabilityOne of the direct results of using special materials
is the complex manufacturing process required,
including electronic laser beam welding, rivets, and
structural adhesives used to join dissimilar metals.
Because of the difficulty of replicating OE
manufacturing processes, many OEs recommend a
different repair procedure than how the OE originally
manufactured the vehicle.
Examples include the latest BMW 3 Series, the
Lincoln MKC, and the new Cadillac CT6. While the
OE laser welded the quarter panels to the body
structure, BMW strictly recommends using structural
adhesives when replacing a damaged quarter panel.
For the CT6, while the factory used a combination of
1111 Feature Article

12 Feature Article
structural adhesives and laser beam welding to marry
the dissimilar metals together, for the repair, the
factory recommends rivets and structural adhesives.
As a result of the expanded used of specialty
materials, more and more repair facilities are
investing in obtaining the necessary equipment,
training, and skills required to obtain certification
for the repairs. And with the specialization and
training, labor costs have increased.
Helping the Technicians by Calling Out Special MaterialsOver the years, Mitchell’s Editorial Staff has been
continually updating our database with specially
designed graphics to reflect any components
designated by the OE as special materials. This can
include anything from HSLA to Aluminum to Carbon
and are uniquely colored in the Mitchell graphics. In
addition, within the detail notes, reference is made
Table 2: Estimates with Special Materials on Vehicles and Claims Severity Impact
if OE specific repair procedures are required. When it
comes to software solutions for technicians, Mitchell
offers the RepairCenter™ TechAdvisor repair data
solution that includes available links directly from
the estimating page.
Figure 2: Mitchell Color Coded Special Materials Graphics
13

About the author…
Hans Littooy Vice President, Consulting and Professional Services, Mitchell Auto Physical Damage
We are pleased to welcome Hans Littooy as a
new contributor to the Industry Trends Report.
Hans Littooy is Mitchell’s Vice President, APD
Consulting and Professional Services. He joined
Mitchell’s Product Management team in August
2003, where he led the release of Mitchell’s
highly successful WorkCenter™ Review Suite
and was awarded two patents for innovations
in estimating compliance. In 2009, Hans
transitioned into his current role, leading a
team of consultants who assist our carriers with
achieving measurable improvements in their
claims workflow and efficiency.
Hans began his career designing rocket engines
for NASA’s expendable launch vehicle programs
in the late 1980s and later served in product
management for Cummins Engine Company
and Caterpillar’s Gas Turbine division. Hans is
originally from the Pacific Northwest, earning his
BS in Mechanical Engineering from Washington
State University and later a Master’s in Business
from the University of Michigan.
Hans is hands-on in the collision industry, where
he enjoys restoring classic 1960s muscle cars—
and performs all the body and paint work himself!
Lastly, recognizing the fact that different skills sets
may be required for repairs that involve specialty
materials, Mitchell will be enhancing our estimating
platforms to give the appraiser the ability to charge
different labor rates for those materials.
ConclusionIt’s a guarantee we can expect to see the continued
expansion of special materials in vehicles, with
projections of 90% growth in the use of High-
Strength Steel by 2025 . For appraisers, they need
to be aware of these materials to ensure proper
repair techniques are followed and also reflect the
appropriate labor rates for those repairs. For carriers,
because of the increase in severity potential for
vehicles using special materials, they need to ensure
policies are properly priced and claims department’s
budgets reflect the increased exposure to vehicles
with special materials.
Figure 3: Labor Rate Profile within Mitchell Estimating. Available Summer of 2017.
¹ Reference: VEHICLE TECHNOLOGIES OFFICE: LIGHTWEIGHT MATERIALS FOR CARS AND TRUCKS, Energy.gov. https://energy.gov/eere/vehicles/vehicle-technologies- office-lightweight-materials-cars-and-trucks ² Ref: Mitchell Claims Database. Analysis report created by David Chen, Business Analyst, Mitchell International. ³ Ducker Worldwide. (2015). Metallic Material Trends in the North American Light Vehicle. Accessed online Aug. 3, 2016
1313 Feature Article

1414
The recent Length of Rental (LOR) trend continued in
the Fourth Quarter of 2016 as the average increased
to 12.5 days from 11.9 in the Fourth Quarter of 2015.
While most of the U.S. hovered near the .6 days
average, there were three regional outliers—the
Northeast, which was essentially flat, the Southwest,
which increased nearly one full day, and the Mountain
region which jumped 1.5 days to 13.5. Despite this
large increase, the Southwest continued to produce
the longest LOR duration at 13.8 days.
Nine individual states produced results that deviated
substantially from the U.S. average. Alaska and
Massachusetts were the only states to decline, .2 and
.3 days respectively. Arkansas, Delaware, Wyoming,
Utah and Montana increased between one and 1.3
days, although their impact on the regional and U.S
number was minimized by their relatively small volume.
The most impactful states were Texas, which jumped
1.1 days, and Colorado which skyrocketed 1.8. These
spikes resulted in 14.4 day averages for both, the
highest of any state.
Length of Rental was propelled once again by an
increase in claims frequency and an escalation in
repair complexity, however, there was a significant
delta between average and best in class. This indicates
that, despite these challenges, shops can drive results
by focusing on the elements they are able to control.
The three most impactful pieces, based on data and
feedback from best in class operations, are formal
training (I-Car Gold shops outperform the market
by approximately 1.3 days), utilization of ARMS®
Automotive (particularly the reporting tools) and a
robust scheduling strategy.
Average Length of Rental for Repairable Vehicles
By Dan FriedmanAssistant Vice President, Collision Industry Relations and Sales, Enterprise Rent-A-Car
U.S. Length of Rental Trend Continues for Q4 2016
Length of Rental was propelled once again by an increase in claims frequency and an escalation in repair complexity, however, there was a significant delta between average and best in class.
15

12.8
12.9
10.7
12.6
11.1
12.8
12.411.9
14.4
12.711.8
14.4
12.7
11.8
10.1
10.4
9.8
10.8 11.6
11.9
11.8
13.3
12.7
12.512.3
12.3
14.2
13.1
12
12.6
12
11.213.3
11.7
12.8
10.1
11.114.316
12.4
12.212.4
12
9.8
9.6
10.2
9.8
11.7
12.3
10.7
Nine individual states produced results that deviated substantially from the U.S. average. Alaska and Massachusetts were the only states to decline, .2 and .3 days respectively.
U.S. Average Length of Rental (LOR) by StateQ4 2016
Region LOR
California 12.8
Mid-Atlantic 11.9
Midwest 11.3
Mountain 13.5
Northeast 12.9
Northwest 11.5
Pacific 11.1
Southeast 12.6
Southwest 13.8
Average Billed Days for U.S.
12.5
1515 Average Length of Rental for Repairable Vehicles
16 Average Length of Rental for Repairable Vehicles
Canada
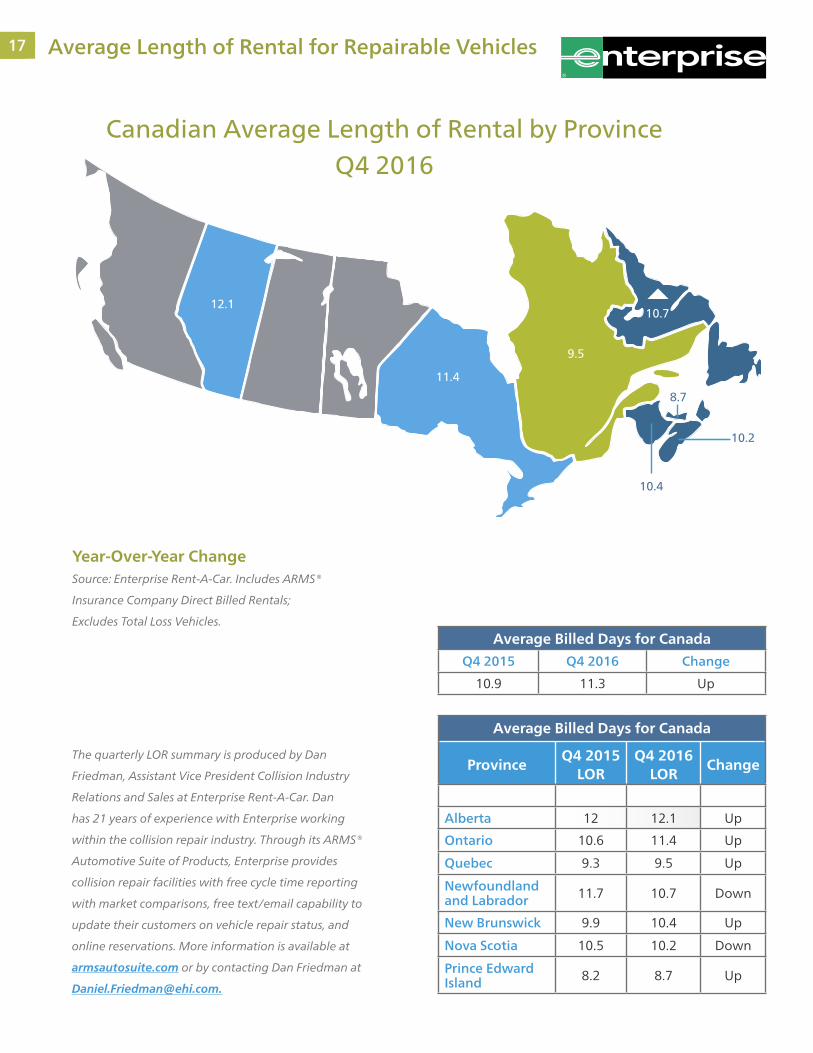
Canadian Length of Rental (LOR) continued its 2016
upward climb, showing a .4 day increase in Q4 2016
over Q4 2015 for the quarter ending December 31.
Despite the longer results, Canadian LOR continued
to trend below that of the U.S., finishing 1.2 days
lower (11.3 days in Canada vs. 12.5 days in the US).
Provincial differences were significant, with Atlantic
Canada once again leading the way. Each of the four
Atlantic Canada provinces beat the average, led by
Prince Edward Island’s finish of 2.6 days below the
national average. Newfoundland, Nova Scotia and
New Brunswick also bettered the Canadian result by
more than .5 days each.
Meanwhile, Ontario, the country’s most populous
province, saw a .8 day increase to 11.4 days.
Alberta witnessed an end to its recent trend of
producing LOR improvement (or decreases), and
increased from 12 days in Q4 2015 to 12.1 days in
Q4 2016.
Length of Rental was propelled once again by an
increase in claims frequency and an escalation in
repair complexity, however, there was a significant
delta between average and best in class. This
indicates that, despite these challenges, shops can
drive results by focusing on the elements they are
able to control. The three most impactful pieces,
based on data and feedback from best in class
operations, are formal training (I-Car Gold shops
outperform the market by approximately 1.3
days in the US), utilization of ARMS® Automotive
(particularly the reporting tools) and a robust
scheduling strategy.
17
Canadian Average Length of Rental by Province Q4 2016
11.4
9.5
10.4
10.2
8.7
12.110.7
Average Billed Days for Canada
ProvinceQ4 2015
LORQ4 2016
LORChange
Alberta 12 12.1 Up
Ontario 10.6 11.4 Up
Quebec 9.3 9.5 Up
Newfoundland and Labrador 11.7 10.7 Down
New Brunswick 9.9 10.4 Up
Nova Scotia 10.5 10.2 Down
Prince Edward Island 8.2 8.7 Up
Average Billed Days for Canada
Q4 2015 Q4 2016 Change
10.9 11.3 Up
Year-Over-Year ChangeSource: Enterprise Rent-A-Car. Includes ARMS®
Insurance Company Direct Billed Rentals;
Excludes Total Loss Vehicles.
The quarterly LOR summary is produced by Dan
Friedman, Assistant Vice President Collision Industry
Relations and Sales at Enterprise Rent-A-Car. Dan
has 21 years of experience with Enterprise working
within the collision repair industry. Through its ARMS®
Automotive Suite of Products, Enterprise provides
collision repair facilities with free cycle time reporting
with market comparisons, free text/email capability to
update their customers on vehicle repair status, and
online reservations. More information is available at
armsautosuite.com or by contacting Dan Friedman at
1717 Average Length of Rental for Repairable Vehicles
1818
Published by: CollisionWeek
Auto Physical Damage Insurance Underwriting Profit Declined from 2005–2015
Current Events
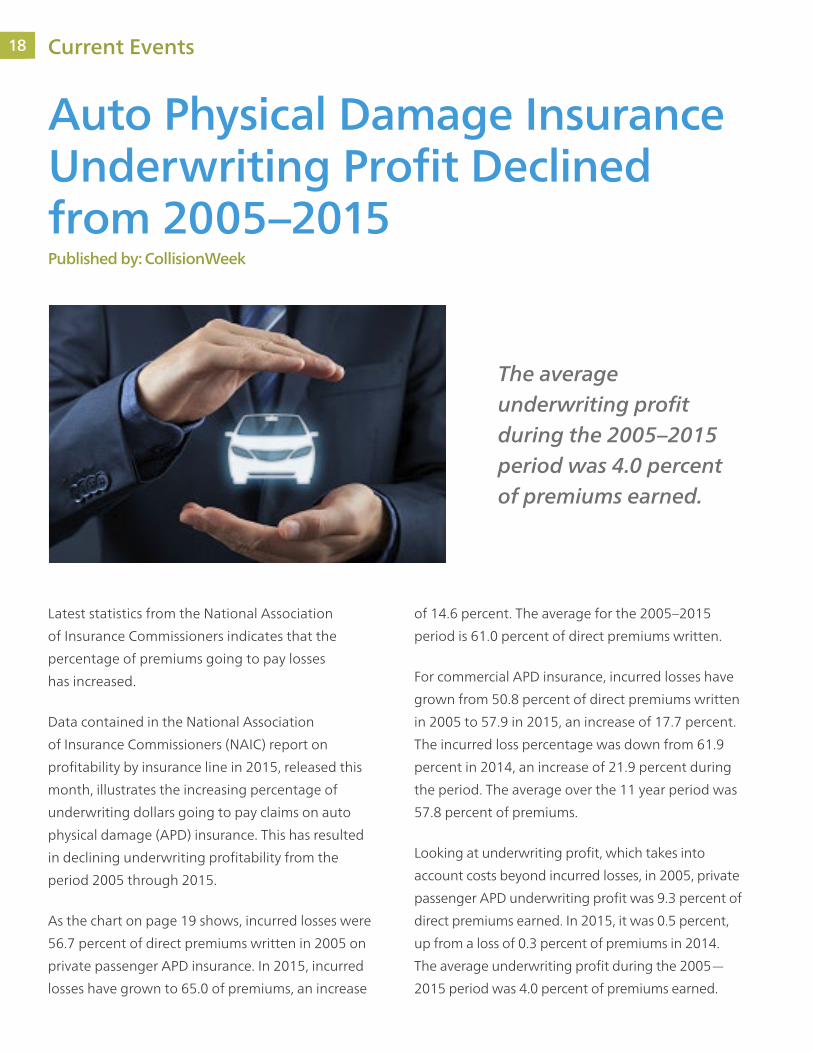
The average underwriting profit during the 2005–2015 period was 4.0 percent of premiums earned.
Latest statistics from the National Association
of Insurance Commissioners indicates that the
percentage of premiums going to pay losses
has increased.
Data contained in the National Association
of Insurance Commissioners (NAIC) report on
profitability by insurance line in 2015, released this
month, illustrates the increasing percentage of
underwriting dollars going to pay claims on auto
physical damage (APD) insurance. This has resulted
in declining underwriting profitability from the
period 2005 through 2015.
As the chart on page 19 shows, incurred losses were
56.7 percent of direct premiums written in 2005 on
private passenger APD insurance. In 2015, incurred
losses have grown to 65.0 of premiums, an increase
of 14.6 percent. The average for the 2005–2015
period is 61.0 percent of direct premiums written.
For commercial APD insurance, incurred losses have
grown from 50.8 percent of direct premiums written
in 2005 to 57.9 in 2015, an increase of 17.7 percent.
The incurred loss percentage was down from 61.9
percent in 2014, an increase of 21.9 percent during
the period. The average over the 11 year period was
57.8 percent of premiums.
Looking at underwriting profit, which takes into
account costs beyond incurred losses, in 2005, private
passenger APD underwriting profit was 9.3 percent of
direct premiums earned. In 2015, it was 0.5 percent,
up from a loss of 0.3 percent of premiums in 2014.
The average underwriting profit during the 2005—
2015 period was 4.0 percent of premiums earned.
19

On the commercial APD side, underwriting profit
was 12.0 percent of premium in 2005. In 2015 it
turned to a loss of 0.9 percent, an improvement
from the loss of 3.2 percent in 2014. The average
during the 11 year period was 0.9 percent of
premiums earned.
The profit performance of APD insurance looks
much better when the gains on the insurer’s
investments are taken into account, though it too
has declined substantially during the 10 year period.
For private passenger APD insurance, the profit on
the insurance transaction after investment gains are
taken into account stood at 6.8 percent of premiums
earned in 2005. In 2015, it stood at 0.8 percent of
premiums, a decline of 88.2 percent. The average
profit during the period was 3.3 percent.
70
65
60
55
50
45
Auto Physical Damage InsuranceLosses Incurred
Percent of Direct Premiums Earned
2005 2006 2007 2008 2009 2010 2011 2012 2013 2014 2015
Private Passenger Auto Physical Commercial Auto Physical
10
8
6
4
2
0
2
4
6
8
Auto Physical Damage InsuranceProfit on Insurance Transaction
Percent of Direct Premiums Earned
2005 2006 2007 2008 2009 2010 2011 2012 2013 2014 2015
Auto Physical Damage InsuranceUnderwriting Profit
Percent of Direct Premiums Earned
15
10
5
0
5
10
15
2005 2006 2007 2008 2009 2010 2011 2012 2013 2014 2015
1919 Current Events
20 Current Events
Published by: Autosphere.ca
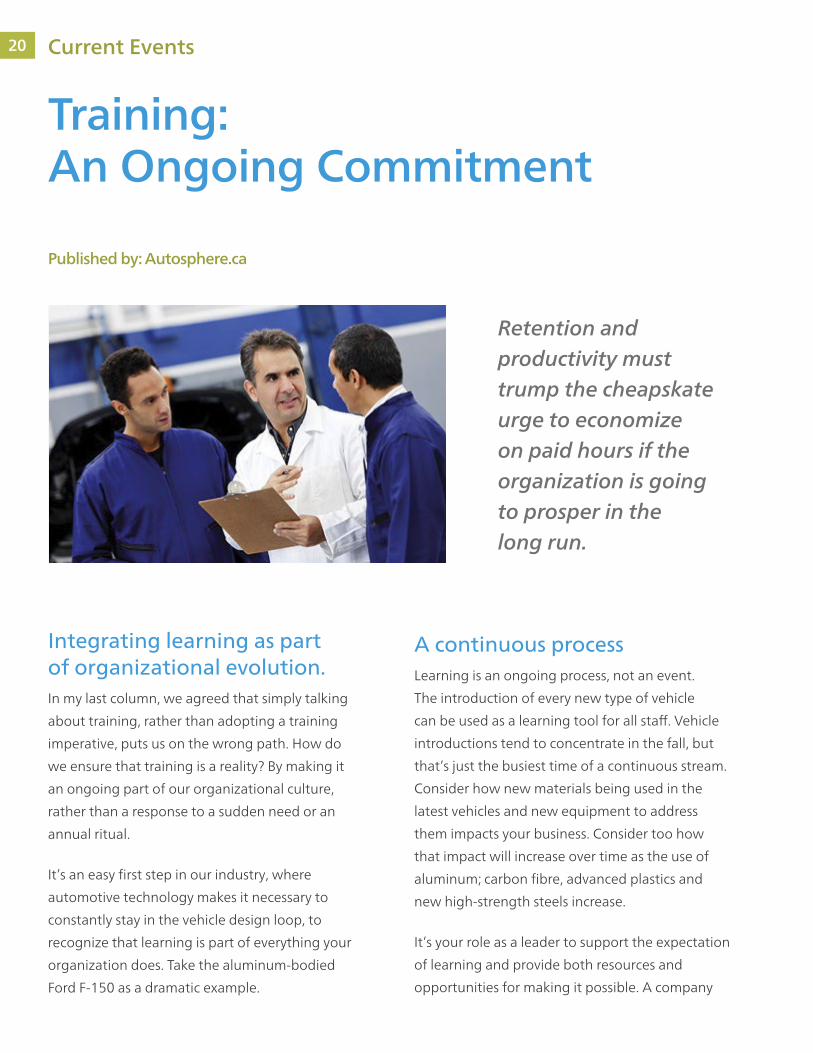
Training: An Ongoing Commitment
Retention and productivity must trump the cheapskate urge to economize on paid hours if the organization is going to prosper in the long run.
Integrating learning as part of organizational evolution.In my last column, we agreed that simply talking
about training, rather than adopting a training
imperative, puts us on the wrong path. How do
we ensure that training is a reality? By making it
an ongoing part of our organizational culture,
rather than a response to a sudden need or an
annual ritual.
It’s an easy first step in our industry, where
automotive technology makes it necessary to
constantly stay in the vehicle design loop, to
recognize that learning is part of everything your
organization does. Take the aluminum-bodied
Ford F-150 as a dramatic example.
A continuous processLearning is an ongoing process, not an event.
The introduction of every new type of vehicle
can be used as a learning tool for all staff. Vehicle
introductions tend to concentrate in the fall, but
that’s just the busiest time of a continuous stream.
Consider how new materials being used in the
latest vehicles and new equipment to address
them impacts your business. Consider too how
that impact will increase over time as the use of
aluminum; carbon fibre, advanced plastics and
new high-strength steels increase.
It’s your role as a leader to support the expectation
of learning and provide both resources and
opportunities for making it possible. A company
21

shows that it values learning by including employee
training and development in the budget and
viewing it as an investment in the future. Items
included in the annual budget reflect the priorities
of the operation. Say ‘yes’ when approached
for training and propose it regularly. Make it an
expectation rather than an exception.
Additionally, don’t just train your technicians.
Counter people and, yes, administration needs to
be up to date. While they may not need to rivet
aluminum, they need to uwnderstand what’s
involved. They need to care and show they do.
They also have to understand the process to assist
with explaining an estimate, dealing with insurers
and especially with owners.
By supporting the expectation of learning, the line
item will already be in your annual plan. That may
require some significant budget planning, but once
done, the shadow of the expenditure—everyone
feels it—won’t hang over the important training
needs of the team.
Providing timeThe toughest part is providing time for training.
Traditionally, employees have been expected to use
their own weekends or evenings. That just isn’t fair.
Satisfied employees are those whose training needs
are recognized alongside their need for balanced
lives. Retention and productivity must trump the
cheapskate urge to economize on paid hours if the
organization is going to prosper in the long run.
The winner is the company that has the most
informed, skilled employees. Employees know, they
talk to customers and they discuss their working
lives in the community.
Those employees also need to be loyal, enthused
and proud that their operation values training them
to make sure the vehicles they encounter get the
best possible attention. You cannot generate pride
by simply putting slogans on the wall but you can
create a culture of learning that enforces employee
competence and satisfaction.
Rémy Rousseau is the founder of Collision Management
and Rousseau Automotive Communication. You can reach
him at [email protected].
2121 Current Events
2222
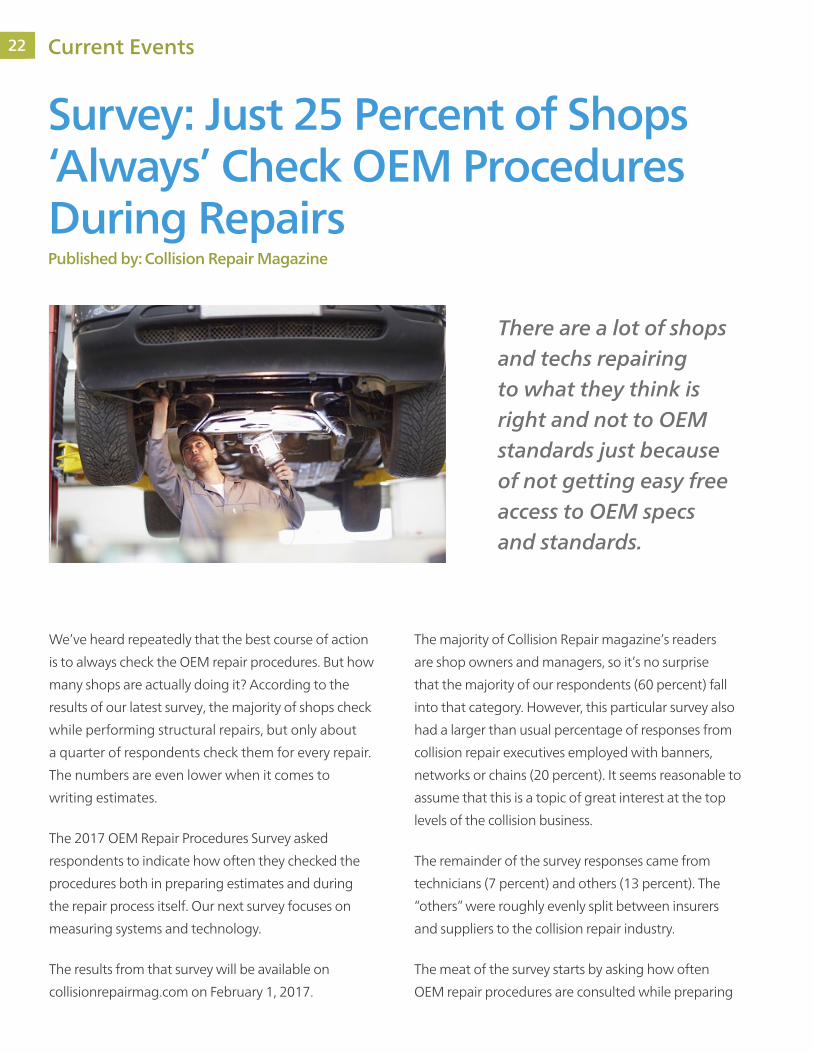
We’ve heard repeatedly that the best course of action
is to always check the OEM repair procedures. But how
many shops are actually doing it? According to the
results of our latest survey, the majority of shops check
while performing structural repairs, but only about
a quarter of respondents check them for every repair.
The numbers are even lower when it comes to
writing estimates.
The 2017 OEM Repair Procedures Survey asked
respondents to indicate how often they checked the
procedures both in preparing estimates and during
the repair process itself. Our next survey focuses on
measuring systems and technology.
The results from that survey will be available on
collisionrepairmag.com on February 1, 2017.
The majority of Collision Repair magazine’s readers
are shop owners and managers, so it’s no surprise
that the majority of our respondents (60 percent) fall
into that category. However, this particular survey also
had a larger than usual percentage of responses from
collision repair executives employed with banners,
networks or chains (20 percent). It seems reasonable to
assume that this is a topic of great interest at the top
levels of the collision business.
The remainder of the survey responses came from
technicians (7 percent) and others (13 percent). The
“others” were roughly evenly split between insurers
and suppliers to the collision repair industry.
The meat of the survey starts by asking how often
OEM repair procedures are consulted while preparing
Survey: Just 25 Percent of Shops ‘Always’ Check OEM Procedures During Repairs
Current Events
There are a lot of shops and techs repairing to what they think is right and not to OEM standards just because of not getting easy free access to OEM specs and standards.
Published by: Collision Repair Magazine
23

Survey: Just 25 Percent of Shops ‘Always’ Check OEM Procedures During Repairs
an estimate. The most common response was “Most of
the time,” drawing about 42 percent of the responses.
It was followed by “Sometimes” at 33 percent. About
17 percent of our respondents indicated that they
“Always” checked OEM repair procedures while
performing an estimate. Just 8 percent of respondents
indicated they “Never” check the procedures while
writing estimates.
Those numbers are just for writing estimates. The
numbers climb significantly when discussing the repair
process itself. Of our survey respondents, 25 percent
“Always” check the OEM procedures while performing
repairs. A further 58 percent check the procedures any
time they have to perform a structural repair, followed
by 17 percent who check for “Some structural repairs.”
Finally, we turn to how the information is accessed.
Alldata was clearly the most popular choice, with 35
percent of our respondents indicating it was the source
they accessed most often. Mitchell’s TechAdvisor
followed with 26 percent. OEM subscriptions followed
closely with 22 percent and I-CAR’s Repairability
Technical Support (RTS) portal garnered 17 percent
of the total responses.
We’ll close with a comment left by one of the
survey participants. As always, these comments are
anonymous and appear with only minimal editing
from us.
“Repairing the vehicle is all about making it safe and
to OEM specs. Why make it a cost and difficult to
access proper OEM procedures and specs? If the cost
of obtaining OEM info was covered, more people
would look up and know the proper procedures and
specs. There are a lot of shops and techs repairing to
what they think is right and not to OEM standards just
because of not getting easy free access to OEM specs
and standards. Remember, it’s about providing the
customer with a safe vehicle.”
Make sure to check out our next survey on measuring
technology at this link, and watch for the results
next week!
How Often Do You Check OEM Procedures During
Estimates?
How Often Do You Check OEM Procedures During
the Repair Itself?
12
34
Always (17)
Most of the time (42)
Sometimes (33)
Never (8)
1
2
3
4
123
Always (25)
All Structural Repairs (56)
Some Structural Repairs (17)
2
3 1
Where Do You AccessOEM Procedures?All figures given in percentages
40383634323028262422201816141210
86420
35 25
1722
Alldata Mitchell TechAdvisor
CEM subscriptions
I-CAR RTS
2323 Current Events

2424
Faster cycle times, fewer total losses and shorter
length of rentals. These are just some of the
many benefits of plastic repair that Kurt Lammon,
president of Polyvance, talked about during a recent
Guild 21 webinar.
He said there are advantages for all members of
the collision repair ecosystem including consumers,
body shops, insurers, OEMs, technicians, as well as
the planet.
Polyvance, formerly Urethane Supply Company, was
established in 1981 to provide plastic repair and
refinishing products for the collision repair industry.
During the 1980s, the business pioneered a repair
method for polyurethane bumpers. Lammon and his
brother Keith took over the company from its founder,
Jim Sparks, in 1995. Some of the products they have
created since then for bumper repair and refinishing
include the FiberFlex universal welding rod, Bumper
& Cladding Coat Adhesion Primer, and the Nitro Fuzer
nitrogen welding system, introduced in 2006.
Although most think people think of bumpers when it
comes to plastic repairs, Lammon said there are many
other non-structural plastic parts that can be fixed,
such as washer
and overflow bottles, headlight tabs and fenders. “As
the OEMs try to get the cars to be lighter, we’re going
to see more plastic panels I believe,” said Lammon.
The Benefits of Plastic Repair for the Collision Repair Industry
Current Events
A faster cycle time means that vehicles spend less time in the shop, which expands a business’s capacity to do other work.
Published by: Autobody News
25

He cited a case study he found on LinkedIn about
a body shop in Australia that began doing plastic
repair after receiving the necessary training,
equipment and materials. Over a one-year period,
the company repaired more than 1,500 vehicles
using plastic repair methods; 71 percent of which
were bumpers and 19 percent were headlights.
The company found that the replacement part
costs went down by 45 percent. There were also
reductions in vehicle repair costs, paint materials and
cycle time. “There is some real impact that happens
in the shops when they take plastic repair to heart,”
said Lammon.
Benefits for the Collision Repair Ecosystem: ConsumersWhen a body shop utilizes plastic repair on a
vehicle, it not only allows for a faster cycle time,
the customer is able to keep the original bumper,
which helps protects the brand. Lammon said plastic
repair lowers repair costs, which can lead to more
affordable insurance premiums and lower costs in
general if a consumer is paying to repair a vehicle
out-of-pocket. All of these help with customer
satisfaction. In addition, plastic repair reduces
incidents of total loss. “When consumers experience
a total loss, they are often dissatisfied and would
like to keep that car on the road,” said Lammon.
“If we can repair some plastic and keep it under
the total-loss threshold, it would be a benefit to
the consumer.”
Body Shops
In terms of cycle time, it’s not only beneficial for the
consumer but obviously for the body shop as well.
Lammon said a faster cycle time means that vehicles
spend less time in the shop, which expands a
business’s capacity to do other work. Because plastic
repair can decrease the number of total losses,
shops can minimize paying the costs of storage,
estimations, and labor that is not reimbursed. It
also helps reduce severity and time, as well as looks
favorable on a body shop’s DRP scorecard.
Lammon pointed out that body shops make their
money on labor, rather than parts. Typically, a shop
can make 20 to 25 percent on parts, whereas in
terms of labor, they can make 50 or even 60 percent
on their time. “It’s definitely better to repair parts to
make a higher profit margin,” he said. Keeping the
original part on the vehicle is beneficial for fit issues
as well as the labor hours involved.
“A big thing now is being able to maintain control,”
said Lammon. He used the example of bumpers,
which cannot always be repaired, especially over
blind spot monitors. If the technician knows that
the blind spot monitor is on the rear quarter behind
the bumper, he or she is going to avoid doing
any repairs over that area, whereas he said if they
bought a recycled bumper, they would have no
idea where the repairs were. “That gives the body
shop control and I think that’s a really big factor
nowadays,” said Lammon.
Insurers
Two of the main benefits for insurers include
reduction of severity due to the ability to blend
the paint in the panel, and faster cycle time, which
benefits all parties because it’s a shorter length
of rental for the insurer. “I would think because
the consumer is having a better experience with a
shorter cycle time, that would also benefit the CSI
score,” said Lammon. He said if consumers have a
negative experience with a repair, they may switch
insurance companies. “The happier the consumer,
the more likely they are going to stay with that
insurer after the repair is done,” said Lammon.
2525 Current Events

2626 Current Events
Another benefit he pointed out is reduced diminished
value. Some bumpers now have VIN codes and he
said that keeping that intact is also something of
value.
OEMs
Lammon said that a faster cycle time as a result of
plastic repair benefits everybody. When consumers
have had a good experience, the more likely they are
going to be satisfied with the OEM as well. “More
often than not, in a total loss situation, consumers will
switch brands of vehicles so that’s a stream of future
cashflows that the OEMs are going to lose on repairs
and maintenance,” he said.
Polyvance has been approached by Tesla about using
plastic repair on its vehicles. Lammon said that the
automotive manufacturer is informing its approved
body shops to repair some of the plastic parts on the
vehicles because parts availability is such a problem.
“Even a temporary repair gets the cars back on the
road faster and improves customer satisfaction,”
he said.
Technicians When it comes to technicians, Lammon said he has
found plastic repair has helped with job satisfaction
and pride in workmanship. “Right now, the body
shops are in such a dire need for new talent coming
in,” he said. Since the parts repaired are non-
structural, he said it provides a good first step to
becoming a skilled repairer and can put them on a
path to increase their skills. In addition, it gives them
an opportunity for increased pay, which leads to
a better standard of living. “It also allows the shop
owner to evaluate the performance of the technician
in a low-risk environment and if a person exceeds
or excels, the shop owner can progress that person
along to being a structural technician.”
Planet
One of the main benefits for the planet is reducing
landfill waste. By keeping the original part on the
vehicle, it reduces recycling volume. Although
polyurethane bumpers are not very common,
Lammon said those types of plastics cannot be
recycled. Instead, they have to be discarded.
He estimated that approximately 70 percent of
damaged polypropylene bumpers are not being
repaired. Due to the ability to blend the paint to the
panel, it reduces VOC emissions, which is good for
the planet. Finally, he said it also helps create skilled
labor jobs and employ a younger workforce.
This information was based on a presentation by
Kurt Lammon during a recent Guild 21 webinar.
Kurt Lammon, president of Polyvance, said there are many benefits of plastic repair.
For more information about plastic repair,
visit www.polyvance.com or contact
Polyvance at 800-633-3047.
27

A new report from the National Association of
Insurance Commissioners indicates that New Jersey
has the highest auto insurance premiums in the
country, followed by Louisiana and Michigan.
The report measures the 2014 combined average
premium, which includes liability, collision and
comprehensive coverage costs. New Jersey’s
combined average premium in 2014 was $1,379,
Louisiana’s was $1,364, and Michigan’s was $1,351.
The national average was $982.27.
The states with the lowest auto insurance premiums
were Idaho ($673), Iowa ($683), and Maine ($689).
The national combined average premium increased
by 8.17 percent between 2010 and 2014.
New Report Ranks States According to Highest Auto
Insurance Premiums
New Jersey’s combined average premium
in 2014 was $1,379, Louisiana’s was $1,364,
and Michigan’s was $1,351. The national
average was $982.27.
Published by: Body Shop Business
2727 Current Events
2828 Current Events
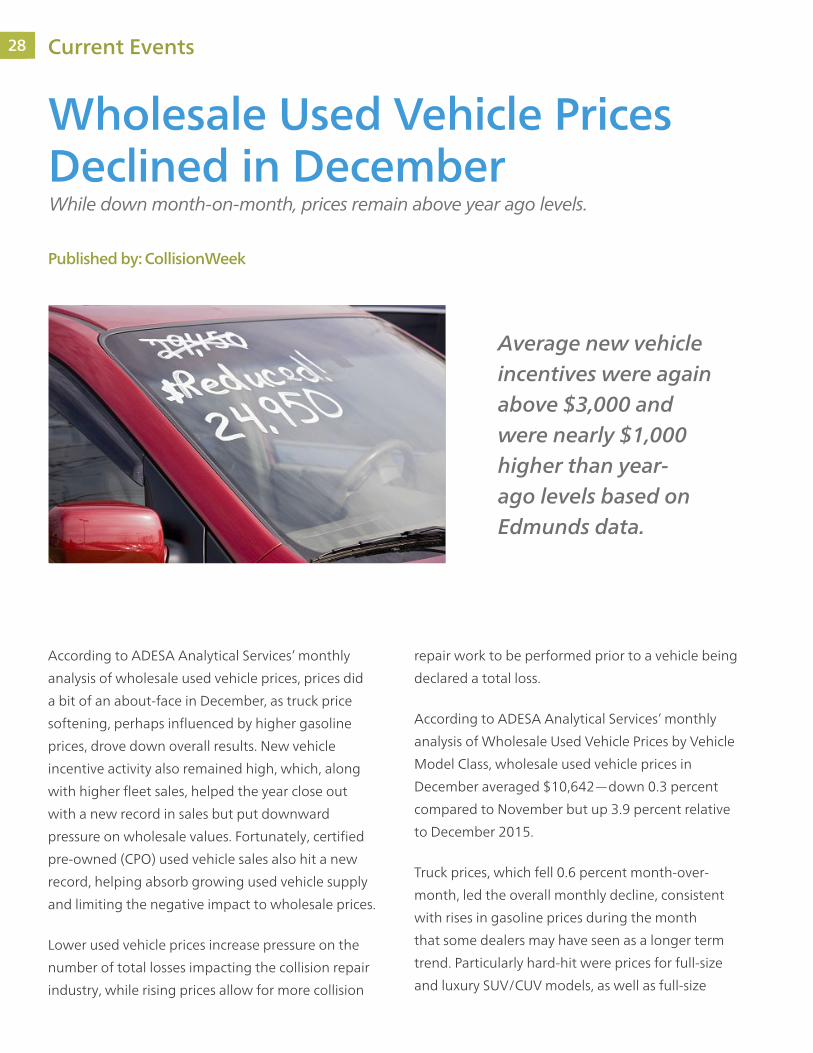
According to ADESA Analytical Services’ monthly
analysis of wholesale used vehicle prices, prices did
a bit of an about-face in December, as truck price
softening, perhaps influenced by higher gasoline
prices, drove down overall results. New vehicle
incentive activity also remained high, which, along
with higher fleet sales, helped the year close out
with a new record in sales but put downward
pressure on wholesale values. Fortunately, certified
pre-owned (CPO) used vehicle sales also hit a new
record, helping absorb growing used vehicle supply
and limiting the negative impact to wholesale prices.
Lower used vehicle prices increase pressure on the
number of total losses impacting the collision repair
industry, while rising prices allow for more collision
repair work to be performed prior to a vehicle being
declared a total loss.
According to ADESA Analytical Services’ monthly
analysis of Wholesale Used Vehicle Prices by Vehicle
Model Class, wholesale used vehicle prices in
December averaged $10,642—down 0.3 percent
compared to November but up 3.9 percent relative
to December 2015.
Truck prices, which fell 0.6 percent month-over-
month, led the overall monthly decline, consistent
with rises in gasoline prices during the month
that some dealers may have seen as a longer term
trend. Particularly hard-hit were prices for full-size
and luxury SUV/CUV models, as well as full-size
Wholesale Used Vehicle Prices Declined in December While down month-on-month, prices remain above year ago levels.
Published by: CollisionWeek
Average new vehicle incentives were again above $3,000 and were nearly $1,000 higher than year-ago levels based on Edmunds data.
29
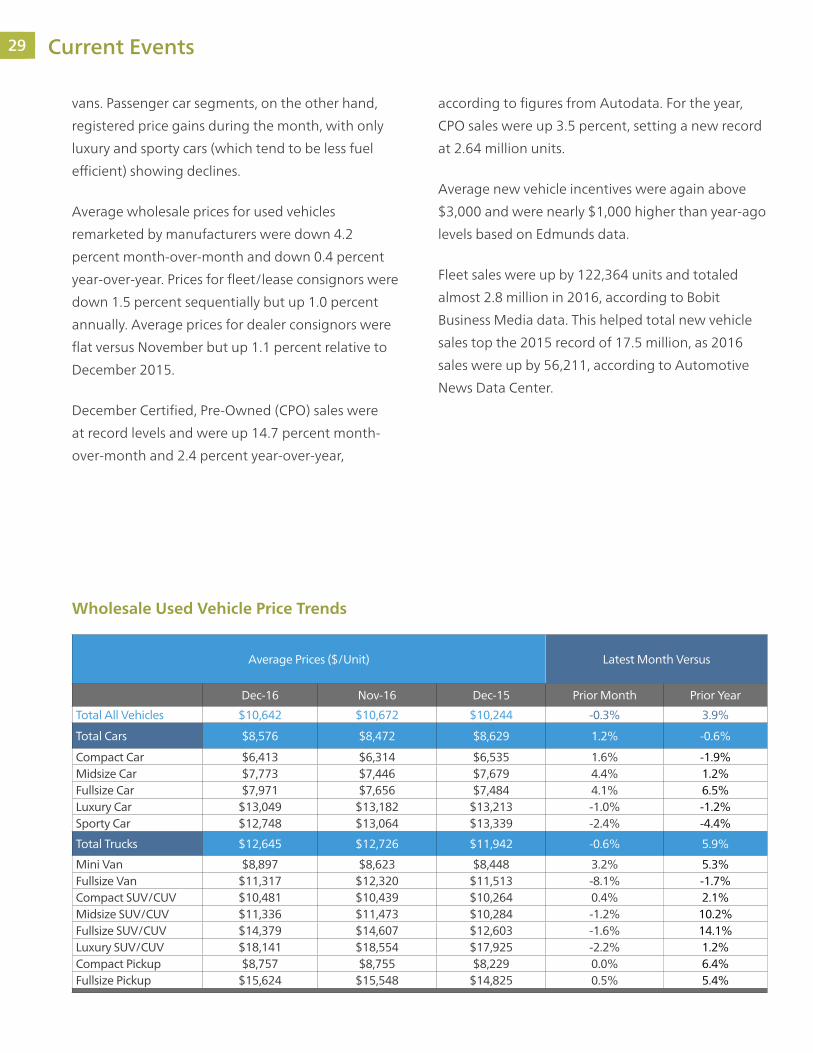
vans. Passenger car segments, on the other hand,
registered price gains during the month, with only
luxury and sporty cars (which tend to be less fuel
efficient) showing declines.
Average wholesale prices for used vehicles
remarketed by manufacturers were down 4.2
percent month-over-month and down 0.4 percent
year-over-year. Prices for fleet/lease consignors were
down 1.5 percent sequentially but up 1.0 percent
annually. Average prices for dealer consignors were
flat versus November but up 1.1 percent relative to
December 2015.
December Certified, Pre-Owned (CPO) sales were
at record levels and were up 14.7 percent month-
over-month and 2.4 percent year-over-year,
according to figures from Autodata. For the year,
CPO sales were up 3.5 percent, setting a new record
at 2.64 million units.
Average new vehicle incentives were again above
$3,000 and were nearly $1,000 higher than year-ago
levels based on Edmunds data.
Fleet sales were up by 122,364 units and totaled
almost 2.8 million in 2016, according to Bobit
Business Media data. This helped total new vehicle
sales top the 2015 record of 17.5 million, as 2016
sales were up by 56,211, according to Automotive
News Data Center.
Average Prices ($/Unit) Latest Month Versus
Dec-16 Nov-16 Dec-15 Prior Month Prior Year
Total All Vehicles $10,642 $10,672 $10,244 -0.3% 3.9%
Total Cars $8,576 $8,472 $8,629 1.2% -0.6%
Compact Car $6,413 $6,314 $6,535 1.6% -1.9%Midsize Car $7,773 $7,446 $7,679 4.4% 1.2%Fullsize Car $7,971 $7,656 $7,484 4.1% 6.5%Luxury Car $13,049 $13,182 $13,213 -1.0% -1.2%Sporty Car $12,748 $13,064 $13,339 -2.4% -4.4%
Total Trucks $12,645 $12,726 $11,942 -0.6% 5.9%
Mini Van $8,897 $8,623 $8,448 3.2% 5.3%Fullsize Van $11,317 $12,320 $11,513 -8.1% -1.7%Compact SUV/CUV $10,481 $10,439 $10,264 0.4% 2.1%Midsize SUV/CUV $11,336 $11,473 $10,284 -1.2% 10.2%Fullsize SUV/CUV $14,379 $14,607 $12,603 -1.6% 14.1%Luxury SUV/CUV $18,141 $18,554 $17,925 -2.2% 1.2%Compact Pickup $8,757 $8,755 $8,229 0.0% 6.4%Fullsize Pickup $15,624 $15,548 $14,825 0.5% 5.4%
Wholesale Used Vehicle Price Trends
2929 Current Events

30 Motor Vehicle Markets
New Vehicle Sales
Cars Trucks/Vans/SUVs
Camry 388,616 F-Series 763,907
Civic 366,927 Silverado 574,876
Corolla 360,483 Ram Pickup 473,681
Accord 345,225 CR-V 357,335
Altima 307,380 RAV4 352,139
Fusion 265,840 Rogue 329,904
Malibu 227,881 Escape 307,069
Sentra 214,709 Explorer 248,507
Elantra 208,319 Equinox 242,195
Sonata 199,416 Sierra 221,680
WardsAuto 10 Best-Selling U.S. Cars and TrucksAs of December 2016
Number of Vehicles
2,542,3193,042,47942,1545,626,9521,637,942775,0054,434647,598297,77396,2671,564,423615,1322,449,5888,088,162210,213365,204380,8552,228,578105,10454,280322,94882,7243,749,90617,465,020
FordGMTesla MotorsNorth America TotalHondaHyundaiIsuzuKiaMazdaMitsubishiNissanSubaruToyotaAsia/Pacific TotalAudiBMWDaimlerFCAJaguar Land RoverPorscheVolkswagenVolvoEurope TotalTotal Light Vehicles
-0.2-1.367.0-0.53.21.716.63.5-6.71.05.45.6-2.01.64.0-9.70.0-0.423.64.9-7.618.1-0.80.4
18M3M 6M1M500K300K100K50K
Vo
l % C
han
ge fro
m 2014 Sales
WardsAuto U.S. Light Vehicle Sales by CompanyDecember 2016
Light vehicles are cars and light trucks (GVW Classes 1-3, under 14,001 lbs.). DSR is daily sales rate. Tesla Motors monthly sales estimated. Source: WardsAuto InfoBank
Source: WardsAuto InfoBank
31
Current Used Vehicle Market Conditions
December 2016 Kontos Kommentary
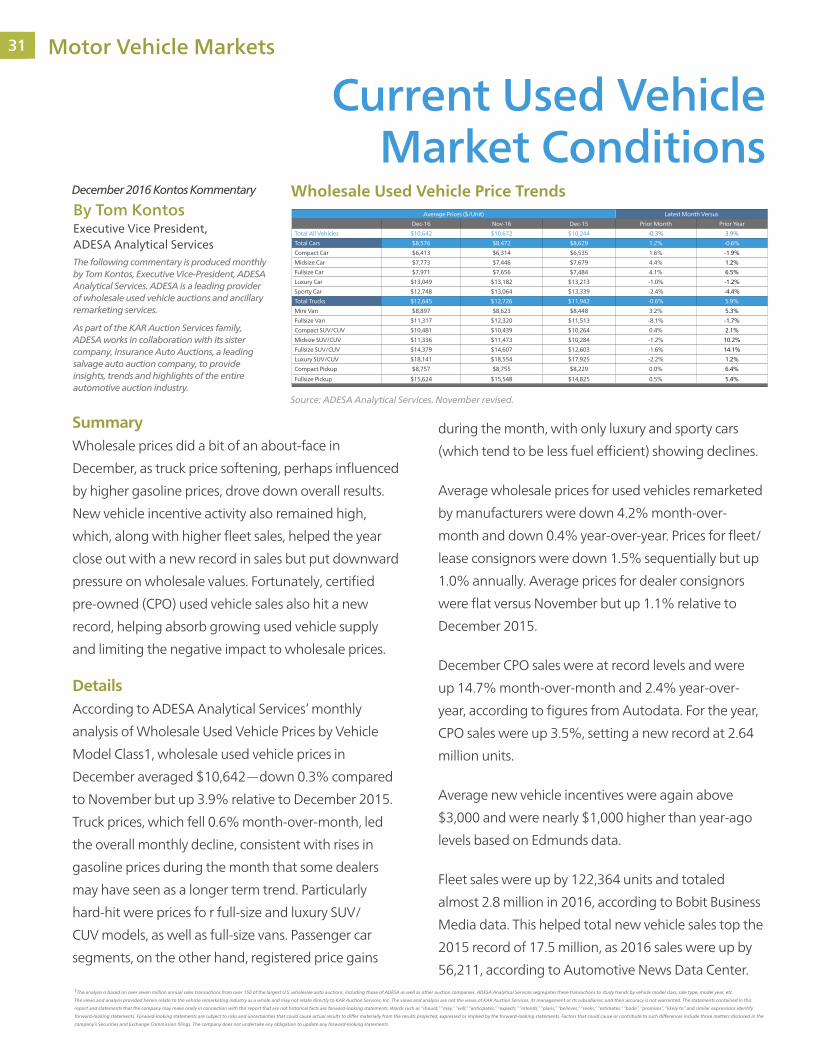
SummaryWholesale prices did a bit of an about-face in
December, as truck price softening, perhaps influenced
by higher gasoline prices, drove down overall results.
New vehicle incentive activity also remained high,
which, along with higher fleet sales, helped the year
close out with a new record in sales but put downward
pressure on wholesale values. Fortunately, certified
pre-owned (CPO) used vehicle sales also hit a new
record, helping absorb growing used vehicle supply
and limiting the negative impact to wholesale prices.
Details According to ADESA Analytical Services’ monthly
analysis of Wholesale Used Vehicle Prices by Vehicle
Model Class1, wholesale used vehicle prices in
December averaged $10,642—down 0.3% compared
to November but up 3.9% relative to December 2015.
Truck prices, which fell 0.6% month-over-month, led
the overall monthly decline, consistent with rises in
gasoline prices during the month that some dealers
may have seen as a longer term trend. Particularly
hard-hit were prices fo r full-size and luxury SUV/
CUV models, as well as full-size vans. Passenger car
segments, on the other hand, registered price gains
during the month, with only luxury and sporty cars
(which tend to be less fuel efficient) showing declines.
Average wholesale prices for used vehicles remarketed
by manufacturers were down 4.2% month-over-
month and down 0.4% year-over-year. Prices for fleet/
lease consignors were down 1.5% sequentially but up
1.0% annually. Average prices for dealer consignors
were flat versus November but up 1.1% relative to
December 2015.
December CPO sales were at record levels and were
up 14.7% month-over-month and 2.4% year-over-
year, according to figures from Autodata. For the year,
CPO sales were up 3.5%, setting a new record at 2.64
million units.
Average new vehicle incentives were again above
$3,000 and were nearly $1,000 higher than year-ago
levels based on Edmunds data.
Fleet sales were up by 122,364 units and totaled
almost 2.8 million in 2016, according to Bobit Business
Media data. This helped total new vehicle sales top the
2015 record of 17.5 million, as 2016 sales were up by
56,211, according to Automotive News Data Center.
Average Prices ($/Unit) Latest Month Versus
Dec-16 Nov-16 Dec-15 Prior Month Prior Year
Total All Vehicles $10,642 $10,672 $10,244 -0.3% 3.9%
Total Cars $8,576 $8,472 $8,629 1.2% -0.6%
Compact Car $6,413 $6,314 $6,535 1.6% -1.9%
Midsize Car $7,773 $7,446 $7,679 4.4% 1.2%
Fullsize Car $7,971 $7,656 $7,484 4.1% 6.5%
Luxury Car $13,049 $13,182 $13,213 -1.0% -1.2%
Sporty Car $12,748 $13,064 $13,339 -2.4% -4.4%
Total Trucks $12,645 $12,726 $11,942 -0.6% 5.9%
Mini Van $8,897 $8,623 $8,448 3.2% 5.3%
Fullsize Van $11,317 $12,320 $11,513 -8.1% -1.7%
Compact SUV/CUV $10,481 $10,439 $10,264 0.4% 2.1%
Midsize SUV/CUV $11,336 $11,473 $10,284 -1.2% 10.2%
Fullsize SUV/CUV $14,379 $14,607 $12,603 -1.6% 14.1%
Luxury SUV/CUV $18,141 $18,554 $17,925 -2.2% 1.2%
Compact Pickup $8,757 $8,755 $8,229 0.0% 6.4%
Fullsize Pickup $15,624 $15,548 $14,825 0.5% 5.4%
Wholesale Used Vehicle Price Trends
Source: ADESA Analytical Services. November revised.
1The analysis is based on over seven million annual sales transactions from over 150 of the largest U.S. wholesale auto auctions, including those of ADESA as well as other auction companies. ADESA Analytical Services segregates these transactions to study trends by vehicle model class, sale type, model year, etc.
The views and analysis provided herein relate to the vehicle remarketing industry as a whole and may not relate directly to KAR Auction Services, Inc. The views and analysis are not the views of KAR Auction Services, its management or its subsidiaries; and their accuracy is not warranted. The statements contained in this
report and statements that the company may make orally in connection with this report that are not historical facts are forward-looking statements. Words such as “should,” “may,” “will,” “anticipates,” “expects,” “intends,” “plans,” “believes,” “seeks,” “estimates,” “bode”, “promises”, “likely to” and similar expressions identify
forward-looking statements. Forward-looking statements are subject to risks and uncertainties that could cause actual results to differ materially from the results projected, expressed or implied by the forward-looking statements. Factors that could cause or contribute to such differences include those matters disclosed in the
company’s Securities and Exchange Commission filings. The company does not undertake any obligation to update any forward-looking statements.
By Tom Kontos Executive Vice President, ADESA Analytical ServicesThe following commentary is produced monthly by Tom Kontos, Executive Vice-President, ADESA Analytical Services. ADESA is a leading provider of wholesale used vehicle auctions and ancillary remarketing services.
As part of the KAR Auction Services family, ADESA works in collaboration with its sister company, Insurance Auto Auctions, a leading salvage auto auction company, to provide insights, trends and highlights of the entire automotive auction industry.
3131 Motor Vehicle Markets

32 Mitchell Collision Repair Industry Data
Comprehensive Losses
In Q4 2016, the average initial gross appraisal value for comprehensive
coverage estimates processed through our servers was $3,234, compared to
$3,082 in Q4 2015. Factoring for development produces an increase in the
adjusted value to $3,269.
Mitchell Estimating is an advanced
estimating system, combining database
accuracy, automated calculations, and
repair procedure pages to produce
estimates that are comprehensive,
verifiable, and accepted throughout the
collision industry. Mitchell Estimating
is an integral part of Mitchell’s
appraisal workflow solutions.
Visit Mitchell’s website at www.mitchell.com
MITCHELL SOLUTION:
Mitchell Estimating™
Appraisal Values
The initial average appraisal value, calculated by combining data from
all first and third-party repairable vehicle appraisals uploaded through
Mitchell systems in Q4 2016, was $3,019, $32 less than this same period
last year. However, continued development suggests a final Q4 2016
average appraisal value of $3,072, which represents an increase over the
same quarter last year.
Average Appraisal Values, ACVs and Age Comprehensive Losses*
$2,940 $2,935 $3,125 $3,082 $3,281 $3,234
$15,024 $14,822 $15,696 $15,275
$17,644 $16,803
$0
$2,000
$4,000
$6,000
$8,000
$10,000
$12,000
$14,000
$16,000
$18,000
$20,000
Q2 2014 7.29
Q4 2014 7.69
Q2 2015 7.38
Q4 2015 7.72
Q2 2016 6.66
Q4 2016 7.08
Appraisals ACV’s
$3,269/
* Values provided from Guidebook benchmark averages, furnished through Mitchell Estimating.
Avg. vehicle age in years
Average Appraisal Values, ACVs and Age | All APD Line Coverages*
$2,816 $2,965 $2,927 $3,051 $3,021 $3,019
$14,313 $14,306 $14,809 $14,786 $15,672 $15,355
$0
$2,000
$4,000
$6,000
$8,000
$10,000
$12,000
$14,000
$16,000
$18,000
Q2 2014 7.39
Q4 2014 7.61
Q2 2015 7.39
Q4 2015 7.47
Q2 2016 6.87
Q4 2016 7.09 Avg. vehicle age in years
$3,072/
* Values provided from Guidebook benchmark averages, furnished through Ultramate. Appraisals ACV’s
33
$2,940 $2,935 $3,125 $3,082 $3,281 $3,234
$15,024 $14,822 $15,696 $15,275
$17,644 $16,803
$0
$2,000
$4,000
$6,000
$8,000
$10,000
$12,000
$14,000
$16,000
$18,000
$20,000
Q2 2014 7.29
Q4 2014 7.69
Q2 2015 7.38
Q4 2015 7.72
Q2 2016 6.66
Q4 2016 7.08
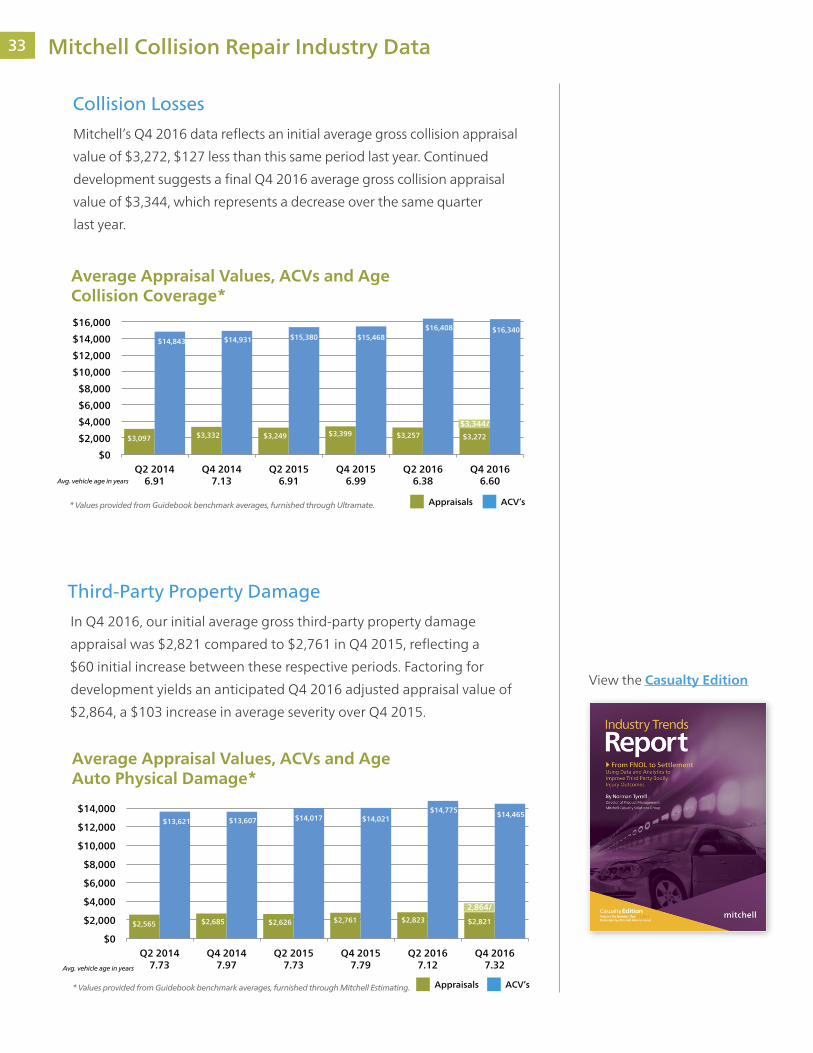
Third-Party Property Damage
In Q4 2016, our initial average gross third-party property damage
appraisal was $2,821 compared to $2,761 in Q4 2015, reflecting a
$60 initial increase between these respective periods. Factoring for
development yields an anticipated Q4 2016 adjusted appraisal value of
$2,864, a $103 increase in average severity over Q4 2015.
Average Appraisal Values, ACVs and Age Auto Physical Damage*
$2,565 $2,685 $2,626 $2,761 $2,823 $2,821
$13,621 $13,607 $14,017 $14,021 $14,775
$14,465
$0
$2,000
$4,000
$6,000
$8,000
$10,000
$12,000
$14,000
$16,000
Q2 2014 7.73
Q4 2014 7.97
Q2 2015 7.73
Q4 2015 7.79
Q2 2016 7.12
Q4 2016 7.32
2,864/
ACV’sAppraisals
Avg. vehicle age in years
* Values provided from Guidebook benchmark averages, furnished through Mitchell Estimating.
Collision Losses
Mitchell’s Q4 2016 data reflects an initial average gross collision appraisal
value of $3,272, $127 less than this same period last year. Continued
development suggests a final Q4 2016 average gross collision appraisal
value of $3,344, which represents a decrease over the same quarter
last year.
View the Casualty Edition
$3,097 $3,332 $3,249 $3,399 $3,257 $3,272
$14,843 $14,931 $15,380 $15,468 $16,408 $16,340
$0
$2,000
$4,000
$6,000
$8,000
$10,000
$12,000
$14,000
$16,000
$18,000
Q2 2014 6.91
Q4 2014 7.13
Q2 2015 6.91
Q4 2015 6.99
Q2 2016 6.38
Q4 2016 6.60
$3,344/
Appraisals ACV’s
Avg. vehicle age in years
* Values provided from Guidebook benchmark averages, furnished through Ultramate.
Average Appraisal Values, ACVs and Age Collision Coverage*
3333 Mitchell Collision Repair Industry Data

34
Supplements
As it generally takes at least three months following the original date of appraisal to accumulate most
supplements against an original estimate of repair, we report (and recommend viewing supplement
information) three months’ after-the-fact, to obtain the most accurate view of this data.
Average Appraisal Make-UpThis chart compares the average appraisal make-up as a percentage of dollars, constructed by Mitchell-
equipped estimators. These data points reflect a ‘trade off’; in comparing Q4 2016 to the same period
last year, there was only minimal shifting (less than 1%) between categories.
EDITOR’S NOTE
In Q4 2016, 34.5% of all original estimates prepared by Mitchell-equipped estimators were supplemented one
or more times. In this same period, the pure supplement frequency (supplements to estimates) was 62.64%,
reflecting an 10.11 point increase from that same period in 2015. The average combined supplement variance
for this quarter was $826.18, $78.70 lower than in Q4 2015.
Average Supplement Frequency and Severity
Date Q2/14 Q4/14 Q2/15 Q4/15 Q2/16 Q4/16 Pt. Change % Change
% Est. Supplement 33 35.23 34.2 36.58 39.07 34.5 -2.08 -6%
% Supplement 46.85 49.22 49.09 52.53 57.02 62.64 10.11 19%
Avg. Combined Supp. Variance $ 764.04 814.27 873.79 904.88 878.15 826.18 -78.7 -9%
% Supplement $ 27.13 27.46 29.86 29.66 29.06 27.37 -2.29 -8%
% Average Appraisal Dollars by Type
Date Q2/14 Q4/14 Q2/15 Q4/15 Q2/16 Q4/16 Pt. Change % Change
% Average Part $ 41.23 45.25 43.23 45.91 43.09 45.73 -0.18 0%
% Average Labor $ 47.71 43.42 45.71 42.84 45.96 43.03 0.19 0%
% Paint Material $ 10.64 10.38 10.55 10.29 10.19 10.18 -0.11 -1%
Mitchell Collision Repair Industry Data 35

Parts Type Definitions
Original Equipment Manufacturer (OEM)Parts produced directly by the vehicle manufacturer
or their authorized supplier, and delivered through
the manufacturer’s designated and approved supply
channels. This category covers all automotive parts,
including sheet metal and mechanical parts.
Aftermarket Parts produced and/or supplied by firms other than
the Original Equipment Manufacturer’s designated
supply channel. This may also include those parts
originally manufactured by endorsed OEM suppliers,
which have later followed alternative distribution
and sales processes. While this part category is often
only associated with crash replacement parts, the
automotive aftermarket also includes a large variety
of mechanical and custom parts.
Non-New/Remanufactured Parts removed from an existing vehicle that are
cleaned, inspected, repaired and/or rebuilt, usually
back to the original equipment manufacturer’s
specifications, and re-marketed through either the
OEM or alternative supply chains. While commonly
associated with mechanical hard parts such as
alternators, starters and engines, remanufactured
parts may also include select crash parts such as
urethane and TPO bumpers, radiators and wheels.
Recycled Parts removed from a salvaged vehicle and re-
marketed through private or consolidated auto
parts recyclers. This category commonly includes
all types of parts and assemblies, especially body,
interior and mechanical parts.
While there isn’t a perfect
correlation between the
types of parts specified
by estimators and those
actually used during the
course of repairs, we
feel that the following
observations are
directionally accurate for
both the insurance and
auto body repair industries.
This section illustrates
the percentage of dollars
allocated to each unique
part-type.
As a general observation,
recent data show that
parts make up 46% of
the average value per
repairable vehicle appraisal,
which represents nearly
$1,400 in average spend
per estimate.
EDITOR’S NOTEParts Analysis
3535 Mitchell Collision Repair Industry Data
36
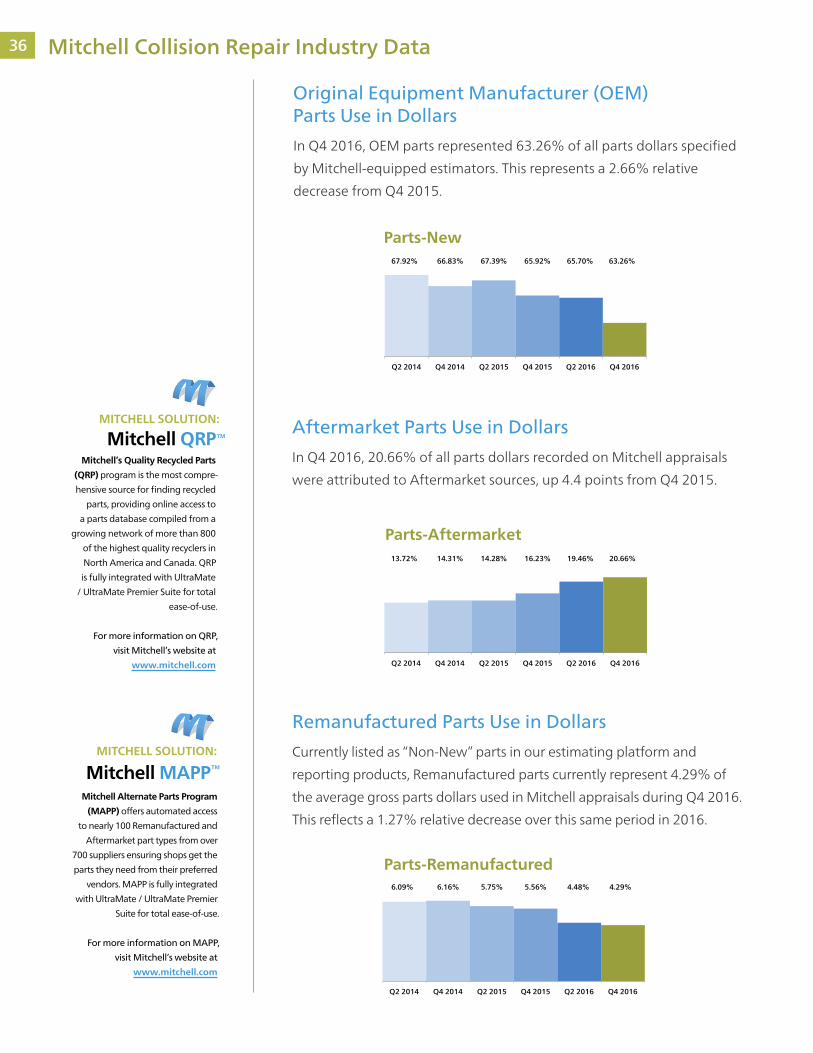
Original Equipment Manufacturer (OEM) Parts Use in Dollars
In Q4 2016, OEM parts represented 63.26% of all parts dollars specified
by Mitchell-equipped estimators. This represents a 2.66% relative
decrease from Q4 2015.
Aftermarket Parts Use in Dollars
In Q4 2016, 20.66% of all parts dollars recorded on Mitchell appraisals
were attributed to Aftermarket sources, up 4.4 points from Q4 2015.
Remanufactured Parts Use in Dollars
Currently listed as “Non-New” parts in our estimating platform and
reporting products, Remanufactured parts currently represent 4.29% of
the average gross parts dollars used in Mitchell appraisals during Q4 2016.
This reflects a 1.27% relative decrease over this same period in 2016.
6.09% 6.16% 5.75% 5.56% 4.48% 4.29%
Q2 2014 Q4 2014 Q2 2015 Q4 2015 Q2 2016 Q4 2016
Parts-Remanufactured
13.72% 14.31% 14.28% 16.23% 19.46% 20.66%
Q2 2014 Q4 2014 Q2 2015 Q4 2015 Q2 2016 Q4 2016
Parts-Aftermarket
67.92% 66.83% 67.39% 65.92% 65.70% 63.26%
Q2 2014 Q4 2014 Q2 2015 Q4 2015 Q2 2016 Q4 2016
Parts-New
Mitchell’s Quality Recycled Parts
(QRP) program is the most compre-
hensive source for finding recycled
parts, providing online access to
a parts database compiled from a
growing network of more than 800
of the highest quality recyclers in
North America and Canada. QRP
is fully integrated with UltraMate
/ UltraMate Premier Suite for total
ease-of-use.
For more information on QRP,
visit Mitchell’s website at
www.mitchell.com
MITCHELL SOLUTION:
Mitchell QRP™
Mitchell MAPP™
Mitchell Alternate Parts Program
(MAPP) offers automated access
to nearly 100 Remanufactured and
Aftermarket part types from over
700 suppliers ensuring shops get the
parts they need from their preferred
vendors. MAPP is fully integrated
with UltraMate / UltraMate Premier
Suite for total ease-of-use.
For more information on MAPP,
visit Mitchell’s website at
www.mitchell.com
MITCHELL SOLUTION:
Mitchell Collision Repair Industry Data 37

EDITOR’S NOTE
It is commonly understood
within the collision repair
and insurance industries
that a very large number of
recycled “parts” are actually
“parts-assemblies” (such
as doors, which in fact
include numerous attached
parts and pieces). Thus,
attempting to make discrete
comparisons between the
average number of recycled
and any other parts types
used per estimate may be
difficult and inaccurate.
Mitchell’s Refinishing Materials
Calculator (RMC) provides accurate
calculations for refinishing materials costs by
incorporating a database of more than 8,500
paint codes from eight paint manufacturers.
It provides job-specific materials costing
according to color and type of paint, plus
access to the only automated, accurate,
field-tested, and industry-accepted break-
down of actual costs of primers, colors, clear
coats, additives and other materials needed
to restore vehicles to pre-accident condition.
For more information on RMC, visit
Mitchell’s website at www.mitchell.com
MITCHELL SOLUTION:
Mitchell RMC™
Recycled Parts Use in Dollars
Recycled parts constituted 11.79% of the average parts dollars used per
appraisal during Q4 2016, reflecting a 0.5% decrease from Q4 2015.
Paint and Materials
During Q4 2016, Paint and Materials made up 10.18% of our average
appraisal value, representing a 0.11% relative decrease from Q4
2015. Represented differently, the average paint and materials rate—
achieved by dividing the average paint and materials allowance per
estimate by the average estimate refinish hours—yielded a rate of
$33.53 per refinish hour in this period, compared to $33.18 in Q4 2015.
12.26% 12.70% 12.58% 12.29% 10.36% 11.79%
Q2 2014 Q4 2014 Q2 2015 Q4 2015 Q2 2016 Q4 2016
Parts-Recycled
2.4
0.48 0.24
8.09
0
1
2
3
4
5
6
7
8
9
Q2 14 Q4 14 Q2 15 Q4 15 Q2 16 Q4 16
New OEMAftermarketRecycledRemanufactured
10.64 10.38 10.55 10.29 10.19 10.18
32.55 32.77 33.25 33.18 33.37 33.53
Q2 2014 Q4 2014 Q2 2015 Q4 2015 Q2 2016 Q4 2016
Paint And Materials, By Quarter
Number of Parts by Part Type
The Number of Parts by Part Type
In order to capture another aspect of parts use, we calculate the number
of parts used by part type on a repairable estimate. In comparing Q4
2016 to the same quarter in 2015, aftermarket parts usage experienced a
substantive increase to an average 2.39 parts per estimate. At the same
time, new OEM, Remanufactured, and Recycled parts usage
experienced decreases.
3737 Mitchell Collision Repair Industry Data
38
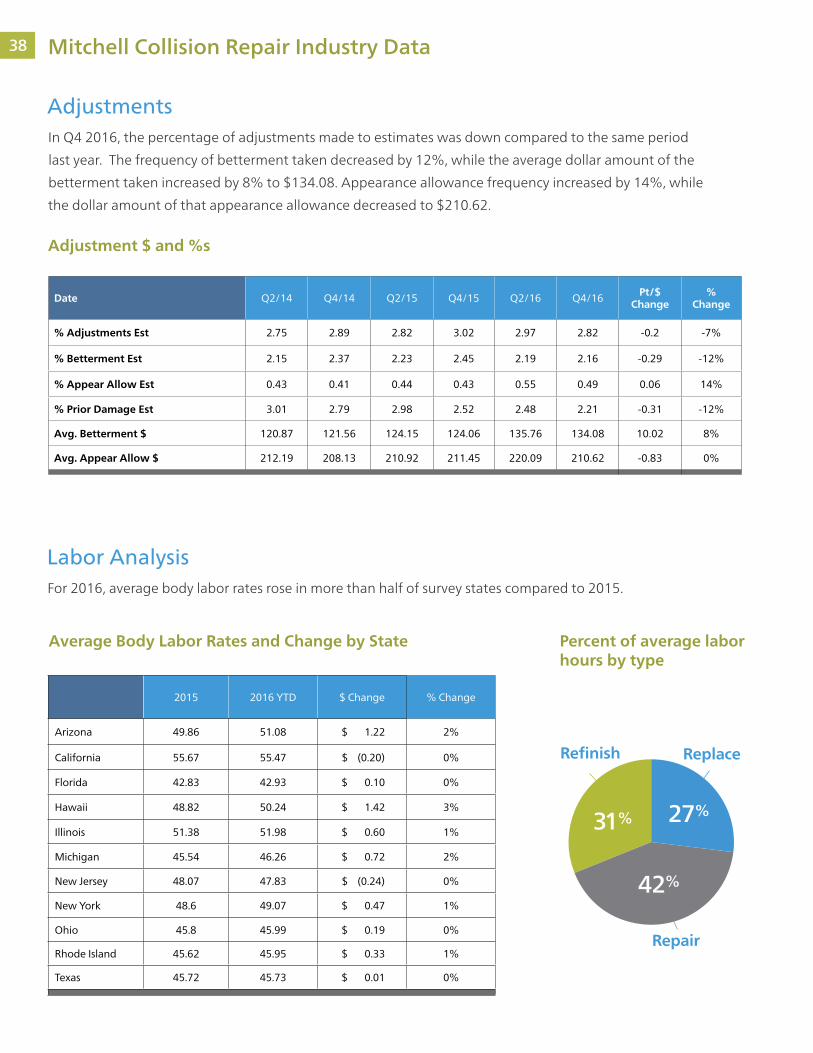
AdjustmentsIn Q4 2016, the percentage of adjustments made to estimates was down compared to the same period
last year. The frequency of betterment taken decreased by 12%, while the average dollar amount of the
betterment taken increased by 8% to $134.08. Appearance allowance frequency increased by 14%, while
the dollar amount of that appearance allowance decreased to $210.62.
Labor AnalysisFor 2016, average body labor rates rose in more than half of survey states compared to 2015.
Adjustment $ and %s
Percent of average labor hours by type
Average Body Labor Rates and Change by State
Repair
ReplaceRefinish
31% 27%
42%
Date Q2/14 Q4/14 Q2/15 Q4/15 Q2/16 Q4/16 Pt/$ Change
% Change
% Adjustments Est 2.75 2.89 2.82 3.02 2.97 2.82 -0.2 -7%
% Betterment Est 2.15 2.37 2.23 2.45 2.19 2.16 -0.29 -12%
% Appear Allow Est 0.43 0.41 0.44 0.43 0.55 0.49 0.06 14%
% Prior Damage Est 3.01 2.79 2.98 2.52 2.48 2.21 -0.31 -12%
Avg. Betterment $ 120.87 121.56 124.15 124.06 135.76 134.08 10.02 8%
Avg. Appear Allow $ 212.19 208.13 210.92 211.45 220.09 210.62 -0.83 0%
2015 2016 YTD $ Change % Change
Arizona 49.86 51.08 $ 1.22 2%
California 55.67 55.47 $ (0.20) 0%
Florida 42.83 42.93 $ 0.10 0%
Hawaii 48.82 50.24 $ 1.42 3%
Illinois 51.38 51.98 $ 0.60 1%
Michigan 45.54 46.26 $ 0.72 2%
New Jersey 48.07 47.83 $ (0.24) 0%
New York 48.6 49.07 $ 0.47 1%
Ohio 45.8 45.99 $ 0.19 0%
Rhode Island 45.62 45.95 $ 0.33 1%
Texas 45.72 45.73 $ 0.01 0%
Mitchell Collision Repair Industry Data 39

Mitchell WorkCenter™ Total LossMitchell WorkCenter™ Total Loss gives
your claims organization a
statistically-driven, fully-automated,
web-based total loss valuation system that
generates fair, market-driven values for
loss vehicles. It combines J.D. Power and
Associates’ data analysis and pricing
techniques with Mitchell’s recognized
leadership in physical damage claims
processing solutions. Mitchell WorkCenter™
Total Loss helps you reduce settlement
time and improve customer satisfaction. www.mitchell.com.
MITCHELL SOLUTION:
The chart below illustrates the total loss data for both vehicle age
and actual cash value of total loss vehicles processed through
Mitchell servers. Low fuel prices, along with favorable financing, are
contributing to stronger demand and pricing for used trucks and SUVs.
Vehicles Q2/14 Q4/14 Q2/15 Q4/15 Q2/16 Q4/16
Average Vehicle Age in Years
Convertible 12.14 12.83 12.35 12.74 12.79 13.47
Coupe 11.81 12.11 11.94 12.3 11.98 12.48
Hatchback 8.49 8.59 8.25 8.1 7.72 8.3
Sedan 10.3 10.53 10.26 10.47 10 10.55
Wagon 9.69 10.17 10.02 10.66 10.36 11.05
Other Passenger 12.63 12.67 13.04 12.2 10.87 4.44
Pickup 12.18 12.69 12.63 13.24 12.89 13.63
Van 11.04 11.49 11.29 11.76 11.42 11.89
SUV 10.09 10.42 10.2 10.47 10.1 10.76
Average Vehicle Age in Years
Vehicles Q2/14 Q4/14 Q2/15 Q4/15 Q2/16 Q4/16
Average Actual Cash Value
Convertible 10,045.93 9,575.86 10,163.23 10,245.21 10,023.98 9,956.42
Coupe 7,493.71 7,686.78 7,958.80 8,074.13 8,089.15 7,807.43
Hatchback 8,569.69 8,216.17 8,477.33 8,604.16 8,501.80 7,882.24
Sedan 7,560.96 7,577.53 7,803.98 7,723.94 7,800.33 7,304.79
Wagon 7,057.93 6,870.76 6,926.95 6,762.68 6,735.01 6,412.16
Other Passenger 14,606.06 17,769.01 14,698.45 18,002.34 18,937.53 18,752.23
Pickup 10,381.83 10,508.74 11,101.02 11,375.06 11,688.84 11,455.46
Van 6,034.97 6,044.28 6,248.82 6,409.64 6,600.89 6,615.45
SUV 9,290.57 9,453.64 9,809.46 10,050.35 10,131.81 9,755.17
Average Vehicle Total Loss Actual Cash Value
Total Loss3939 Mitchell Total Loss Data

40
$3,195 $3,719 $3,502 $3,880 $3,600 $4,008
$13,734
$15,202 $15,474 $16,409
$17,092 $18,683
$0
$2,000
$4,000
$6,000
$8,000
$10,000
$12,000
$14,000
$16,000
$18,000
$20,000
Q2 2014 5.41
Q4 2014 5.57
Q2 2015 5.48
Q4 2015 5.77
Q2 2016 5.61
Q4 2016 5.75 Avg. vehicle age in years
$4,088/
Appraisals ACV’s
Canadian Collision Summary
At the request of our
customers and friends in
Canada, we are pleased
to provide the following
Canada-specific statistics,
observations, and trends.
All dollar-figures
appearing in this section
are in CDN$. As a point
of clarification, this data
is the product of upload
activities from body shops,
independent appraisers,
and insurance personnel,
more accurately depicting
insurance-paid loss
activity, rather than
consumer direct or retail
market pricing.
Canadian Appraisal Severity
Collision LossesThe average initial gross collision appraisal value uploaded through
Mitchell Canadian systems in Q4 2016 was $3,914, a $97 increase from
Q4 2015. Factoring for development yields an anticipated increase to
$3,992, which represents a $175 increase from Q4 2015.
Canadian Average Appraisal Make-UpThis chart compares the average appraisal make up as a percentage of dollars. These data points reflect an
increase in parts, with slight decreases in labour and paint.
Average Appraisal Values Severity OverallThe average gross initial appraisal value, calculated by combining data
from all first and third party repairable vehicle appraisals uploaded
through Mitchell Canadian systems in Q4 2016, was $4,008—a
$128 increase from Q4 2015. Factoring for development yields an
anticipated increase to $4,088.
$3,222 $3,650 $3,512 $3,817 $3,720 $3,914
$13,751
$15,100 $15,332 $16,248
$16,715 $18,260
$0
$2,000
$4,000
$6,000
$8,000
$10,000
$12,000
$14,000
$16,000
$18,000
$20,000
Q2 2014 5.31
Q4 2014 5.48
Q2 2015 5.38
Q4 2015 5.68
Q2 2016 5.50
Q4 2016 5.63
Appraisals ACV’s
Avg. vehicle age in years
$3,992/
Date Q2/14 Q4/14 Q2/15 Q4/15 Q2/16 Q4/16 Pt/$ Change % Change
% Average Part $ 42.63 44.65 43.65 45.68 45.28 46.7 1.02 2%
% Average Labour $ 45.37 44.16 44.33 42.78 42.99 41.99 -0.79 -2%
% Paint Material $ 9.08 8.28 8.68 8.18 8.82 8.07 -0.11 -1%
EDITOR’S NOTE
41
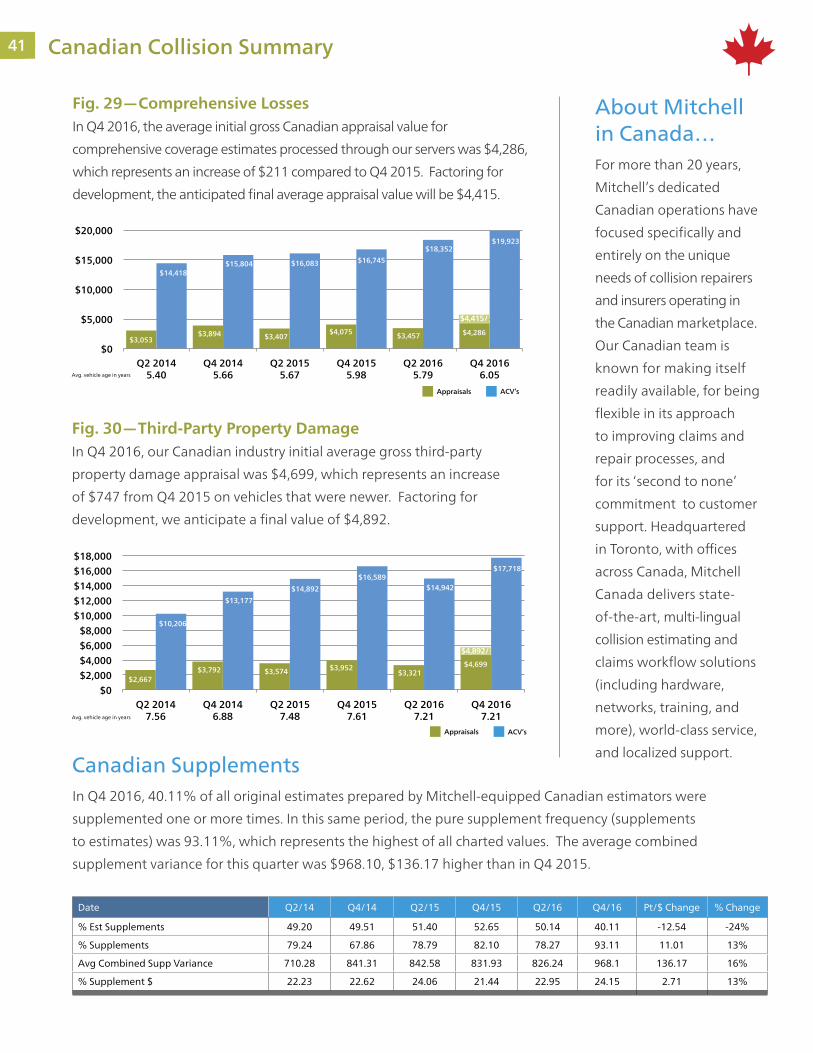
Canadian SupplementsIn Q4 2016, 40.11% of all original estimates prepared by Mitchell-equipped Canadian estimators were
supplemented one or more times. In this same period, the pure supplement frequency (supplements
to estimates) was 93.11%, which represents the highest of all charted values. The average combined
supplement variance for this quarter was $968.10, $136.17 higher than in Q4 2015.
About Mitchell in Canada…For more than 20 years,
Mitchell’s dedicated
Canadian operations have
focused specifically and
entirely on the unique
needs of collision repairers
and insurers operating in
the Canadian marketplace.
Our Canadian team is
known for making itself
readily available, for being
flexible in its approach
to improving claims and
repair processes, and
for its ‘second to none’
commitment to customer
support. Headquartered
in Toronto, with offices
across Canada, Mitchell
Canada delivers state-
of-the-art, multi-lingual
collision estimating and
claims workflow solutions
(including hardware,
networks, training, and
more), world-class service,
and localized support.
Fig. 30—Third-Party Property DamageIn Q4 2016, our Canadian industry initial average gross third-party
property damage appraisal was $4,699, which represents an increase
of $747 from Q4 2015 on vehicles that were newer. Factoring for
development, we anticipate a final value of $4,892.
ACV’sAppraisals
$2,796/
$2,667 $3,792 $3,574 $3,952
$3,321 $4,699
$10,206
$13,177
$14,892
$16,589 $14,942
$17,718
$0
$2,000
$4,000
$6,000
$8,000
$10,000
$12,000
$14,000
$16,000
$18,000
$20,000
Q2 2014 7.56
Q4 2014 6.88
Q2 2015 7.48
Q4 2015 7.61
Q2 2016 7.21
Q4 2016 7.21 Avg. vehicle age in years
$4,892/
Date Q2/14 Q4/14 Q2/15 Q4/15 Q2/16 Q4/16 Pt/$ Change % Change
% Est Supplements 49.20 49.51 51.40 52.65 50.14 40.11 -12.54 -24%
% Supplements 79.24 67.86 78.79 82.10 78.27 93.11 11.01 13%
Avg Combined Supp Variance 710.28 841.31 842.58 831.93 826.24 968.1 136.17 16%
% Supplement $ 22.23 22.62 24.06 21.44 22.95 24.15 2.71 13%
Fig. 29—Comprehensive LossesIn Q4 2016, the average initial gross Canadian appraisal value for
comprehensive coverage estimates processed through our servers was $4,286,
which represents an increase of $211 compared to Q4 2015. Factoring for
development, the anticipated final average appraisal value will be $4,415.
$3,053 $3,894 $3,407
$4,075 $3,457 $4,286
$14,418 $15,804 $16,083 $16,745
$18,352 $19,923
$0
$5,000
$10,000
$15,000
$20,000
$25,000
Q2 2014 5.40
Q4 2014 5.66
Q2 2015 5.67
Q4 2015 5.98
Q2 2016 5.79
Q4 2016 6.05
$4,415/
Appraisals ACV’s
Avg. vehicle age in years
4141 Canadian Collision Summary
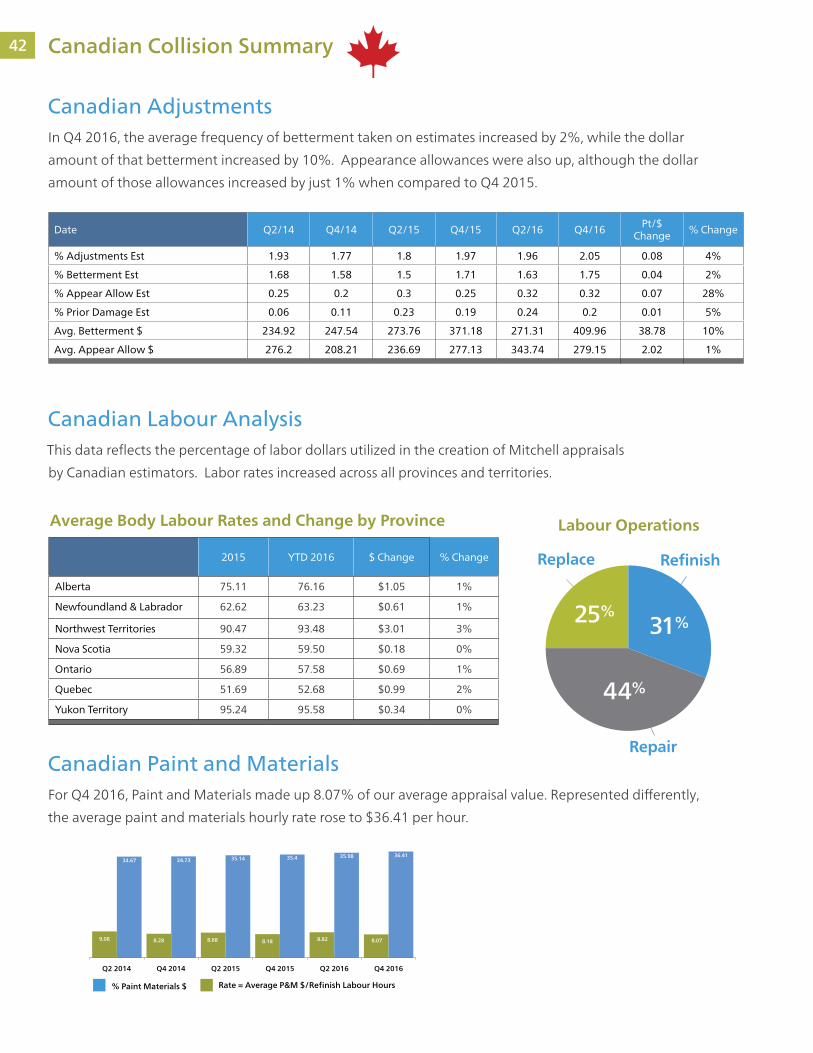
42 Canadian Collision Summary
Labour OperationsAverage Body Labour Rates and Change by Province
Canadian AdjustmentsIn Q4 2016, the average frequency of betterment taken on estimates increased by 2%, while the dollar
amount of that betterment increased by 10%. Appearance allowances were also up, although the dollar
amount of those allowances increased by just 1% when compared to Q4 2015.
Canadian Labour AnalysisThis data reflects the percentage of labor dollars utilized in the creation of Mitchell appraisals
by Canadian estimators. Labor rates increased across all provinces and territories.
Canadian Paint and MaterialsFor Q4 2016, Paint and Materials made up 8.07% of our average appraisal value. Represented differently,
the average paint and materials hourly rate rose to $36.41 per hour.
9.08 8.28 8.68 8.18 8.82 8.07
34.67 34.73 35.14 35.4 35.98 36.41
Q2 2014 Q4 2014 Q2 2015 Q4 2015 Q2 2016 Q4 2016
% Paint Materials $ Rate = Average P&M $/Refinish Labour Hours
Repair
RefinishReplace
25%31%
44%
Date Q2/14 Q4/14 Q2/15 Q4/15 Q2/16 Q4/16 Pt/$ Change % Change
% Adjustments Est 1.93 1.77 1.8 1.97 1.96 2.05 0.08 4%
% Betterment Est 1.68 1.58 1.5 1.71 1.63 1.75 0.04 2%
% Appear Allow Est 0.25 0.2 0.3 0.25 0.32 0.32 0.07 28%
% Prior Damage Est 0.06 0.11 0.23 0.19 0.24 0.2 0.01 5%
Avg. Betterment $ 234.92 247.54 273.76 371.18 271.31 409.96 38.78 10%
Avg. Appear Allow $ 276.2 208.21 236.69 277.13 343.74 279.15 2.02 1%
2015 YTD 2016 $ Change % Change
Alberta 75.11 76.16 $1.05 1%
Newfoundland & Labrador 62.62 63.23 $0.61 1%
Northwest Territories 90.47 93.48 $3.01 3%
Nova Scotia 59.32 59.50 $0.18 0%
Ontario 56.89 57.58 $0.69 1%
Quebec 51.69 52.68 $0.99 2%
Yukon Territory 95.24 95.58 $0.34 0%
43
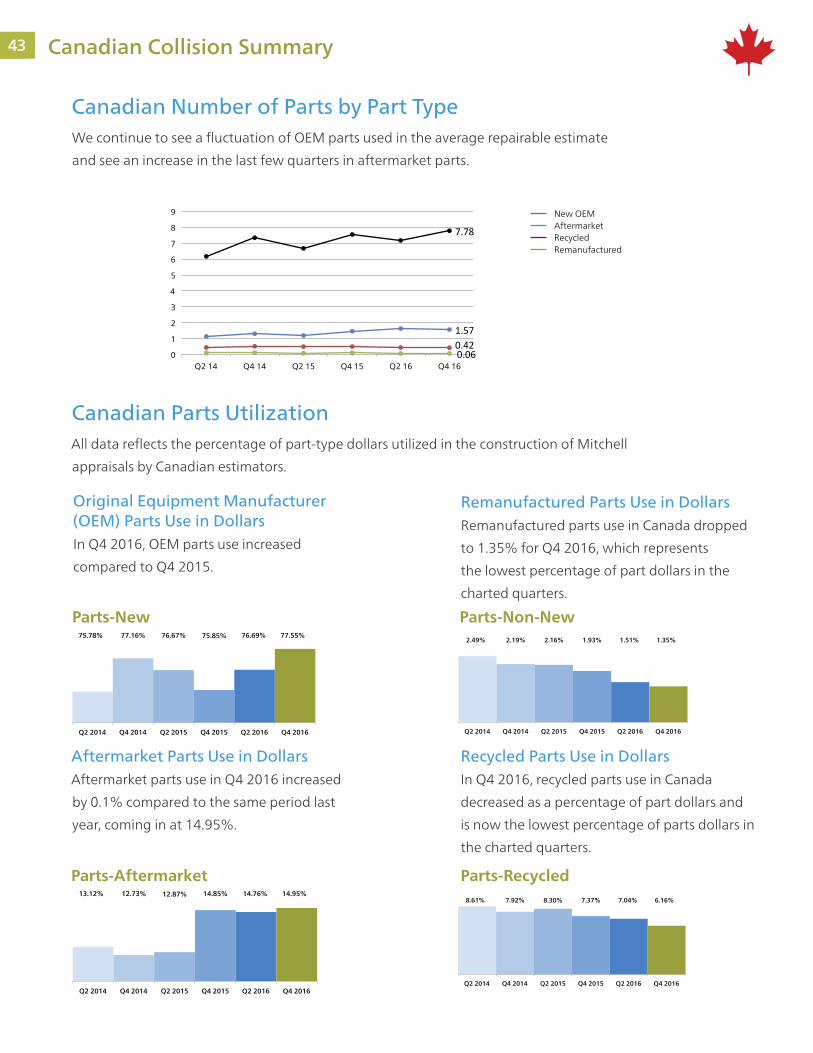
Parts-Recycled
Canadian Parts UtilizationAll data reflects the percentage of part-type dollars utilized in the construction of Mitchell
appraisals by Canadian estimators.
Canadian Number of Parts by Part TypeWe continue to see a fluctuation of OEM parts used in the average repairable estimate
and see an increase in the last few quarters in aftermarket parts.
Original Equipment Manufacturer (OEM) Parts Use in DollarsIn Q4 2016, OEM parts use increased
compared to Q4 2015.
Remanufactured Parts Use in DollarsRemanufactured parts use in Canada dropped
to 1.35% for Q4 2016, which represents
the lowest percentage of part dollars in the
charted quarters.
Recycled Parts Use in DollarsIn Q4 2016, recycled parts use in Canada
decreased as a percentage of part dollars and
is now the lowest percentage of parts dollars in
the charted quarters.
Aftermarket Parts Use in DollarsAftermarket parts use in Q4 2016 increased
by 0.1% compared to the same period last
year, coming in at 14.95%.
Parts-Non-New2.49% 2.19% 2.16% 1.93% 1.51% 1.35%
Q2 2014 Q4 2014 Q2 2015 Q4 2015 Q2 2016 Q4 2016
8.61% 7.92% 8.30% 7.37% 7.04% 6.16%
Q2 2014 Q4 2014 Q2 2015 Q4 2015 Q2 2016 Q4 2016
75.78% 77.16% 76.67% 75.85% 76.69% 77.55%
Q2 2014 Q4 2014 Q2 2015 Q4 2015 Q2 2016 Q4 2016
1.57 0.42 0.06
7.78
0
1
2
3
4
5
6
7
8
9
Q2 14 Q4 14 Q2 15 Q4 15 Q2 16 Q4 16
New OEMAftermarketRecycledRemanufactured
13.12% 12.73% 12.87% 14.85% 14.76% 14.95%
Q2 2014 Q4 2014 Q2 2015 Q4 2015 Q2 2016 Q4 2016
Parts-Aftermarket
Parts-New
4343 Canadian Collision Summary

44 About Mitchell
Mitchell San Diego Headquarters 6220 Greenwich Dr. San Diego, CA 92122
Mitchell empowers clients to
achieve measurably better
outcomes. Providing unparalleled
breadth of technology,
connectivity and information
solutions to the Property &
Casualty claims and Collision
Repair industries, Mitchell
is uniquely able to simplify
and accelerate the claims
management and collision
repair processes.
As a leading provider of Property
& Casualty claims technology
solutions, Mitchell processes
over 50 million transactions
annually for over 300 insurance
companies/claims payers and over
30,000 collision repair facilities
throughout North America.
Founded in 1946, Mitchell is
headquartered in San Diego,
California, and has approximately
2,000 employees. The company is
privately owned primarily by KKR,
a leading global investment firm.
For more information on Mitchell,
visit www.mitchell.com.
45

Mitchell in the News
For More Mitchell News:
‘The Mitchell Way’ guides San Diego company for 70 yearsMitchell is recognized as a top workplace by the San Diego Union-
Tribune and Alex Sun shares insights about the company culture.
Read More at The San Diego Union Tribune
Mitchell Announces $50 Million First Lien Term Loan Mitchell announces the closing of a $50 million senior secured first lien
term loan to continue investing in technologies that drive better out-
comes in the markets we serve.
Read More at ABL Advisor
Mitchell’s Annual Property & Casualty Conference Attracts Industry Leaders The gathering of experts in auto physical damage, auto casualty and
workers’ compensation insurance claims served as a platform for
Mitchell to share insights and listen to their customers on topics ranging
from consumer preferences to technology trends affecting the industry.
Read More at ABRN
Streamlining Parts Procurement Jack Rozint discusses Mitchell’s new parts procurement initiative,
Mitchell Parts.
Watch the Video at FenderBender Live
Friday Fun: DeLoreans return, crashes in the smartphone era and a look at odd driving laws from EuropeCollision Repair magazine mentioned a blog post by Alex Sun in their
Friday industry roundup where Alex talks about how peer-to-peer
transactions are transforming the insurance industry.
Read More at Collision Repair Magazine
LIVE
Press Releases Mitchell_IntlMitchell International MitchellRepair Mitchell ClaimsMitchellPBM
4545 Mitchell in the News

Industry Trends
ReportThe Industry Trends Report is a quarterly snapshot of the auto physical damage collision and casualty industries. Just inside— the economy, industry highlights, plus illuminating statistics and measures, and more. Stay informed on ongoing and emerging trends impacting the industry, and you, with the Industry Trends Report!
Questions or comments about the Industry Trends Report may be directed to:
Hans Littooy Vice President, Consulting and Professional Services, Mitchell Auto Physical Damage [email protected]
Additional Contributors:
Kontos Kommentary is produced monthly by Tom Kontos, Executive Vice-President, ADESA Analytical Services. ADESA is a leading provider of wholesale used vehicle auctions and ancillary remarketing services. As part of the KAR Auction Services family, ADESA works in collaboration with its sister company, Insurance Auto Auctions, a leading salvage auto auction company, to provide insights, trends and highlights of the entire automotive auction industry.
For more information about Enterprise Rent-A-Car Average Length of Rental and to access your market and shop numbers please contact [email protected].
Volume Seventeen Number OneQ1 2017 Published by Mitchell
©2017 Mitchell All Rights Reserved.