Embed Size (px)
Citation preview

www.canadean-winesandspirits.com
1.
Industry Forecast
Latest Trends and Key Issues in the South African
Retail Packaging Market
The Outlook for Primary Packaging Containers, Closures and
Outers to 2017
Reference Code: PK1118MR
Published: December 2013

©Canadean 2013. This product is licensed and is not to be photocopied. Reference code: PK1118MR 2
Latest Trends and Key Issues in the South African Retail Packaging Market
Published: December 2013
Table of Contents
1. Executive Summary ................................................................................... 8
2. Overview of the South African Packaging Market ................................. 10
3. Consumer Drivers .................................................................................... 13
3.1 Declining household size and young consumers driving demographic
changes ............................................................................................................. 13
3.1.1 Shrinking household size increases demand for smaller pack sizes ................................ 13
3.1.2 Packaging is a key aspect influencing young South African consumers’ buying behavior14
3.1.3 Children form a significant consumer segment ................................................................. 15
3.2 Increasing tourist arrivals in South Africa are creating a new consumer
group ................................................................................................................. 16
3.3 Significant income disparity and high unemployment create a diverse
consumer base .................................................................................................. 17
3.3.1 High income disparity affecting consumer’s buying pattern .............................................. 17
3.3.2 High unemployment rate prevalent in the country ............................................................. 18
3.4 Shopping behavior is being influenced by growth in the retail sector and
technology ......................................................................................................... 19
3.4.1 Growing demand for private label products is expected to drive demand for innovative
packaging .......................................................................................................................... 19
3.4.2 Growth in Organized Retail is expected to drive demand for packaged goods ................ 20
3.4.3 Growth in use of internet and smartphone sales are keys to boost online purchases ...... 21
4. Market Dynamics ...................................................................................... 23
4.1 Overview ............................................................................................................ 23
4.1.1 South Africa Packaging by Material .................................................................................. 23
4.1.2 South Africa Packaging by Market .................................................................................... 25
4.1.3 South Africa Packaging by Type ....................................................................................... 25
4.2 Flexible Packaging ............................................................................................. 27
4.2.1 Overall Flexible Packaging Market .................................................................................... 27
4.2.2 Number of Flexible Packaging Packs by Market ............................................................... 28
4.2.3 Number of Flexible Packaging Packs by Type .................................................................. 29
4.2.4 Number of Flexible Packaging Packs by Closure Material ............................................... 30
4.2.5 Number of Flexible Packaging Packs by Closure Type .................................................... 30
4.2.6 Number of Flexible Packaging Packs by Outer Material ................................................... 31
4.2.7 Number of Flexible Packaging Packs by Outer Type ........................................................ 31
4.3 Paper & Board ................................................................................................... 32
4.3.1 Overall Paper & Board Packaging Market......................................................................... 32
4.3.2 Number of Paper & Board Packs by Market ..................................................................... 33
4.3.3 Number of Paper & Board Packs by Type ........................................................................ 34

©Canadean 2013. This product is licensed and is not to be photocopied. Reference code: PK1118MR 3
Latest Trends and Key Issues in the South African Retail Packaging Market
Published: December 2013
4.3.4 Number of Paper & Board Packs by Closure Material ...................................................... 35
4.3.5 Number of Paper & Board Packs by Closure Type ........................................................... 35
4.3.6 Number of Paper & Board Packs by Outer Material ......................................................... 36
4.3.7 Number of Paper & Board Packs by Outer Type .............................................................. 37
4.4 Rigid Plastics ..................................................................................................... 38
4.4.1 Overall Rigid Plastic Packaging Market ............................................................................ 38
4.4.2 Number of Rigid Plastic Packs by Market ......................................................................... 39
4.4.3 Number of Rigid Plastic Packs by Type ............................................................................ 40
4.4.4 Number of Rigid Plastic Packs by Closure Material .......................................................... 41
4.4.5 Number of Rigid Plastic Packs by Closure Type ............................................................... 41
4.4.6 Number of Rigid Plastic Packs by Outer Material ............................................................. 42
4.4.7 Number of Rigid Plastic Packs by Outer Type .................................................................. 43
4.5 Rigid Metal ......................................................................................................... 44
4.5.1 Overall Rigid Metal Packaging Market .............................................................................. 44
4.5.2 Number of Rigid Metal Packs by Market ........................................................................... 45
4.5.3 Number of Rigid Metal Packs by Type .............................................................................. 46
4.5.4 Number of Rigid Metal Packs by Closure Material ............................................................ 47
4.5.5 Number of Rigid Metal Packs by Closure Type ................................................................ 47
4.5.6 Number of Rigid Metal Packs by Outer Material ............................................................... 48
4.5.7 Number of Rigid Metal Packs by Outer Type .................................................................... 49
4.6 Glass ................................................................................................................. 50
4.6.1 Overall Glass Packaging Market ....................................................................................... 50
4.6.2 Number of Glass Packs by Market .................................................................................... 51
4.6.3 Number of Glass Packs by Type ....................................................................................... 52
4.6.4 Number of Glass Packs by Closure Material .................................................................... 52
4.6.5 Number of Glass Packs by Closure Type ......................................................................... 53
4.6.6 Number of Glass Packs by Outer Material ........................................................................ 54
4.6.7 Number of Glass Packs by Outer Type ............................................................................. 54
5. Packaging Design and Manufacturing Trends ....................................... 56
5.1 Key Design Trends ............................................................................................ 56
5.1.1 Preference for convenient packaging is increasing in South Africa .................................. 56
5.1.2 Innovations in closures are widely used to extend convenience ...................................... 58
5.1.3 Environmentally-friendly packaging used widely to reduce carbon emission ................... 61
5.1.4 Lightweight packaging has multiple benefits including reduced cost ................................ 64
5.1.5 Innovations in Pet Food packaging to create product differentiation ................................ 66
5.1.6 Packaging firms need to more closely align themselves with manufacturers’ needs ....... 67
5.2 Key Manufacturing Trends ................................................................................. 69
5.2.1 Advanced Labeling on packages gain importance in retail product packs ....................... 69
5.2.2 Advancements in microwaveable packaging boosted by busy consumers ...................... 73

©Canadean 2013. This product is licensed and is not to be photocopied. Reference code: PK1118MR 4
Latest Trends and Key Issues in the South African Retail Packaging Market
Published: December 2013
5.2.3 Seven layer co-extrusion film extruder machine increase shelf life of food products ....... 75
5.2.4 Robotic packaging is gaining prominence in the South African Food and Beverage
industry .............................................................................................................................. 76
5.2.5 Difficulties in raw material procurement are driving up costs ............................................ 77
6. Regulatory Environment .......................................................................... 78
6.1 Overview ............................................................................................................ 78
6.2 Key Directives and Laws .................................................................................... 78
6.2.1 The Foodstuffs, Disinfectants and Cosmetics Act (FDCA), 1972 ..................................... 78
6.2.2 Regulations relating to the labeling, advertising and sale of Tobacco products ............... 79
6.2.3 National Environmental Management: Waste Act (NWMS) .............................................. 80
7. Competitive Landscape ........................................................................... 81
7.1 Competitive Landscape by Packaging Material .................................................. 81
7.1.1 Rigid Plastics ..................................................................................................................... 81
7.1.2 Flexible Packaging ............................................................................................................ 82
7.1.3 Paper & Board ................................................................................................................... 82
7.1.4 Rigid Metal ......................................................................................................................... 83
7.1.5 Glass.................................................................................................................................. 83
7.2 Key Companies in South Africa Packaging Industry ........................................... 85
7.3 Key Financial Deals ........................................................................................... 86
8. Appendix ................................................................................................... 87
8.1 What is this Report About?................................................................................. 87
8.2 Time Frame ....................................................................................................... 87
8.3 Product Category Coverage ............................................................................... 88
8.4 Packaging Definitions......................................................................................... 93
8.4.1 Primary Packaging Container ............................................................................................ 93
8.4.2 Primary Packaging Closure ............................................................................................... 95
8.4.3 Primary Packaging Outer .................................................................................................. 96
8.5 Methodology ...................................................................................................... 97
8.5.1 Overall Research Program Framework ............................................................................. 97
8.6 About Canadean .............................................................................................. 100
8.7 Disclaimer ........................................................................................................ 100

©Canadean 2013. This product is licensed and is not to be photocopied. Reference code: PK1118MR 5
Latest Trends and Key Issues in the South African Retail Packaging Market
Published: December 2013
List of Figures
Figure 1: Market share of various packaging materials (%), 2012.................................................................................. 10 Figure 2:CPG companies introducing products in small packs ...................................................................................... 14 Figure 3: Age distribution chart for 2012 ........................................................................................................................ 14 Figure 4: CPG companies launching products targeted towards South Africa’s young population ................................. 15 Figure 5: CPG companies launching products Specially targeting children .................................................................... 16 Figure 6: Number of foreign tourists arriving to South Africa .......................................................................................... 17 Figure 7: Unemployment rate in South Africa over the period 2008–2012 ..................................................................... 19 Figure 8: Different Packaging Options for Jams for different Pick n Pay Private Label brands ....................................... 20 Figure 9:Growing Organized Retail in South Africa ........................................................................................................ 21 Figure 10: Online Retail Sales and Online Penetration in South Africa is growing ......................................................... 22 Figure 11: South Africa Packaging by Material (Number of Packs, Million), 2007–2017 ................................................ 23 Figure 12: Sectors by Packaging Material with the Four Highest Growth Rates (%), 2007–2017 ................................... 24 Figure 13: Sectors by Packaging Material with the Four Lowest Growth Rates (%), 2007–2017 .................................... 25 Figure 14: Number of Flexible Packaging Units (Millions) and Annual Growth (%), 2007–2017 ..................................... 27 Figure 15: Sectors with the Largest Market Share Gains and Losses in Flexible Packaging, 2007–2017 ...................... 28 Figure 16: Packaging Types with the Largest Market Share Gains and Losses in South Africa Flexible Packaging, 2007–
2017 .............................................................................................................................................................................. 29 Figure 17: Number of Paper & Board Packaging Units (Millions) and Annual Growth (%), 2007–2017 .......................... 32 Figure 18: Sectors with the Largest Market Share Gains and Losses in South Africa Paper & Board Packaging, 2007–
2017 .............................................................................................................................................................................. 33 Figure 19: Packaging Types with the Largest Market Share Gains and Losses in South Africa Paper & Board Packaging
2007–2017 .................................................................................................................................................................... 34 Figure 20: Closure Types with the Largest Market Share Gains and Losses in South Africa Paper & Board Packaging,
2007–2017 .................................................................................................................................................................... 36 Figure 21: Number of Rigid Plastic Packaging Units (Millions) and Annual Growth (%), 2007–2017 .............................. 38 Figure 22: Sectors with the Largest Market Share Gains and Losses in South Africa Rigid Plastic Packaging, 2007–2017
..................................................................................................................................................................................... 39 Figure 23: Packaging Types with the Largest Market Share Gains and Losses in South Africa Rigid Plastic Packaging,
2007–2017 .................................................................................................................................................................... 40 Figure 24: Closure Types with the Largest Market Share Gains and Losses in South Africa Rigid Plastic Packaging,
2007–2017 .................................................................................................................................................................... 42 Figure 25: Outer Types with the Largest Market Share Gains and Losses in South Africa Rigid Plastic Packaging, 2007–
2017 .............................................................................................................................................................................. 43 Figure 26: Number of Rigid Metal Packaging Units (Millions) and Annual Growth (%), 2007–2017 ............................... 44 Figure 27: Sectors with the Largest Market Share Gains and Losses in South Africa Rigid Metal Packaging, 2007–2017
..................................................................................................................................................................................... 45 Figure 28: Packaging Types with the Largest Market Share Gains and Losses in South Africa Rigid Metal Packaging,
2007–2017 .................................................................................................................................................................... 46 Figure 29: Closure Types with the Largest Market Share Gains and Losses in South Africa Rigid Metal Packaging,
2007–2017 .................................................................................................................................................................... 48 Figure 30: Outer Types with the Largest Market Share Gains and Losses in South Africa Rigid Metal Packaging, 2007–
2017 .............................................................................................................................................................................. 49 Figure 31: Number of Glass Packaging Units (Millions) and Annual Growth (%), 2007–2017 ........................................ 50 Figure 32: Sectors with the Largest Market Share Gains and Losses in South Africa Glass Packaging, 2007–2017 ..... 51 Figure 33: Closure Type with the Largest Market Share Gains and Losses in South Africa Glass Packaging, 2007–2017
..................................................................................................................................................................................... 53 Figure 34: Sectors with the Largest Market Share Gains and Losses in South Africa Glass Packaging, 2007–2017 ..... 55 Figure 35: New packaging design for Milk is easy-to-open, easy-to-pour and easy-to-store .......................................... 57 Figure 36: Ready Eggs in a pasteurized format inside a HDPE bottle ........................................................................... 58 Figure 37: Re-sealable rusk package for consumer convenience which differentiates their product from competitor’s
product .......................................................................................................................................................................... 59 Figure 38: Screw Top closure for Wine ensure convenience in opening and closing of the bottle .................................. 59 Figure 39: Re-sealable chocolate wrapper keeps chocolate fresh even after once opened ........................................... 60 Figure 40: Recyclable Metal can for beverage with a full aperture end .......................................................................... 61 Figure 41: Lower carbon emissions by plant based PET bottle ...................................................................................... 62 Figure 42: Environmentally-friendly cartons packs with convenient openings ................................................................ 62 Figure 43: Pouch without inner foil used to reduce carbon footprint ............................................................................... 63 Figure 44: Packaging materials of Bottles made from recycled contents ....................................................................... 64
©Canadean 2013. This product is licensed and is not to be photocopied. Reference code: PK1118MR 6
Latest Trends and Key Issues in the South African Retail Packaging Market
Published: December 2013
Figure 45: Metal can packaging instead of Glass bottle for RTD drink ........................................................................... 65 Figure 46: Lightweight glass bottle manufactured using narrow neck press-and-blow process ...................................... 65 Figure 47: Cat Food in sealable carton pack ................................................................................................................. 66 Figure 48: Dog Food with valves for increased safety.................................................................................................... 67 Figure 49: Key concerns of consumer goods manufacturers and packaging manufacturers, 2013 ................................ 68 Figure 50: Pressure-sensitive label application on beverage bottles .............................................................................. 70 Figure 51: In-mold label used on tubs of yogurt from Marcel ......................................................................................... 71 Figure 52: Bottles of wine wrapped with shrink-sleeve labels ........................................................................................ 72 Figure 53: Thermotech ink for labeling which is water resistant and adheres to polymer ............................................... 72 Figure 54: Thermochromic ink changes color when beer is chilled ................................................................................ 73 Figure 55: Spar’s Freshline Ready-To-Heat soups in microwaveable tubs .................................................................... 74 Figure 56: Dual vent technology in microwaveable seafood package helps to ease cooking ......................................... 75 Figure 57: Use of robots for packing Beef patties in a Carton ........................................................................................ 76 Figure 58: Crude Oil prices have risen sharply since 2003, and are forecast to remain high .......................................... 77 Figure 59: South Africa Packaging Competitive Landscape........................................................................................... 85 Figure 60: Methodology ................................................................................................................................................. 97
©Canadean 2013. This product is licensed and is not to be photocopied. Reference code: PK1118MR 7
Latest Trends and Key Issues in the South African Retail Packaging Market
Published: December 2013
List of Tables
Table 1: Gini Coefficient Comparison across African Countries ..................................................................................... 18 Table 2: Growing Organized Retail in South Africa ........................................................................................................ 21 Table 3: South Africa Online Retail Sales (ZAR billion) and Online Penetration (%), 2007–2017 ................................... 22 Table 4: South Africa Packaging by Material (Number of Packs, Million), 2007, 2012 and 2017 .................................... 24 Table 5: South Africa Packaging by Market (Number of Packs, Million), 2007, 2012 and 2017 ...................................... 25 Table 6: South Africa Packaging by Type (Number of Packs, Million), 2007, 2012 and 2017 ......................................... 26 Table 7: Number of Flexible Packaging Units (Millions) and Annual Growth (%), 2007–2017 ........................................ 27 Table 8: South Africa Flexible Packaging by Market (Number of Packs, Million), 2007, 2012 and 2017 ......................... 28 Table 9: South Africa Flexible Packaging by Type (Number of Packs, Million), 2007, 2012 and 2017............................ 29 Table 10: South Africa Flexible Packaging by Closure Material (Number of Packs, Million), 2007, 2012 and 2017 ........ 30 Table 11: South Africa Flexible Packaging by Closure Type (Number of Packs, Million), 2007, 2012 and 2017 ............ 30 Table 12: South Africa Flexible Packaging by Outer Material (Number of Packs, Million), 2007, 2012 and 2017 ........... 31 Table 13: South Africa Flexible Packaging by Outer Type (Number of Packs, Million), 2007, 2012 and 2017 ................ 31 Table 14: Number of Paper & Board Packaging Units (Millions) and Annual Growth (%), 2007–2017 ........................... 32 Table 15: South Africa Paper & Board Packaging by Market (Number of Packs, Million), 2007, 2012 and 2017 ............ 33 Table 16: South Africa Paper & Board Packaging by Type (Number of Packs, Million), 2007, 2012 and 2017 ............... 34 Table 17: South Africa Paper & Board Packaging by Closure Material (Number of Packs, Million), 2007, 2012 and 2017
..................................................................................................................................................................................... 35 Table 18: South Africa Paper & Board Packaging by Closure Type (Number of Packs, Million), 2007, 2012 and 2017 .. 35 Table 19: South Africa Paper & Board Packaging by Outer Material (Number of Packs, Million), 2007, 2012 and 2017 36 Table 20: South Africa Paper & Board Packaging by Outer Type (Number of Packs, Million), 2007, 2012 and 2017 ..... 37 Table 21: Number of Rigid Plastic Packaging Units (Millions) and Annual Growth (%), 2007–2017 ............................... 38 Table 22: South Africa Rigid Plastic Packaging by Market (Number of Packs, Million), 2007, 2012 and 2017 ............... 39 Table 23: South Africa Rigid Plastic Packaging by Type (Number of Packs, Million), 2007, 2012 and 2017 .................. 40 Table 24: South Africa Rigid Plastic Packaging by Closure Material (Number of Packs, Million), 2007, 2012 and 2017 . 41 Table 25: South Africa Rigid Plastic Packaging by Closure Type (Number of Packs, Million), 2007, 2012 and 2017 ..... 41 Table 26: South Africa Rigid Plastic Packaging by Outer Material (Number of Packs, Million), 2007, 2012 and 2017 .... 42 Table 27: South Africa Rigid Plastic Packaging by Outer Type (Number of Packs, Million), 2007, 2012 and 2017 ......... 43 Table 28: Number of Rigid Metal Packaging Units (Millions) and Annual Growth (%), 2007–2017 ................................. 44 Table 29: South Africa Rigid Metal Packaging by Market (Number of Packs, Million), 2007, 2012 and 2017 ................. 45 Table 30: South Africa Rigid Metal Packaging by Type (Number of Packs, Million), 2007, 2012 and 2017 .................... 46 Table 31: South Africa Rigid Metal Packaging by Closure Material (Number of Packs, Million), 2007, 2012 and 2017 .. 47 Table 32: South Africa Rigid Metal Packaging by Closure Type (Number of Packs, Million), 2007, 2012 and 2017 ....... 47 Table 33: South Africa Rigid Metal Packaging by Outer Material (Number of Packs, Million), 2007, 2012 and 2017 ...... 48 Table 34: South Africa Rigid Metal Packaging by Outer Type (Number of Packs, Million), 2007, 2012 and 2017 .......... 49 Table 35: Number of Glass Packaging Units (Millions) and Annual Growth (%), 2007–2017 ......................................... 50 Table 36: South Africa Glass Packaging by Market (Number of Packs, Million), 2007, 2012 and 2017 .......................... 51 Table 37: South Africa Glass Packaging by Type (Number of Packs, Million), 2007, 2012 and 2017 ............................. 52 Table 38: South Africa Glass Packaging by Closure Material (Number of Packs, Million), 2007, 2012 and 2017 ........... 52 Table 39: South Africa Glass Packaging by Closure Type (Number of Packs, Million), 2007, 2012 and 2017 ................ 53 Table 40: South Africa Glass Packaging by Outer Material (Number of Packs, Million), 2007, 2012 and 2017 .............. 54 Table 41: South Africa Glass Packaging by Outer Type (Number of Packs, Million), 2007, 2012 and 2017 ................... 54 Table 42: Eight Primary and accompanying Secondary warnings for Smokable Tobacco products ............................... 79 Table 43: South Africa Recycling Targets (%), 2015 ..................................................................................................... 80 Table 46: Key Financial Deals in South Africa Packaging, 2012 - 2013 ......................................................................... 86 Table 44: Product Category Coverage .......................................................................................................................... 88 Table 45: Primary Packaging Container Materials ......................................................................................................... 93 Table 46: Primary Packaging Container Types .............................................................................................................. 93 Table 47: Primary Packaging Closure Materials ............................................................................................................ 95 Table 48: Primary Packaging Closure Types ................................................................................................................. 95 Table 49: Primary Packaging Outer Materials ............................................................................................................... 96 Table 50: Primary Packaging Outer Types .................................................................................................................... 96
©Canadean 2013. This product is licensed and is not to be photocopied. Reference code: PK1118MR 8
Latest Trends and Key Issues in the South African Retail Packaging Market
Published: December 2013
1. Executive Summary
The South African packaging industry grew at a Compound Annual Growth Rate (CAGR) of xx.xx%
during 2007–2012 in terms of number of packs sold; consistent growth is expected during 2012–2017 as
well at a rate of xx.xx %.
South Africa has been undergoing significant changes in its demographic and macroeconomic structures.
This has led to the emergence of varying consumer segments and the evolution of consumption patterns
and buying behaviors. These variations are expected to drive long-term changes in the South African
retail packaging industry and thus necessitate the need for manufacturers and packaging converters to
stay abreast with these continual changes.
South Africa’s young population significantly impacts the retail packaging industry
A significant demographic trend impacting the South African retail packaging market has been the large
young population, which is resulting in the emergence of an important consumer segment. Products
specifically targeted at the young have been launched; packaging in particular attains special emphasis
with greater attention being paid to attractive packaging. Additionally, in the case of children, packaging
and its composition becomes an integral part of the product with the high safety value associated with it.
Single-serve packs are expected to increase in popularity with these consumer segments. The shrinking
household sizeis further expected to drive the demand for similar pack formats.
High unemployment and growing income disparity lead to the emergence of varied packaging
demands
The high unemployment rate currently prevalent in South Africa has led to a growing preference for value
for money products among South African consumers. As a result of this, manufacturers are required to
look for ways to reduce the packaging-to-product ratio and thereby provide low-cost products through the
use of cheaper packaging. The growing income disparity in South Africa is also expected to significantly
raise the demand for smaller and cheaper pack formats among the lower income segment, as these are
priced lower on retail shelves. On the other hand, consumers with higher incomes are showing a growing
preference for premium packaging with value additions such as enhanced convenience. Manufacturers
are thus expected to customize their offerings in line with these ongoing changes.
Growing preference for convenience and sustainability drive innovation in the South African
packaging industry
South African manufacturers, like their global counterparts, have been plagued by rising raw material and
energy costs. Nevertheless, they are required to constantly innovate in order to stand out among
competitors in the expanding South African consumer market. Packaging affords manufacturers an
avenue to differentiate their offerings without incurring substantial expenditure. A preferred method of
differentiation is through value additions such as in the form of enhanced convenience. Convenient
packaging or closure formats are increasingly being introduced in the South African market in an attempt
to gain popularity and thereby help expansion of the consumer base. An instance of this is the Ready Egg
range, launched by Free Range chicken Co., which incorporates eggs in a ready-to-use format and is
packaged in an HDPE bottle.
With rising environmental consciousness, manufacturers have been looking at reducing their reliance on
non-renewable resources, meeting the sustainability targets set, reducing the carbon footprint generated
©Canadean 2013. This product is licensed and is not to be photocopied. Reference code: PK1118MR 9
Latest Trends and Key Issues in the South African Retail Packaging Market
Published: December 2013
and incorporating the use of biodegradable products in the manufacturing process. This renewed focus
on sustainability has been driving innovation in the South African packaging industry. An illustration of this
ongoing innovation is the aluminum foil-free pouch launched by Mars Africa for its Royco Soup brand,
which reduced the carbon footprint generated by as much as 25%.
Labeling attains greater significance in the South African packaging industry
Labeling has become an integral part of product packaging, with ongoing innovation in this segment.
Labeling has achieved greater applications as a result of advanced technologies, thereby diversifying the
label market and providing manufacturers with a range of choices depending upon the effect desired. For
instance, pressure-sensitive labels or self-adhesive labels do not require a secondary agent to make the
bond stronger and also do not wither away easily, withstanding different external pressures such as water
force. Other forms of labeling such as IML (in-mold labeling) are impregnated on the package itself and
thereby eliminate the problems of wrinkling or adhesion. In addition, manufacturers are increasingly
looking at technology upgrades as a manner of increasing the efficiency. Robotics in particular has
become a growing area of interest for manufacturers. An example of this is the incorporation of Triaflex
Delta Robots by Karan Beef in their production line.

©Canadean 2013. This product is licensed and is not to be photocopied. Reference code: PK1118MR
Latest Trends and Key Issues in the South African Retail Packaging Market
Published: December 2013
10
2. Market Dynamics
2.1 Overview
Demand for packaging will continue to show strong growth in 2012–2017; the number of packs used in
South Africa increased at a CAGR of xx.xx % during 2007–2012, and is expected to increase at a CAGR
of xx.xx% during 2012–2017.
This section will explore the dynamics of the South African packaging market, reviewing the change
during 2007–2012 and forecasting how the market will evolve during 2012–2017. This is first covered at
an overall level, followed by more detailed analysis of the market material wise.
2.1.1 South Africa Packaging by Material
The total South African retail packaging market grew at a CAGR of xx.xx % during 2007–2012, reaching
a total of xx million packs in 2012. Flexible Packaging and Rigid Plastic together accounted for more than
half of the total packaging market in 2012 and will largely remain the same during 2017. In absolute
terms, Flexible Packaging and Rigid Plastic are expected to add xx and xx million packs respectively
between 2012 and 2017. Rigid Plastic will record the highest CAGR of xx.xx % among all major pack
materials during 2012–2017.
Figure 11: South Africa Packaging by Material (Number of Packs, Million), 2007–2017
Source: Canadean © Canadean
2007 2008 2009 2010 2011 2012 2013 2014 2015 2016 2017
Mill
ions o
f P
ack
Units
Flexible Packaging Rigid Plastics Glass Paper & Board Rigid Metal Other

©Canadean 2013. This product is licensed and is not to be photocopied. Reference code: PK1118MR
Latest Trends and Key Issues in the South African Retail Packaging Market
Published: December 2013
11
Table 4: South Africa Packaging by Material (Number of Packs, Million), 2007, 2012 and 2017
Material
2007
2012
2017
CAGR 2007–2012
CAGR 2012–2017
Flexible Packaging
Glass
Other
Paper & Board
Rigid Metal
Rigid Plastics
Overall
Source: Canadean © Canadean
Rigid Plastics has the largest number of rapidly-growing sectors.
Within the South African packaging industry as a whole, Rigid Plastics is showing the highest overall
growth: the number of packs used in the Feminine Hygiene sector will record a CAGR in excess of
xx.xx% during 2007–2017, while the Make-Up, Beer & Cider, and Ice Cream sectors will see a CAGR in
the range of xx.xx%.
However, the total number of Paper & Board packs used in South Africa will decline in some sectors
during 2007-2017; sectors that will see the fastest CAGR decline include Fruit & Vegetables and
Cigarettes. The total number of Rigid Metal packs will also witness a CAGR decline in the range of
xx.xx% to xx.xx% driven mainly by the decline in Cigars, Cigarillos and Fruit & Vegetables.

©Canadean 2013. This product is licensed and is not to be photocopied. Reference code: PK1118MR
Latest Trends and Key Issues in the South African Retail Packaging Market
Published: December 2013
12
2.2 Flexible Packaging
2.2.1 Overall Flexible Packaging Market
The number of Flexible Packaging packs used in South Africa will increase between 2007 and 2017, with
annual growth in the range of xx.xx% to xx.xx%. The Food market will be the primary driver of growth in
the Flexible packaging industry in South Africa.
Figure 14: Number of Flexible Packaging Units (Millions) and Annual Growth (%), 2007–2017
Source: Canadean © Canadean
Table 7: Number of Flexible Packaging Units (Millions) and Annual Growth (%), 2007–2017
2007 2008 2009 2010 2011 2012 2013 2014 2015 2016 2017
Number
of Packs
Growth
Source: Canadean © Canadean
xxxx
xxxx
xxxx
xxxx
xxxx
xxxx
xxxx
xxxx
xxxx
xxxx
xxxx
xxxx
xxxx
xxxx
xxxx
2007 2008 2009 2010 2011 2012 2013 2014 2015 2016 2017
Annual G
row
th (
%)
Mill
ions o
f P
ack
Units
Pack Units (Millions) Annual Growth (%)
©Canadean 2013. This product is licensed and is not to be photocopied. Reference code: PK1118MR
Latest Trends and Key Issues in the South African Retail Packaging Market
Published: December 2013
13
2.3 Paper & Board
2.3.1 Number of Paper & Board Packs by Market
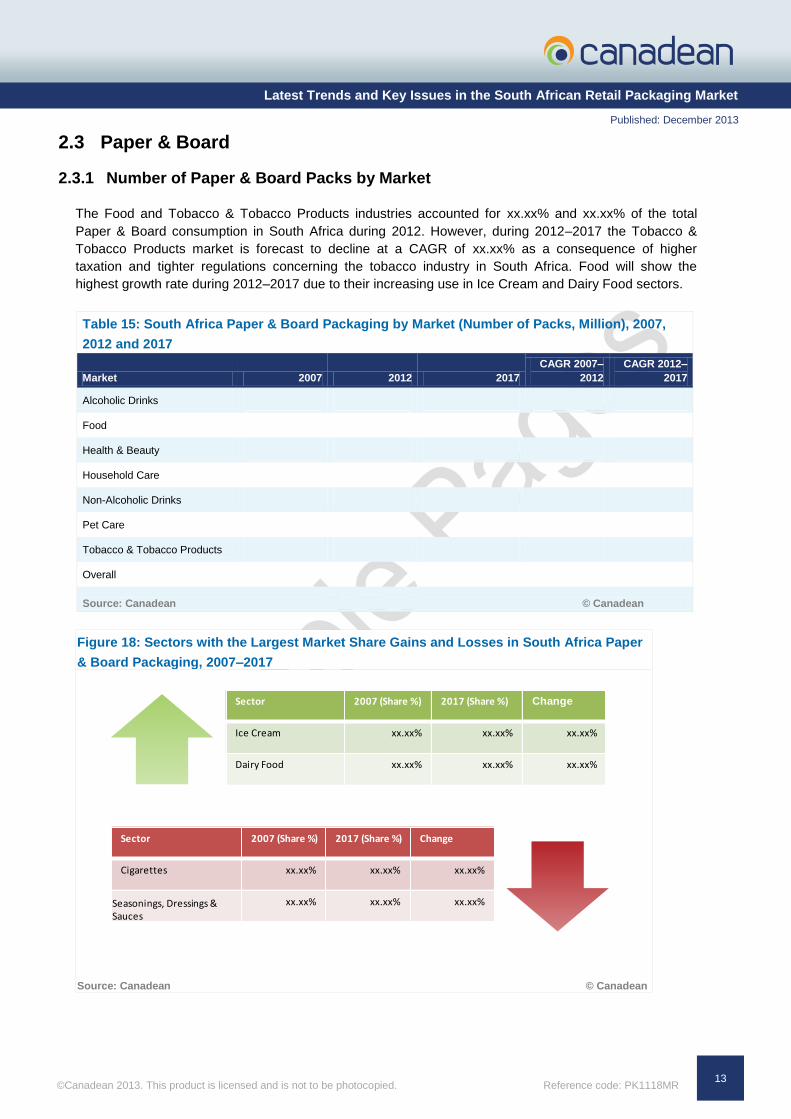
The Food and Tobacco & Tobacco Products industries accounted for xx.xx% and xx.xx% of the total
Paper & Board consumption in South Africa during 2012. However, during 2012–2017 the Tobacco &
Tobacco Products market is forecast to decline at a CAGR of xx.xx% as a consequence of higher
taxation and tighter regulations concerning the tobacco industry in South Africa. Food will show the
highest growth rate during 2012–2017 due to their increasing use in Ice Cream and Dairy Food sectors.
Table 15: South Africa Paper & Board Packaging by Market (Number of Packs, Million), 2007,
2012 and 2017
Market 2007 2012 2017
CAGR 2007–
2012
CAGR 2012–
2017
Alcoholic Drinks
Food
Health & Beauty
Household Care
Non-Alcoholic Drinks
Pet Care
Tobacco & Tobacco Products
Overall
Source: Canadean © Canadean
Figure 18: Sectors with the Largest Market Share Gains and Losses in South Africa Paper
& Board Packaging, 2007–2017
Source: Canadean © Canadean
Sector 2007 (Share %) 2017 (Share %) Change
Cigarettes xx.xx% xx.xx% xx.xx%
Seasonings, Dressings & Sauces
xx.xx% xx.xx% xx.xx%
Sector 2007 (Share %) 2017 (Share %) Change
Ice Cream xx.xx% xx.xx% xx.xx%
Dairy Food xx.xx% xx.xx% xx.xx%

©Canadean 2013. This product is licensed and is not to be photocopied. Reference code: PK1118MR
Latest Trends and Key Issues in the South African Retail Packaging Market
Published: December 2013
14
2.4 Rigid Plastics
2.4.1 Number of Rigid Plastic Packs by Closure Type
Increasing consumption of Carbonated Soft Drinks and Milk is currently driving the demand for Screw
Top closures, while growth in Chilled & Deli Foods, and in particular Fermented Meats, is influencing the
demand for Film closures. Lever Closures will witness one of the fastest growth rates during 2012–2017
as a result of the growing demand from the Health & Beauty market.
Table 25: South Africa Rigid Plastic Packaging by Closure Type (Number of Packs, Million),
2007, 2012 and 2017
Closure Type 2007 2012 2017
CAGR 2007–
2012
CAGR 2012–
2017
Cap
Dispenser
Film
Flip/Snap Top
Foil
None
Prize Off
Screw Top
Sports Cap
Overall
Source: Canadean © Canadean
Figure 24: Closure Types with the Largest Market Share Gains and Losses in South Africa Rigid
Plastic Packaging, 2007–2017
Source: Canadean © Canadean
Type 2007 (Share %) 2017 (Share %) Change
Screw Top xx.xx% xx.xx% xx.xx%
Flip/Snap Top xx.xx% xx.xx% xx.xx%
Type 2007 (Share %) 2017 (Share %) Change
Prize Off xx.xx% xx.xx% xx.xx%
Cap xx.xx% xx.xx% xx.xx%

©Canadean 2013. This product is licensed and is not to be photocopied. Reference code: PK1118MR
Latest Trends and Key Issues in the South African Retail Packaging Market
Published: December 2013
15
2.5 Rigid Metal
2.5.1 Number of Rigid Metal Packs by Outer Type
Sleeves will record the fastest growth among the outer types used during 2012–2017 and are growing at
a CAGR of xx.xx% within that period. Sleeve’s growth is a result of expanded use in the Pies & Savory
Appetizers and Ready Meals categories.
Table 34: South Africa Rigid Metal Packaging by Outer Type (Number of Packs, Million), 2007,
2012 and 2017
Outer Type 2007 2012 2017
CAGR 2007–
2012
CAGR 2012–
2017
None
Sleeve
Overall
Source: Canadean © Canadean
Figure 1: Outer Types with the Largest Market Share Gains and Losses in South Africa Rigid
Metal Packaging, 2007–2017
Source: Canadean © Canadean
Type 2007 (Share %) 2017 (Share %) Change
Box xx.xx% xx.xx% xx.xx%
Type 2007 (Share %) 2017 (Share %) Change
None xx.xx% xx.xx% xx.xx%

©Canadean 2013. This product is licensed and is not to be photocopied. Reference code: PK1118MR
Latest Trends and Key Issues in the South African Retail Packaging Market
Published: December 2013
16
3. Appendix
3.1 What is this Report About?
This report is the result of Canadean’s extensive market and company research covering the South
African packaging industry. It provides an analysis of changing packaging trends for eight key Consumer
Packaged Goods segments, competitive landscape, and South African business environment.
Consumption of primary, outer, and closure packaging is analyzed in detail.
“Latest Trends and Key Issues in the South African Retail Packaging Market” provides a top-level
overview and detailed packaging, and company-specific insights into the operating environment for
packaging companies. It is an essential tool for companies active across the South African Packaging
value chain, and for new companies considering entering the market.
As such, this report is aimed at companies supplying to the following retail markets:
Alcoholic Drinks
Food
Health & Beauty
Home Improvement
Household Care
Non-Alcoholic Drinks
Pet Care
Tobacco & Tobacco Products.
3.2 Time Frame
For the purposes of this report, the following timeframes apply:
Review period: 2007–2012
Forecast period: 2013–2017

©Canadean 2013. This product is licensed and is not to be photocopied. Reference code: PK1118MR
Latest Trends and Key Issues in the South African Retail Packaging Market
Published: December 2013
17
3.3 About Canadean
Canadean is a full-service business information provider with in-house market research capabilities. We
specialize in analysis across the Consumer Markets Value Chain, covering suppliers, producers,
distribution, and consumers.
Canadean’s dedicated research and analysis teams consist of experienced professionals with an industry
background in marketing, market research, consulting, and advanced statistical expertise. We offer value-
added market research, insight, and strategic analysis and our products help companies to make better,
more informed, strategic and tactical sales, and marketing decisions.
Canadean’s areas of expertise include online research, qualitative and quantitative research, industry
analysis, custom approaches, and actionable insights. In addition, Canadean has built a network of
consultants and specialist researchers across more than 60 countries, each with in-depth industry
experience and expertise enabling us to conduct unique and insightful research via our trusted business
communities.
3.4 Disclaimer
All Rights Reserved.
No part of this publication may be reproduced, stored in a retrieval system or transmitted in any form by
any means, electronic, mechanical, photocopying, recording or otherwise, without the prior permission of
the publisher, Canadean.
The facts of this report are believed to be correct at the time of publication but cannot be guaranteed.
Please note that the findings, conclusions and recommendations that Canadean delivers will be based on
information gathered in good faith from both primary and secondary sources, whose accuracy we are not
always in a position to guarantee. As such, Canadean can accept no liability whatsoever for actions taken
based on any information that may subsequently prove to be incorrect.

![Latest Technology for Waterless Flower Packaging with Extended Shelf Life [Company Update]](https://img.pdfslide.us/doc/110x75/577c7a971a28abe054958ca5/latest-technology-for-waterless-flower-packaging-with-extended-shelf-life-company.jpg)