Embed Size (px)
Citation preview
© Hitachi, Ltd. 2018. All rights reserved.
Hitachi IR Day 2018
Industry & Distribution
Business Strategy
Jun AbeVice President and Executive Officer
CEO of Industry & Distribution Business Unit
Hitachi, Ltd.
June 8, 2018

© Hitachi, Ltd. 2018. All rights reserved.
Contents
Industry & Distribution Business Strategy
1. Business Overview
2. Growth Strategy
(1) Scaling
(2) Profitability Improvement
(3) Cost Strategy and Strengthen Cash Generation
3. Summary
2

© Hitachi, Ltd. 2018. All rights reserved.
FY2018Compared with
FY2015
Revenues 633.0 billion yen(5.9) billion yen
[(1)%]
Adjusted operating income
[ratio]46.5 billion yen [7.3%] +59.4 billion yen
EBIT [ratio] 41.1 billion yen [6.5%] +57.6 billion yen
Overseas revenue ratio 13% (3)%
3
Accomplish the FY2018 plan and gain a foothold forputting businesses on the next growth track
1-1. FY2018 Target
EBIT: Earnings Before Interest and Taxes
■Withdrawal from low-profit businesses■Create the digital solution business by utilizing its wide business domain
of the Industry & Distribution Business
Mission
© Hitachi, Ltd. 2018. All rights reserved.
IT
Pro
du
cts
OT
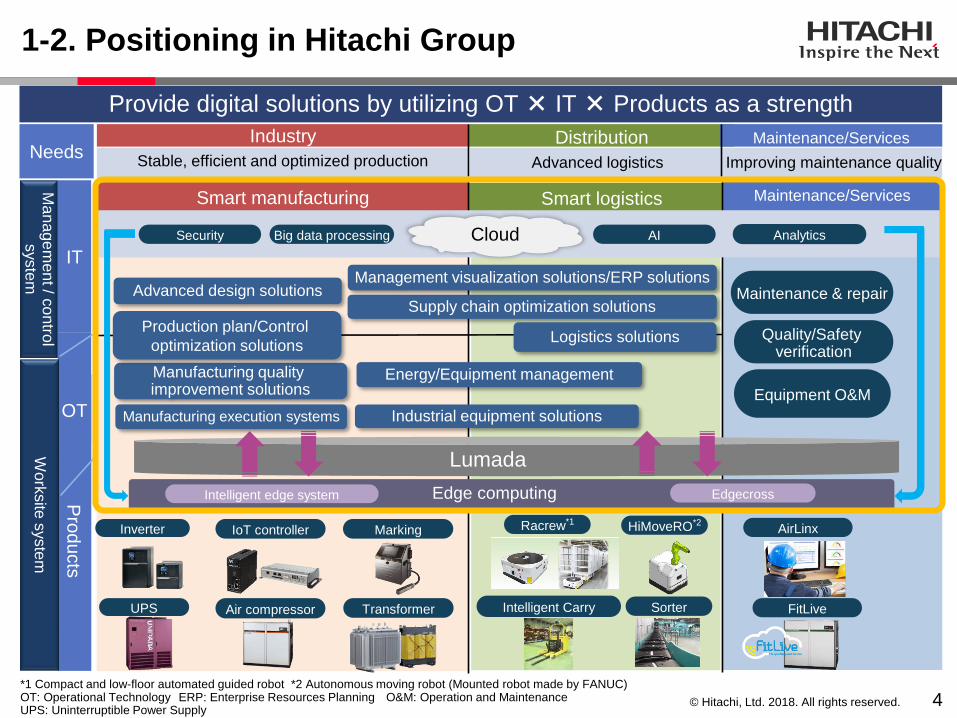
Provide digital solutions by utilizing OT × IT × Products as a strength
Needs
お客さま
Work
site
syste
m
Smart manufacturing
Ma
na
ge
ment / c
on
trol
syste
m
AirLinx
Maintenance & repair
Smart logistics Maintenance/Services
FitLive
4
HiMoveRO*2
Advanced design solutionsSupply chain optimization solutions
Manufacturing quality improvement solutions
Management visualization solutions/ERP solutions
Manufacturing execution systems
Energy/Equipment management
Industrial equipment solutions
Big data processing AnalyticsAISecurity
Production plan/Control
optimization solutionsLogistics solutions
1-2. Positioning in Hitachi Group
Quality/Safety verification
Equipment O&M
Inverter IoT controller Marking
UPS Air compressor Transformer
Racrew*1
SorterIntelligent Carry
Edge computingIntelligent edge system Edgecross
Lumada
*1 Compact and low-floor automated guided robot *2 Autonomous moving robot (Mounted robot made by FANUC)OT: Operational Technology ERP: Enterprise Resources Planning O&M: Operation and Maintenance UPS: Uninterruptible Power Supply
Cloud
Advanced logisticsStable, efficient and optimized production Improving maintenance quality
DistributionIndustry Maintenance/Services

© Hitachi, Ltd. 2018. All rights reserved.
[Europe]
The working-age population has started
to decrease since early 2010s.
[APAC]
Wage increases throughout APAC
(increased by 6.1% YoY in 2018)
[U.S.]
Immigrants keep increasing, and labor
force will become more diverse.
Source:Estimated by Hitachi based on data from Migration Policy Institute (MPI) Data Hub
Source:Willis Towers Watson Salary Budget Planning Survey – Asia Pacific Report (2012-2017)
[China]
The working-age population is already
decreasing
By 2030 wages will become more than
5 times compared with 2010
The megatrend of introducing IoT is progressing globally. Automated worksites, use of big data
and AI, and sophisticated commerce and industry integrating OT and IT have accelerated.
In response to a decrease in the working-age population and diversification of labor worldwide,
efficiently improving worksites and logistics, human resource saving, and digitalization of
experts’ skills and expertise are progressing.
Changing demographics
5
1-3. Megatrends
1 0.5 0 0 0.5 1Population (million people)
Working-agepopulation
1 0.5 0 0 0.5 1Population (million people)
Source:Population Projections for Japan (July 2017)(National Institute of Population and Social Security Research)
Women
Youngpopulation
Middle-aged population
Elderlypopulation
Source:Estimated by Hitachi based on IHS Markit data ”IHS Markit,Global Economy [May 2018]”
Middle-aged population
Elderlypopulation
Youngpopulation
WomenMenMen
[Japan]
Continuous decrease in working-age population
(77 million people in 2015 ⇒ 68 million people in 2030)
Source:Estimated by Hitachi based on IHS Markit data ”IHS Markit, Global Economy [May 2018]”
Source:Population Pyramid(2015, 2030) (National Institute of Population and Social Security Research)
© Hitachi, Ltd. 2018. All rights reserved.
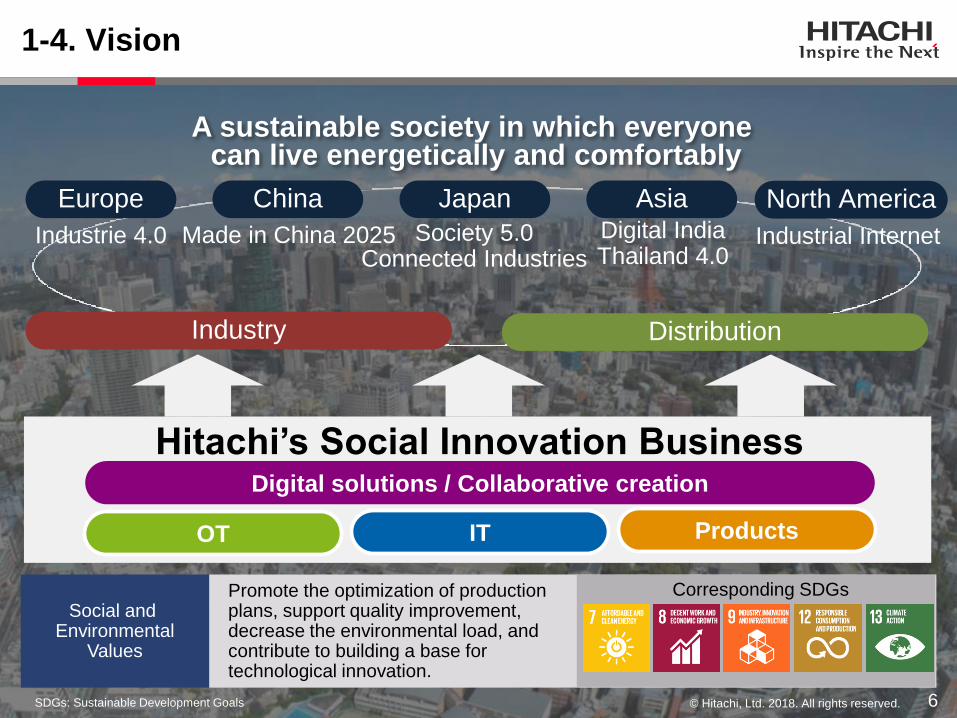
A sustainable society in which everyone can live energetically and comfortably
© Hitachi, Ltd. 2018. All rights reserved. 6
Hitachi’s Social Innovation Business
OT IT Products
Digital solutions / Collaborative creation
1-4. Vision
North AmericaChinaEurope AsiaJapan
Industrie 4.0 Industrial InternetDigital IndiaThailand 4.0
Society 5.0Connected Industries
Made in China 2025
Industry Distribution
Social and Environmental
Values
Promote the optimization of production plans, support quality improvement,decrease the environmental load, andcontribute to building a base fortechnological innovation.
Corresponding SDGs
SDGs: Sustainable Development Goals

© Hitachi, Ltd. 2018. All rights reserved.
0
5,000
10,000
FY2016 FY2017 FY2018
620.0
*2
7
1-5. Vision(Transforming Business Portfolio into High-Profit Areas)
Revenues*1 (Unit: Billion yen)
Growing business
FY2021(Target)
・Smart manufacturing
・High-value added services
(logistics solutions,
maintenance & repair, etc.)
・ERP solutions
・SI
・Outsourcing services
・Security solutions
・Embedded engineering, etc.(Results) (Results) (Forecast)
Core business
(500)
0
500
1,000
46.5
Adjusted operating income*1 (Unit: Billion yen)
Withdrawal from low-profit business
FY2016(Results)
FY2017 (Results)
FY2018(Forecast)
FY2021(Target)
*2
Industrial equipmentsolutions
Core business
*1 Including Hitachi Solutions, Ltd.*2 Figures of Hitachi Plant Construction, Ltd., which was transferred to the Nuclear Energy Business Unit in April 2017, were corrected retroactively.EPC: Engineering, Procurement and Construction SI: Systems Integration
628.9
Industrial equipmentsolutions
Large-scale EPC
Digital solutions1,000
500
100
50
(50)
Growing business
Core business(1.3)
16.8
633.0
Growing business

© Hitachi, Ltd. 2018. All rights reserved.
1-6. Progress of 2018 Mid-term Management Plan
8
*1 Figures of Hitachi Plant Construction, Ltd., which was transferred to the Nuclear Energy Business Unit in April 2017, were corrected retroactively. *2 Announced on June 8, 2017. *3 SAP and SAP logos are registered trademark of SAP SE in Germany and other countries.
FY2015
results*1
FY2016
results*1FY2017
previous forecast*2FY2017
resultsFY2018
previous target*2FY2018
forecast
Revenues
(Billion yen)638.9 628.9 600.0 620.0 666.0 633.0
Adjusted operating
income ratio(2.0)% (0.2)% 5.0% 2.7% 7.5% 7.3%
EBIT ratio (2.6)% (0.6)% 3.8% 0.5% 7.4% 6.5%
Hitachi total1,006.0 billion yen
Other
Lumada revenuesFY2017 results
Industry & Distribution
Business43%
Growing business: Expand the digital solution business utilizing Lumada
Strengthening the project management / development of human resources
Consolidate industrial equipment business into Hitachi Plant Services to strengthen
mid-scale business (April 2018)
Use Omika Works’ highly efficient production model as the solution core Acquire new customers and create new services through collaborative creation Add value starting with SAP S/4HANA® *3
Core business: Improve profitability in SI business
Industrial equipment solutions: Implementation of structural reform
© Hitachi, Ltd. 2018. All rights reserved.
Contents
Industry & Distribution Business Strategy
1. Business Overview
2. Growth Strategy
(1) Scaling
(2) Profitability Improvement
(3) Cost Strategy and Strengthen Cash Generation
3. Summary
9

© Hitachi, Ltd. 2018. All rights reserved. 10
2-1. Business Strategy (1)
Basic policy
Expansion of digital solution business through
OT × IT × Products
Acceleration of global business deployment
Hitachi’s strengths
Abundant R&D resources
Advanced manufacturing
capabilities / experiences
Wide customer base
Focus points
Business scaling
Further profitability
improvement

© Hitachi, Ltd. 2018. All rights reserved. 11
2-1. Business Strategy (2)
(2) Profitability improvement
① Increase target customers
② Expand target areas (global)
③ Multiply smart manufacturing (utilize as solution cores)
④ Multiply smart manufacturing (collaboration with partners)
⑤ Extend business domain starting with ERP solutions
① Provide high-value added services to total value chain
② Add value through maintenance & repair business
③ Add value through quality and safety data analysis and
verification services
Growth strategy
(1) Scaling

© Hitachi, Ltd. 2018. All rights reserved.
Contents
Industry & Distribution Business Strategy
1. Business Overview
2. Growth Strategy
(1) Scaling
(2) Profitability Improvement
(3) Cost Strategy and Strengthen Cash Generation
3. Summary
12
© Hitachi, Ltd. 2018. All rights reserved. 13
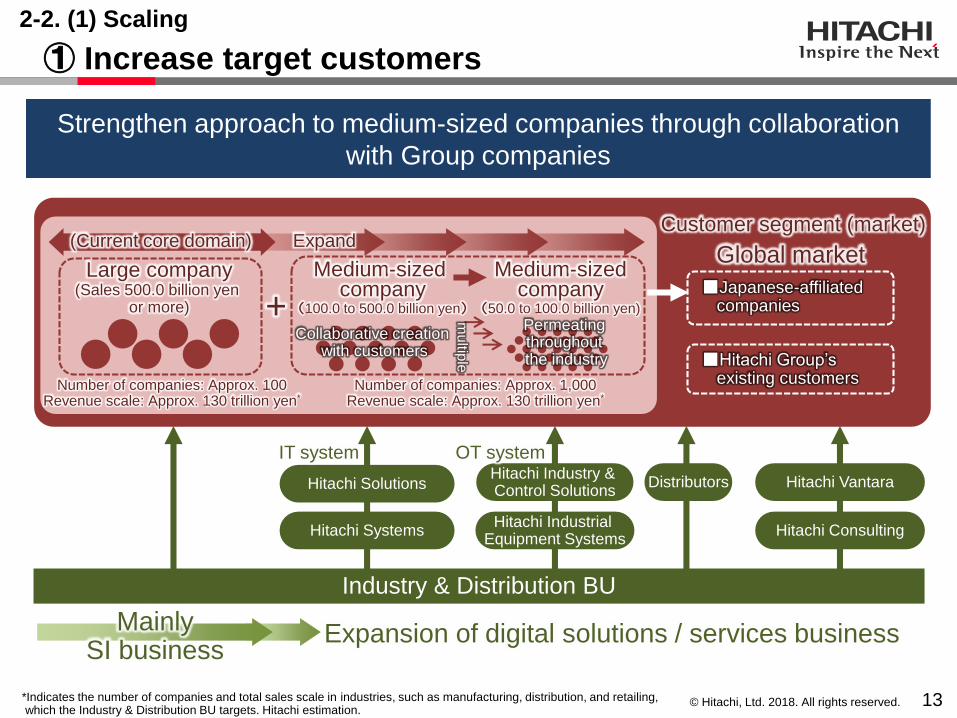
Strengthen approach to medium-sized companies through collaboration
with Group companies
Customer segment (market)
Global market
■Japanese-affiliated companies
■Hitachi Group’s existing customers
+Collaborative creation
with customers
Permeating throughout the industry
mu
ltiple
Expand
Medium-sized company
(100.0 to 500.0 billion yen)
Medium-sized company
(50.0 to 100.0 billion yen)
Large company(Sales 500.0 billion yen
or more)
(Current core domain)
Hitachi Vantara
Hitachi Consulting
Hitachi Industry & Control Solutions
Hitachi Industrial Equipment Systems
Hitachi Systems
Hitachi Solutions Distributors
OT systemIT system
2-2. (1) Scaling
① Increase target customers
Industry & Distribution BU
Number of companies: Approx. 100Revenue scale: Approx. 130 trillion yen*
Number of companies: Approx. 1,000Revenue scale: Approx. 130 trillion yen*
Expansion of digital solutions / services businessMainlySI business
*Indicates the number of companies and total sales scale in industries, such as manufacturing, distribution, and retailing, which the Industry & Distribution BU targets. Hitachi estimation.

© Hitachi, Ltd. 2018. All rights reserved. 1414
Local base
Hitachi Engineering & Construction(China) Co., Ltd.
Area representative
Local base
Hitachi (China), Ltd.
Collaborate globally:●Hitachi Consulting Corporation
●Hitachi Vantara Corporation
Hitachi Plant Technologies (Vietnam) Co., Ltd. MHPT Engineering Sdn. Bhd.PHPC Co., Ltd. Inc.
Provide digital solutions to Japanese manufacturers in cooperation with Hitachi Group local subsidiaries.
China
・Digital solution business deployment in collaboration with Sullair(maintenance & repair)
・Collaborative creation with Penske aimingfor vehicle performance improvement
North America
Provide digital services utilizing the Lumada Center to be established in Thailand (2018).
Southeast Asia
Made in China 2025
Thailand 4.0
・Investment of a total of 1.5 trillion baht (approx. 5 trillion yen) in the new special economic zone “Eastern Economic Corridor (EEC)” development plan
・Hitachi signed a cooperation agreement with the EEC policy committee aiming for utilization of IoT technology (September 2017)
Model project for smart manufacturing in 12 cities and 4 combined cities
Industrial Internet
Accelerate digitalization in the manufacturing industry
2-2. (1) Scaling
② Expand target areas (global)
Asia: Provide digital solutions for the manufacturing industry toJapanese companies
North America: Business deployment by strengthening collaborationwith Sullair and Penske
Area representative
Area representative
Hitachi America, Ltd.Hitachi Asia Ltd.

© Hitachi, Ltd. 2018. All rights reserved. 15
Expand collaborative
creation model
Expand the collaborative creation range
Expandtechnology
0
50
100
150
200
250
Expand digital solution business
ボトルネック
正味作業
設計改善
現場改善
部品1部品2部品3・・・
・・・・・
部品40
ボトルネック
Progress & Operation Monitoring(RFID Production Monitoring) Factory SimulatorModular DesignKaizen activity support
Taginstalled Bottleneck work
仕分 U組 U配 本組 本配 本検
計画
t
現 在
実績
見通し
2-2. (1) Scaling
③ Multiply smart manufacturing (utilize as solution cores)
Expand services utilizing Lumada
Customer visits at Omika Works’ showcaseUnit
(Company)
First half of FY2016
Second half of FY2016
First half of FY2017
Second half of FY2017
Using Omika Works’ highly efficient production model as
the core for solutionsDaicel
Daikin Industries
OkumaDeep cultivation of collaborative creation with Daicel(other base deployment, etc.)
Okuma users
Drafting a plan of action & processes
Forecasting in-floor distributionSpeedy design feedback
system
MD method
DB accumulation
Analyze bottleneck work and take necessary countermeasures
Dynamic monitoring of workers and items
Making in-factory
distribution visible
Parts
* Source: IDC Japan, March 2018 ”Domestic IoT Market estimated by industry area/usecases, 2018-2022”, calculated by Hitachi based on IDC Research FA: Factory Automation PA: Process Automation CAGR: Compound Annual Growth RateRFID: Radio Frequency Identification MD: Modular Design
IoT market for Domestic FA/PA
2,065.0billion yen (2017)
CAGR:13.9%(2017 to 2022)*

© Hitachi, Ltd. 2018. All rights reserved.
Information infrastructure
SolutionsMonozukuri*1
service
Production
optimization
scheduling
Shop floor
visualization
Domestic and overseas Okuma users
(automotive parts manufacturers and others)
・・・
Approach
Collaboratively provide support businessto partner’s users
ApproachProvide digital solutions through Hitachi Industrial Equipment Systems’product provision partner
AMADA CO., LTD.
Industry & Distribution BU
Hitachi Industrial Equipment Systems
First Step
Second Step
Okuma Corporation
Industry & Distribution BU
First Step Second Step
16
LumadaOperation records, configuration, maintenance and others
B2B2B business deployment
Toki Works Fujinomiya Works
Lumada V-factory*2Collaboration
Business deployment for domestic and overseas Amada users
Expansion of solution menu*1 Monozukuri: The art of making things better than ever*2 IoT solution for factories providing by Amada
④ Multiply smart manufacturing (collaboration with partners)
B2B2B business deployment collaborating with a machine tool
manufacturer as a partner
Business deployment
starting from products
Machine tools
Provide digital solutions
Provide products and systems
De
ep
cu
ltiva
tion
o
f co
llab
ora
tive
cre
atio
n
Provide digital solutions
2-2. (1) Scaling
© Hitachi, Ltd. 2018. All rights reserved. 17
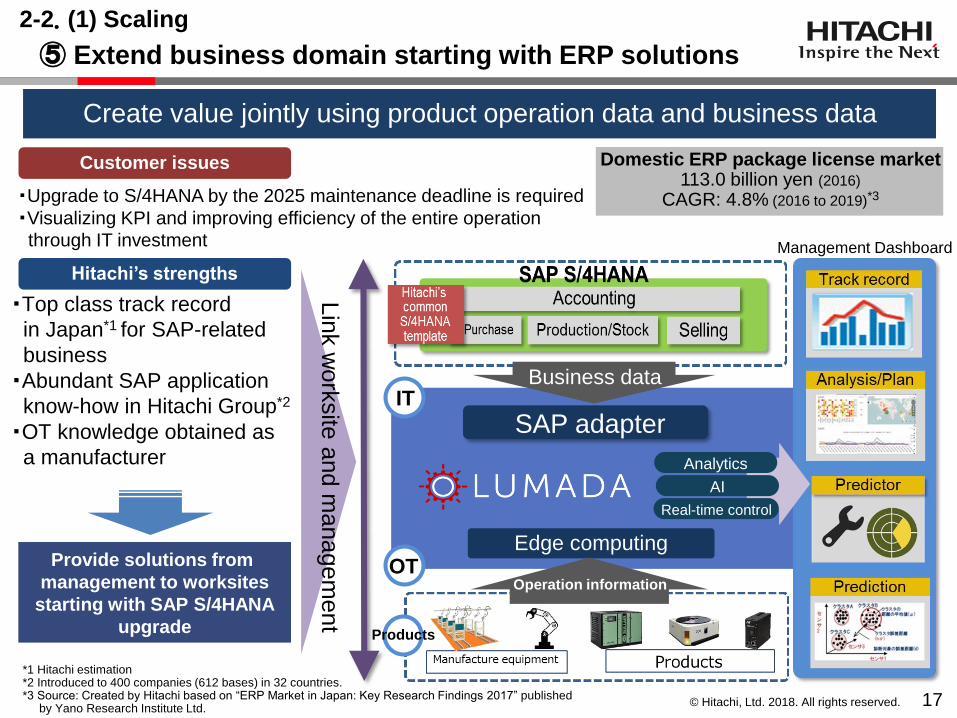
SAP adapter
Management Dashboard
Real-time control
Analytics
AI
OT
IT
Provide solutions from
management to worksites
starting with SAP S/4HANA
upgrade
Edge computing
Lin
k w
ork
site
and m
anagem
ent
2-2. (1) Scaling
⑤ Extend business domain starting with ERP solutions
Create value jointly using product operation data and business data
Domestic ERP package license market113.0 billion yen (2016)
CAGR: 4.8% (2016 to 2019)*3・Upgrade to S/4HANA by the 2025 maintenance deadline is required
・Visualizing KPI and improving efficiency of the entire operation
through IT investment
Customer issues
・Top class track record
in Japan*1 for SAP-related
business
・Abundant SAP application
know-how in Hitachi Group*2
・OT knowledge obtained as
a manufacturer
Hitachi’s strengths
Products
Operation information
*1 Hitachi estimation*2 Introduced to 400 companies (612 bases) in 32 countries.*3 Source: Created by Hitachi based on “ERP Market in Japan: Key Research Findings 2017” published
by Yano Research Institute Ltd.
Business data

© Hitachi, Ltd. 2018. All rights reserved.
Contents
Industry & Distribution Business Strategy
1. Business Overview
2. Growth Strategy
(1) Scaling
(2) Profitability Improvement
(3) Cost Strategy and Strengthen Cash Generation
3. Summary
18
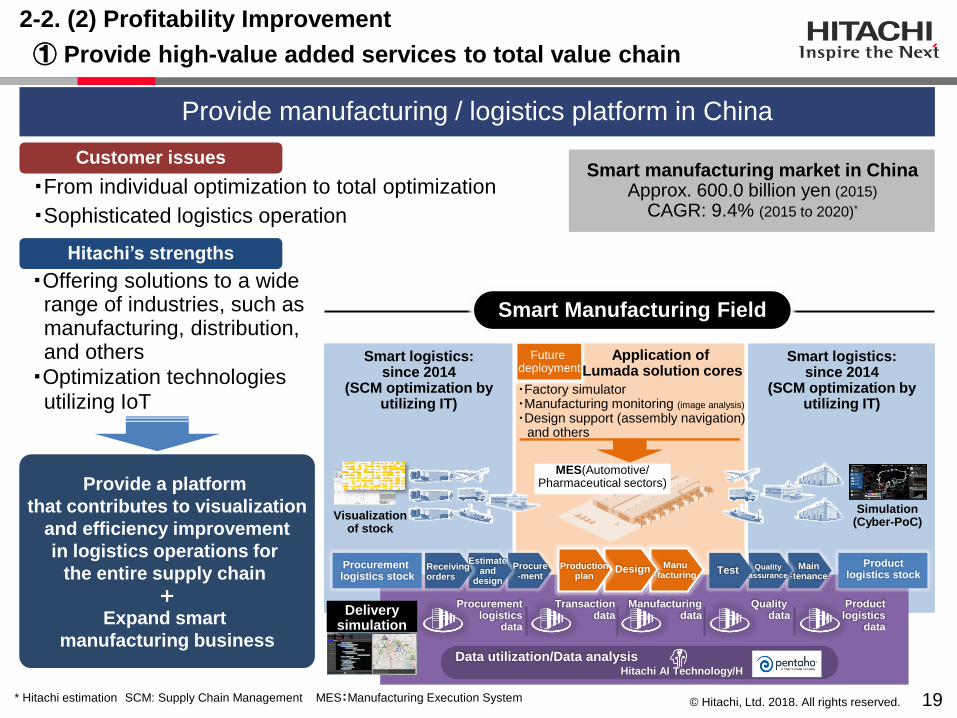
© Hitachi, Ltd. 2018. All rights reserved. 19* Hitachi estimation SCM: Supply Chain Management MES:Manufacturing Execution System
Customer issues
Hitachi’s strengths
Provide a platform
that contributes to visualization
and efficiency improvement
in logistics operations for
the entire supply chain
+Expand smart
manufacturing business
Future deployment
Application of Lumada solution cores
・Factory simulator・Manufacturing monitoring (image analysis)
・Design support (assembly navigation)and others
Visualization of stock
Receiving orders
Estimate and
design
Procure-ment
Production plan
Design Test Quality assurance
Main-tenance
Procurement logistics stock
Productlogistics stock
Procurementlogistics
data
Quality data
Productlogistics
data
Delivery simulation
Smart logistics: since 2014
(SCM optimization by utilizing IT)
Simulation(Cyber-PoC)
MES(Automotive/Pharmaceutical sectors)
Smart Manufacturing Field
2-2. (2) Profitability Improvement
① Provide high-value added services to total value chain
Provide manufacturing / logistics platform in China
Smart manufacturing market in ChinaApprox. 600.0 billion yen (2015)
CAGR: 9.4% (2015 to 2020)*
・From individual optimization to total optimization
・Sophisticated logistics operation
・Offering solutions to a wide range of industries, such as manufacturing, distribution, and others
・Optimization technologies utilizing IoT
Smart logistics: since 2014
(SCM optimization by utilizing IT)
Data utilization/Data analysisHitachi AI Technology/H
Manu-facturing
Manufacturing data
Transaction data
© Hitachi, Ltd. 2018. All rights reserved.
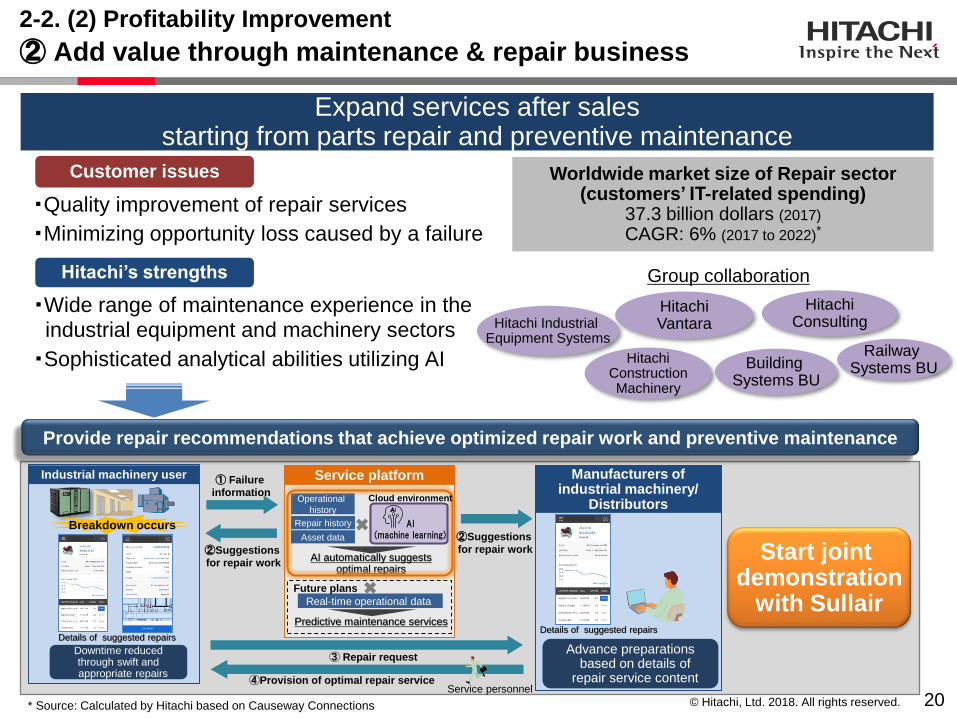
HitachiConstructionMachinery
Building Systems BU
Railway Systems BU
20
Group collaboration
Hitachi Industrial Equipment Systems
HitachiVantara
HitachiConsulting
* Source: Calculated by Hitachi based on Causeway Connections
Customer issues
Hitachi’s strengths
Expand services after salesstarting from parts repair and preventive maintenance
・Quality improvement of repair services
・Minimizing opportunity loss caused by a failure
Worldwide market size of Repair sector(customers’ IT-related spending)
37.3 billion dollars (2017)
CAGR: 6% (2017 to 2022)*
・Wide range of maintenance experience in the
industrial equipment and machinery sectors
・Sophisticated analytical abilities utilizing AI
Provide repair recommendations that achieve optimized repair work and preventive maintenance
Start joint demonstration
with Sullair
2-2. (2) Profitability Improvement
② Add value through maintenance & repair business
Industrial machinery user
Repair history
Operational
history
① Failure
information
Downtime reduced through swift and appropriate repairs
②Suggestions
for repair work
④Provision of optimal repair service
Manufacturers of industrial machinery/
Distributors
AI automatically suggests optimal repairs
Real-time operational data
Advance preparations based on details of
repair service content
Service platform
Asset data
③ Repair request
Details of suggested repairs
Breakdown occurs
Service personnel
Cloud environment
AI(machine learning) ②Suggestions
for repair work
Future plans
Predictive maintenance services
Details of suggested repairs
© Hitachi, Ltd. 2018. All rights reserved. 21
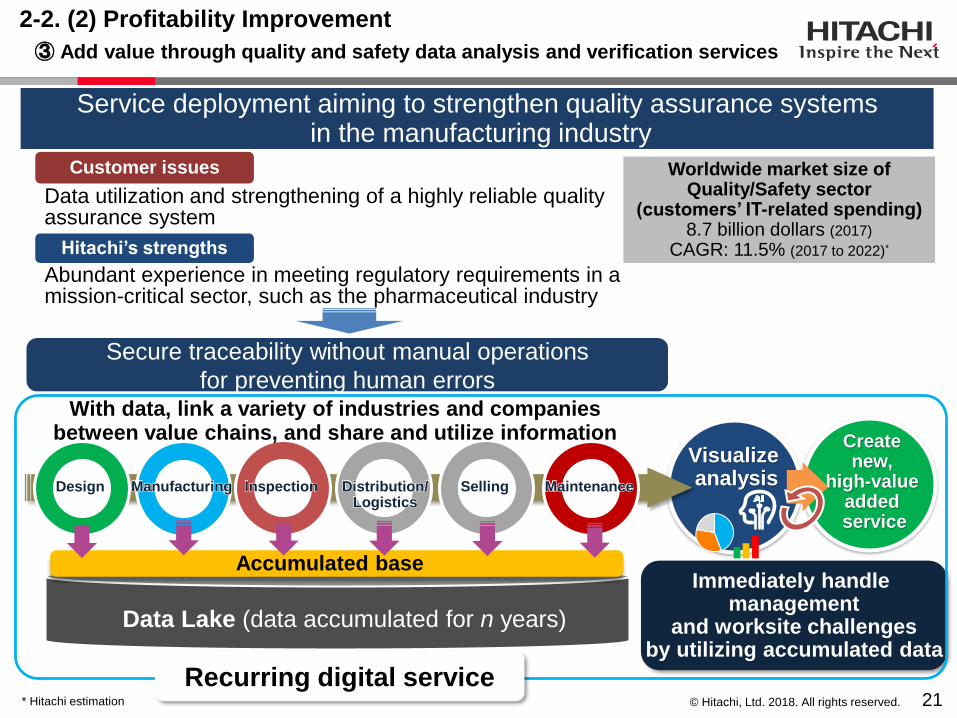
Service deployment aiming to strengthen quality assurance systemsin the manufacturing industry
Visualize analysis
Data Lake (data accumulated for n years)
Create new,
high-value added service
Accumulated base
MaintenanceSellingManufacturing InspectionDesign Distribution/Logistics
Immediately handle management
and worksite challengesby utilizing accumulated data
Recurring digital service
2-2. (2) Profitability Improvement
③ Add value through quality and safety data analysis and verification services
Abundant experience in meeting regulatory requirements in a mission-critical sector, such as the pharmaceutical industry
Data utilization and strengthening of a highly reliable quality assurance system
* Hitachi estimation
Worldwide market size ofQuality/Safety sector
(customers’ IT-related spending)8.7 billion dollars (2017)
CAGR: 11.5% (2017 to 2022)*
Secure traceability without manual operations
for preventing human errors
Customer issues
Hitachi’s strengths
With data, link a variety of industries and companies between value chains, and share and utilize information
© Hitachi, Ltd. 2018. All rights reserved.
Contents
Industry & Distribution Business Strategy
1. Business Overview
2. Growth Strategy
(1) Scaling
(2) Profitability Improvement
(3) Cost Strategy and Strengthen Cash Generation
3. Summary
22
© Hitachi, Ltd. 2018. All rights reserved.
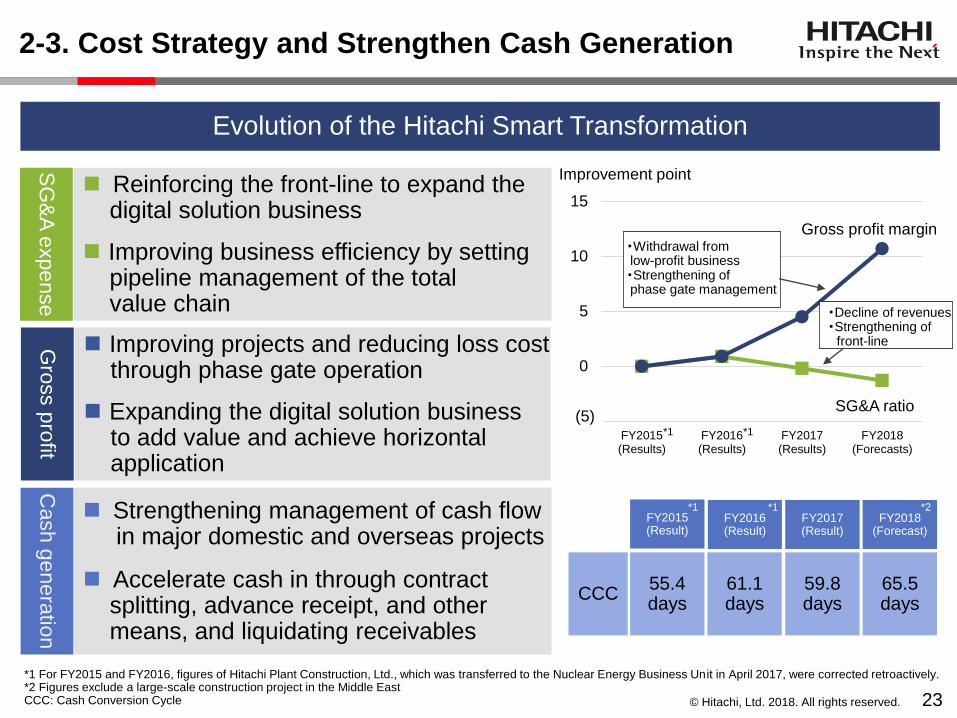
2-3. Cost Strategy and Strengthen Cash Generation
*1 For FY2015 and FY2016, figures of Hitachi Plant Construction, Ltd., which was transferred to the Nuclear Energy Business Unit in April 2017, were corrected retroactively.*2 Figures exclude a large-scale construction project in the Middle EastCCC: Cash Conversion Cycle
Improvement point
55.4days
FY2015(Result)
FY2016(Result)
FY2018(Forecast)
61.1days
65.5days
CCC
FY2017(Result)
59.8days
23
*1 *1
Improving projects and reducing loss costthrough phase gate operation
Expanding the digital solution businessto add value and achieve horizontal application
Gro
ss p
rofit
Reinforcing the front-line to expand the digital solution business
Improving business efficiency by settingpipeline management of the total value chain
Cash g
enera
tion
Strengthening management of cash flowin major domestic and overseas projects
Accelerate cash in through contract splitting, advance receipt, and othermeans, and liquidating receivables
Evolution of the Hitachi Smart Transformation
*2
-5
0
5
10
15
FY2015(Results)
FY2016(Results)
FY2017(Results)
FY2018(Forecasts)
・Withdrawal from low-profit business・Strengthening of phase gate management
SG
&A
expe
nse
*1 *1
(5)
Gross profit margin
SG&A ratio
・Decline of revenues・Strengthening of
front-line

© Hitachi, Ltd. 2018. All rights reserved.
Contents
Industry & Distribution Business Strategy
1. Business Overview
2. Growth Strategy
(1) Scaling
(2) Profitability Improvement
(3) Cost Strategy and Strengthen Cash Generation
3. Summary
24

© Hitachi, Ltd. 2018. All rights reserved.
3-1. Factors of Increase/Decrease of Revenues, Adjusted Operating Income/Loss
25* For FY2015 and FY2016, figures of Hitachi Plant Construction, Ltd., which was transferred to the Nuclear Energy
Business Unit in April 2017, were corrected retroactively.
FY2015 (Results) *
638.9
Carve out of LCD panelmanufacturing
equipment business
(7.7)
633.0628.9
Revenues (Unit: Billion yen)
Adjusted operating income/loss (Unit: Billion yen)
FY2016 (Results)* FY2018 (Forecast)
FY2015 (Results)*
(12.9)Others+5.9
Effects of withdrawal
from low-profit overseas business
+2.8
Reduction ofloss-makingprojects in
Middle East etc.+17.4
46.5
(1.3)
FY2018 (Forecast)
FY2017 (Results)
620.0
Expansion ofdigital solution
business+8.9
Expansion ofmid-scale industrial
solutions, etc.+6.3
FY2016 (Results)* FY2017 (Results)
16.8 Expansion ofdigital solutionsand high-value added services
and improvementof income
+11.6
Expansion of mid-scaleindustrialsolutions
+4.4
Withdrawal from low-profit
overseas business(5.9)
Others+3.6
Reduction of
loss-makingMiddle East
projects+2.9
Withdrawalfrom low-profit
overseasbusiness, etc
(8.9)
Withdrawal fromloss-makingprojects in
Middle East etc.+13.7
Withdrawal from low-profit
business(2.2)
Others+0.7

© Hitachi, Ltd. 2018. All rights reserved.
3-3. Summary
26
FY2018 Target
■ Transform to high-profitable (service) business models
■ Lead Hitachi’s digital solution business
FY2018Compared with
FY2015
Revenues 633.0 billion yen(5.9) billion yen
[(1)%]
Adjusted operating income
[ratio]46.5 billion yen [7.3%] +59.4 billion yen
EBIT [ratio] 41.1 billion yen [6.5%] +57.6 billion yen
Overseas revenue ratio 13% (3)%
Toward next Mid-term Management Plan

© Hitachi, Ltd. 2018. All rights reserved.
Cautionary Statement
27
Certain statements found in this document may constitute “forward-looking statements” as defined in the U.S. Private Securities Litigation Reform Act of 1995. Such “forward-looking
statements” reflect management’s current views with respect to certain future events and financial performance and include any statement that does not directly relate to any historical or
current fact. Words such as “anticipate,” “believe,” “expect,” “estimate,” “forecast,” “intend,” “plan,” “project” and similar expressions which indicate future events and trends may identify
“forward-looking statements.” Such statements are based on currently available information and are subject to various risks and uncertainties that could cause actual results to differ
materially from those projected or implied in the “forward-looking statements” and from historical trends. Certain “forward-looking statements” are based upon current assumptions of future
events which may not prove to be accurate. Undue reliance should not be placed on “forward-looking statements,” as such statements speak only as of the date of this document.
Factors that could cause actual results to differ materially from those projected or implied in any “forward-looking statement” and from historical trends include, but are not limited to:
economic conditions, including consumer spending and plant and equipment investment in Hitachi’s major markets, particularly Japan, Asia, the United States and Europe, as well as
levels of demand in the major industrial sectors Hitachi serves;
exchange rate fluctuations of the yen against other currencies in which Hitachi makes significant sales or in which Hitachi’s assets and liabilities are denominated;
uncertainty as to Hitachi’s ability to access, or access on favorable terms, liquidity or long-term financing;
uncertainty as to general market price levels for equity securities, declines in which may require Hitachi to write down equity securities that it holds;
fluctuations in the price of raw materials including, without limitation, petroleum and other materials, such as copper, steel, aluminum, synthetic resins, rare metals and rare-earth minerals,
or shortages of materials, parts and components;
the possibility of cost fluctuations during the lifetime of, or cancellation of, long-term contracts for which Hitachi uses the percentage-of-completion method to recognize revenue from
sales;
credit conditions of Hitachi’s customers and suppliers;
fluctuations in product demand and industry capacity;
uncertainty as to Hitachi’s ability to implement measures to reduce the potential negative impact of fluctuations in product demand, exchange rates and/or price of raw materials or
shortages of materials, parts and components;
uncertainty as to Hitachi’s ability to continue to develop and market products that incorporate new technologies on a timely and cost-effective basis and to achieve market acceptance for
such products;
increased commoditization of and intensifying price competition for products;
uncertainty as to Hitachi’s ability to attract and retain skilled personnel;
uncertainty as to Hitachi’s ability to achieve the anticipated benefits of its strategy to strengthen its Social Innovation Business;
uncertainty as to the success of acquisitions of other companies, joint ventures and strategic alliances and the possibility of incurring related expenses;
uncertainty as to the success of restructuring efforts to improve management efficiency by divesting or otherwise exiting underperforming businesses and to strengthen competitiveness;
the potential for significant losses on Hitachi’s investments in equity-method associates and joint ventures;
general socioeconomic and political conditions and the regulatory and trade environment of countries where Hitachi conducts business, particularly Japan, Asia, the United States and
Europe, including, without limitation, direct or indirect restrictions by other nations on imports and differences in commercial and business customs including, without limitation, contract
terms and conditions and labor relations;
uncertainty as to the success of cost structure overhaul;
uncertainty as to Hitachi’s access to, or ability to protect, certain intellectual property;
uncertainty as to the outcome of litigation, regulatory investigations and other legal proceedings of which the Company, its subsidiaries or its equity-method associates and joint ventures
have become or may become parties;
the possibility of incurring expenses resulting from any defects in products or services of Hitachi;
the possibility of disruption of Hitachi’s operations by natural disasters such as earthquakes and tsunamis, the spread of infectious diseases, and geopolitical and social instability such as
terrorism and conflict;
uncertainty as to Hitachi’s ability to maintain the integrity of its information systems, as well as Hitachi’s ability to protect its confidential information or that of its customers; and
uncertainty as to the accuracy of key assumptions Hitachi uses to evaluate its employee benefit-related costs.
The factors listed above are not all-inclusive and are in addition to other factors contained in other materials published by Hitachi.

© Hitachi, Ltd. 2018. All rights reserved.
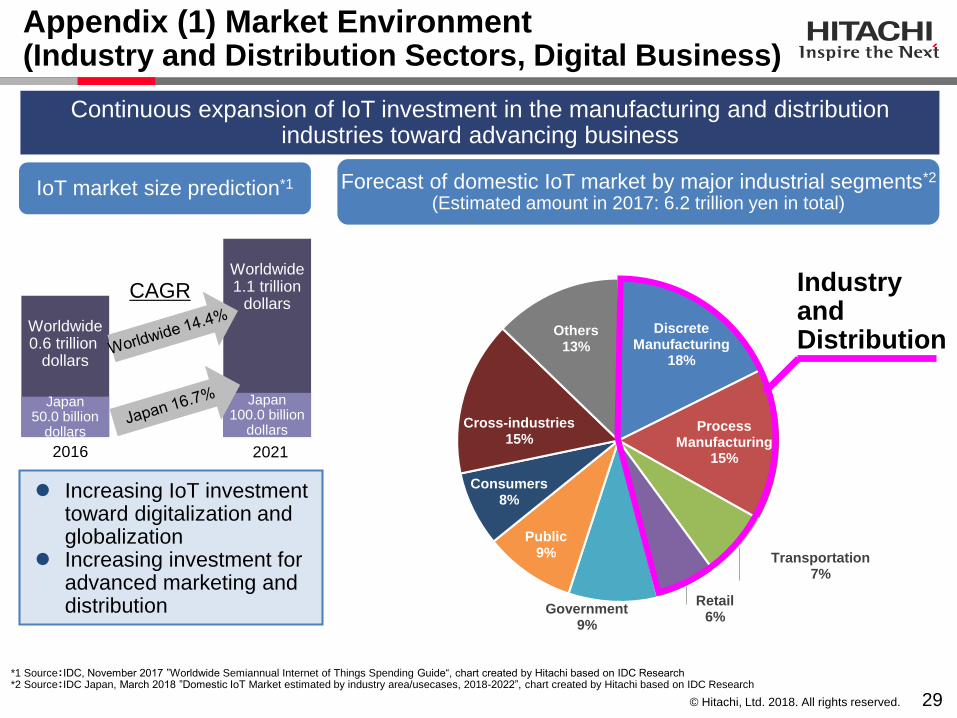
Appendix (1) Market Environment (Industry and Distribution Sectors, Digital Business)
29
CAGR
2021
Worldwide0.6 trillion
dollars
Japan50.0 billion
dollars
Worldwide1.1 trillion
dollars
Japan100.0 billion
dollars
2016
Continuous expansion of IoT investment in the manufacturing and distribution industries toward advancing business
Increasing IoT investment toward digitalization and globalization
Increasing investment for advanced marketing and distribution
Forecast of domestic IoT market by major industrial segments*2
(Estimated amount in 2017: 6.2 trillion yen in total)IoT market size prediction*1
Discrete Manufacturing
18%
Process Manufacturing
15%
Transportation7%
Retail6%
Government9%
Public9%
Consumers8%
Cross-industries15%
Others13%
Industryand Distribution
*1 Source:IDC, November 2017 ”Worldwide Semiannual Internet of Things Spending Guide“, chart created by Hitachi based on IDC Research*2 Source:IDC Japan, March 2018 ”Domestic IoT Market estimated by industry area/usecases, 2018-2022”, chart created by Hitachi based on IDC Research
© Hitachi, Ltd. 2018. All rights reserved.
Pro
vid
e s
erv
ices o
n a
on
e-s
top b
asis
from
ma
na
ge
me
nt to
the
wo
rksite
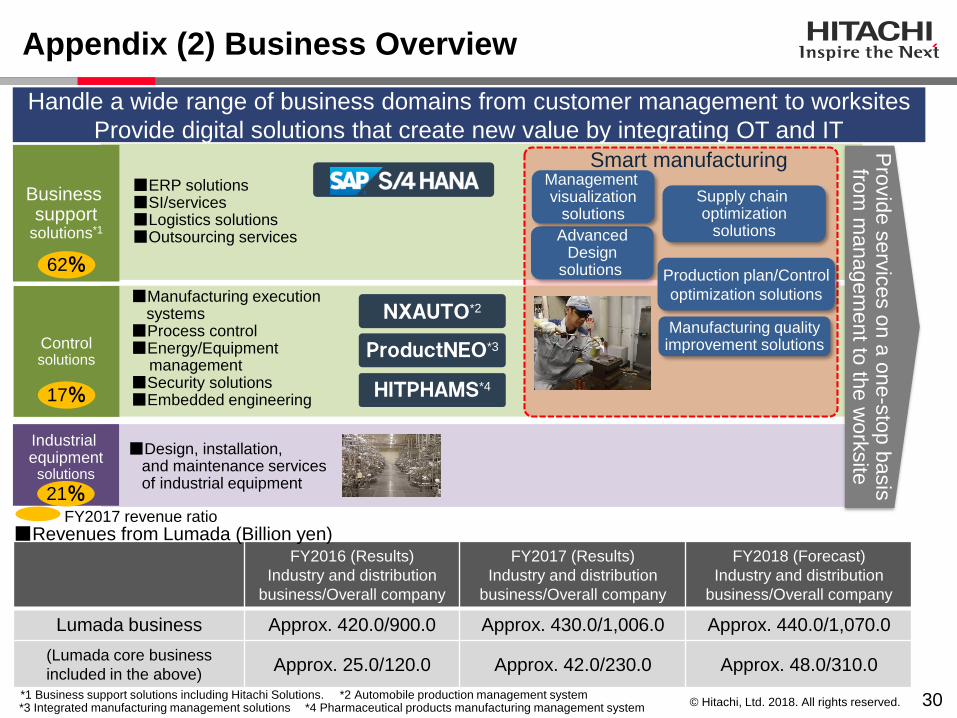
Appendix (2) Business Overview
Business support
solutions*1
■ERP solutions■SI/services■Logistics solutions■Outsourcing services
Industrial equipment
solutions
■Manufacturing execution systems
■Process control■Energy/Equipment
management■Security solutions■Embedded engineering
Controlsolutions
NXAUTO*2
30
HITPHAMS*4
ProductNEO*3
*1 Business support solutions including Hitachi Solutions. *2 Automobile production management system*3 Integrated manufacturing management solutions *4 Pharmaceutical products manufacturing management system
Smart manufacturing
■Design, installation,and maintenance servicesof industrial equipment
Handle a wide range of business domains from customer management to worksites
Provide digital solutions that create new value by integrating OT and IT
21%
17%
62%
FY2017 revenue ratio
AdvancedDesign
solutions
Supply chain optimization
solutions
Manufacturing qualityimprovement solutions
Production plan/Control
optimization solutions
Management visualization
solutions
FY2016 (Results)
Industry and distribution
business/Overall company
FY2017 (Results)
Industry and distribution
business/Overall company
FY2018 (Forecast)
Industry and distribution
business/Overall company
Lumada business Approx. 420.0/900.0 Approx. 430.0/1,006.0 Approx. 440.0/1,070.0
(Lumada core business
included in the above)Approx. 25.0/120.0 Approx. 42.0/230.0 Approx. 48.0/310.0
■Revenues from Lumada (Billion yen)
© Hitachi, Ltd. 2018. All rights reserved.
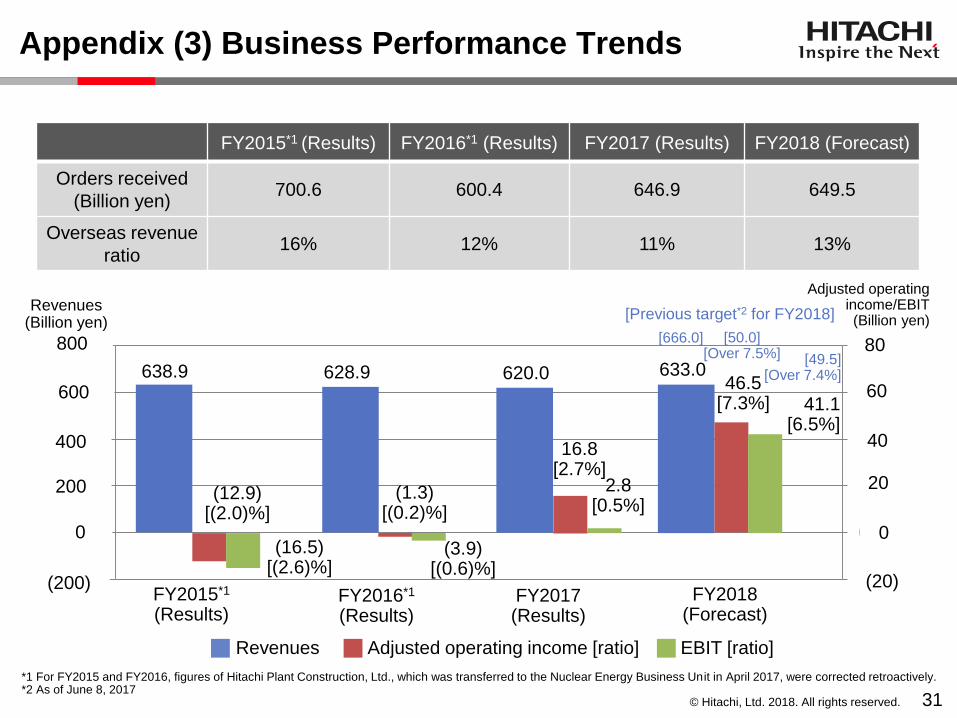
Appendix (3) Business Performance Trends
31
△ 200
0
200
400
600
800
△ 2,000
0
2,000
4,000
6,000
8,000800
400
200
(200)
80
40
Revenues(Billion yen)
Adjusted operating income/EBIT (Billion yen)
638.9 628.9 633.0
(12.9)[(2.0)%]
(16.5)[(2.6)%]
(1.3) [(0.2)%]
(3.9)[(0.6)%]
46.5[7.3%] 41.1
[6.5%]
FY2015*1
(Results)FY2018
(Forecast)FY2016*1
(Results)
FY2015*1 (Results) FY2016*1 (Results) FY2017 (Results) FY2018 (Forecast)
Orders received
(Billion yen)700.6 600.4 646.9 649.5
Overseas revenue
ratio16% 12% 11% 13%
Revenues Adjusted operating income [ratio] EBIT [ratio]
620.0
16.8[2.7%]
2.8[0.5%]
FY2017(Results)
[666.0] [50.0][Over 7.5%] [49.5]
[Over 7.4%]
[Previous target*2 for FY2018]
*1 For FY2015 and FY2016, figures of Hitachi Plant Construction, Ltd., which was transferred to the Nuclear Energy Business Unit in April 2017, were corrected retroactively.*2 As of June 8, 2017
600 60
20
(20)
0 0


![(Microsoft PowerPoint - Smart Education [Kompatibilis m\363d])](https://img.pdfslide.us/doc/110x75/586767951a28abf8568b4b5f/microsoft-powerpoint-smart-education-kompatibilis-m363d.jpg)