Embed Size (px)
Citation preview
Industry Analysis: The Fundamentals
• The objectives of industry analysis
• From environmental analysis to industry analysis
• Porter’s Five Forces Framework
• Applying industry analysis
• Industry & market boundaries
• Identifying Key Success Factors
OUTLINE
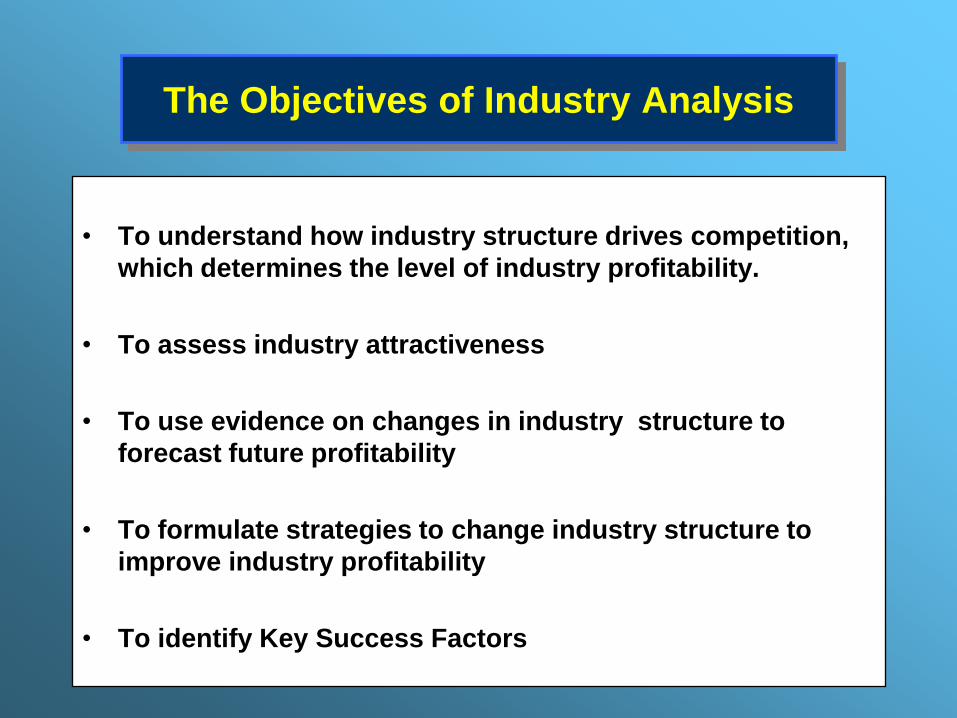
The Objectives of Industry Analysis
• To understand how industry structure drives competition,
which determines the level of industry profitability.
• To assess industry attractiveness
• To use evidence on changes in industry structure to
forecast future profitability
• To formulate strategies to change industry structure to
improve industry profitability
• To identify Key Success Factors
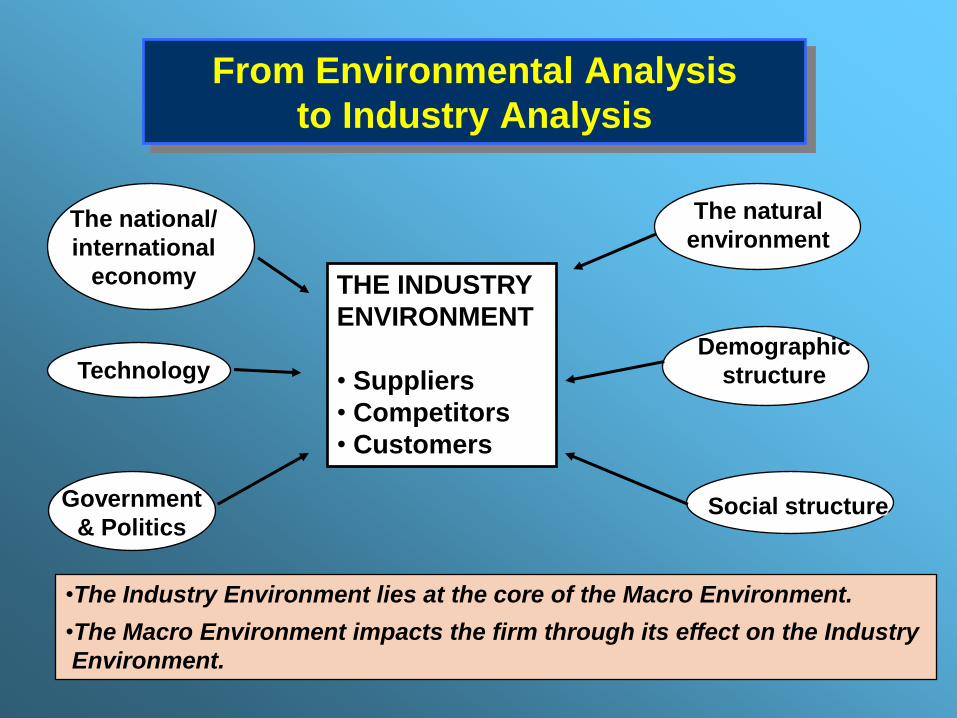
THE INDUSTRY
ENVIRONMENT
• Suppliers
• Competitors
• Customers
Social structure
The national/
international
economy
Technology
Government
& Politics
The natural
environment
Demographic
structure
Social structure
From Environmental Analysis
to Industry Analysis
•The Industry Environment lies at the core of the Macro Environment.
•The Macro Environment impacts the firm through its effect on the Industry
Environment.
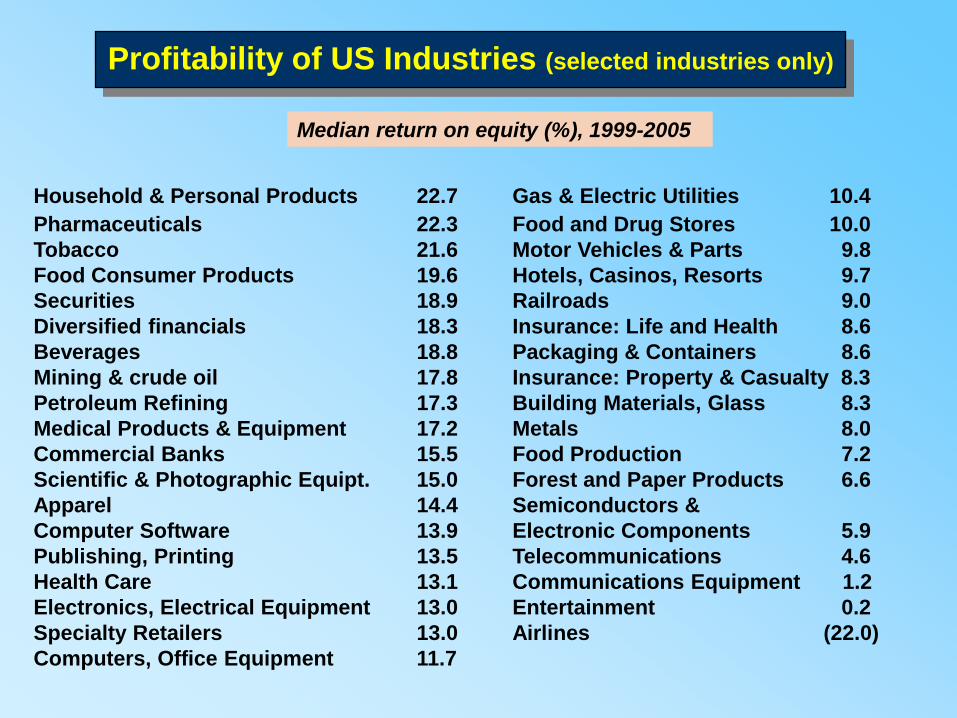
Profitability of US Industries (selected industries only)
Household & Personal Products 22.7 Gas & Electric Utilities 10.4
Pharmaceuticals 22.3 Food and Drug Stores 10.0
Tobacco 21.6 Motor Vehicles & Parts 9.8
Food Consumer Products 19.6 Hotels, Casinos, Resorts 9.7
Securities 18.9 Railroads 9.0
Diversified financials 18.3 Insurance: Life and Health 8.6
Beverages 18.8 Packaging & Containers 8.6
Mining & crude oil 17.8 Insurance: Property & Casualty 8.3
Petroleum Refining 17.3 Building Materials, Glass 8.3
Medical Products & Equipment 17.2 Metals 8.0
Commercial Banks 15.5 Food Production 7.2
Scientific & Photographic Equipt. 15.0 Forest and Paper Products 6.6
Apparel 14.4 Semiconductors &
Computer Software 13.9 Electronic Components 5.9
Publishing, Printing 13.5 Telecommunications 4.6
Health Care 13.1 Communications Equipment 1.2
Electronics, Electrical Equipment 13.0 Entertainment 0.2
Specialty Retailers 13.0 Airlines (22.0)
Computers, Office Equipment 11.7
Median return on equity (%), 1999-2005
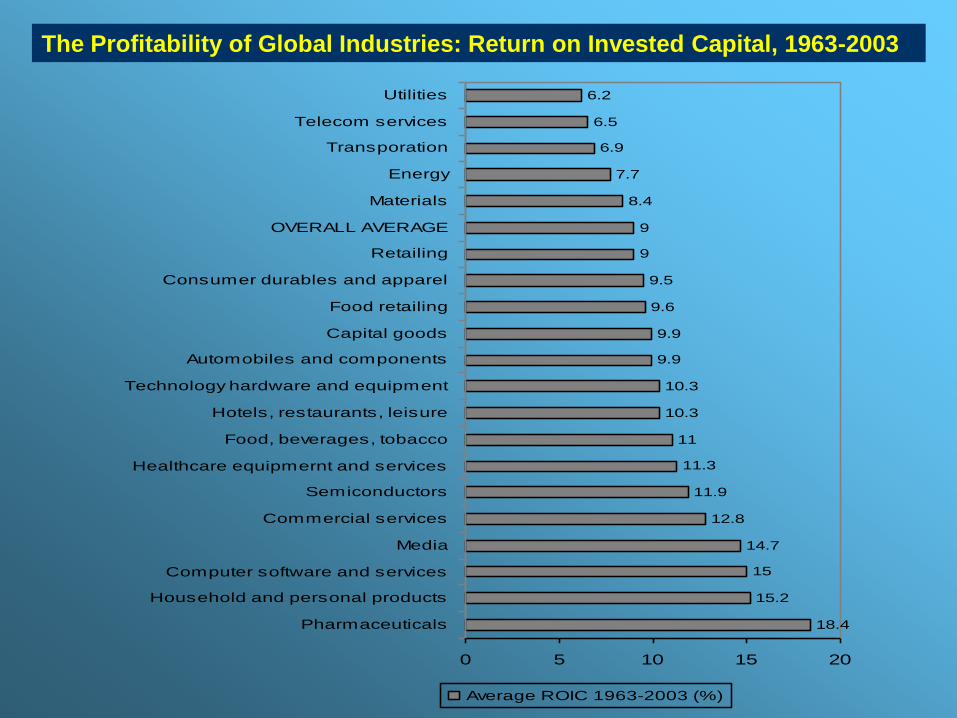
18.4
15.2
15
14.7
12.8
11.9
11.3
11
10.3
10.3
9.9
9.9
9.6
9.5
9
9
8.4
7.7
6.9
6.5
6.2
0 5 10 15 20
Pharmaceuticals
Household and personal products
Computer software and services
Media
Commercial services
Semiconductors
Healthcare equipmernt and services
Food, beverages, tobacco
Hotels, restaurants, leisure
Technology hardware and equipment
Automobiles and components
Capital goods
Food retailing
Consumer durables and apparel
Retailing
OVERALL AVERAGE
Materials
Energy
Transporation
Telecom services
Utilities
Average ROIC 1963-2003 (%)
The Profitability of Global Industries: Return on Invested Capital, 1963-2003
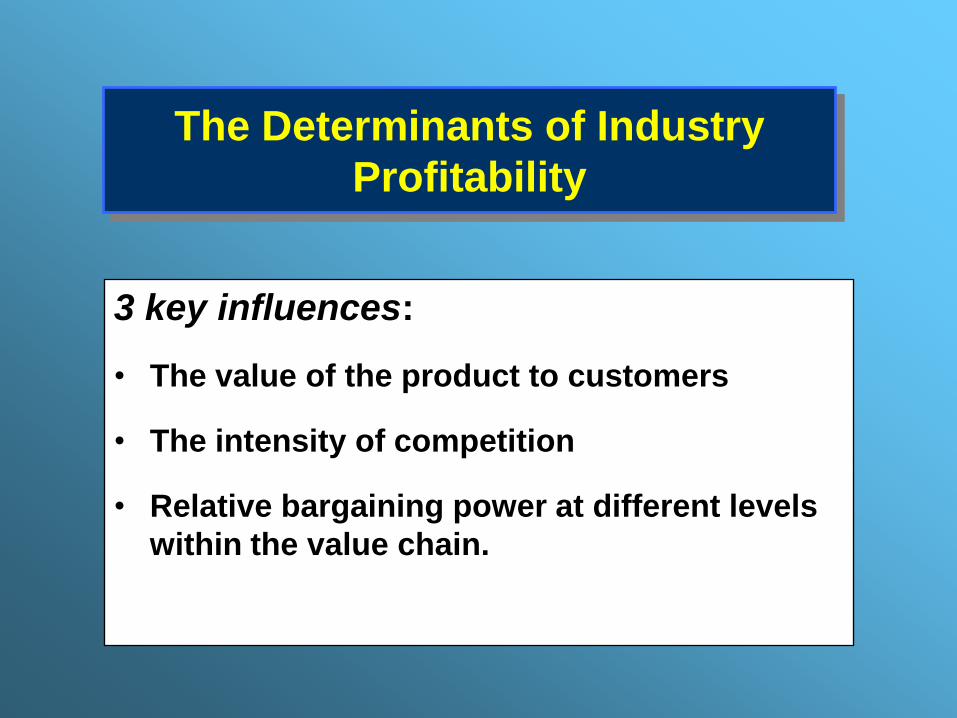
The Determinants of Industry
Profitability
3 key influences:
• The value of the product to customers
• The intensity of competition
• Relative bargaining power at different levels
within the value chain.
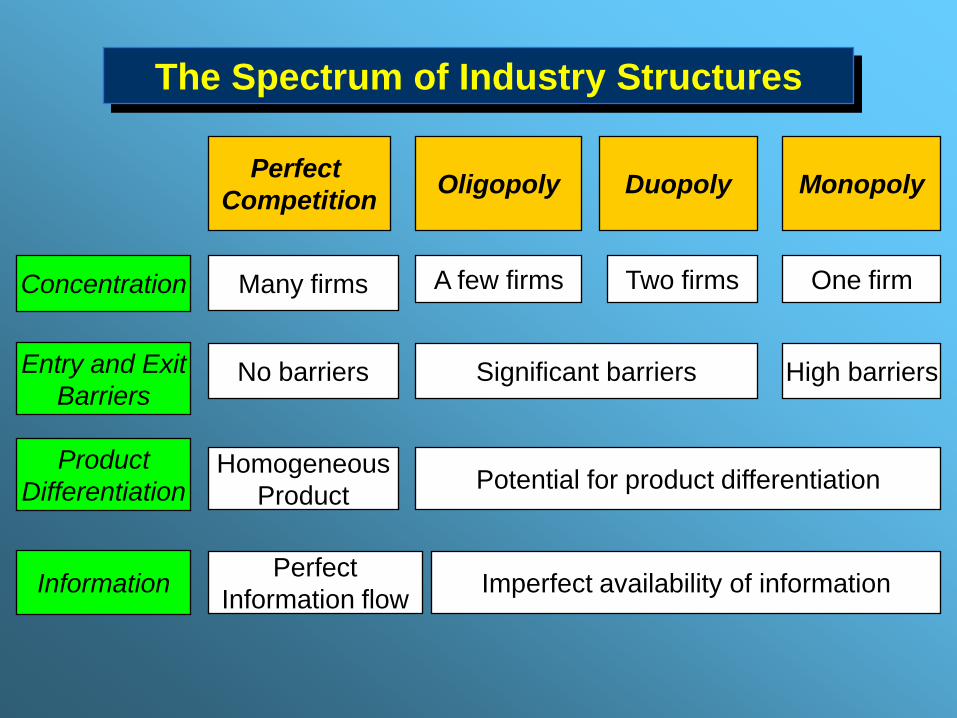
The Spectrum of Industry Structures
Concentration
Entry and Exit
Barriers
Product
Differentiation
Information
Perfect
Competition Oligopoly Duopoly Monopoly
Many firms A few firms Two firms One firm
No barriers Significant barriers High barriers
Homogeneous
Product Potential for product differentiation
Perfect
Information flow Imperfect availability of information
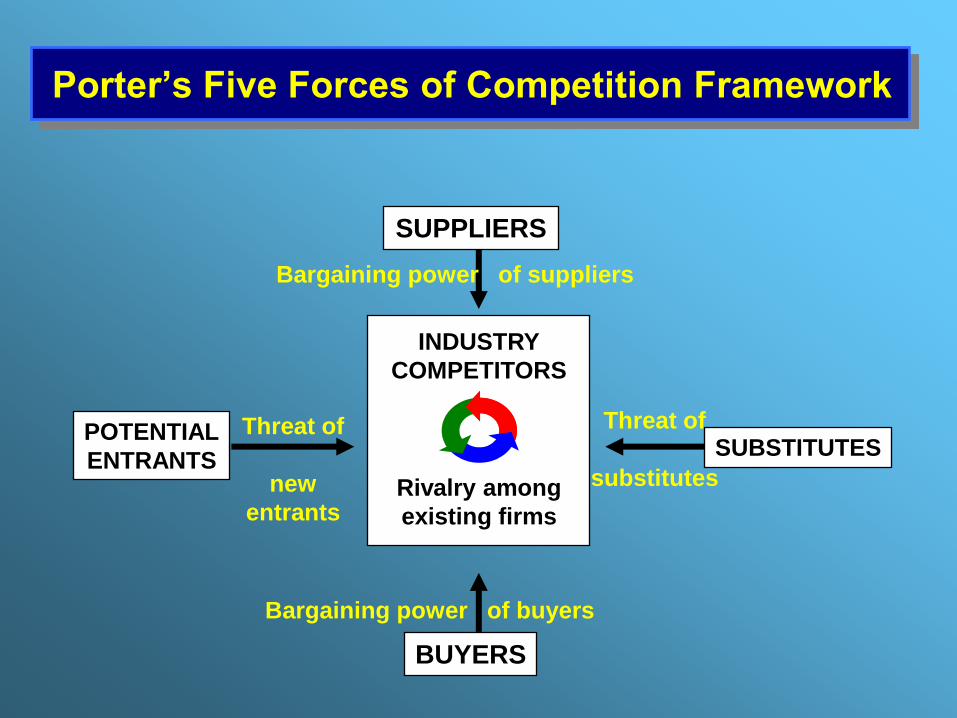
Porter’s Five Forces of Competition Framework
SUPPLIERS
POTENTIAL
ENTRANTS SUBSTITUTES
BUYERS
INDUSTRY
COMPETITORS
Rivalry among
existing firms
Bargaining power of suppliers
Bargaining power of buyers
Threat of
new
entrants
Threat of
substitutes
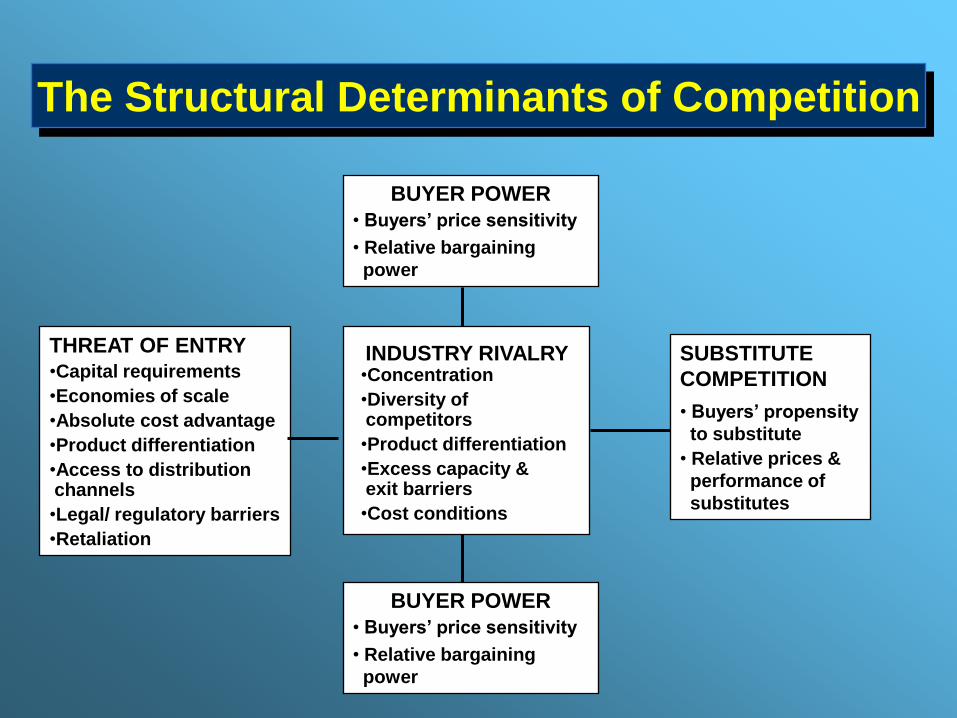
THREAT OF ENTRY
•Capital requirements
•Economies of scale
•Absolute cost advantage
•Product differentiation
•Access to distribution channels
•Legal/ regulatory barriers
•Retaliation
SUBSTITUTE
COMPETITION
• Buyers’ propensity
to substitute
• Relative prices &
performance of
substitutes
BUYER POWER
• Buyers’ price sensitivity
• Relative bargaining
power
INDUSTRY RIVALRY •Concentration
•Diversity of competitors
•Product differentiation
•Excess capacity & exit barriers
•Cost conditions
BUYER POWER
• Buyers’ price sensitivity
• Relative bargaining
power
The Structural Determinants of Competition
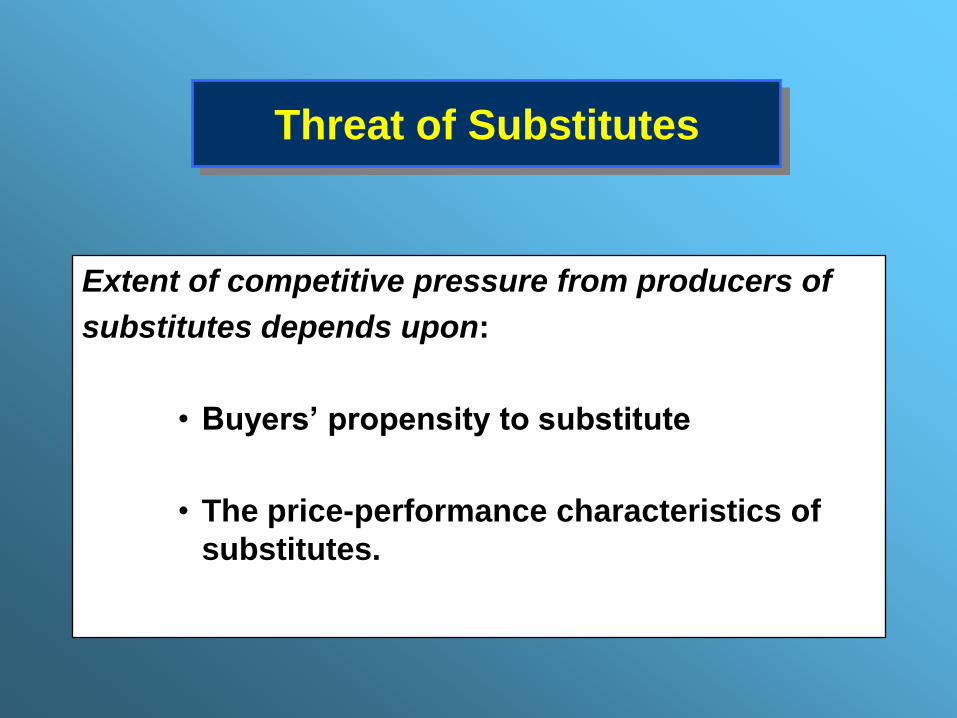
Threat of Substitutes
Extent of competitive pressure from producers of
substitutes depends upon:
• Buyers’ propensity to substitute
• The price-performance characteristics of
substitutes.
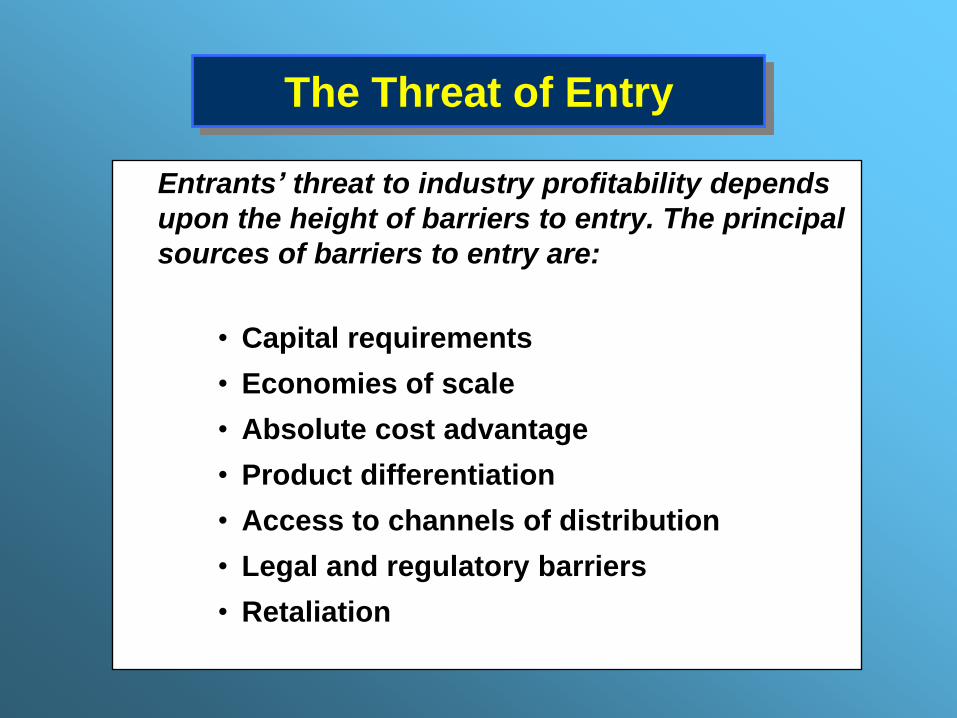
The Threat of Entry
Entrants’ threat to industry profitability depends
upon the height of barriers to entry. The principal
sources of barriers to entry are:
• Capital requirements
• Economies of scale
• Absolute cost advantage
• Product differentiation
• Access to channels of distribution
• Legal and regulatory barriers
• Retaliation
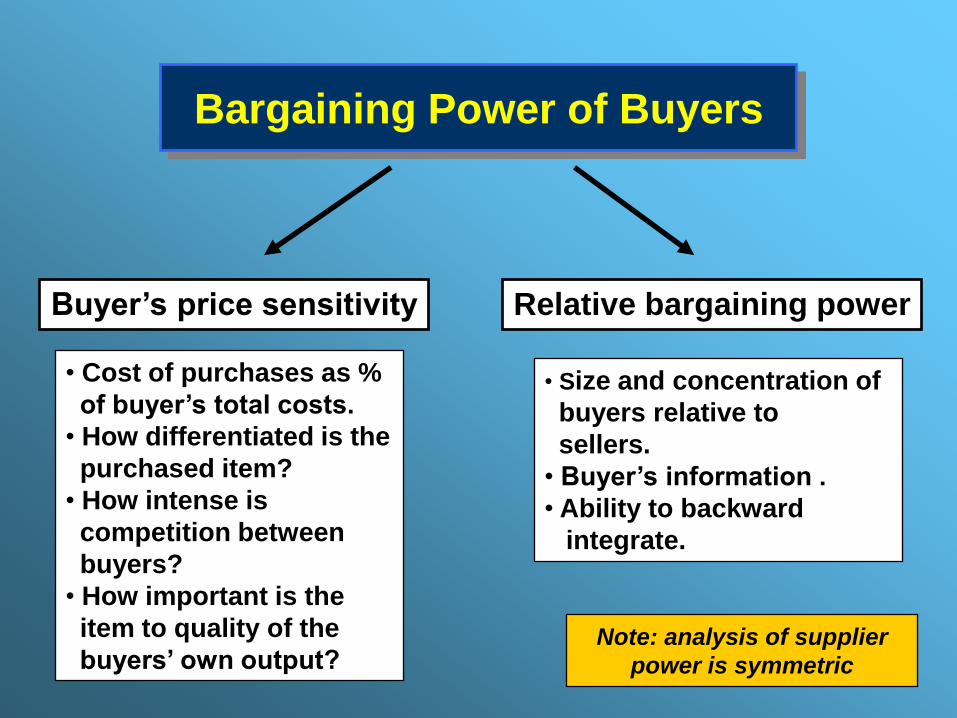
Bargaining Power of Buyers
Buyer’s price sensitivity Relative bargaining power
• Cost of purchases as %
of buyer’s total costs.
• How differentiated is the
purchased item?
• How intense is
competition between
buyers?
• How important is the
item to quality of the
buyers’ own output?
• Size and concentration of
buyers relative to
sellers.
• Buyer’s information .
• Ability to backward
integrate.
Note: analysis of supplier
power is symmetric
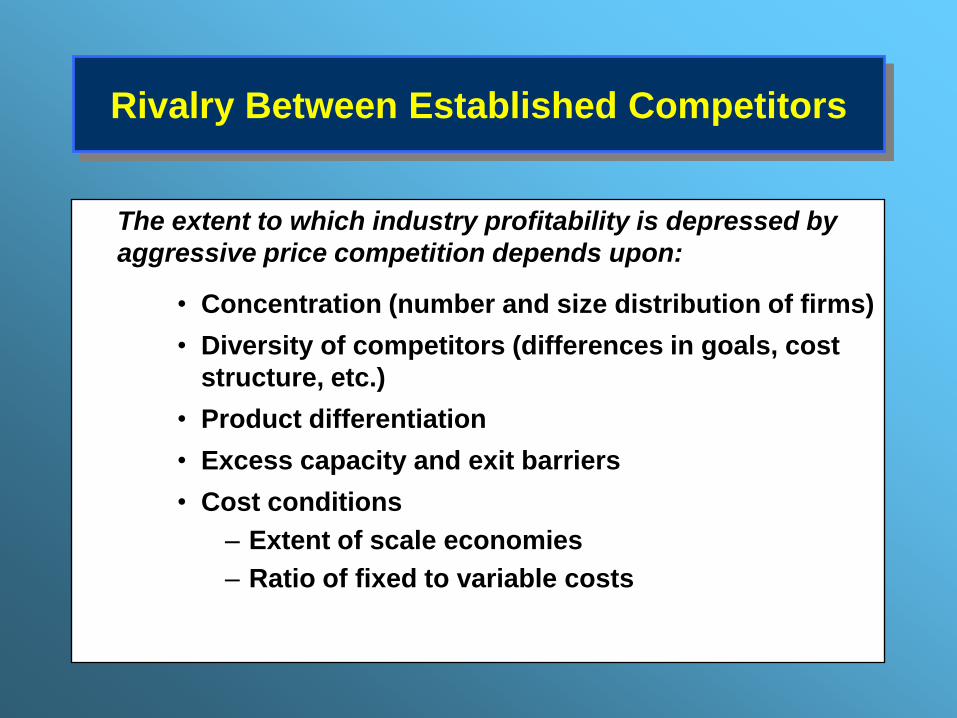
Rivalry Between Established Competitors
The extent to which industry profitability is depressed by
aggressive price competition depends upon:
• Concentration (number and size distribution of firms)
• Diversity of competitors (differences in goals, cost
structure, etc.)
• Product differentiation
• Excess capacity and exit barriers
• Cost conditions
– Extent of scale economies
– Ratio of fixed to variable costs
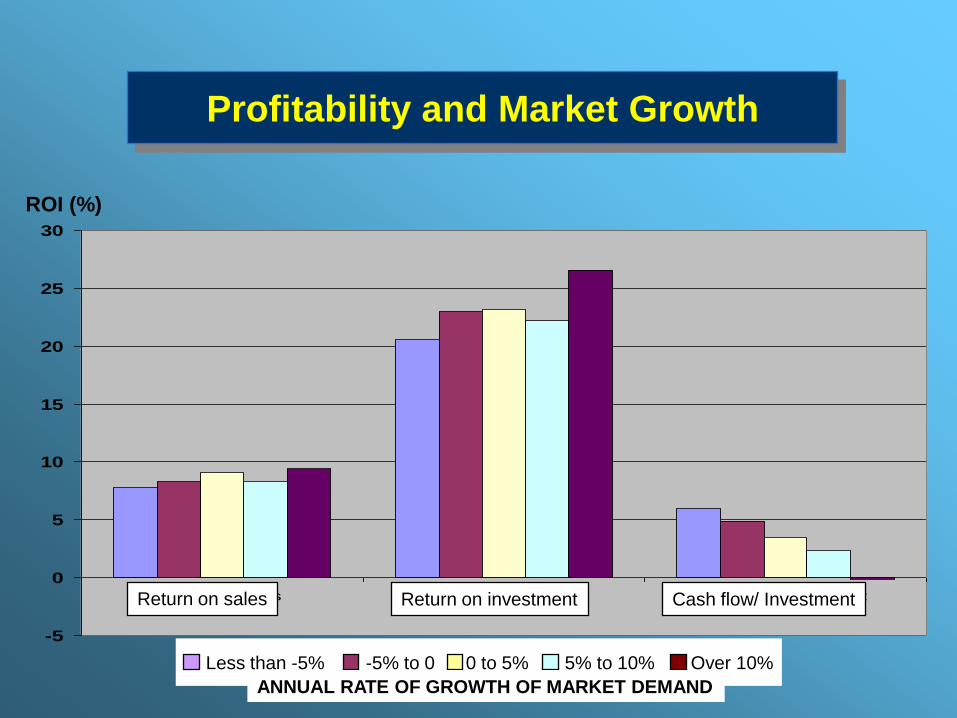
Profitability and Market Growth
-5
0
5
10
15
20
25
30
Return on sales Return on investment Cash flow/Investment
< -5% -5% to 0 0 to 5% 5% to 10% > 10% Less than -5% -5% to 0 0 to 5% 5% to 10% Over 10%
Return on sales Cash flow/ Investment Return on investment
ANNUAL RATE OF GROWTH OF MARKET DEMAND
ROI (%)
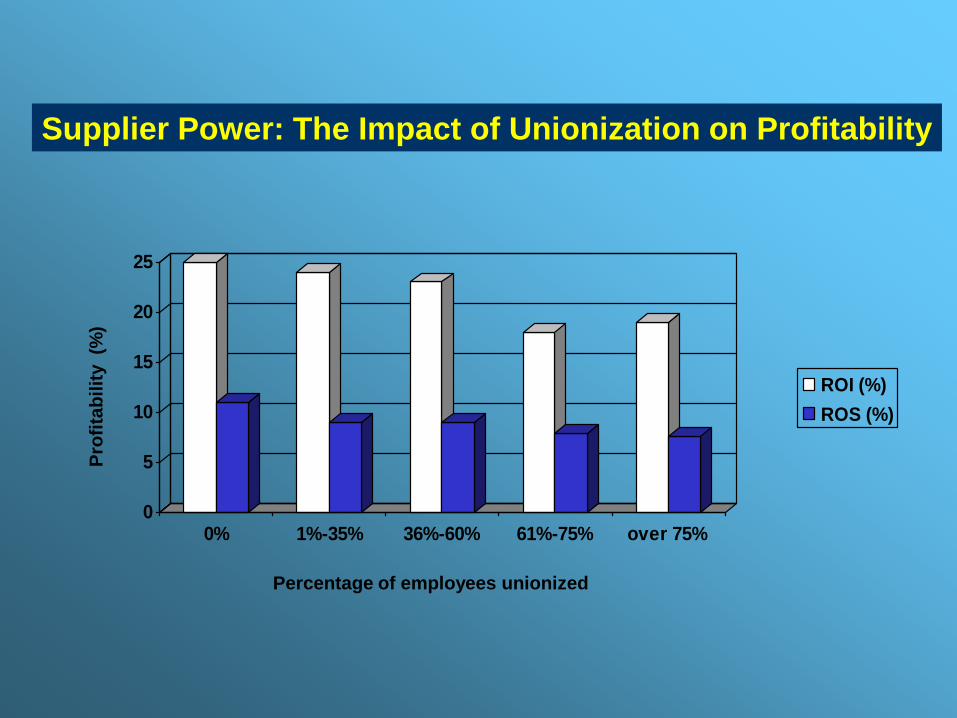
0
5
10
15
20
25
0% 1%-35% 36%-60% 61%-75% over 75%
ROI (%)
ROS (%)
Percentage of employees unionized
Pro
fita
bilit
y (%
)
Supplier Power: The Impact of Unionization on Profitability
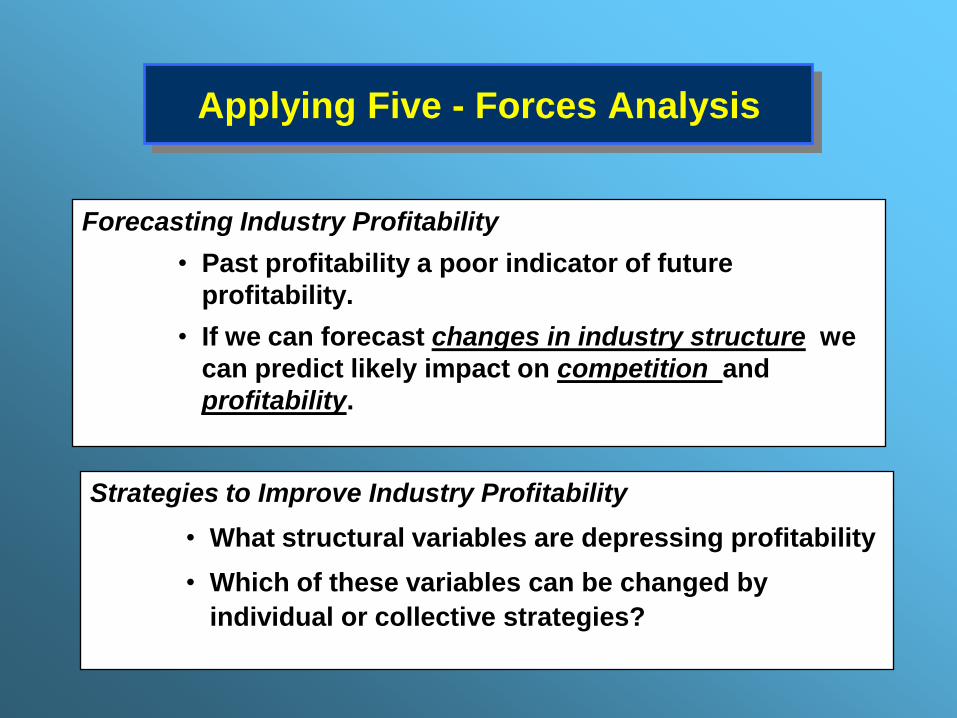
Applying Five - Forces Analysis
Forecasting Industry Profitability
• Past profitability a poor indicator of future
profitability.
• If we can forecast changes in industry structure we
can predict likely impact on competition and
profitability.
Strategies to Improve Industry Profitability
• What structural variables are depressing profitability
• Which of these variables can be changed by
individual or collective strategies?

Drawing Industry Boundaries :
Identifying the Relevant Market
• What industry is BMW in:
– World Auto industry
– European Auto industry
– World luxury car industry?
• Key criterion: SUBSTITUTABILITY
– On the demand side : are buyers willing to substitute between
types of cars and across countries
– On the supply side : are manufacturers able to switch
production between types of cars and across countries
• We may need to analyze industry at different levels of
aggregation for different types of decision
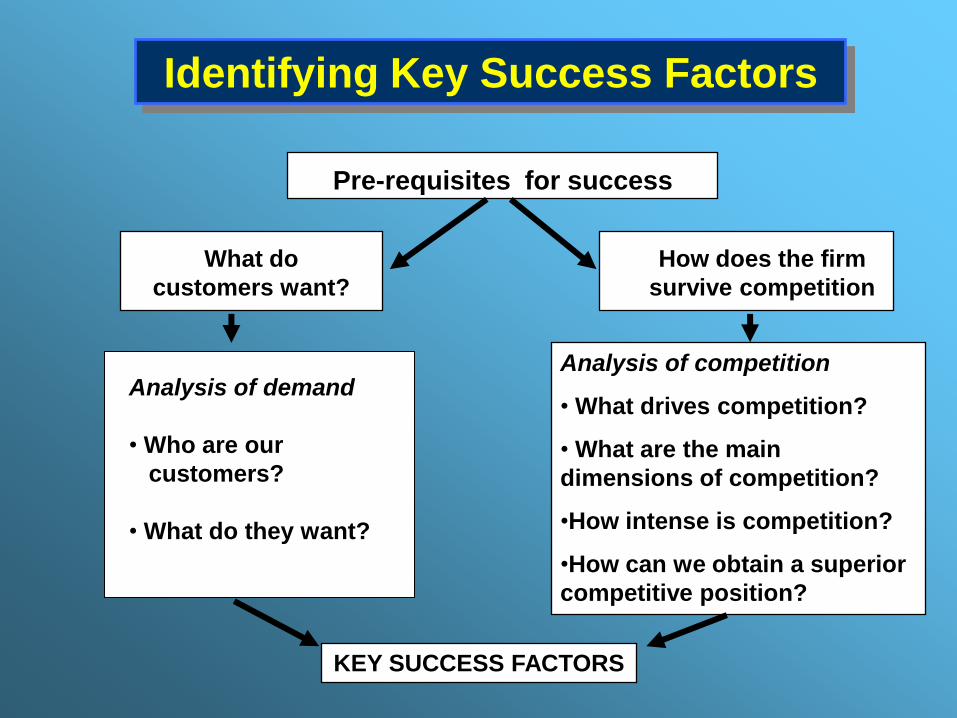
Pre-requisites for success
• What drives competition?
• What are the main
dimensions of competition?
• How intense is competition?
• How can we obtain a
superior competitive position?
Analysis of demand
• Who are our
customers?
• What do they want?
KEY SUCCESS FACTORS
Analysis of competition
• What drives competition?
• What are the main
dimensions of competition?
•How intense is competition?
•How can we obtain a superior
competitive position?
What do
customers want?
How does the firm
survive competition
Pre-requisites for success
Identifying Key Success Factors
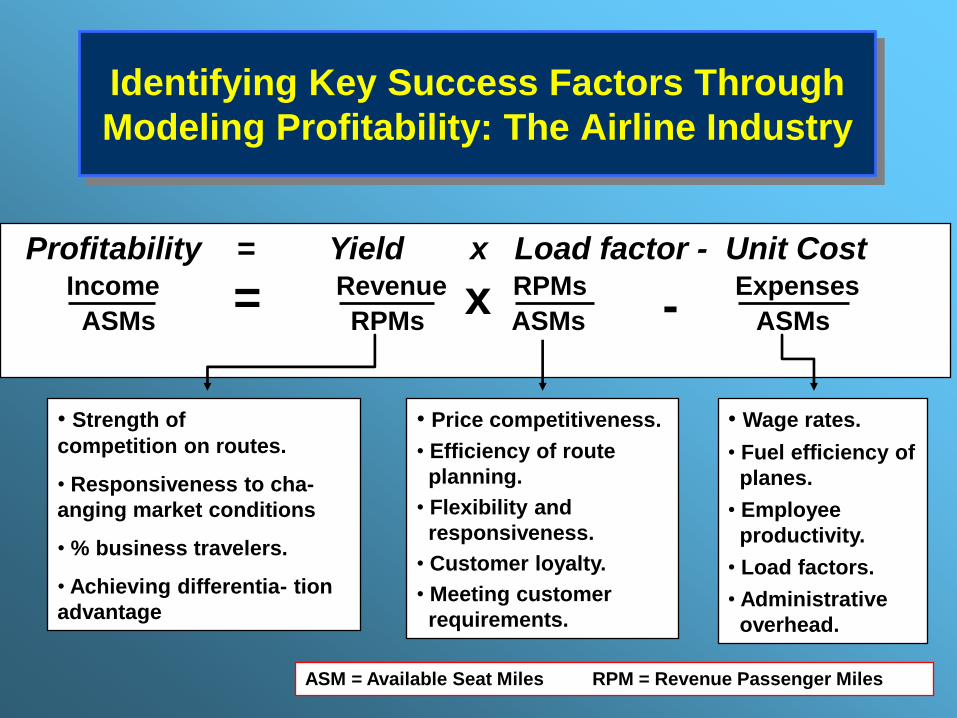
Identifying Key Success Factors Through
Modeling Profitability: The Airline Industry
Profitability = Yield x Load factor - Unit Cost Income Revenue RPMs Expenses
ASMs RPMs ASMs ASMs
= x -
• Price competitiveness.
• Efficiency of route
planning.
• Flexibility and
responsiveness.
• Customer loyalty.
• Meeting customer
requirements.
• Wage rates.
• Fuel efficiency of
planes.
• Employee
productivity.
• Load factors.
• Administrative
overhead.
• Strength of
competition on routes.
• Responsiveness to cha-
anging market conditions
• % business travelers.
• Achieving differentia- tion
advantage
ASM = Available Seat Miles RPM = Revenue Passenger Miles
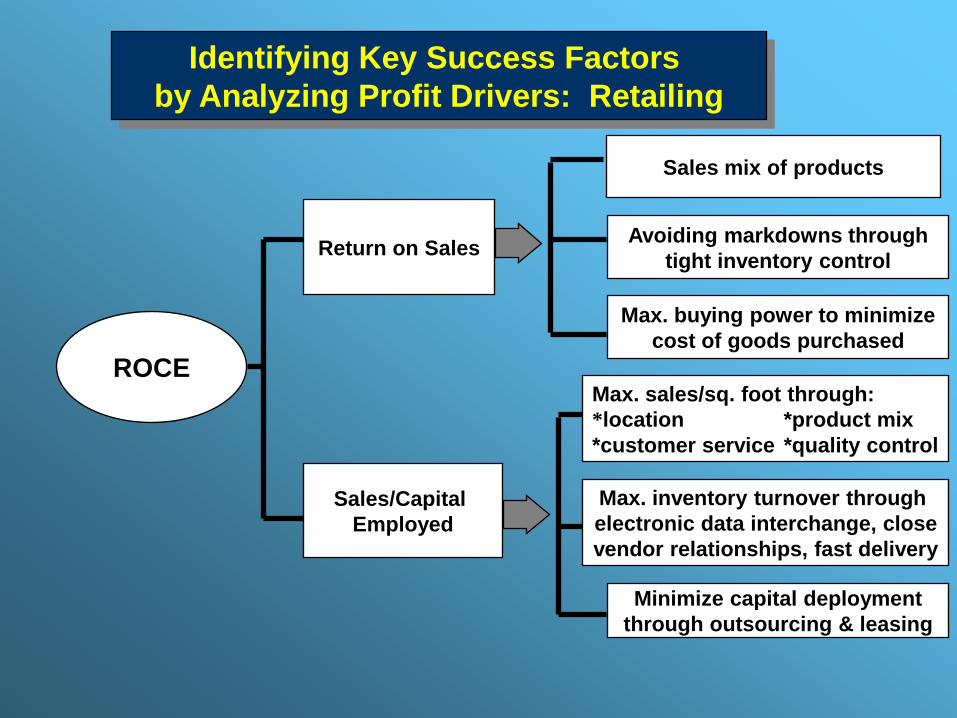
ROCE
Return on Sales
Sales/Capital
Employed
Sales mix of products
Avoiding markdowns through
tight inventory control
Max. buying power to minimize
cost of goods purchased
Max. sales/sq. foot through:
*location *product mix
*customer service *quality control
Max. inventory turnover through
electronic data interchange, close
vendor relationships, fast delivery
Minimize capital deployment
through outsourcing & leasing
Identifying Key Success Factors
by Analyzing Profit Drivers: Retailing
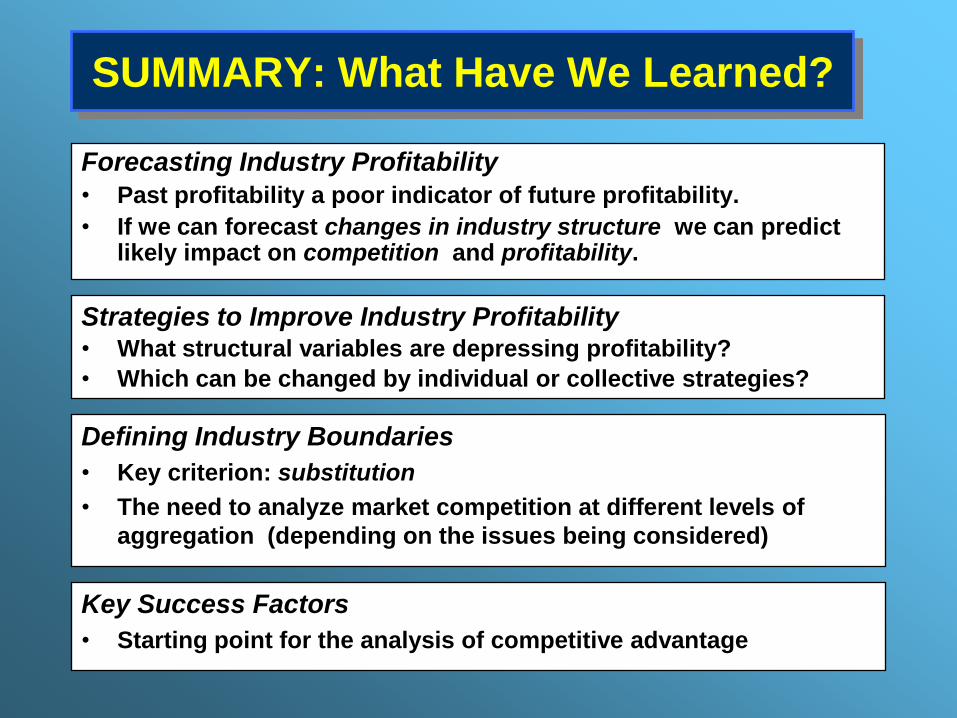
SUMMARY: What Have We Learned?
Forecasting Industry Profitability
• Past profitability a poor indicator of future profitability.
• If we can forecast changes in industry structure we can predict likely impact on competition and profitability.
Strategies to Improve Industry Profitability • What structural variables are depressing profitability?
• Which can be changed by individual or collective strategies?
Defining Industry Boundaries
• Key criterion: substitution
• The need to analyze market competition at different levels of
aggregation (depending on the issues being considered)
Key Success Factors
• Starting point for the analysis of competitive advantage


![2nd Chapter Macro Environment[1]](https://img.pdfslide.us/doc/110x75/55cf8c565503462b138b8aaa/2nd-chapter-macro-environment1.jpg)