Embed Size (px)
Citation preview
Industrial Espionage and Productivity∗
Albrecht Glitz† Erik Meyersson‡
Humboldt University Berlin, SITE, SSEUPF and Barcelona GSE
July 11, 2016
Preliminary draft – Comments are welcome
Abstract
In this paper, we investigate the economic returns to industrial espionage by linking informationfrom East Germany’s foreign intelligence service to sector-specific gaps in total factor productivity(TFP) between West and East Germany. Based on a data set that comprises the entire flowof information provided by East German informants over the period 1969-1989, we document asignificant narrowing of sectoral West-to-East TFP gaps as a result of East Germany’s industrialespionage. This central finding holds across a wide range of specifications and is robust to theinclusion of several alternative proxies for technology transfer. We further demonstrate that theeconomic returns to industrial espionage are particularly strong in sectors that were closer tothe West German technology frontier and – albeit less precisely estimated – in sectors in whichconstraints to the import of goods and services were particularly pronounced. Finally, our findingsshow that over the time period considered, industrial espionage crowded out standard overt R&Din East Germany.
JEL Classification: D24, F52, N34, N44, O30, O47, P26Keywords: Espionage, Productivity, Research and Development
∗The authors thank representatives of The Agency of the Federal Commissioner for the Stasi Records (BStU) andGerhard Heske for sharing the data and valuable expertise. We also thank Niklas Flamang, Adrian Lerche, ChrisSchroeder, and Paul Soto for excellent research assistance as well as seminar participants at CREI, UPF, CREST, HECMontreal, Mannheim, Duisburg-Essen, Humboldt University Berlin, and DIW for helpful feedback and suggestions.Albrecht Glitz gratefully acknowledges financial support from the Barcelona GSE, through the Program “Severo Ochoa”for Centers of Excellence in R&D SEV-2011-0075, funded by the Spanish Ministry of Economy and Competitiveness.The views, analysis, conclusions, and remaining errors in this paper are solely the responsibility of the authors.†Email: [email protected]. Address: Department of Economics and Business, Universitat Pompeu Fabra,
Jaume I Building, Ramon Trias Fargas, 25-27, 08005 Barcelona, Spain.‡Email: [email protected]. Address: Stockholm Institute for Transition Economics (SITE), Stockholm School
of Economics, P.O. Box 6501, SE-113 83 Stockholm, Sweden.
1
“The Ministry for State Security has the goal of acquiring, in steadily increasing volume,scientific-technical information and documents from West Germany and other capitalistcountries.” – Erich Mielke, Minister of State Security (1957-1989), BStU, Policy Docu-ments. DA, 3/55/DSt 100938
1 Introduction
Throughout history, from the Byzantine Empire’s clandestine acquisition of silk worms from China inthe 6th century AD to contemporary breaches of cyber networks, industrial espionage has remaineda pervasive channel for technological transfer. In particular during the period following the end ofthe Second World War, industrial espionage became key to state development as the communist blocattempted to catch up with the capitalist world’s technological advantage. Through secret agents inthe West, technologies relating to the atomic bomb, supersonic airplanes and computers were – tradeembargoes notwithstanding – transferred into production in countries like the Soviet Union and EastGermany.1
Despite the rich history of illicit technology transfer and its continuing contemporary importance,industrial espionage has received little attention in economics. Undoubtedly, the secret nature of thepractice obscures its economic significance which according to one US government report amounts to“billions of dollars per year, constituting a serious national security concern.”2 Even more opaque arethe benefits accruing to countries actively engaging in industrial espionage.
In this paper, we analyze the relationship between state-sponsored industrial espionage and tech-nological progress, focusing on the effect of industrial espionage on productivity. The centerpiece ofour empirical analysis is a dataset that comprises the entire recorded stock of information East Ger-man foreign intelligence sources gathered abroad during the period 1968-1989. This unique database,which survived the political turmoils after the fall of the Berlin Wall in November 1989 only througha stroke of luck, includes detailed information on 189,725 individual pieces of information, includingtheir precise date of receipt at the East German Ministry for State Security (MfS, commonly referredto as the Stasi), the code names of their sources and a list of keywords describing each item’s con-tent. To operationalize this wealth of data, we use the keywords provided to attribute each piece ofinformation to the industry sector it pertains to. We then merge the obtained information flows toindustry-specific total factor productivity (TFP) measures which we compute from time series dataon sectoral gross value added, employment and capital investment in both West and East Germanybetween 1969 and 1989. In our main estimation equation, we regress sectoral differences in TFPgrowth rates between West and East Germany on the flow of sector-specific information generated byindustrial espionage, controlling for direct measures of R&D activity in both parts of Germany. Ourestimates thus speak directly to the question in how far industrial espionage allowed the East German
1“Top 3 Successes of Soviet Economic Espionage,”, Moscow Times, Jan 29 2015. http://www.themoscowtimes.com/business/article/russian-spy-ring-treads-in-soviet-s-footsteps-in-economic-espionage-case/515095.html; “’Ace’ spy revealed Concorde secrets”, BBC News, September 14 1999, http://news.bbc.co.uk/2/hi/uk_news/politics/447464.stm
2“Annual Report to Congress on Foreign Economic Collection and Industrial Espionage”, National CounterintelligenceCenter, July 1995. https://www.fas.org/sgp/othergov/indust.html
2
economy to keep up with technological progress in the West.Our results show evidence of significant economic returns to industrial espionage. A one standard
deviation increase in the covert inflow of information results in a 0.89 standard deviation narrowingof the log TFP gap and a 0.70 standard deviation decrease in the log output per worker gap betweenWest and East Germany. These results are robust across a large number of specifications and littleaffected if we allow for alternative channels of technology transfer. We also employ an instrumentalvariable strategy in which we utilize only information accruing from informants who were alreadyactive at the beginning of the sample period. In doing so, we avoid endogeneity resulting from theselective placement of new agents based on the preferences and strategic aims of the East Germangovernment. We further show evidence that industrial espionage in East Germany tended to crowdout investments in regular overt R&D and that it was particularly effective in those sectors that wereclosest to the West German technological frontier and – albeit less precisely estimated – those sectorsthat were most shut off from international trade.
To the best of our knowledge, we are the first to empirically assess the role of industrial espionage fortechnological progress. In doing so, our paper touches upon several relevant strands of the economicsliterature. In economic history, the role of espionage has been investigated with a focus on its adverseconsequences: one example is the research coming out of the archival study of the former Soviet Union’sintelligence agency, the KGB (Harrison, 2008, Harrison, 2013, and Harrison and Zaksauskiene, 2016).Lichter, Löffler and Siegloch (2015) exploit discontinuities at state borders within East Germany toshow that higher levels of Stasi surveillance lead to lower levels of social capital. In this field ofresearch, our paper provides evidence of some of the benefits of secrecy in the form of industrialespionage activities. Related to our work is also the economic history literature on innovation andeconomic development (Schmookler, 1962, Schmookler, 1966, Sokoloff, 1988, Moser and Voena, 2012,and Moser, 2013).
Moreover, the literature on the role of innovation in explaining productivity growth (Griliches,1980, Griliches and Lichtenberg, 1984, Romer, 1990, Grossman and Helpman, 1991, Aghion andHowitt, 1992, and Howitt, 2000) finds predominantly large economic returns to R&D but has re-mained silent on any economic effects of industrial espionage. Instead, this literature has focused onrelevant overt channels of technology diffusion such as international trade (Coe and Helpman, 1995,Eaton and Kortum, 1999, Keller, 2004, and Cameron, Proudman and Redding, 2005) and foreign directinvestment (Fons-Rosen, Kalemli-Ozcan, Sørensen, Villegas-Sanchez and Volosovych, 2013). Factorssuch as the distance to the world technology frontier, human capital, and institutions (Griffith, Red-ding and Van Reenen, 2004; Acemoglu, Aghion and Zilibotti, 2006) have also been shown to beardirectly on the choice of technology adoption versus innovation. A starting point of our research is theconjecture that intelligence capabilities could serve as an important additional channel of technologydiffusion, especially in the presence of trade sanctions and limits on foreign investment. Moreover,whereas standard forms of technology diffusion like trade and foreign investment rely on the free flowof capital and goods, we demonstrate that industrial espionage appears to be particularly effective intheir absence.
Furthermore, a lingering identification challenge in past studies has been separating the positiveeffects of knowledge spillovers from the negative business stealing effects through product market
3
rivalry (Bloom, Schankermann and Van Reenen, 2013). In our case, the limited product marketrivalry between East and West German industries – for reasons orthogonal to East-to-West Germanproductivity differences – allow us to effectively estimate effects of knowledge spillovers separate fromany business stealing effects.3
Due to the particular institutional setting that prevailed in East Germany during the studiedperiod, there are a couple of important points weighing on the external validity of the results. Theseinclude the discrepancy between East Germany’s planned economy versus today’s ubiquitous marketeconomies. Also, the extensive trade embargoes against the entire communist bloc at the time severelylimited standard forms of technology adoption, which are available to most countries today.
The rest of the paper is organized as follows. Section 2 provides the historical context to the use ofindustrial espionage in East Germany. Section 3 describes the data sources used in the paper. Section4 presents the empirical framework and estimation strategy. Section 5 presents the main results, andSection 6 concludes.
2 Historical Background
Possibly the earliest recorded incidence of state-sponsored industrial espionage occurred in the 6thcentury AD, when two Nestorian monks successfully smuggled silkworm eggs, likely hidden in bamboocanes, into the Byzantine Empire from China. This daring feat, an important juncture in the economichistory of the Early Middle Ages, led to the breaking of two monopolies: that of Chinese silk productionand that of the Persian silk trade with the West. As a result, Byzantine silk became one of the Empire’smost profitable commodities while also providing a valuable medium of exchange, and several citiesdeveloped into major textile centers as a result (Norwich, 1990; Laiou, 2002).4
In a somewhat similar vein, East German industrial espionage was to a large extent a response tothe West’s implementation of economic containment policies at the onset of the Cold War (Jackson,2001). Instrumental in this process was the East-West trade embargo established after the SecondWorld War and facilitated through The Coordinating Committee for Multilateral Export Controls(CoCom).5 This entity served as a tool for Western countries to implement export controls on anextensive list of goods bound for the communist bloc countries. These included not just goods fromthe military and nuclear sectors, but also industrial “dual-use” products which could be used formilitary purposes, especially those characterized by advanced technologies.
Meanwhile, early East-to-West migration allowed the MfS to expand its intelligence network in theWest, allowing infiltration of key centers of power in the Federal Republic of Germany. The broaderextent of Stasi’s infiltration of West Germany is today widely known, as is its internal repressive nature
3In this context, we demonstrate the absence of any effects of East German industrial espionage on the growth inTFP productivity in West German industries.
4Much later, throughout the late eighteenth and early nineteenth centuries, “[t]he United States emerged as the world’sindustrial leader by illicitly appropriating mechanical and scientific innovations from Europe” as “American industrialspies roamed the British Isles, seeking not just new machines but skilled workers who could run and maintain thosemachines” (Ben-Atar, 2004).
5Some countries, such as the US, further prevented any country that was deemed to be “dominated or controlled bycommunism” (Section 231 of the Trade Expansion Act of 1962) from obtaining a Most Favored Nation status, whichwould have significantly lowered trade barriers with East Germany.
4
(Koehler, 2000), but its industrial espionage has been much less covered, an exception being Macrakis(2008), who through archival research provides a historical overview and several case studies with aspecific focus on the IT sector. Research on the economic impact of East German industrial espionageis (to our knowledge) nonexistent.
Most of the Stasi’s industrial espionage was conducted under its foreign intelligence unit (Hauptver-waltung Aufklärung, HVA), led by the spy chief Markus Wolf. During Wolf’s tenure, the HVA wouldcreate perhaps one of the world’s best intelligence networks ever seen (Macrakis, 2008):
“During the thirty-five years of its existence, the HVA managed to penetrate West Ger-many’s most sensitive institutions, institutions ranging from the chancellor’s office andforeign office to intelligence and security agencies to their most prestigious scientific andtechnical establishments. In 1989 the SWT had agents planted at internationally competi-tive companies like IBM, Siemens, AEG/Telefunken, SEL, Texas Instruments, and DEC.”
The department in charge of stealing scientific-technical secrets from the West started off as a smallunit with only around 35 staff members. By 1989, it had grown into the well-organized Sector forScience and Technology (Sektor Wissenschaft und Technik, SWT), which then counted up to fourhundred staff members, representing roughly 40 percent of all HVA employees (Macrakis, 2008), andthousands of informants. Over time, the East German espionage network in West Germany facilitatedsignificant technology transfers, despite the trade embargo of strategic goods set up by the Westernpowers.
In the 1970s, East German political leadership decided to become a world leader in computers,and significant resources was directed to producing microchips as well as infiltrating the Westernelectronics industry. Companies like IBM and Siemens became highly valued targets of espionage.By 1970, East German electronics experts had already acquired and reverse engineered more than adozen computers, such as the IBM 360, and by 1973 the Dresden-based VEB Robotron was producingcomputers “at a rate of eighty to one hundred per year” (Macrakis, 2008).6
Illicit technology transfer from West to East was a contentious issue at the time and concerns overtechnology leaks to the Soviet bloc increased, especially in the US. The election of Ronald Reagan asPresident of the United States in 1981 accelerated this process: a state of economic emergency wasdeclared and severe regulation of exports implemented. The overwhelming majority of US actions tostem transfer of technology, however, relates directly to the Soviet Union, and in most documentationthere is barely any mention of East Germany (Weyhrauch, 1986). As the trade embargo against theCommunist bloc intensified, East Germany came to rely increasingly on its industrial espionage. To-ward this end, staff members mapped out all major West German companies, collecting informationin the form of so-called object files, while its officers engaged in systematic recruitment of leadingpersonnel. Most of the sources were male salaried employees, predominantly engineers or employeeswith science degrees, although a number of sources also worked in personnel departments, were busi-nessmen, and a few were even officers at the U.S. Army base in Augsburg (Macrakis, 2008). These
6As a sign of the computer industry’s importance in the SIRA database of collected information discussed in the nextsection, “IBM” is the 30th most common keyword appearing in the data among the 2,000 surveyed. Meanwhile, thekeywords “Microelectronics,” “Software,” “Computer Science,” and “Electronic Data Processing” are in seventh, eight,ninth, and eighteenth place respectively.
5
informers were not necessarily leaders in their field or heads of departments or even scientists. Severalof the most important sources were employees like engineer Dieter Feuerstein (codename “Petermann”)at MBB, who passed on top-secret military plans, Peter Alwardt (codename “Alfred”) at AEG/ Tele-funken, who worked as an engineer, and Peter Köhler (codename “Schulze”), who worked for TexasInstruments.
Meanwhile, Western intelligence activities in East Germany remained by most accounts behindthat of its East German counterpart in recruiting reliable informants, especially so in the economicsectors. Partly, this may have been the result of priorities, topically as well as methodologically,as Western espionage focused disproportionately on political and military – rather than economic –espionage, using signals intelligence more effectively than human intelligence. In addition, the WestGerman foreign intelligence agency (Bundesnachrichtendienst, BND) was heavily compromised bymoles in the early years of the Cold War (Schmidt-Eenboom, 2009). Periodical purges and outrightwitch hunts of suspected traitors cast a wide net of suspicion over the guilty and innocent alike.Furthermore, MfS officials have often boasted of the degree to which the Western intelligence sourcesin East Germany were, in fact, double agents, with one MfS general putting that number at around90 percent (Schmidt-Eenboom, 2009). It is therefore conceivable that, even in the instances whereWestern espionage activities were successful in East Germany, they were unlikely to have been in theeconomic sector, and even more unlikely to be related to substantive technology transfer from theEast to the West. As such the transfer of technologies was overwhelmingly a one-way street. As forWestern intelligence agencies other than the West German BND, these tended to focus most of theirefforts on the Soviet Union rather than East Germany. The CIA’s own former historian, for example,has described the agency’s activities in the country as “deaf, dumb, and blind” (Fischer, 2009).
Despite the documented extent to which the MfS engaged in industrial espionage, some historianshave argued that its scientific-technical intelligence activities were ultimately a failure, as the secretivenature of high-tech espionage clashed with the openness required for successful scientific development(Macrakis, 2008). Additionally, as more and more resources were poured into stealing rather thangenerating technologies, East Germany’s own innovation ultimately suffered. The politically motivatedcharge to achieve world status leadership in computers failed, despite the resources devoted. Yet aslate as 1989, East Germany was also seen by some as “Communism that works” – “the Communistworld’s high-technology leader...its capital goods known for quality workmanship”.7 According toMacrakis (2008), internal estimates by the MfS suggested that its industrial espionage had saved theEast German industry about 75 million marks in R&D costs.
The argument that East German industrial espionage was a failure because it stifled overt R&Dis not necessarily sufficient to conclude that overall economic returns to the former were negative. Inlater sections, we systematically investigate this question and also provide evidence on the extent towhich secret and open R&D are substitutes.
7“East Germany Losing Its Edge”, The New York Times, May 15, 1989, http://www.nytimes.com/1989/05/15/business/east-germany-losing-its-edge.html?pagewanted=all
6
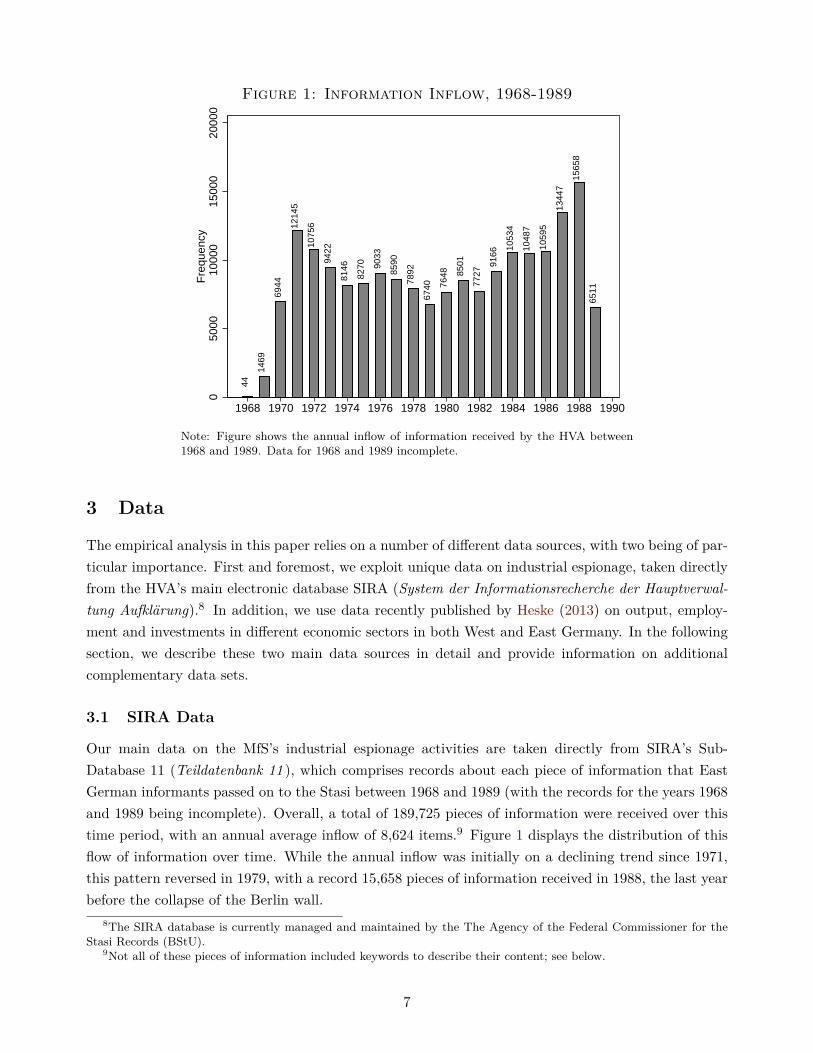
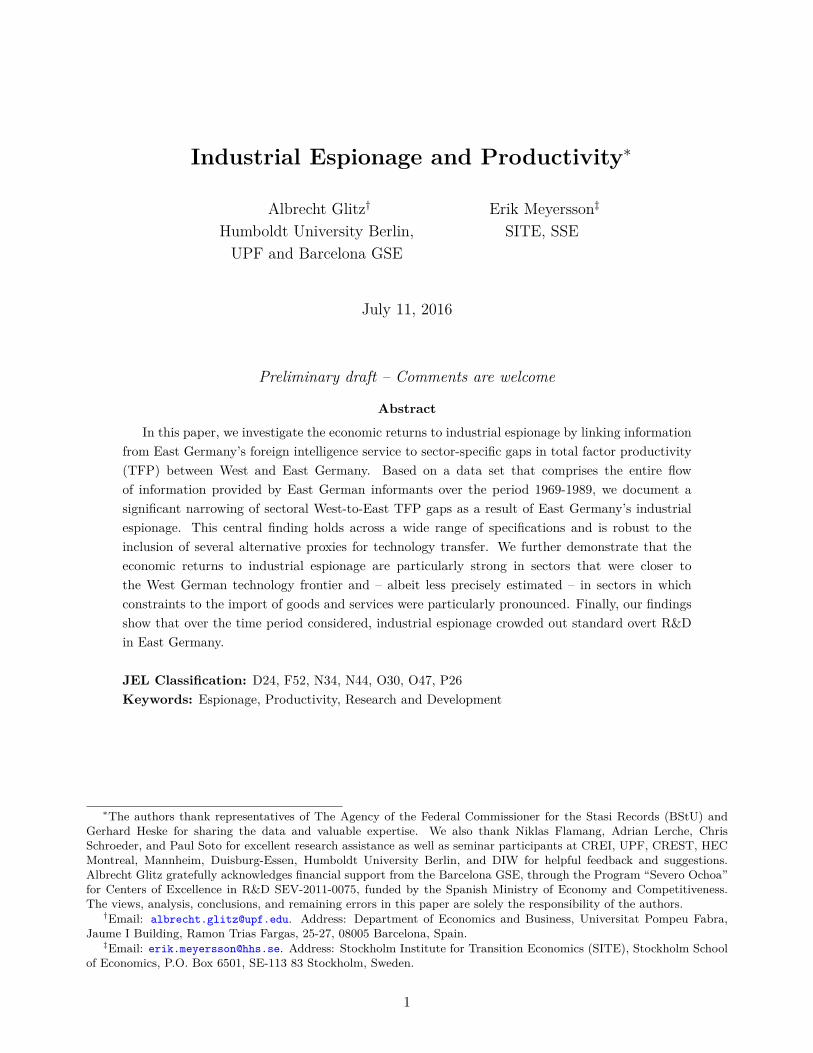
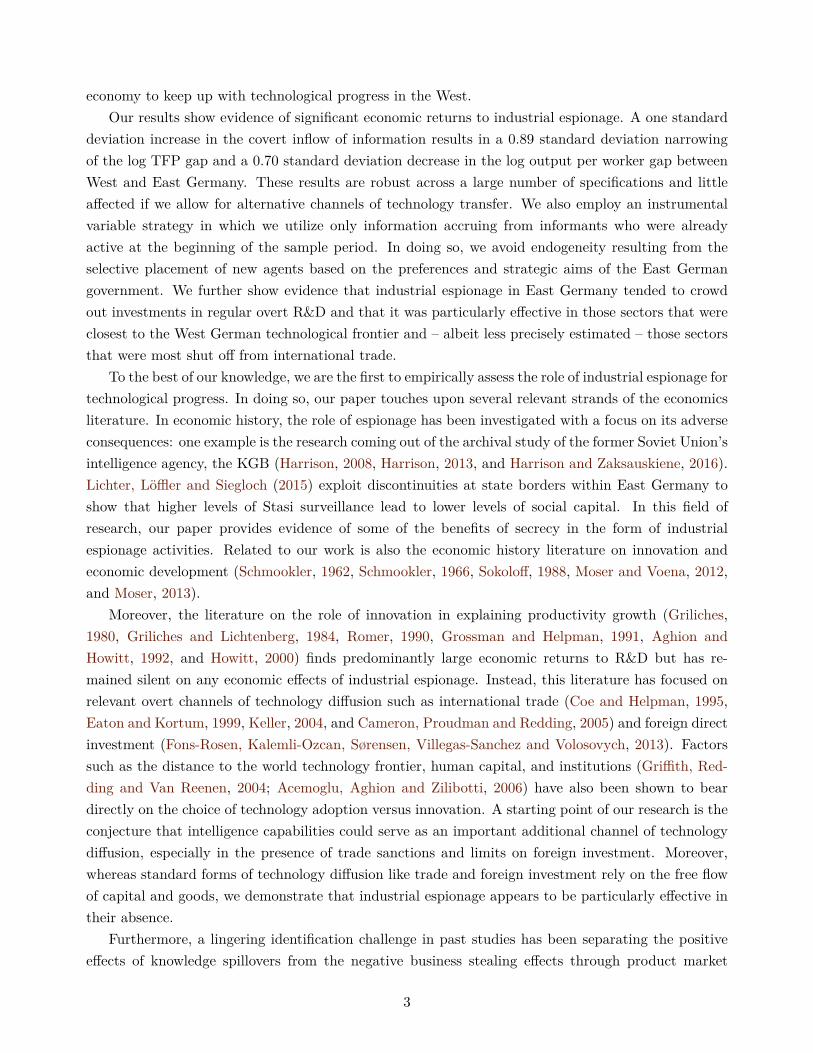
Figure 1: Information Inflow, 1968-1989
44
1469
6944
1214
5
1075
6
9422
8146
8270 90
33
8590
7892
6740 76
48 8501
7727
9166
1053
4
1048
7
1059
5
1344
7
1565
8
6511
050
0010
000
1500
020
000
Fre
quen
cy
1968 1970 1972 1974 1976 1978 1980 1982 1984 1986 1988 1990
Note: Figure shows the annual inflow of information received by the HVA between1968 and 1989. Data for 1968 and 1989 incomplete.
3 Data
The empirical analysis in this paper relies on a number of different data sources, with two being of par-ticular importance. First and foremost, we exploit unique data on industrial espionage, taken directlyfrom the HVA’s main electronic database SIRA (System der Informationsrecherche der Hauptverwal-tung Aufklärung).8 In addition, we use data recently published by Heske (2013) on output, employ-ment and investments in different economic sectors in both West and East Germany. In the followingsection, we describe these two main data sources in detail and provide information on additionalcomplementary data sets.
3.1 SIRA Data
Our main data on the MfS’s industrial espionage activities are taken directly from SIRA’s Sub-Database 11 (Teildatenbank 11 ), which comprises records about each piece of information that EastGerman informants passed on to the Stasi between 1968 and 1989 (with the records for the years 1968and 1989 being incomplete). Overall, a total of 189,725 pieces of information were received over thistime period, with an annual average inflow of 8,624 items.9 Figure 1 displays the distribution of thisflow of information over time. While the annual inflow was initially on a declining trend since 1971,this pattern reversed in 1979, with a record 15,658 pieces of information received in 1988, the last yearbefore the collapse of the Berlin wall.
8The SIRA database is currently managed and maintained by the The Agency of the Federal Commissioner for theStasi Records (BStU).
9Not all of these pieces of information included keywords to describe their content; see below.
7
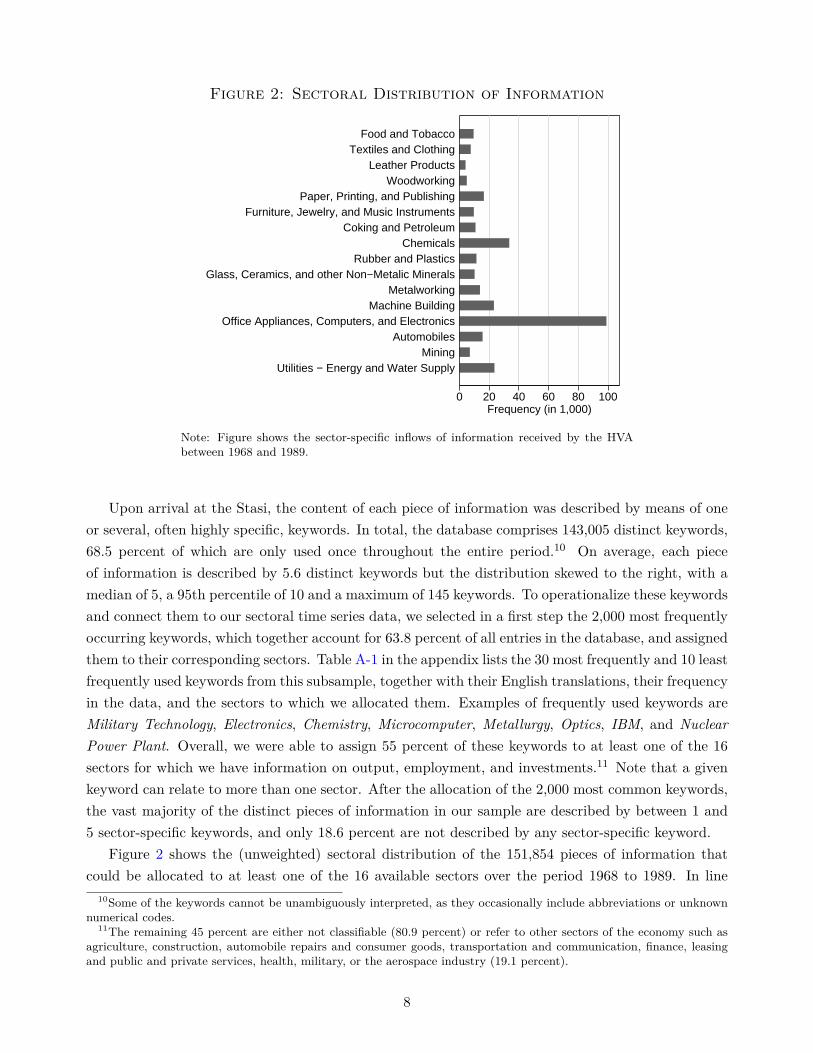
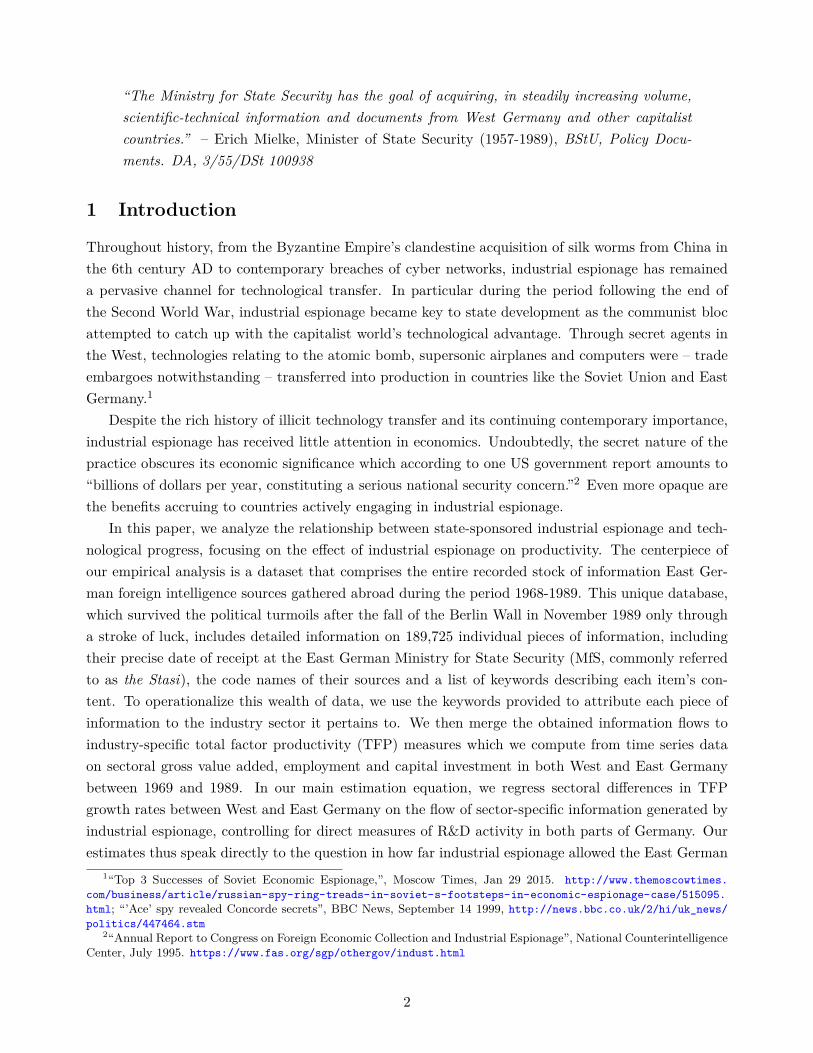
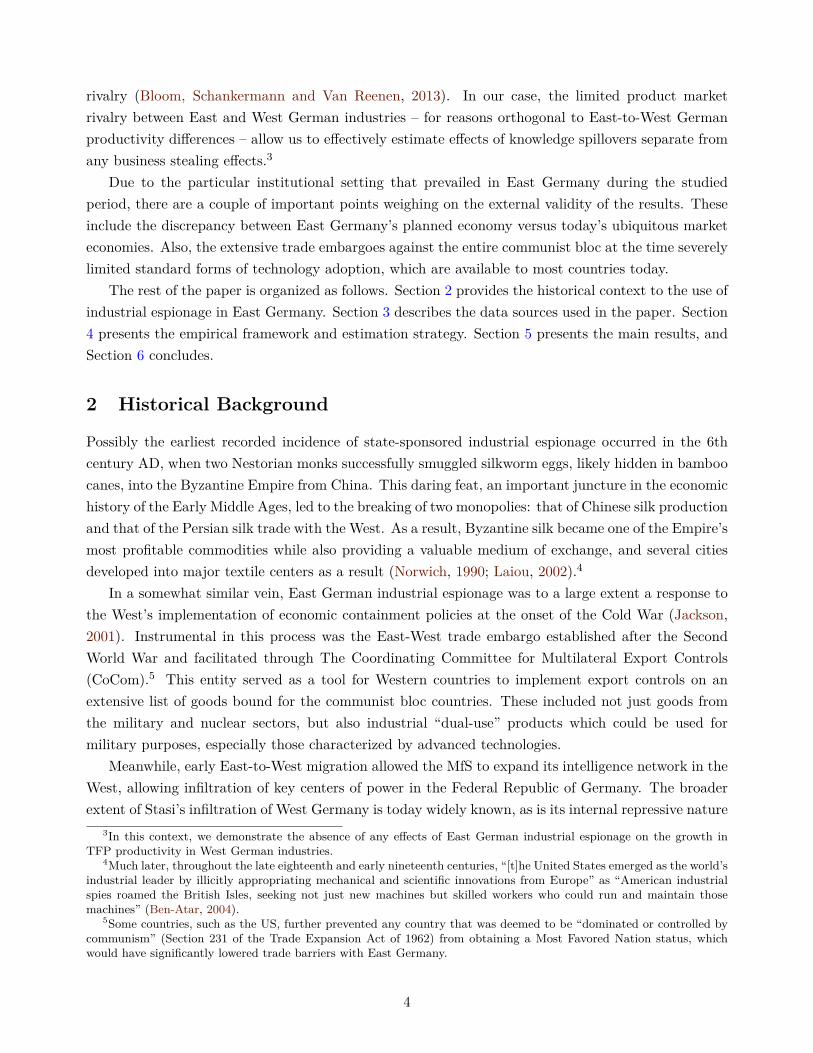
Figure 2: Sectoral Distribution of Information
0 20 40 60 80 100Frequency (in 1,000)
Utilities − Energy and Water SupplyMining
AutomobilesOffice Appliances, Computers, and Electronics
Machine BuildingMetalworking
Glass, Ceramics, and other Non−Metalic MineralsRubber and Plastics
ChemicalsCoking and Petroleum
Furniture, Jewelry, and Music InstrumentsPaper, Printing, and Publishing
WoodworkingLeather Products
Textiles and ClothingFood and Tobacco
Note: Figure shows the sector-specific inflows of information received by the HVAbetween 1968 and 1989.
Upon arrival at the Stasi, the content of each piece of information was described by means of oneor several, often highly specific, keywords. In total, the database comprises 143,005 distinct keywords,68.5 percent of which are only used once throughout the entire period.10 On average, each pieceof information is described by 5.6 distinct keywords but the distribution skewed to the right, with amedian of 5, a 95th percentile of 10 and a maximum of 145 keywords. To operationalize these keywordsand connect them to our sectoral time series data, we selected in a first step the 2,000 most frequentlyoccurring keywords, which together account for 63.8 percent of all entries in the database, and assignedthem to their corresponding sectors. Table A-1 in the appendix lists the 30 most frequently and 10 leastfrequently used keywords from this subsample, together with their English translations, their frequencyin the data, and the sectors to which we allocated them. Examples of frequently used keywords areMilitary Technology, Electronics, Chemistry, Microcomputer, Metallurgy, Optics, IBM, and NuclearPower Plant. Overall, we were able to assign 55 percent of these keywords to at least one of the 16sectors for which we have information on output, employment, and investments.11 Note that a givenkeyword can relate to more than one sector. After the allocation of the 2,000 most common keywords,the vast majority of the distinct pieces of information in our sample are described by between 1 and5 sector-specific keywords, and only 18.6 percent are not described by any sector-specific keyword.
Figure 2 shows the (unweighted) sectoral distribution of the 151,854 pieces of information thatcould be allocated to at least one of the 16 available sectors over the period 1968 to 1989. In line
10Some of the keywords cannot be unambiguously interpreted, as they occasionally include abbreviations or unknownnumerical codes.
11The remaining 45 percent are either not classifiable (80.9 percent) or refer to other sectors of the economy such asagriculture, construction, automobile repairs and consumer goods, transportation and communication, finance, leasingand public and private services, health, military, or the aerospace industry (19.1 percent).
8
with historical accounts, the sector Office Appliances, Computers and Electronics constituted by farthe most important sector for industrial espionage, with 98,886 pieces of related information in total,followed by the sectors Chemicals (33,458), Utilities (23,501) and Machine Building (23,182).
Looking at the providers of these pieces of information, the SIRA database identifies 2,453 distinctinformants based on their assigned code names. Table A-2 in the appendix lists the 20 most productiveof them over the period 1968 to 1989. Informant “FROEBEL”, with registration number XV/6603/80,was the top informant in terms of quantity, delivering 5,344 distinct pieces of information over thistime period, with the first piece received in 1982 and the last in 1989. His overall reliability was ratedas “A”, which meant “reliable” and was awarded in 61.7 percent of all cases (33.6 percent of informantswere assessed as “trustworthy”, and 4.7 percent as “not checked”). However, the listed informantswere certainly an exceptional group in terms of the amount of information they generated. Across theentire distribution of informants, the median and mean inflow of information amounts to only 6 and63 items respectively, reflecting the highly right skewed distribution illustrated in Figure B-1 in theappendix. The information provided by most informants throughout their time in the service of theHVA was thus limited, reflecting the cautious approach by the HVA in handling its sources as wellas the difficulties for most informants to tap into relevant information. Figure B-2 in the appendixdepicts the distribution of the first and last active year in which each informant is observed in the data.The left panel suggests that recruitment of new informants was an ongoing process, with increasedefforts from the mid-1980s onwards. The right panel shows that informants also continuously ceased toprovide further information, the reason of which we cannot ascertain. It is interesting to see, though,that 20.2 percent of informants were still active in the final year of our data, 1989, the year when theBerlin wall came down.
3.2 Industry Level Data
The second key database for our empirical analysis are the sector-specific time series for gross valueadded, total employment, and gross fixed capital investment constructed by Heske (2013). The purposeof this publication was to provide a comparable, retroactive accounting of the development of keyeconomic indicators for different industry sectors in West and East Germany over the time period1950 to 2000. Due to the fundamental differences in economic systems before German unification in1990, with a market-based economy in West Germany pitted against a centrally-planned economy inEast Germany, such computations constituted a challenging task, not least because West and EastGermany followed different national accounting standards throughout the pre-unification period.12
The historical starting point of Heske’s work are the insights gained from the so-called “RetroactiveAccounting Project” (Rückrechnungsprojekt) which the Federal Statistical Office of unified Germanyinitiated in 1991 and whose mission included, besides the collection, protection and documentation ofthe existing statistical data in the former GDR, the retroactive computation of key economic indicators
12While West Germany’s national accounting was based on the nowadays standard “System of National Accounts”(SNA), East Germany applied, together with the Soviet Union and other Eastern Bloc countries, the so-called “MaterialProduct System” (MPS). Only after unification in 1990, the two systems were harmonized by introducing the SNAsystem on the territories of the former GDR. One of the key difference between the two systems is that the MPS, incontrast to the SNA, does not consider public and private services as contributors to an economy’s value added.
9
based on current methodological concepts and taxonomies (Lachnit, 1993). In 2000, this work led toa first publication providing detailed information about the production and expenditure side of GDPin the former GDR between 1970 and 1989, expressed in current East German Mark.13
Heske (2005, 2009, 2013) builds on these initial findings but makes four important contributions.First, he translates all values of output and investment in the GDR into constant Mark with respectto the base year 1985, taking account of the complex issues arising from the qualitative upgrading ofexisting and introduction of new products.14 Second, he converts all values into constant 1995 euros,thus allowing a direct comparison between the economic performance of West and East Germany overtime. A key advantage in this process is the fact that many of the goods produced in the formerGDR were observed both priced in East German Mark and, after the monetary union on 1 July 1990,in West German Deutsche Mark, allowing the computation of differentiated sector-specific conversioncoefficients. Third, Heske extends the time horizon to the earlier period 1950 to 1970, for which theexisting data basis, however, was significantly more limited. Finally, and crucially for our analysis, heconstructs separate time series for specific economic sectors. The depth of the sectoral differentiation isthereby governed by data availability, allowing, in the end, a distinction of three broad industry sectors– mining, energy and water, and manufacturing – and, within manufacturing, a further differentiationof 14 sub-sectors.
Figure B-3 in the appendix shows time series for log gross value added per worker in West andEast Germany by sector between 1969 and 1989. Apart from the utilities sector, the productivity ofworkers in West Germany exceeds that of workers in East Germany, in many sectors, including someof the biggest ones such as Metalworking and Office Appliances, Computers, and Electronics, by asubstantial amount (1.89 and 1.96 log points, respectively, on average over the time period considered).For comparison, we also add the corresponding figures for West Germany calculated on the basis ofthe UNIDO Industrial Statistics Database.
As a subordinate institution, the East German Statistical Office lacked independence from thegovernment and the ruling SED party, which viewed statistical information as a potential tool ofagitation and propaganda. Consequently, the reliability of statistical information in the former GDRhas been subject of extensive and controversial discussions (see, e.g., Statistisches Bundesamt, 1999).In the context of our study, it is therefore important to emphasize, that the sector-specific timeseries data we use are constructed from original primary data sources as well as unpublished internaldocuments of the SZS. Most of these sources and documents were, at the time, labeled as “confidential”and, as internal material, not subject to politically-motivated manipulation, which tended to occurat the final publication stage. Overall, we are therefore confident that these data provide an overallgood reflection of the key economic developments in West and East Germany over the time periodconsidered.15
13Statistisches Bundesamt: Sonderreihe mit Beiträgen für das Gebiet der ehemaligen DDR, Heft 33, Wiesbaden 2000.14A key characteristic of the price formation mechanism in the centrally-planned economy of the former GDR was
the existence of significant differences between the prices set at the production stage, and the prices set at the finalconsumption stage. While producer prices (Industrieabgabepreise) were periodically adjusted to reflect changes in thecosts of production, consumer prices were predominantly set with a view to political and social conditions.
15Two important studies by the Deutsches Institut für Wirtschaftsforschung (DIW, 1987) and the Federal StatisticalOffice (Hölder, 1992) reach a similar conclusion regarding the reliability of the statistical information in the former GDR.
10
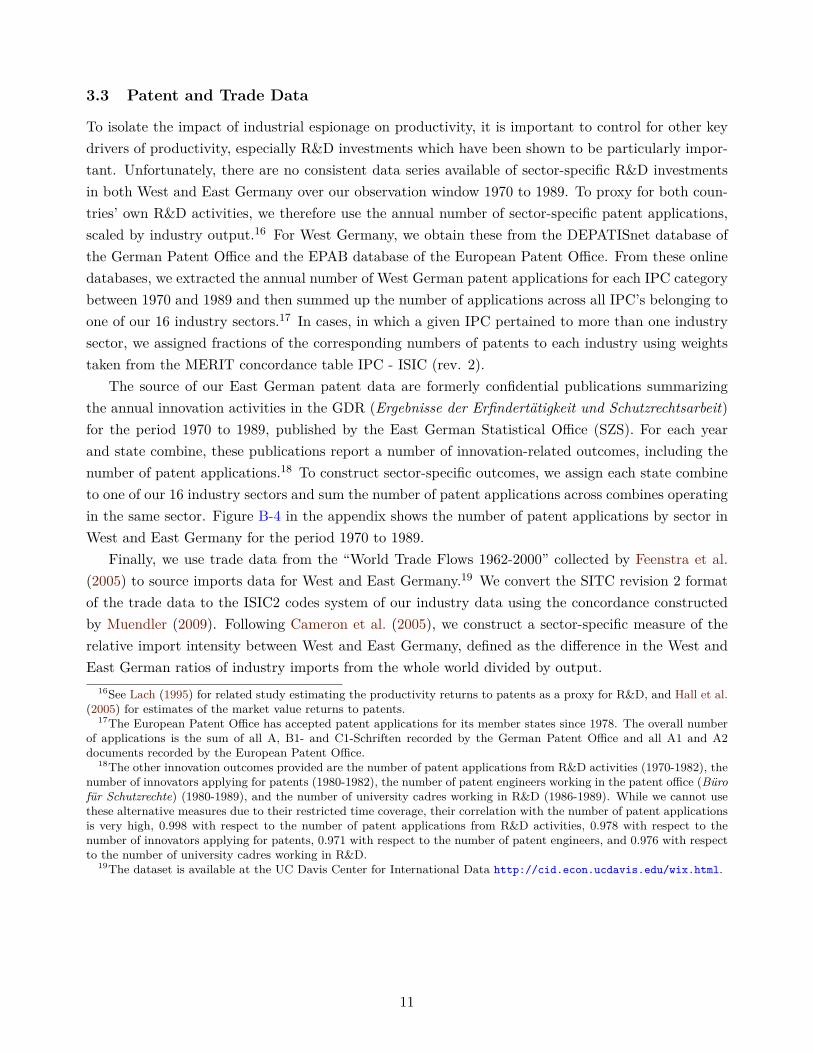
3.3 Patent and Trade Data
To isolate the impact of industrial espionage on productivity, it is important to control for other keydrivers of productivity, especially R&D investments which have been shown to be particularly impor-tant. Unfortunately, there are no consistent data series available of sector-specific R&D investmentsin both West and East Germany over our observation window 1970 to 1989. To proxy for both coun-tries’ own R&D activities, we therefore use the annual number of sector-specific patent applications,scaled by industry output.16 For West Germany, we obtain these from the DEPATISnet database ofthe German Patent Office and the EPAB database of the European Patent Office. From these onlinedatabases, we extracted the annual number of West German patent applications for each IPC categorybetween 1970 and 1989 and then summed up the number of applications across all IPC’s belonging toone of our 16 industry sectors.17 In cases, in which a given IPC pertained to more than one industrysector, we assigned fractions of the corresponding numbers of patents to each industry using weightstaken from the MERIT concordance table IPC - ISIC (rev. 2).
The source of our East German patent data are formerly confidential publications summarizingthe annual innovation activities in the GDR (Ergebnisse der Erfindertätigkeit und Schutzrechtsarbeit)for the period 1970 to 1989, published by the East German Statistical Office (SZS). For each yearand state combine, these publications report a number of innovation-related outcomes, including thenumber of patent applications.18 To construct sector-specific outcomes, we assign each state combineto one of our 16 industry sectors and sum the number of patent applications across combines operatingin the same sector. Figure B-4 in the appendix shows the number of patent applications by sector inWest and East Germany for the period 1970 to 1989.
Finally, we use trade data from the “World Trade Flows 1962-2000” collected by Feenstra et al.(2005) to source imports data for West and East Germany.19 We convert the SITC revision 2 formatof the trade data to the ISIC2 codes system of our industry data using the concordance constructedby Muendler (2009). Following Cameron et al. (2005), we construct a sector-specific measure of therelative import intensity between West and East Germany, defined as the difference in the West andEast German ratios of industry imports from the whole world divided by output.
16See Lach (1995) for related study estimating the productivity returns to patents as a proxy for R&D, and Hall et al.(2005) for estimates of the market value returns to patents.
17The European Patent Office has accepted patent applications for its member states since 1978. The overall numberof applications is the sum of all A, B1- and C1-Schriften recorded by the German Patent Office and all A1 and A2documents recorded by the European Patent Office.
18The other innovation outcomes provided are the number of patent applications from R&D activities (1970-1982), thenumber of innovators applying for patents (1980-1982), the number of patent engineers working in the patent office (Bürofür Schutzrechte) (1980-1989), and the number of university cadres working in R&D (1986-1989). While we cannot usethese alternative measures due to their restricted time coverage, their correlation with the number of patent applicationsis very high, 0.998 with respect to the number of patent applications from R&D activities, 0.978 with respect to thenumber of innovators applying for patents, 0.971 with respect to the number of patent engineers, and 0.976 with respectto the number of university cadres working in R&D.
19The dataset is available at the UC Davis Center for International Data http://cid.econ.ucdavis.edu/wix.html.
11
4 Empirical Framework
4.1 Main Specification
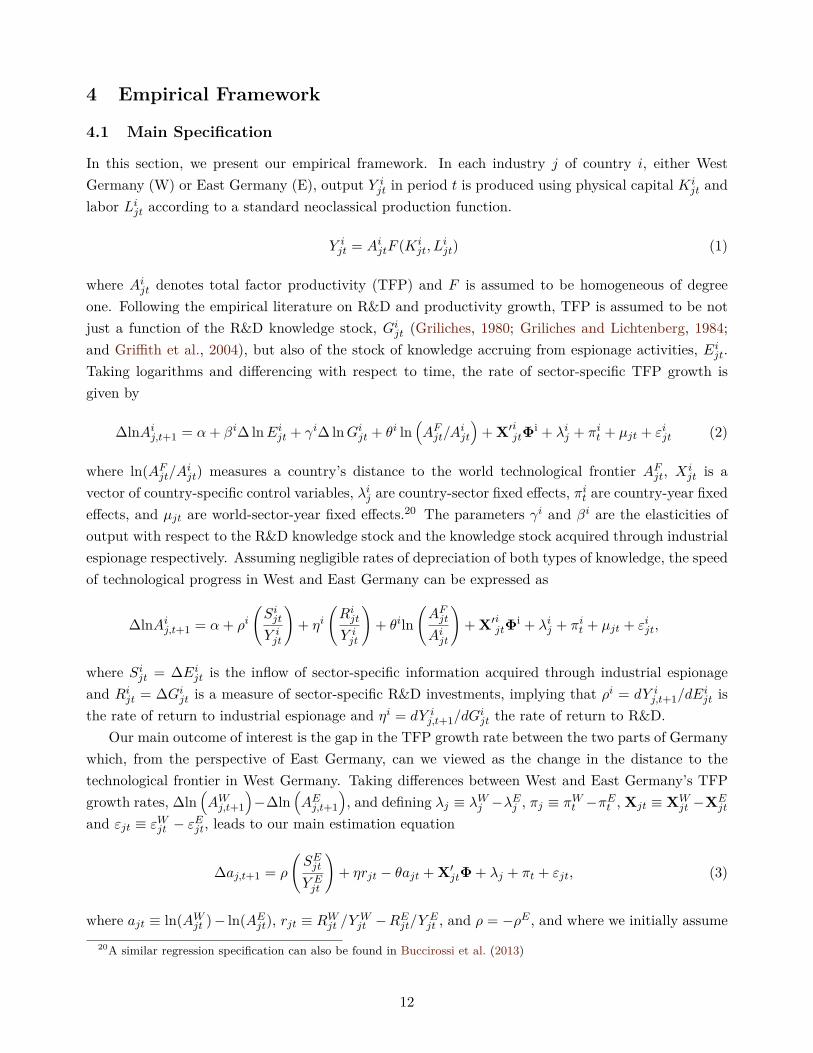
In this section, we present our empirical framework. In each industry j of country i, either WestGermany (W) or East Germany (E), output Y i
jt in period t is produced using physical capital Kijt and
labor Lijt according to a standard neoclassical production function.
Y ijt = AijtF (Ki
jt, Lijt) (1)
where Aijt denotes total factor productivity (TFP) and F is assumed to be homogeneous of degreeone. Following the empirical literature on R&D and productivity growth, TFP is assumed to be notjust a function of the R&D knowledge stock, Gijt (Griliches, 1980; Griliches and Lichtenberg, 1984;and Griffith et al., 2004), but also of the stock of knowledge accruing from espionage activities, Eijt.Taking logarithms and differencing with respect to time, the rate of sector-specific TFP growth isgiven by
∆lnAij,t+1 = α+ βi∆ lnEijt + γi∆ lnGijt + θi ln(AFjt/A
ijt
)+ X′ijtΦi + λij + πit + µjt + εijt (2)
where ln(AFjt/Aijt) measures a country’s distance to the world technological frontier AFjt, Xijt is a
vector of country-specific control variables, λij are country-sector fixed effects, πit are country-year fixedeffects, and µjt are world-sector-year fixed effects.20 The parameters γi and βi are the elasticities ofoutput with respect to the R&D knowledge stock and the knowledge stock acquired through industrialespionage respectively. Assuming negligible rates of depreciation of both types of knowledge, the speedof technological progress in West and East Germany can be expressed as
∆lnAij,t+1 = α+ ρi(SijtY ijt
)+ ηi
(RijtY ijt
)+ θiln
(AFjtAijt
)+ X′ijtΦi + λij + πit + µjt + εijt,
where Sijt = ∆Eijt is the inflow of sector-specific information acquired through industrial espionageand Rijt = ∆Gijt is a measure of sector-specific R&D investments, implying that ρi = dY i
j,t+1/dEijt is
the rate of return to industrial espionage and ηi = dY ij,t+1/dG
ijt the rate of return to R&D.
Our main outcome of interest is the gap in the TFP growth rate between the two parts of Germanywhich, from the perspective of East Germany, can we viewed as the change in the distance to thetechnological frontier in West Germany. Taking differences between West and East Germany’s TFPgrowth rates, ∆ln
(AWj,t+1
)−∆ln
(AEj,t+1
), and defining λj ≡ λWj −λEj , πj ≡ πWt −πEt , Xjt ≡ XW
jt −XEjt
and εjt ≡ εWjt − εEjt, leads to our main estimation equation
∆aj,t+1 = ρ
(SEjtY Ejt
)+ ηrjt − θajt + X′jtΦ + λj + πt + εjt, (3)
where ajt ≡ ln(AWjt ) − ln(AEjt), rjt ≡ RWjt /YWjt −REjt/Y
Ejt , and ρ = −ρE , and where we initially assume
20A similar regression specification can also be found in Buccirossi et al. (2013)
12
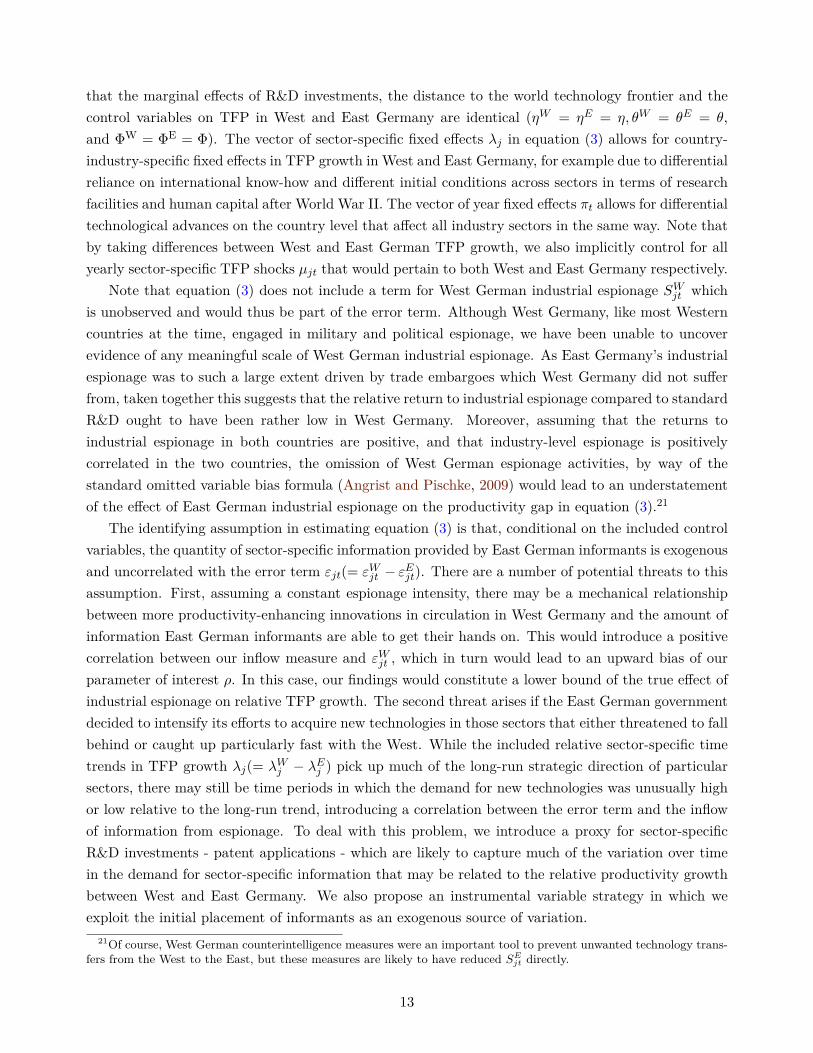
that the marginal effects of R&D investments, the distance to the world technology frontier and thecontrol variables on TFP in West and East Germany are identical (ηW = ηE = η, θW = θE = θ,and ΦW = ΦE = Φ). The vector of sector-specific fixed effects λj in equation (3) allows for country-industry-specific fixed effects in TFP growth in West and East Germany, for example due to differentialreliance on international know-how and different initial conditions across sectors in terms of researchfacilities and human capital after World War II. The vector of year fixed effects πt allows for differentialtechnological advances on the country level that affect all industry sectors in the same way. Note thatby taking differences between West and East German TFP growth, we also implicitly control for allyearly sector-specific TFP shocks µjt that would pertain to both West and East Germany respectively.
Note that equation (3) does not include a term for West German industrial espionage SWjt whichis unobserved and would thus be part of the error term. Although West Germany, like most Westerncountries at the time, engaged in military and political espionage, we have been unable to uncoverevidence of any meaningful scale of West German industrial espionage. As East Germany’s industrialespionage was to such a large extent driven by trade embargoes which West Germany did not sufferfrom, taken together this suggests that the relative return to industrial espionage compared to standardR&D ought to have been rather low in West Germany. Moreover, assuming that the returns toindustrial espionage in both countries are positive, and that industry-level espionage is positivelycorrelated in the two countries, the omission of West German espionage activities, by way of thestandard omitted variable bias formula (Angrist and Pischke, 2009) would lead to an understatementof the effect of East German industrial espionage on the productivity gap in equation (3).21
The identifying assumption in estimating equation (3) is that, conditional on the included controlvariables, the quantity of sector-specific information provided by East German informants is exogenousand uncorrelated with the error term εjt(= εWjt − εEjt). There are a number of potential threats to thisassumption. First, assuming a constant espionage intensity, there may be a mechanical relationshipbetween more productivity-enhancing innovations in circulation in West Germany and the amount ofinformation East German informants are able to get their hands on. This would introduce a positivecorrelation between our inflow measure and εWjt , which in turn would lead to an upward bias of ourparameter of interest ρ. In this case, our findings would constitute a lower bound of the true effect ofindustrial espionage on relative TFP growth. The second threat arises if the East German governmentdecided to intensify its efforts to acquire new technologies in those sectors that either threatened to fallbehind or caught up particularly fast with the West. While the included relative sector-specific timetrends in TFP growth λj(= λWj − λEj ) pick up much of the long-run strategic direction of particularsectors, there may still be time periods in which the demand for new technologies was unusually highor low relative to the long-run trend, introducing a correlation between the error term and the inflowof information from espionage. To deal with this problem, we introduce a proxy for sector-specificR&D investments - patent applications - which are likely to capture much of the variation over timein the demand for sector-specific information that may be related to the relative productivity growthbetween West and East Germany. We also propose an instrumental variable strategy in which weexploit the initial placement of informants as an exogenous source of variation.
21Of course, West German counterintelligence measures were an important tool to prevent unwanted technology trans-fers from the West to the East, but these measures are likely to have reduced SE
jt directly.
13
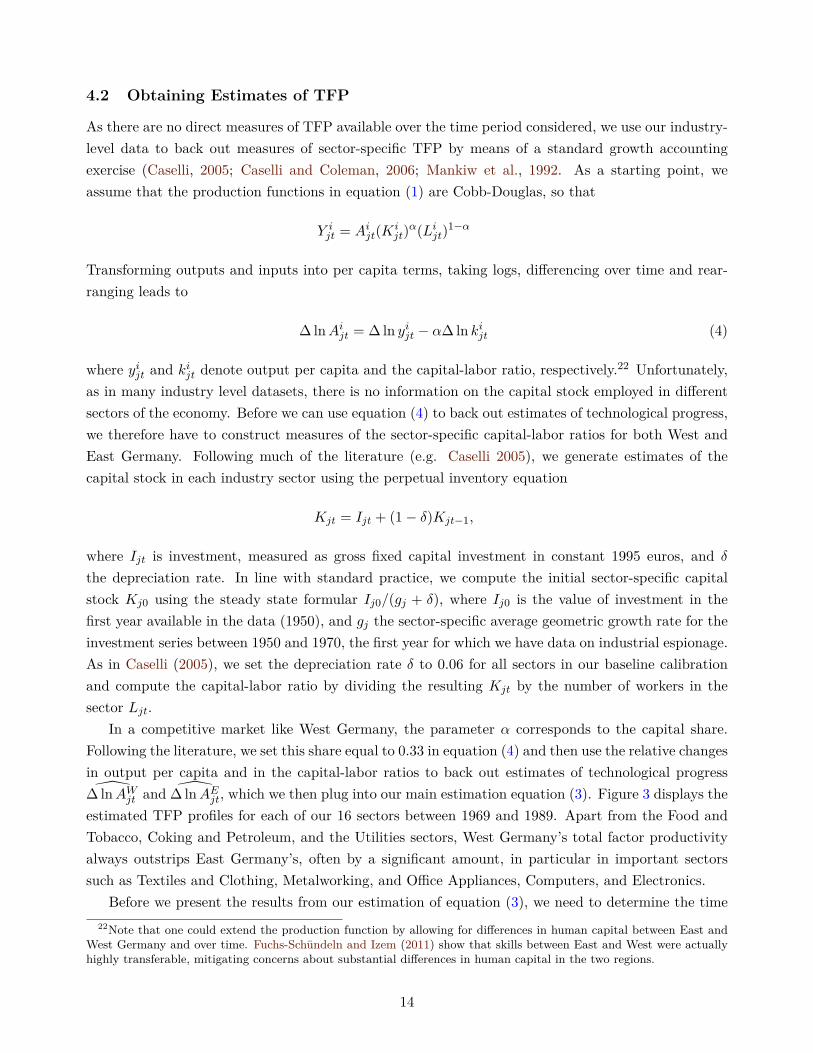
4.2 Obtaining Estimates of TFP
As there are no direct measures of TFP available over the time period considered, we use our industry-level data to back out measures of sector-specific TFP by means of a standard growth accountingexercise (Caselli, 2005; Caselli and Coleman, 2006; Mankiw et al., 1992. As a starting point, weassume that the production functions in equation (1) are Cobb-Douglas, so that
Y ijt = Aijt(Ki
jt)α(Lijt)1−α
Transforming outputs and inputs into per capita terms, taking logs, differencing over time and rear-ranging leads to
∆ lnAijt = ∆ ln yijt − α∆ ln kijt (4)
where yijt and kijt denote output per capita and the capital-labor ratio, respectively.22 Unfortunately,as in many industry level datasets, there is no information on the capital stock employed in differentsectors of the economy. Before we can use equation (4) to back out estimates of technological progress,we therefore have to construct measures of the sector-specific capital-labor ratios for both West andEast Germany. Following much of the literature (e.g. Caselli 2005), we generate estimates of thecapital stock in each industry sector using the perpetual inventory equation
Kjt = Ijt + (1 − δ)Kjt−1,
where Ijt is investment, measured as gross fixed capital investment in constant 1995 euros, and δ
the depreciation rate. In line with standard practice, we compute the initial sector-specific capitalstock Kj0 using the steady state formular Ij0/(gj + δ), where Ij0 is the value of investment in thefirst year available in the data (1950), and gj the sector-specific average geometric growth rate for theinvestment series between 1950 and 1970, the first year for which we have data on industrial espionage.As in Caselli (2005), we set the depreciation rate δ to 0.06 for all sectors in our baseline calibrationand compute the capital-labor ratio by dividing the resulting Kjt by the number of workers in thesector Ljt.
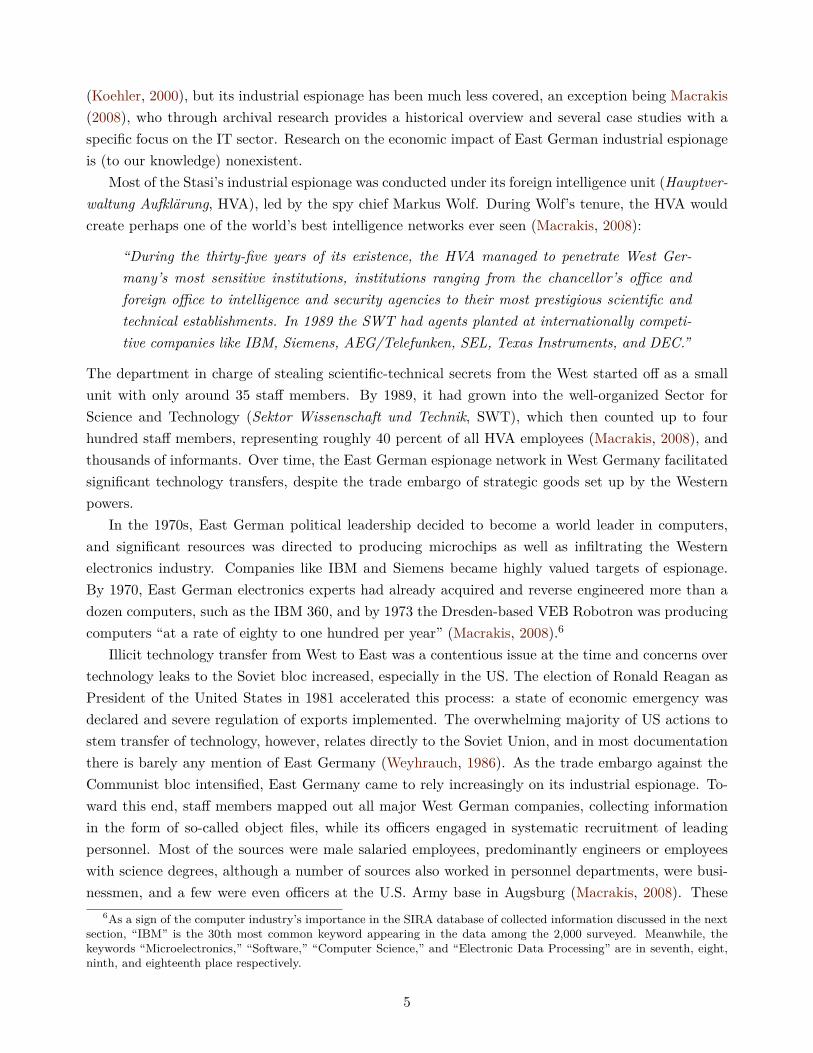
In a competitive market like West Germany, the parameter α corresponds to the capital share.Following the literature, we set this share equal to 0.33 in equation (4) and then use the relative changesin output per capita and in the capital-labor ratios to back out estimates of technological progress∆̂ lnAWjt and ∆̂ lnAEjt, which we then plug into our main estimation equation (3). Figure 3 displays theestimated TFP profiles for each of our 16 sectors between 1969 and 1989. Apart from the Food andTobacco, Coking and Petroleum, and the Utilities sectors, West Germany’s total factor productivityalways outstrips East Germany’s, often by a significant amount, in particular in important sectorssuch as Textiles and Clothing, Metalworking, and Office Appliances, Computers, and Electronics.
Before we present the results from our estimation of equation (3), we need to determine the time22Note that one could extend the production function by allowing for differences in human capital between East and
West Germany and over time. Fuchs-Schündeln and Izem (2011) show that skills between East and West were actuallyhighly transferable, mitigating concerns about substantial differences in human capital in the two regions.
14
intervals over which we construct the sector-specific changes in log TFP and corresponding inflowsof information and investments in R&D. Even though annual data are available, we believe it isreasonable to consider longer first differences in the context of this study, since it is unlikely thatthe arrival of new information about West German technology would be translated into measurablechanges in East German productivity within a single year. Our main specification will thereforerelate changes in TFP gaps over a three-year period (so between t and t+3) to the cumulative inflowof information from industrial espionage and number of patent applications over the previous threeyears (so between t-3 and t) as the main regressors of interest, both scaled by the sector-specificoutput in period t.23 To exploit the available data as efficiently as possible, and to avoid arbitrarinessin choosing specific start and end dates, we use overlapping observations in our main specificationand cluster the standard errors to account for the mechanically introduced serial correlation acrossoverlapping observations. We present both conventional standard errors clustered at the sectoral leveland p-values calculated using the wild cluster bootstrap method proposed by Cameron, Gelbach andMiller (2008), which represents an important inference improvement when the number of clusters, asin our case, is relatively low. Similar to Griffith et al. (2004), we weight the regressions by the averagenumber of workers in each sector over the sample period. For robustness, we also present resultsusing non-overlapping observations, as well as unweighted specifications and specifications in whichwe weight observations by the average output in each sectors.
23Results based on annual observations are consistent with our main findings and highly significant, but smaller inmagnitude.
15
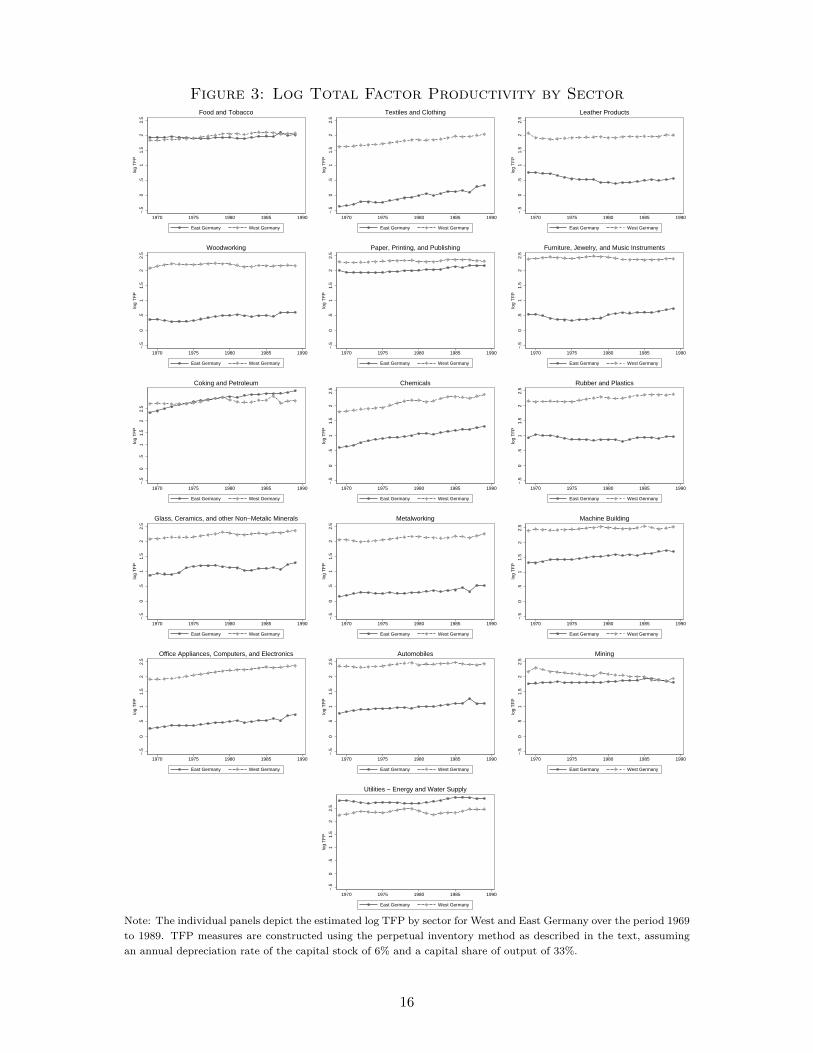
Figure 3: Log Total Factor Productivity by Sector
−.5
0.5
11.
52
2.5
log
TF
P
1970 1975 1980 1985 1990
East Germany West Germany
Food and Tobacco
−.5
0.5
11.
52
2.5
log
TF
P
1970 1975 1980 1985 1990
East Germany West Germany
Textiles and Clothing
−.5
0.5
11.
52
2.5
log
TF
P
1970 1975 1980 1985 1990
East Germany West Germany
Leather Products
−.5
0.5
11.
52
2.5
log
TF
P
1970 1975 1980 1985 1990
East Germany West Germany
Woodworking
−.5
0.5
11.
52
2.5
log
TF
P
1970 1975 1980 1985 1990
East Germany West Germany
Paper, Printing, and Publishing
−.5
0.5
11.
52
2.5
log
TF
P
1970 1975 1980 1985 1990
East Germany West Germany
Furniture, Jewelry, and Music Instruments
−.5
0.5
11.
52
2.5
log
TF
P
1970 1975 1980 1985 1990
East Germany West Germany
Coking and Petroleum
−.5
0.5
11.
52
2.5
log
TF
P
1970 1975 1980 1985 1990
East Germany West Germany
Chemicals
−.5
0.5
11.
52
2.5
log
TF
P
1970 1975 1980 1985 1990
East Germany West Germany
Rubber and Plastics
−.5
0.5
11.
52
2.5
log
TF
P
1970 1975 1980 1985 1990
East Germany West Germany
Glass, Ceramics, and other Non−Metalic Minerals
−.5
0.5
11.
52
2.5
log
TF
P
1970 1975 1980 1985 1990
East Germany West Germany
Metalworking−
.50
.51
1.5
22.
5
log
TF
P
1970 1975 1980 1985 1990
East Germany West Germany
Machine Building
−.5
0.5
11.
52
2.5
log
TF
P
1970 1975 1980 1985 1990
East Germany West Germany
Office Appliances, Computers, and Electronics
−.5
0.5
11.
52
2.5
log
TF
P
1970 1975 1980 1985 1990
East Germany West Germany
Automobiles
−.5
0.5
11.
52
2.5
log
TF
P
1970 1975 1980 1985 1990
East Germany West Germany
Mining
−.5
0.5
11.
52
2.5
log
TF
P
1970 1975 1980 1985 1990
East Germany West Germany
Utilities − Energy and Water Supply
Note: The individual panels depict the estimated log TFP by sector for West and East Germany over the period 1969to 1989. TFP measures are constructed using the perpetual inventory method as described in the text, assumingan annual depreciation rate of the capital stock of 6% and a capital share of output of 33%.
16
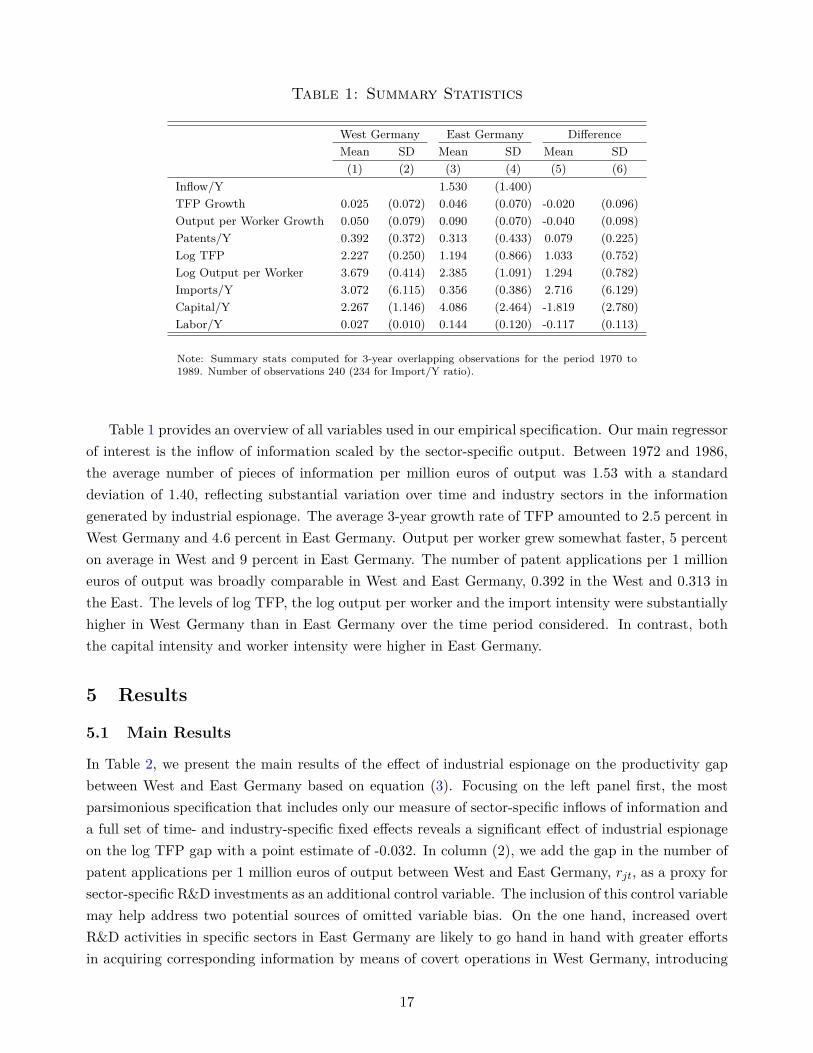
Table 1: Summary Statistics
West Germany East Germany DifferenceMean SD Mean SD Mean SD(1) (2) (3) (4) (5) (6)
Inflow/Y 1.530 (1.400)TFP Growth 0.025 (0.072) 0.046 (0.070) -0.020 (0.096)Output per Worker Growth 0.050 (0.079) 0.090 (0.070) -0.040 (0.098)Patents/Y 0.392 (0.372) 0.313 (0.433) 0.079 (0.225)Log TFP 2.227 (0.250) 1.194 (0.866) 1.033 (0.752)Log Output per Worker 3.679 (0.414) 2.385 (1.091) 1.294 (0.782)Imports/Y 3.072 (6.115) 0.356 (0.386) 2.716 (6.129)Capital/Y 2.267 (1.146) 4.086 (2.464) -1.819 (2.780)Labor/Y 0.027 (0.010) 0.144 (0.120) -0.117 (0.113)
Note: Summary stats computed for 3-year overlapping observations for the period 1970 to1989. Number of observations 240 (234 for Import/Y ratio).
Table 1 provides an overview of all variables used in our empirical specification. Our main regressorof interest is the inflow of information scaled by the sector-specific output. Between 1972 and 1986,the average number of pieces of information per million euros of output was 1.53 with a standarddeviation of 1.40, reflecting substantial variation over time and industry sectors in the informationgenerated by industrial espionage. The average 3-year growth rate of TFP amounted to 2.5 percent inWest Germany and 4.6 percent in East Germany. Output per worker grew somewhat faster, 5 percenton average in West and 9 percent in East Germany. The number of patent applications per 1 millioneuros of output was broadly comparable in West and East Germany, 0.392 in the West and 0.313 inthe East. The levels of log TFP, the log output per worker and the import intensity were substantiallyhigher in West Germany than in East Germany over the time period considered. In contrast, boththe capital intensity and worker intensity were higher in East Germany.
5 Results
5.1 Main Results
In Table 2, we present the main results of the effect of industrial espionage on the productivity gapbetween West and East Germany based on equation (3). Focusing on the left panel first, the mostparsimonious specification that includes only our measure of sector-specific inflows of information anda full set of time- and industry-specific fixed effects reveals a significant effect of industrial espionageon the log TFP gap with a point estimate of -0.032. In column (2), we add the gap in the number ofpatent applications per 1 million euros of output between West and East Germany, rjt, as a proxy forsector-specific R&D investments as an additional control variable. The inclusion of this control variablemay help address two potential sources of omitted variable bias. On the one hand, increased overtR&D activities in specific sectors in East Germany are likely to go hand in hand with greater effortsin acquiring corresponding information by means of covert operations in West Germany, introducing
17
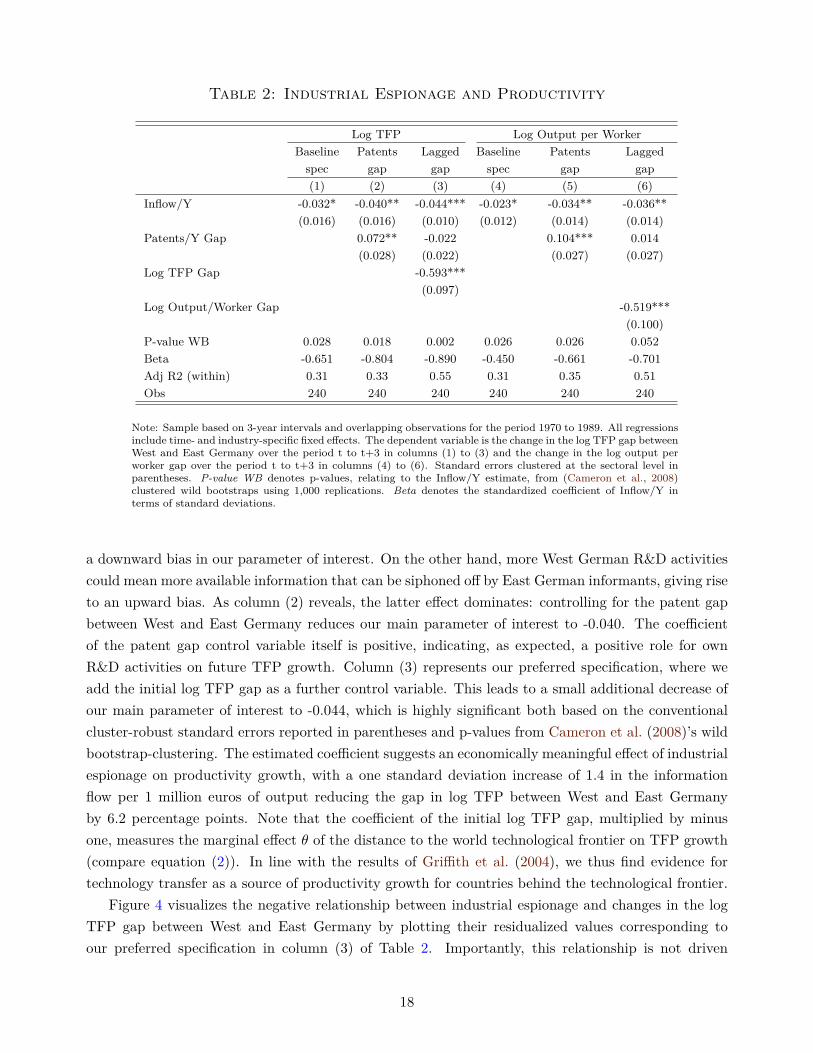
Table 2: Industrial Espionage and Productivity
Log TFP Log Output per WorkerBaseline Patents Lagged Baseline Patents Laggedspec gap gap spec gap gap(1) (2) (3) (4) (5) (6)
Inflow/Y -0.032* -0.040** -0.044*** -0.023* -0.034** -0.036**(0.016) (0.016) (0.010) (0.012) (0.014) (0.014)
Patents/Y Gap 0.072** -0.022 0.104*** 0.014(0.028) (0.022) (0.027) (0.027)
Log TFP Gap -0.593***(0.097)
Log Output/Worker Gap -0.519***(0.100)
P-value WB 0.028 0.018 0.002 0.026 0.026 0.052Beta -0.651 -0.804 -0.890 -0.450 -0.661 -0.701Adj R2 (within) 0.31 0.33 0.55 0.31 0.35 0.51Obs 240 240 240 240 240 240
Note: Sample based on 3-year intervals and overlapping observations for the period 1970 to 1989. All regressionsinclude time- and industry-specific fixed effects. The dependent variable is the change in the log TFP gap betweenWest and East Germany over the period t to t+3 in columns (1) to (3) and the change in the log output perworker gap over the period t to t+3 in columns (4) to (6). Standard errors clustered at the sectoral level inparentheses. P-value WB denotes p-values, relating to the Inflow/Y estimate, from (Cameron et al., 2008)clustered wild bootstraps using 1,000 replications. Beta denotes the standardized coefficient of Inflow/Y interms of standard deviations.
a downward bias in our parameter of interest. On the other hand, more West German R&D activitiescould mean more available information that can be siphoned off by East German informants, giving riseto an upward bias. As column (2) reveals, the latter effect dominates: controlling for the patent gapbetween West and East Germany reduces our main parameter of interest to -0.040. The coefficientof the patent gap control variable itself is positive, indicating, as expected, a positive role for ownR&D activities on future TFP growth. Column (3) represents our preferred specification, where weadd the initial log TFP gap as a further control variable. This leads to a small additional decrease ofour main parameter of interest to -0.044, which is highly significant both based on the conventionalcluster-robust standard errors reported in parentheses and p-values from Cameron et al. (2008)’s wildbootstrap-clustering. The estimated coefficient suggests an economically meaningful effect of industrialespionage on productivity growth, with a one standard deviation increase of 1.4 in the informationflow per 1 million euros of output reducing the gap in log TFP between West and East Germanyby 6.2 percentage points. Note that the coefficient of the initial log TFP gap, multiplied by minusone, measures the marginal effect θ of the distance to the world technological frontier on TFP growth(compare equation (2)). In line with the results of Griffith et al. (2004), we thus find evidence fortechnology transfer as a source of productivity growth for countries behind the technological frontier.
Figure 4 visualizes the negative relationship between industrial espionage and changes in the logTFP gap between West and East Germany by plotting their residualized values corresponding toour preferred specification in column (3) of Table 2. Importantly, this relationship is not driven
18
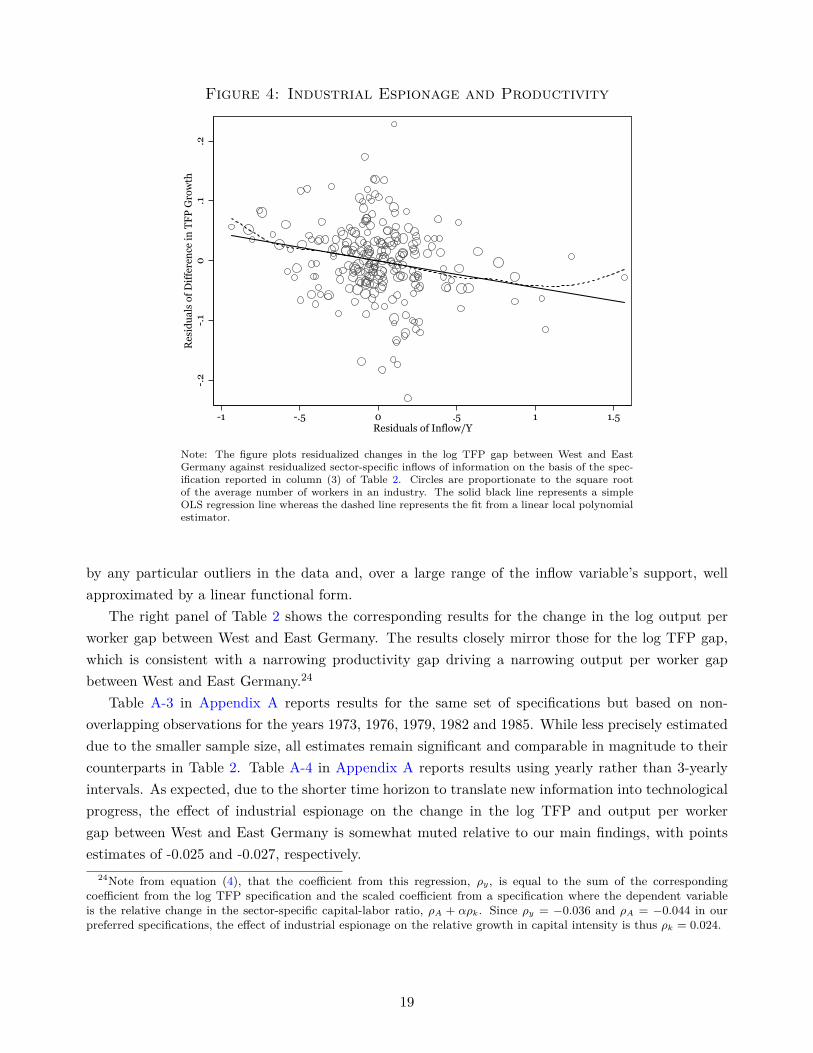
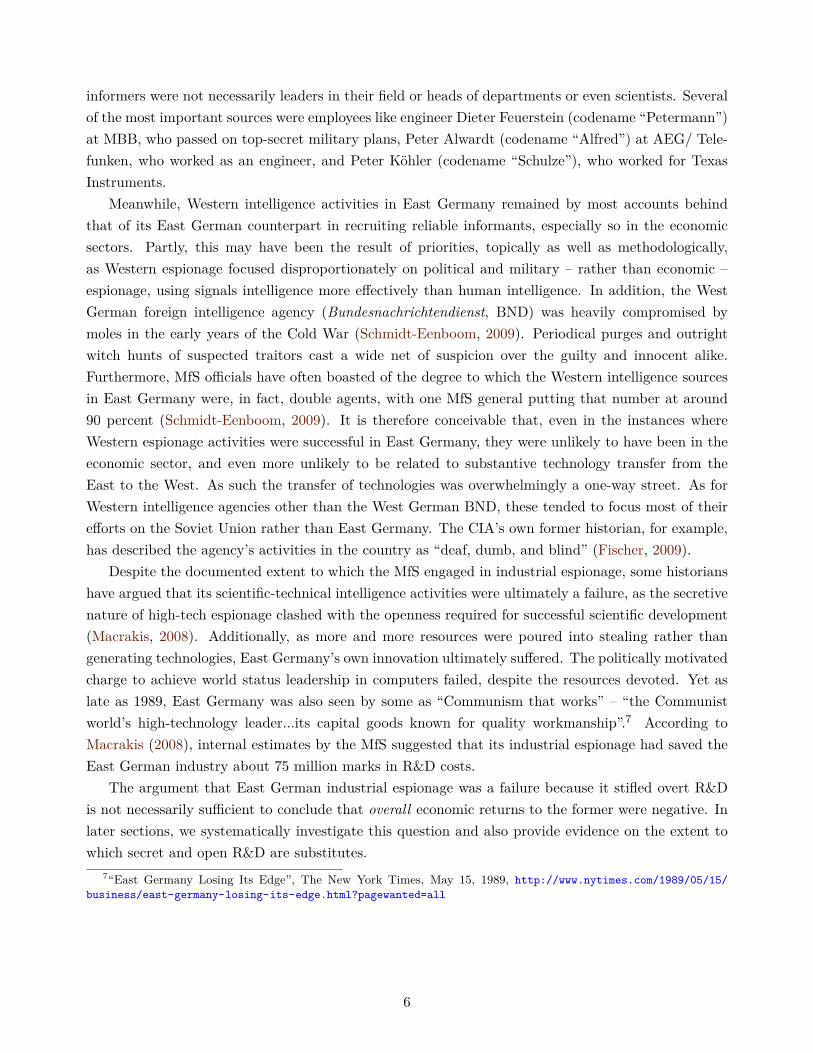
Figure 4: Industrial Espionage and Productivity
.2
.1
0.1
.2R
esi
du
als
of
Dif
fere
nce
in
TF
P G
row
th
1 .5 0 .5 1 1.5Residuals of Inflow/Y
Note: The figure plots residualized changes in the log TFP gap between West and EastGermany against residualized sector-specific inflows of information on the basis of the spec-ification reported in column (3) of Table 2. Circles are proportionate to the square rootof the average number of workers in an industry. The solid black line represents a simpleOLS regression line whereas the dashed line represents the fit from a linear local polynomialestimator.
by any particular outliers in the data and, over a large range of the inflow variable’s support, wellapproximated by a linear functional form.
The right panel of Table 2 shows the corresponding results for the change in the log output perworker gap between West and East Germany. The results closely mirror those for the log TFP gap,which is consistent with a narrowing productivity gap driving a narrowing output per worker gapbetween West and East Germany.24
Table A-3 in Appendix A reports results for the same set of specifications but based on non-overlapping observations for the years 1973, 1976, 1979, 1982 and 1985. While less precisely estimateddue to the smaller sample size, all estimates remain significant and comparable in magnitude to theircounterparts in Table 2. Table A-4 in Appendix A reports results using yearly rather than 3-yearlyintervals. As expected, due to the shorter time horizon to translate new information into technologicalprogress, the effect of industrial espionage on the change in the log TFP and output per workergap between West and East Germany is somewhat muted relative to our main findings, with pointsestimates of -0.025 and -0.027, respectively.
24Note from equation (4), that the coefficient from this regression, ρy, is equal to the sum of the correspondingcoefficient from the log TFP specification and the scaled coefficient from a specification where the dependent variableis the relative change in the sector-specific capital-labor ratio, ρA + αρk. Since ρy = −0.036 and ρA = −0.044 in ourpreferred specifications, the effect of industrial espionage on the relative growth in capital intensity is thus ρk = 0.024.
19
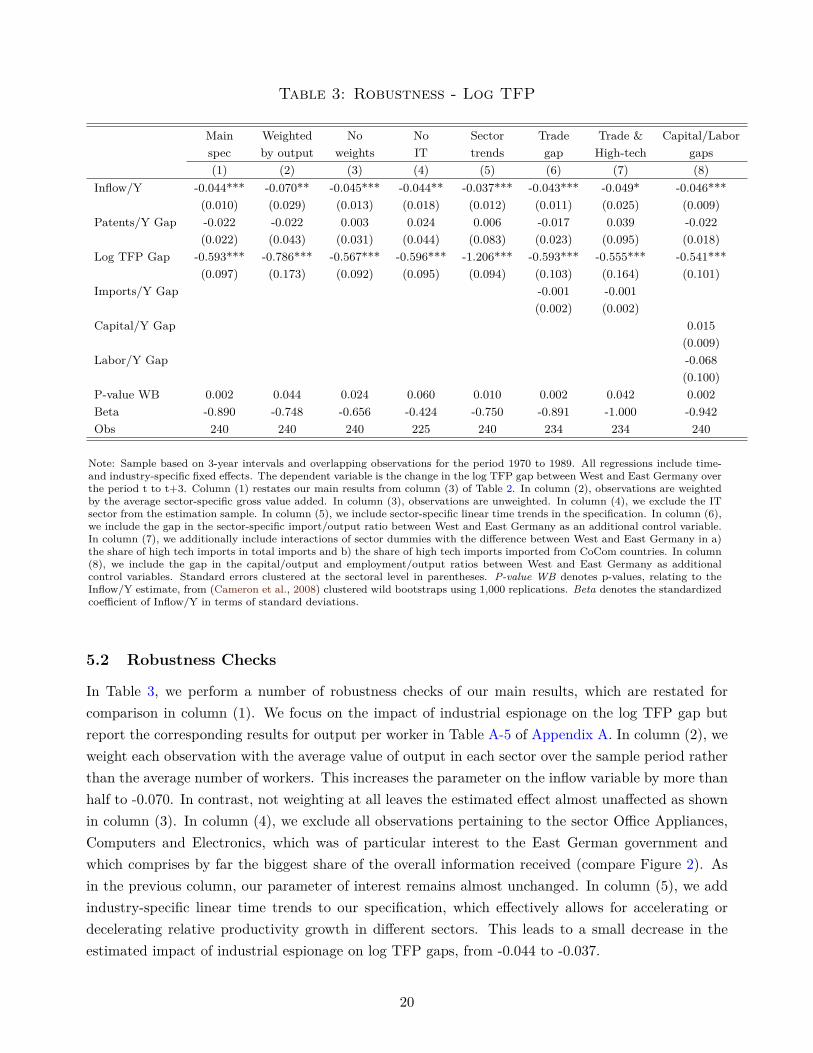
Table 3: Robustness - Log TFP
Main Weighted No No Sector Trade Trade & Capital/Laborspec by output weights IT trends gap High-tech gaps(1) (2) (3) (4) (5) (6) (7) (8)
Inflow/Y -0.044*** -0.070** -0.045*** -0.044** -0.037*** -0.043*** -0.049* -0.046***(0.010) (0.029) (0.013) (0.018) (0.012) (0.011) (0.025) (0.009)
Patents/Y Gap -0.022 -0.022 0.003 0.024 0.006 -0.017 0.039 -0.022(0.022) (0.043) (0.031) (0.044) (0.083) (0.023) (0.095) (0.018)
Log TFP Gap -0.593*** -0.786*** -0.567*** -0.596*** -1.206*** -0.593*** -0.555*** -0.541***(0.097) (0.173) (0.092) (0.095) (0.094) (0.103) (0.164) (0.101)
Imports/Y Gap -0.001 -0.001(0.002) (0.002)
Capital/Y Gap 0.015(0.009)
Labor/Y Gap -0.068(0.100)
P-value WB 0.002 0.044 0.024 0.060 0.010 0.002 0.042 0.002Beta -0.890 -0.748 -0.656 -0.424 -0.750 -0.891 -1.000 -0.942Obs 240 240 240 225 240 234 234 240
Note: Sample based on 3-year intervals and overlapping observations for the period 1970 to 1989. All regressions include time-and industry-specific fixed effects. The dependent variable is the change in the log TFP gap between West and East Germany overthe period t to t+3. Column (1) restates our main results from column (3) of Table 2. In column (2), observations are weightedby the average sector-specific gross value added. In column (3), observations are unweighted. In column (4), we exclude the ITsector from the estimation sample. In column (5), we include sector-specific linear time trends in the specification. In column (6),we include the gap in the sector-specific import/output ratio between West and East Germany as an additional control variable.In column (7), we additionally include interactions of sector dummies with the difference between West and East Germany in a)the share of high tech imports in total imports and b) the share of high tech imports imported from CoCom countries. In column(8), we include the gap in the capital/output and employment/output ratios between West and East Germany as additionalcontrol variables. Standard errors clustered at the sectoral level in parentheses. P-value WB denotes p-values, relating to theInflow/Y estimate, from (Cameron et al., 2008) clustered wild bootstraps using 1,000 replications. Beta denotes the standardizedcoefficient of Inflow/Y in terms of standard deviations.
5.2 Robustness Checks
In Table 3, we perform a number of robustness checks of our main results, which are restated forcomparison in column (1). We focus on the impact of industrial espionage on the log TFP gap butreport the corresponding results for output per worker in Table A-5 of Appendix A. In column (2), weweight each observation with the average value of output in each sector over the sample period ratherthan the average number of workers. This increases the parameter on the inflow variable by more thanhalf to -0.070. In contrast, not weighting at all leaves the estimated effect almost unaffected as shownin column (3). In column (4), we exclude all observations pertaining to the sector Office Appliances,Computers and Electronics, which was of particular interest to the East German government andwhich comprises by far the biggest share of the overall information received (compare Figure 2). Asin the previous column, our parameter of interest remains almost unchanged. In column (5), we addindustry-specific linear time trends to our specification, which effectively allows for accelerating ordecelerating relative productivity growth in different sectors. This leads to a small decrease in theestimated impact of industrial espionage on log TFP gaps, from -0.044 to -0.037.
20
To account for the impact of international trade on productivity growth, we first add the gap insector-specific import intensities between West and East Germany as a control variable in column(6).25 In column (7), we additionally include interactions of industry dummies with the West-Eastdifference in a) the share of high-technology imports in total imports and b) the fraction of high-technology imports imported from CoCom countries.26 These interactions serve as additional controlsfor potential technology transfers through trade by allowing East (relative to West) Germany’s abilityto import advanced technologies to have a differential effect on different industries over time.27 Theinclusion of these trade-related controls has overall little impact on the effect of information inflowsfrom industrial espionage on changes in the log TFP gaps. Finally, in column (8), we include the West-to-East gaps in capital and labor intensities to the estimation equation with once more negligible effectson our parameter of interest. Overall, Table 3 and Table A-5 reveal our main findings to be highlyrobust to alternative sets of control variables and specifications.
5.3 Instrumental Variables
One potential concern with our analysis thus far is that the results could be confounded by time-varying state-led economic priorities that jointly affect the intensity of industrial espionage and theefforts to close productivity gaps with West Germany in particular industries. By exploiting variationaround sector-specific linear trends in productivity growth, which are absorbed by the sector fixedeffects λj , and additionally controlling directly for the gap in the number of patent applications asa proxy for R&D investments, we already expect to capture much of the East German government’schanging preferences for certain sectors over time. Another way to deal with this issue is to assumethat informants already active at the beginning of the sample period in 1970 as well as their differentialaccess to information across different sectors are exogenous to this type of time-varying preferences.
In Table 4, we exploit this idea and instrument the inflow of information received between period t-3and period t with the inflow of information received from informants who already provided informationat the beginning of the sample period in 1970. More specifically, let θi,70 be the share of the totalinformation received in 1970 that was sent by informant i, and let λij,70 be the fraction of thatinformation pertaining to sector j. In the spirit of a classical shift-share analysis, the instrument isthen constructed as
∑i∈1970 θi,70λij,70It, where It is the total inflow in period t received from sources
who were already active in 1970. In the absence of any sector-specific demand shocks for information,one would expect this inflow to be, in terms of content, related to different industries according tothe initial placement of the original sources across these industries (as captured by λij,70) and theirrelative effectiveness in generating information (as captured by θi,70).
Columns (2) and (5) of Table 4 show the first stage results from the instrumental variable estimation25Note that while the point estimate of the import gap variable is close to zero and not significant in the reported
specification, if one excludes the initial log TFP gap, it increases to a highly significant 0.005 (0.001), suggesting aproductivity-enhancing role from international trade.
26The CoCom signatory countries are Australia, Belgium, Canada, Denmark, France, Germany, Greece, Italy, Japan,Luxembourg, Netherlands, Norway, Portugal, Spain, Turkey, the United Kingdom and the United States. See alsoSection 2.
27A key concern underlying the CoCom-imposed embargo was the use of dual-purpose technologies, i.e. technologiesthat could be used in multiple industries. The products that are counted as “high-technology” are given by the SITCcodes provided in Gibbons (1979).
21
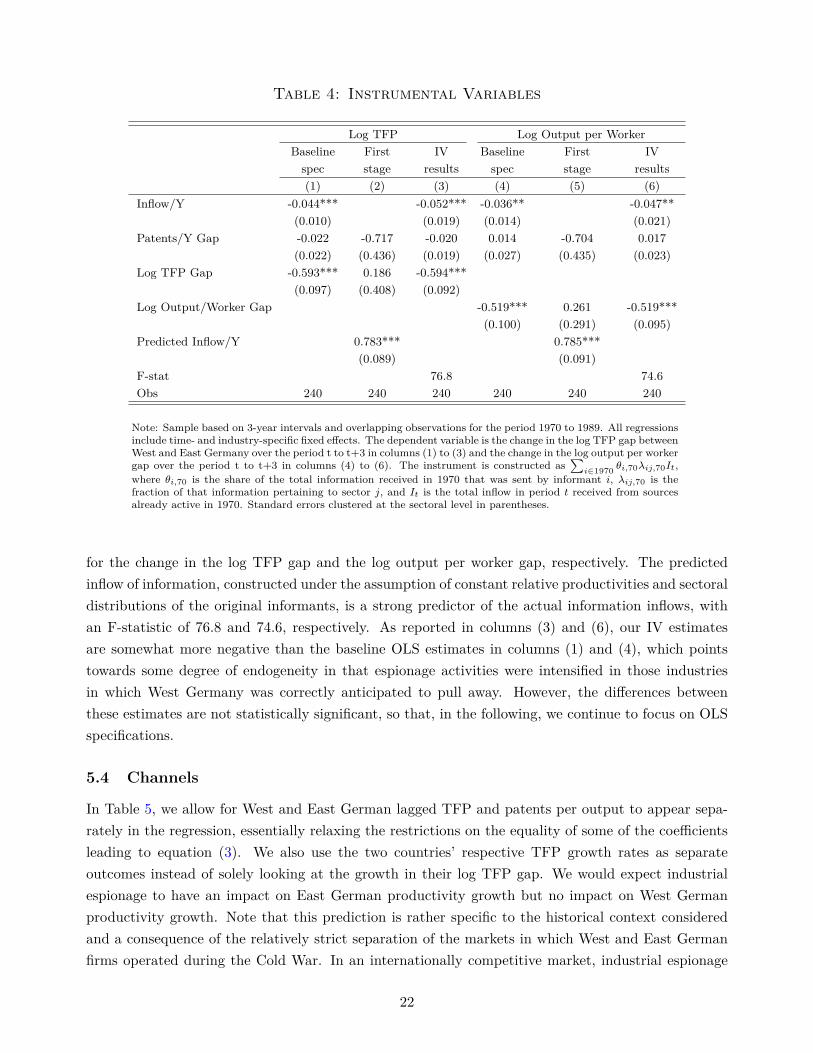
Table 4: Instrumental Variables
Log TFP Log Output per WorkerBaseline First IV Baseline First IVspec stage results spec stage results(1) (2) (3) (4) (5) (6)
Inflow/Y -0.044*** -0.052*** -0.036** -0.047**(0.010) (0.019) (0.014) (0.021)
Patents/Y Gap -0.022 -0.717 -0.020 0.014 -0.704 0.017(0.022) (0.436) (0.019) (0.027) (0.435) (0.023)
Log TFP Gap -0.593*** 0.186 -0.594***(0.097) (0.408) (0.092)
Log Output/Worker Gap -0.519*** 0.261 -0.519***(0.100) (0.291) (0.095)
Predicted Inflow/Y 0.783*** 0.785***(0.089) (0.091)
F-stat 76.8 74.6Obs 240 240 240 240 240 240
Note: Sample based on 3-year intervals and overlapping observations for the period 1970 to 1989. All regressionsinclude time- and industry-specific fixed effects. The dependent variable is the change in the log TFP gap betweenWest and East Germany over the period t to t+3 in columns (1) to (3) and the change in the log output per workergap over the period t to t+3 in columns (4) to (6). The instrument is constructed as
∑i∈1970 θi,70λij,70It,
where θi,70 is the share of the total information received in 1970 that was sent by informant i, λij,70 is thefraction of that information pertaining to sector j, and It is the total inflow in period t received from sourcesalready active in 1970. Standard errors clustered at the sectoral level in parentheses.
for the change in the log TFP gap and the log output per worker gap, respectively. The predictedinflow of information, constructed under the assumption of constant relative productivities and sectoraldistributions of the original informants, is a strong predictor of the actual information inflows, withan F-statistic of 76.8 and 74.6, respectively. As reported in columns (3) and (6), our IV estimatesare somewhat more negative than the baseline OLS estimates in columns (1) and (4), which pointstowards some degree of endogeneity in that espionage activities were intensified in those industriesin which West Germany was correctly anticipated to pull away. However, the differences betweenthese estimates are not statistically significant, so that, in the following, we continue to focus on OLSspecifications.
5.4 Channels
In Table 5, we allow for West and East German lagged TFP and patents per output to appear sepa-rately in the regression, essentially relaxing the restrictions on the equality of some of the coefficientsleading to equation (3). We also use the two countries’ respective TFP growth rates as separateoutcomes instead of solely looking at the growth in their log TFP gap. We would expect industrialespionage to have an impact on East German productivity growth but no impact on West Germanproductivity growth. Note that this prediction is rather specific to the historical context consideredand a consequence of the relatively strict separation of the markets in which West and East Germanfirms operated during the Cold War. In an internationally competitive market, industrial espionage
22
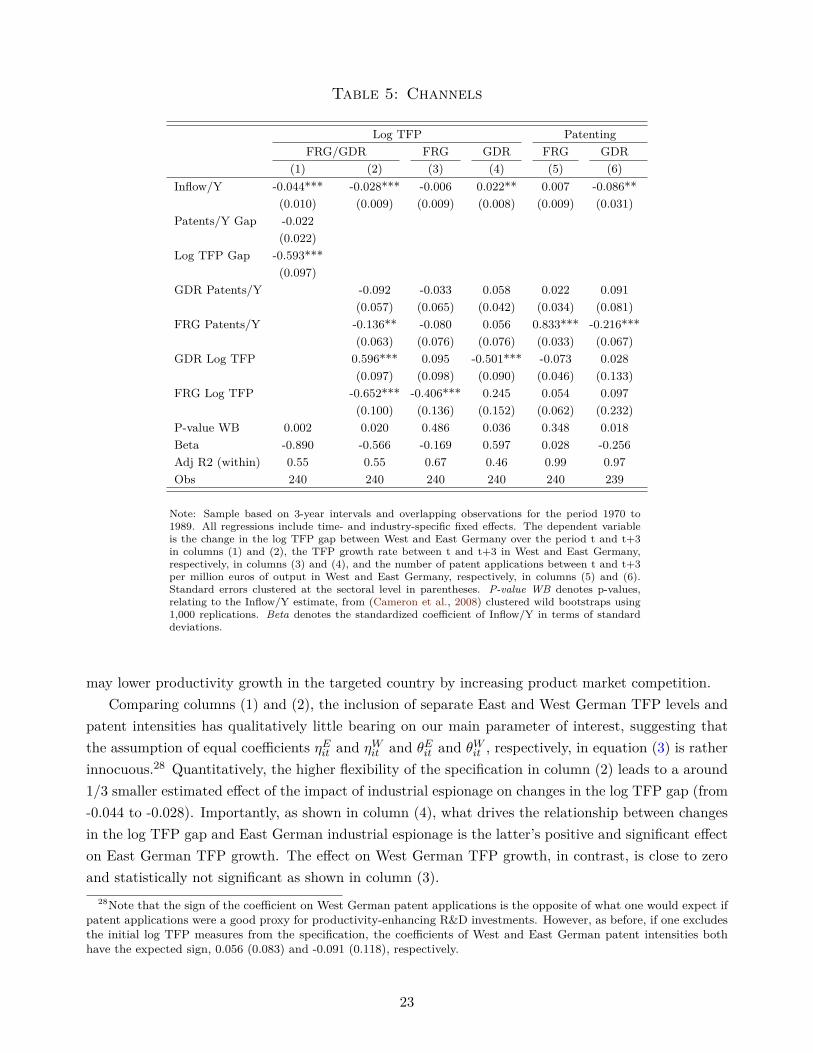
Table 5: Channels
Log TFP PatentingFRG/GDR FRG GDR FRG GDR
(1) (2) (3) (4) (5) (6)Inflow/Y -0.044*** -0.028*** -0.006 0.022** 0.007 -0.086**
(0.010) (0.009) (0.009) (0.008) (0.009) (0.031)Patents/Y Gap -0.022
(0.022)Log TFP Gap -0.593***
(0.097)GDR Patents/Y -0.092 -0.033 0.058 0.022 0.091
(0.057) (0.065) (0.042) (0.034) (0.081)FRG Patents/Y -0.136** -0.080 0.056 0.833*** -0.216***
(0.063) (0.076) (0.076) (0.033) (0.067)GDR Log TFP 0.596*** 0.095 -0.501*** -0.073 0.028
(0.097) (0.098) (0.090) (0.046) (0.133)FRG Log TFP -0.652*** -0.406*** 0.245 0.054 0.097
(0.100) (0.136) (0.152) (0.062) (0.232)P-value WB 0.002 0.020 0.486 0.036 0.348 0.018Beta -0.890 -0.566 -0.169 0.597 0.028 -0.256Adj R2 (within) 0.55 0.55 0.67 0.46 0.99 0.97Obs 240 240 240 240 240 239
Note: Sample based on 3-year intervals and overlapping observations for the period 1970 to1989. All regressions include time- and industry-specific fixed effects. The dependent variableis the change in the log TFP gap between West and East Germany over the period t and t+3in columns (1) and (2), the TFP growth rate between t and t+3 in West and East Germany,respectively, in columns (3) and (4), and the number of patent applications between t and t+3per million euros of output in West and East Germany, respectively, in columns (5) and (6).Standard errors clustered at the sectoral level in parentheses. P-value WB denotes p-values,relating to the Inflow/Y estimate, from (Cameron et al., 2008) clustered wild bootstraps using1,000 replications. Beta denotes the standardized coefficient of Inflow/Y in terms of standarddeviations.
may lower productivity growth in the targeted country by increasing product market competition.Comparing columns (1) and (2), the inclusion of separate East and West German TFP levels and
patent intensities has qualitatively little bearing on our main parameter of interest, suggesting thatthe assumption of equal coefficients ηEit and ηWit and θEit and θWit , respectively, in equation (3) is ratherinnocuous.28 Quantitatively, the higher flexibility of the specification in column (2) leads to a around1/3 smaller estimated effect of the impact of industrial espionage on changes in the log TFP gap (from-0.044 to -0.028). Importantly, as shown in column (4), what drives the relationship between changesin the log TFP gap and East German industrial espionage is the latter’s positive and significant effecton East German TFP growth. The effect on West German TFP growth, in contrast, is close to zeroand statistically not significant as shown in column (3).
28Note that the sign of the coefficient on West German patent applications is the opposite of what one would expect ifpatent applications were a good proxy for productivity-enhancing R&D investments. However, as before, if one excludesthe initial log TFP measures from the specification, the coefficients of West and East German patent intensities bothhave the expected sign, 0.056 (0.083) and -0.091 (0.118), respectively.
23
The last two columns of Table 5 report results from a specification in which the dependent variableis the future patent intensity in West and East Germany. While industrial espionage has no effecton future patenting in West Germany (column (5)), it significantly reduces patenting in East Ger-many (column (6)). This finding is consistent with reports in Macrakis (2008) of industrial espionageessentially crowding out overt R&D in East Germany.
5.5 Heterogeneity
In this section, we illustrate heterogeneous effects along two important dimensions, the initial TFPgap as well as the imports gap. First, we relate to the literature that studies how R&D affectsproductivity growth depending on a country’s distance to the technological frontier (Griffith et al.,2004; Cameron et al., 2005; Acemoglu et al., 2006) by allowing the effects of industrial espionageto vary by the initial West-to-East log TFP gap. Our starting point here is the specification fromcolumn (6) in Table 3 which also includes the imports gap between West and East Germany. Here, weadd interactions for all continuous variables (the inflow, patents, and imports variables) with dummyvariables for the quartiles in the initial TFP gap and allow the four dummy variables to substitute forthe linear TFP gap term. The left panel of Figure 5 depicts the results. The estimates for the firstand second quartiles are negative and statistically different from zero (-0.368 and -0.125, respectively).These two are also jointly statistically different from those for the third and fourth quartiles (with ap-value of 0.004), which exhibit estimates of -0.061 and -0.030, and where only the former estimate isstatistically different from zero. These findings show that industrial espionage was more effective innarrowing the productivity gap in industries where East Germany was technologically relatively closeto West Germany. This could be because these were the circumstances where East German researchersand engineers were most likely to succeed in implementing the new technological knowledge acquiredfrom the West in their own production process. This result contrasts somewhat with the past findingsof the returns to standard forms of R&D which suggests a larger return in industries further awayfrom the frontier (Griffith et al., 2004).
As a second relevant dimension of heterogeneity, we examine the effect of industrial espionage alongthe measure of relative import barriers by, in addition to the previous model, further interacting ourinflow measure (as well as the continuous variables and TFP gap dummies) with different quartilesof the West-to-East import intensity gap (where we again substitute the linear imports gap variableand its interactions with the initial TFP gap with the four quartiles of the imports gap). If industrialespionage served as a form of technology transfer when regular channels such as trade were unavailable,we would expect larger-in-magnitude estimates in cases where, all else equal, the gap between Westand East German import intensities were larger. The right panel of Figure 5 illustrates that whilethe average marginal effects for the first and second quartiles of -0.125 and -0.101 respectively aresimilar in terms of magnitude, the effects for the third and fourth quartiles are more pronounced withpoint estimates of -0.161 and -0.231, respectively. In terms of adjacent pairwise statistical tests ofdifferences, only that between the second and the third quartile is so, and then only at the ten percentlevel.29 Nonetheless, the average estimate above the median is nearly twice that of the average estimate
29The p-values are 0.230 (quartiles 1 and 2), 0.052 (quartiles 2 and 3), and 0.322 (quartiles 3 and 4) respectively.
24
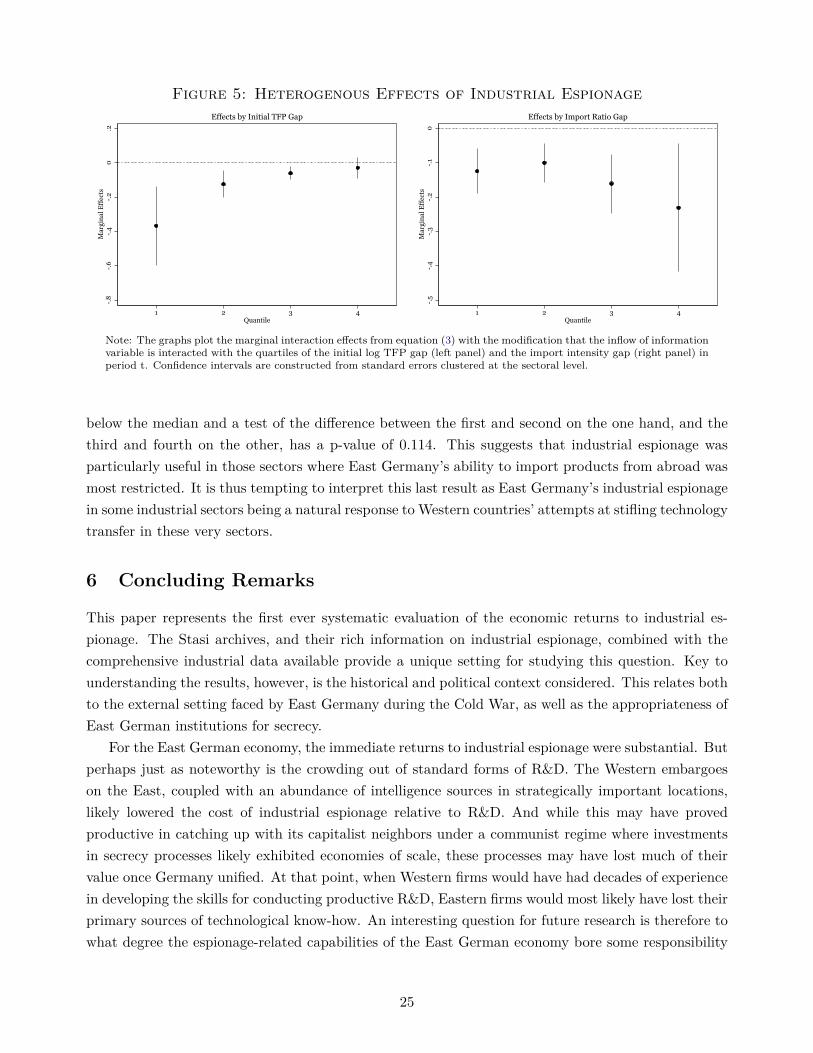
Figure 5: Heterogenous Effects of Industrial Espionage.
8.
6.
4.
20
.2M
arg
ina
l E
ffec
ts
1 2 3 4Quantile
Effects by Initial TFP Gap
-.5
-.4
-.3
-.2
-.1
0M
arg
ina
l E
ffec
ts
1 2 3 4Quantile
Effects by Import Ratio Gap
Note: The graphs plot the marginal interaction effects from equation (3) with the modification that the inflow of informationvariable is interacted with the quartiles of the initial log TFP gap (left panel) and the import intensity gap (right panel) inperiod t. Confidence intervals are constructed from standard errors clustered at the sectoral level.
below the median and a test of the difference between the first and second on the one hand, and thethird and fourth on the other, has a p-value of 0.114. This suggests that industrial espionage wasparticularly useful in those sectors where East Germany’s ability to import products from abroad wasmost restricted. It is thus tempting to interpret this last result as East Germany’s industrial espionagein some industrial sectors being a natural response to Western countries’ attempts at stifling technologytransfer in these very sectors.
6 Concluding Remarks
This paper represents the first ever systematic evaluation of the economic returns to industrial es-pionage. The Stasi archives, and their rich information on industrial espionage, combined with thecomprehensive industrial data available provide a unique setting for studying this question. Key tounderstanding the results, however, is the historical and political context considered. This relates bothto the external setting faced by East Germany during the Cold War, as well as the appropriateness ofEast German institutions for secrecy.
For the East German economy, the immediate returns to industrial espionage were substantial. Butperhaps just as noteworthy is the crowding out of standard forms of R&D. The Western embargoeson the East, coupled with an abundance of intelligence sources in strategically important locations,likely lowered the cost of industrial espionage relative to R&D. And while this may have provedproductive in catching up with its capitalist neighbors under a communist regime where investmentsin secrecy processes likely exhibited economies of scale, these processes may have lost much of theirvalue once Germany unified. At that point, when Western firms would have had decades of experiencein developing the skills for conducting productive R&D, Eastern firms would most likely have lost theirprimary sources of technological know-how. An interesting question for future research is therefore towhat degree the espionage-related capabilities of the East German economy bore some responsibility
25
for its post-unification performance.Arguably, few contemporary intelligence agencies have been able to make industrial espionage as
effective a tool – against externally-imposed technology embargoes – as the Stasi did during the ColdWar. Still, the topic of industrial espionage is as relevant today as it was at the height of the ColdWar. Methods may have changed to accommodate new technologies for spying, but governmentsremain interested in technology transfer outside of the regular channels. Moreover, several countriesface restrictions on technology transfer, either through outright sanctions, like Iran and North Korea,or as a result of intellectual property rights protection as in China or India. As such, even thoughthe success with which East Germany penetrated West German commercial and scientific institutionsmay be unique, the value of industrial espionage as a form of illicit technology transfer is much moreubiquitous.
26
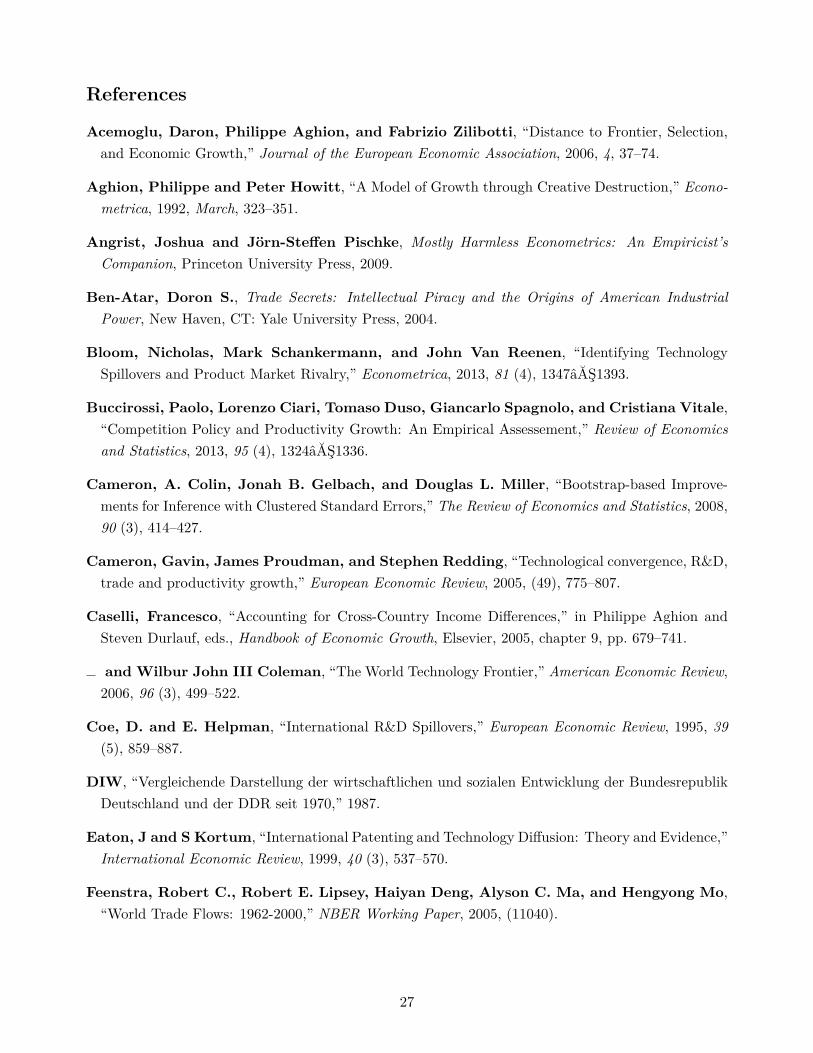
References
Acemoglu, Daron, Philippe Aghion, and Fabrizio Zilibotti, “Distance to Frontier, Selection,and Economic Growth,” Journal of the European Economic Association, 2006, 4, 37–74.
Aghion, Philippe and Peter Howitt, “A Model of Growth through Creative Destruction,” Econo-metrica, 1992, March, 323–351.
Angrist, Joshua and Jörn-Steffen Pischke, Mostly Harmless Econometrics: An Empiricist’sCompanion, Princeton University Press, 2009.
Ben-Atar, Doron S., Trade Secrets: Intellectual Piracy and the Origins of American IndustrialPower, New Haven, CT: Yale University Press, 2004.
Bloom, Nicholas, Mark Schankermann, and John Van Reenen, “Identifying TechnologySpillovers and Product Market Rivalry,” Econometrica, 2013, 81 (4), 1347âĂŞ1393.
Buccirossi, Paolo, Lorenzo Ciari, Tomaso Duso, Giancarlo Spagnolo, and Cristiana Vitale,“Competition Policy and Productivity Growth: An Empirical Assessement,” Review of Economicsand Statistics, 2013, 95 (4), 1324âĂŞ1336.
Cameron, A. Colin, Jonah B. Gelbach, and Douglas L. Miller, “Bootstrap-based Improve-ments for Inference with Clustered Standard Errors,” The Review of Economics and Statistics, 2008,90 (3), 414–427.
Cameron, Gavin, James Proudman, and Stephen Redding, “Technological convergence, R&D,trade and productivity growth,” European Economic Review, 2005, (49), 775–807.
Caselli, Francesco, “Accounting for Cross-Country Income Differences,” in Philippe Aghion andSteven Durlauf, eds., Handbook of Economic Growth, Elsevier, 2005, chapter 9, pp. 679–741.
and Wilbur John III Coleman, “The World Technology Frontier,” American Economic Review,2006, 96 (3), 499–522.
Coe, D. and E. Helpman, “International R&D Spillovers,” European Economic Review, 1995, 39(5), 859–887.
DIW, “Vergleichende Darstellung der wirtschaftlichen und sozialen Entwicklung der BundesrepublikDeutschland und der DDR seit 1970,” 1987.
Eaton, J and S Kortum, “International Patenting and Technology Diffusion: Theory and Evidence,”International Economic Review, 1999, 40 (3), 537–570.
Feenstra, Robert C., Robert E. Lipsey, Haiyan Deng, Alyson C. Ma, and Hengyong Mo,“World Trade Flows: 1962-2000,” NBER Working Paper, 2005, (11040).
27
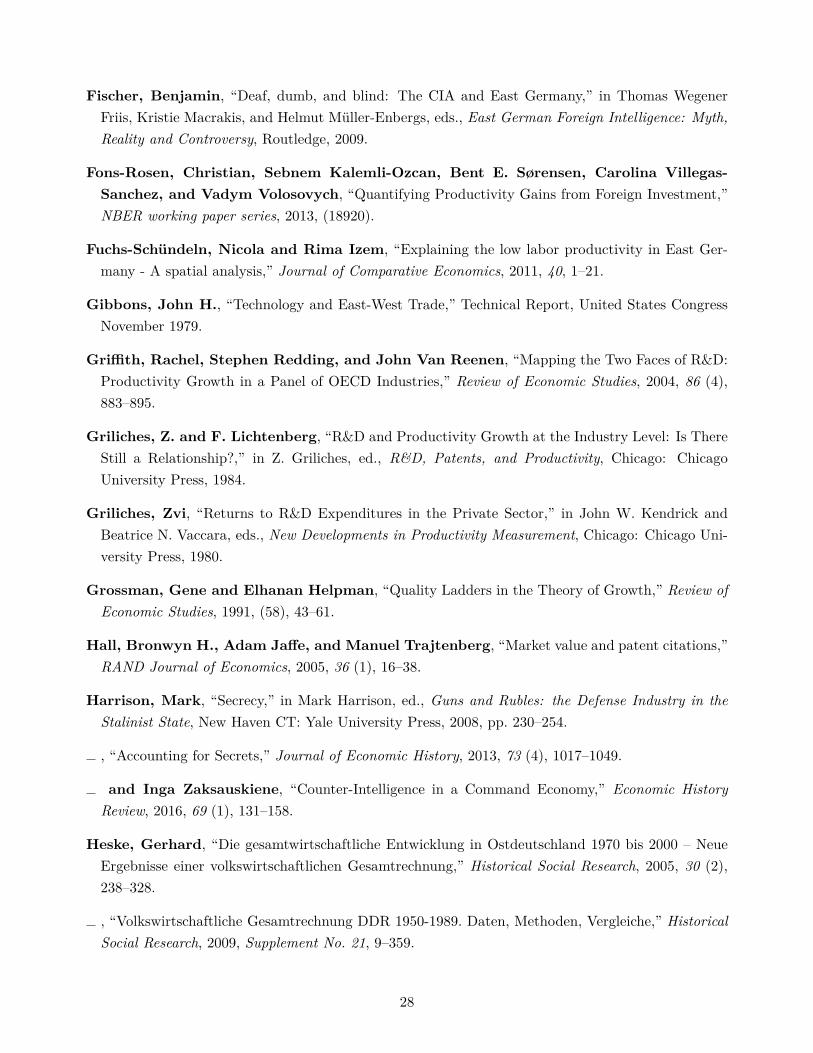
Fischer, Benjamin, “Deaf, dumb, and blind: The CIA and East Germany,” in Thomas WegenerFriis, Kristie Macrakis, and Helmut Müller-Enbergs, eds., East German Foreign Intelligence: Myth,Reality and Controversy, Routledge, 2009.
Fons-Rosen, Christian, Sebnem Kalemli-Ozcan, Bent E. Sørensen, Carolina Villegas-Sanchez, and Vadym Volosovych, “Quantifying Productivity Gains from Foreign Investment,”NBER working paper series, 2013, (18920).
Fuchs-Schündeln, Nicola and Rima Izem, “Explaining the low labor productivity in East Ger-many - A spatial analysis,” Journal of Comparative Economics, 2011, 40, 1–21.
Gibbons, John H., “Technology and East-West Trade,” Technical Report, United States CongressNovember 1979.
Griffith, Rachel, Stephen Redding, and John Van Reenen, “Mapping the Two Faces of R&D:Productivity Growth in a Panel of OECD Industries,” Review of Economic Studies, 2004, 86 (4),883–895.
Griliches, Z. and F. Lichtenberg, “R&D and Productivity Growth at the Industry Level: Is ThereStill a Relationship?,” in Z. Griliches, ed., R&D, Patents, and Productivity, Chicago: ChicagoUniversity Press, 1984.
Griliches, Zvi, “Returns to R&D Expenditures in the Private Sector,” in John W. Kendrick andBeatrice N. Vaccara, eds., New Developments in Productivity Measurement, Chicago: Chicago Uni-versity Press, 1980.
Grossman, Gene and Elhanan Helpman, “Quality Ladders in the Theory of Growth,” Review ofEconomic Studies, 1991, (58), 43–61.
Hall, Bronwyn H., Adam Jaffe, and Manuel Trajtenberg, “Market value and patent citations,”RAND Journal of Economics, 2005, 36 (1), 16–38.
Harrison, Mark, “Secrecy,” in Mark Harrison, ed., Guns and Rubles: the Defense Industry in theStalinist State, New Haven CT: Yale University Press, 2008, pp. 230–254.
, “Accounting for Secrets,” Journal of Economic History, 2013, 73 (4), 1017–1049.
and Inga Zaksauskiene, “Counter-Intelligence in a Command Economy,” Economic HistoryReview, 2016, 69 (1), 131–158.
Heske, Gerhard, “Die gesamtwirtschaftliche Entwicklung in Ostdeutschland 1970 bis 2000 – NeueErgebnisse einer volkswirtschaftlichen Gesamtrechnung,” Historical Social Research, 2005, 30 (2),238–328.
, “Volkswirtschaftliche Gesamtrechnung DDR 1950-1989. Daten, Methoden, Vergleiche,” HistoricalSocial Research, 2009, Supplement No. 21, 9–359.
28
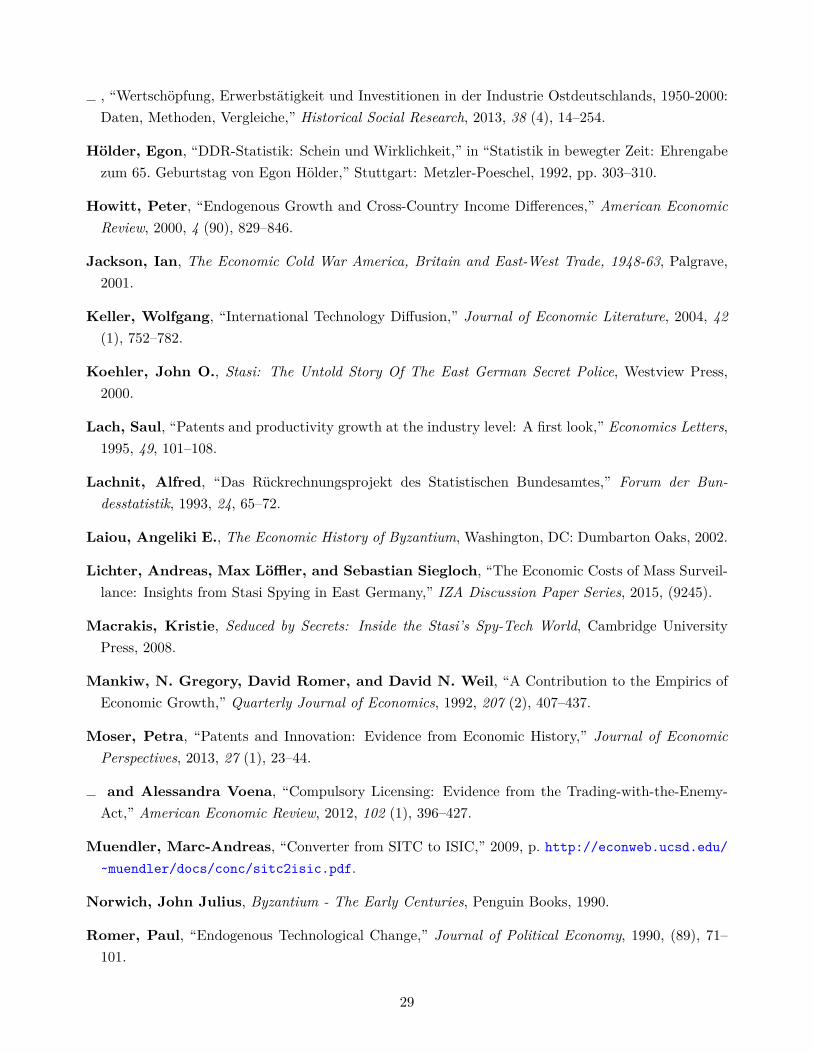
, “Wertschöpfung, Erwerbstätigkeit und Investitionen in der Industrie Ostdeutschlands, 1950-2000:Daten, Methoden, Vergleiche,” Historical Social Research, 2013, 38 (4), 14–254.
Hölder, Egon, “DDR-Statistik: Schein und Wirklichkeit,” in “Statistik in bewegter Zeit: Ehrengabezum 65. Geburtstag von Egon Hölder,” Stuttgart: Metzler-Poeschel, 1992, pp. 303–310.
Howitt, Peter, “Endogenous Growth and Cross-Country Income Differences,” American EconomicReview, 2000, 4 (90), 829–846.
Jackson, Ian, The Economic Cold War America, Britain and East-West Trade, 1948-63, Palgrave,2001.
Keller, Wolfgang, “International Technology Diffusion,” Journal of Economic Literature, 2004, 42(1), 752–782.
Koehler, John O., Stasi: The Untold Story Of The East German Secret Police, Westview Press,2000.
Lach, Saul, “Patents and productivity growth at the industry level: A first look,” Economics Letters,1995, 49, 101–108.
Lachnit, Alfred, “Das Rückrechnungsprojekt des Statistischen Bundesamtes,” Forum der Bun-desstatistik, 1993, 24, 65–72.
Laiou, Angeliki E., The Economic History of Byzantium, Washington, DC: Dumbarton Oaks, 2002.
Lichter, Andreas, Max Löffler, and Sebastian Siegloch, “The Economic Costs of Mass Surveil-lance: Insights from Stasi Spying in East Germany,” IZA Discussion Paper Series, 2015, (9245).
Macrakis, Kristie, Seduced by Secrets: Inside the Stasi’s Spy-Tech World, Cambridge UniversityPress, 2008.
Mankiw, N. Gregory, David Romer, and David N. Weil, “A Contribution to the Empirics ofEconomic Growth,” Quarterly Journal of Economics, 1992, 207 (2), 407–437.
Moser, Petra, “Patents and Innovation: Evidence from Economic History,” Journal of EconomicPerspectives, 2013, 27 (1), 23–44.
and Alessandra Voena, “Compulsory Licensing: Evidence from the Trading-with-the-Enemy-Act,” American Economic Review, 2012, 102 (1), 396–427.
Muendler, Marc-Andreas, “Converter from SITC to ISIC,” 2009, p. http://econweb.ucsd.edu/~muendler/docs/conc/sitc2isic.pdf.
Norwich, John Julius, Byzantium - The Early Centuries, Penguin Books, 1990.
Romer, Paul, “Endogenous Technological Change,” Journal of Political Economy, 1990, (89), 71–101.
29
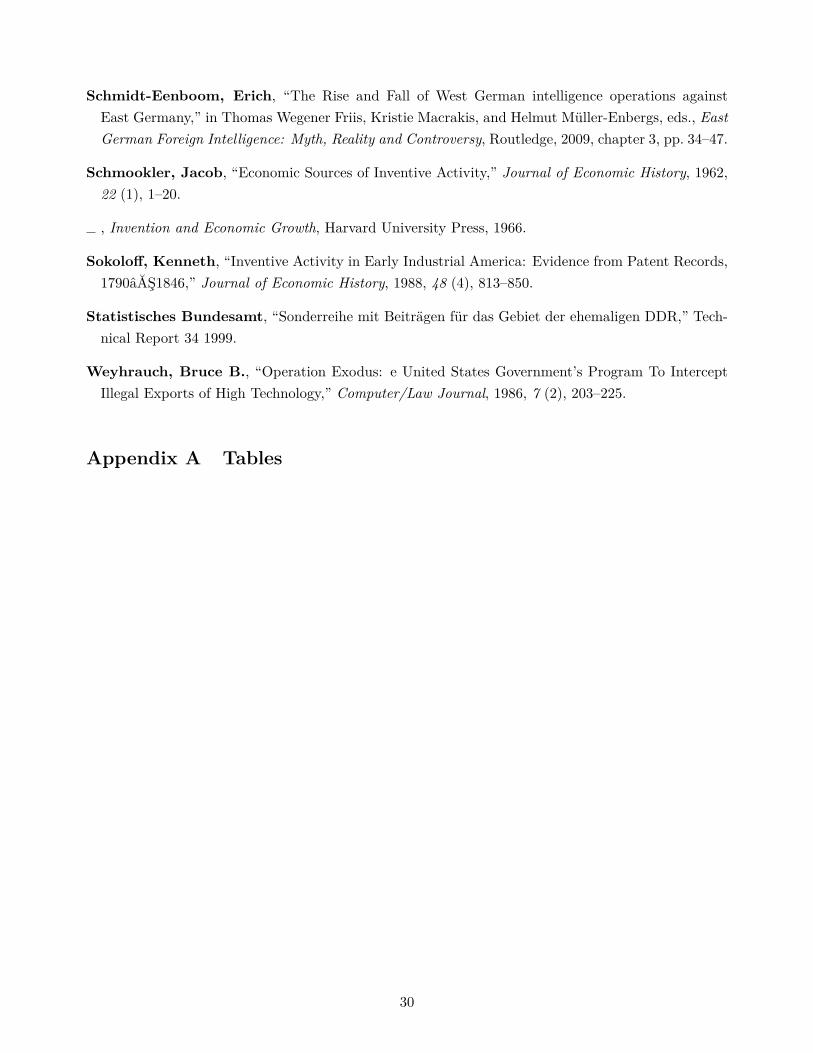
Schmidt-Eenboom, Erich, “The Rise and Fall of West German intelligence operations againstEast Germany,” in Thomas Wegener Friis, Kristie Macrakis, and Helmut Müller-Enbergs, eds., EastGerman Foreign Intelligence: Myth, Reality and Controversy, Routledge, 2009, chapter 3, pp. 34–47.
Schmookler, Jacob, “Economic Sources of Inventive Activity,” Journal of Economic History, 1962,22 (1), 1–20.
, Invention and Economic Growth, Harvard University Press, 1966.
Sokoloff, Kenneth, “Inventive Activity in Early Industrial America: Evidence from Patent Records,1790âĂŞ1846,” Journal of Economic History, 1988, 48 (4), 813–850.
Statistisches Bundesamt, “Sonderreihe mit Beiträgen für das Gebiet der ehemaligen DDR,” Tech-nical Report 34 1999.
Weyhrauch, Bruce B., “Operation Exodus: e United States Government’s Program To InterceptIllegal Exports of High Technology,” Computer/Law Journal, 1986, 7 (2), 203–225.
Appendix A Tables
30
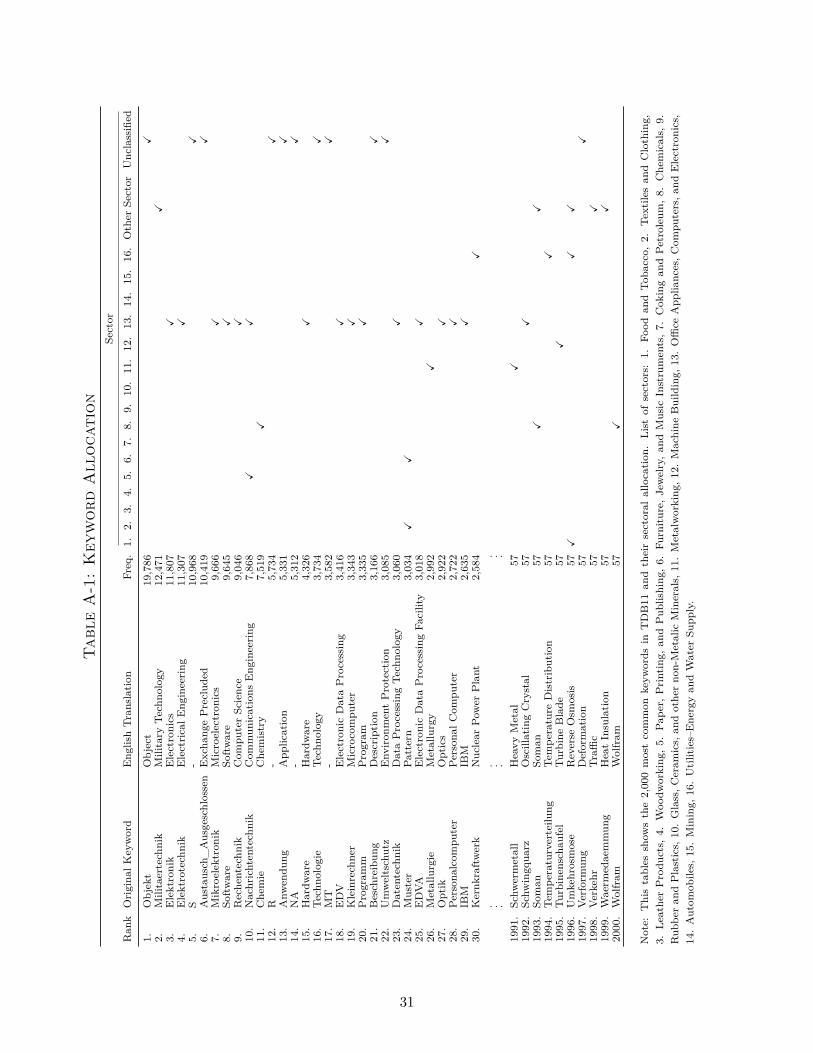
Tab
leA
-1:
Key
wor
dA
lloc
atio
nSector
Ran
kOrigina
lKeyword
Eng
lishTr
anslation
Freq.1.
2.3.
4.5.
6.7.
8.9.
10.11.12.13.14.15.16.Other
Sector
Unclassified
1.Objekt
Object
19,786
X2.
Militaertechnik
Military
Techno
logy
12,471
X3.
Elektronik
Electronics
11,807
X4.
Elektrotechnik
ElectricalE
ngineering
11,307
X5.
S-
10,968
X6.
Austausch_Ausgeschlossen
Excha
ngePreclud
ed10,419
X7.
Mikroelektron
ikMicroelectron
ics
9,666
X8.
Software
Software
9,645
X9.
Rechentechn
ikCom
puterScience
9,046
X10.
Nachrichtentechnik
Com
mun
ications
Eng
ineering
7,868
XX
11.
Chemie
Chemistry
7,519
X12.
R-
5,734
X13.
Anw
endu
ngApp
lication
5,331
X14.
NA
-5,312
X15.
Hardw
are
Hardw
are
4,326
X16.
Techno
logie
Techno
logy
3,734
X17.
MT
-3,582
X18.
EDV
ElectronicDataProcessing
3,416
X19.
Kleinrechner
Microcompu
ter
3,343
X20.
Program
mProgram
3,335
X21.
Beschreibun
gDescription
3,166
X22.
Umweltschutz
Env
iron
mentProtection
3,085
X23.
Datentechnik
DataProcessingTe
chno
logy
3,060
X24.
Muster
Pattern
3,034
XX
25.
EDVA
ElectronicDataProcessingFa
cility
3,018
X26.
Metallurgie
Metallurgy
2,992
X27.
Optik
Optics
2,922
X28.
Persona
lcom
puter
Persona
lCom
puter
2,722
X29.
IBM
IBM
2,635
X30.
Kernk
raftwerk
Nuclear
Pow
erPlant
2,584
X. . .
. . .. . .
1991.
Schw
ermetall
Heavy
Metal
57X
1992.
Schw
ingq
uarz
OscillatingCrystal
57X
1993.
Soman
Soman
57X
X1994.
Tempe
raturverteilu
ngTe
mpe
rature
Distribution
57X
1995.
Turbinenscha
ufel
TurbineBlade
57X
1996.
Umkehrosmose
Reverse
Osm
osis
57X
XX
1997.
Verform
ung
Deformation
57X
1998.
Verkehr
Traffi
c57
X1999.
Waerm
edaemmun
gHeatInsulation
57X
2000.
Wolfram
Wolfram
57X
Note:
Thistables
show
sthe2,000mostcommon
keyw
ords
inTDB11
andtheirsectoral
allocation
.List
ofsectors:
1.Fo
odan
dTo
bacco,
2.Te
xtilesan
dClothing,
3.Le
atherProdu
cts,
4.Woo
dworking
,5.
Pap
er,Printing,
andPub
lishing
,6.
Furniture,
Jewelry,an
dMusic
Instruments,7.
Cok
ingan
dPetroleum
,8.
Chemicals,
9.Rub
beran
dPlastics,10.Glass,C
eram
ics,an
dotherno
n-Metalic
Minerals,11.Metalworking
,12.
Machine
Building,
13.Office
App
liances,C
ompu
ters,a
ndElectronics,
14.Autom
obiles,
15.Mining,
16.Utilities–Energyan
dWater
Supp
ly.
31
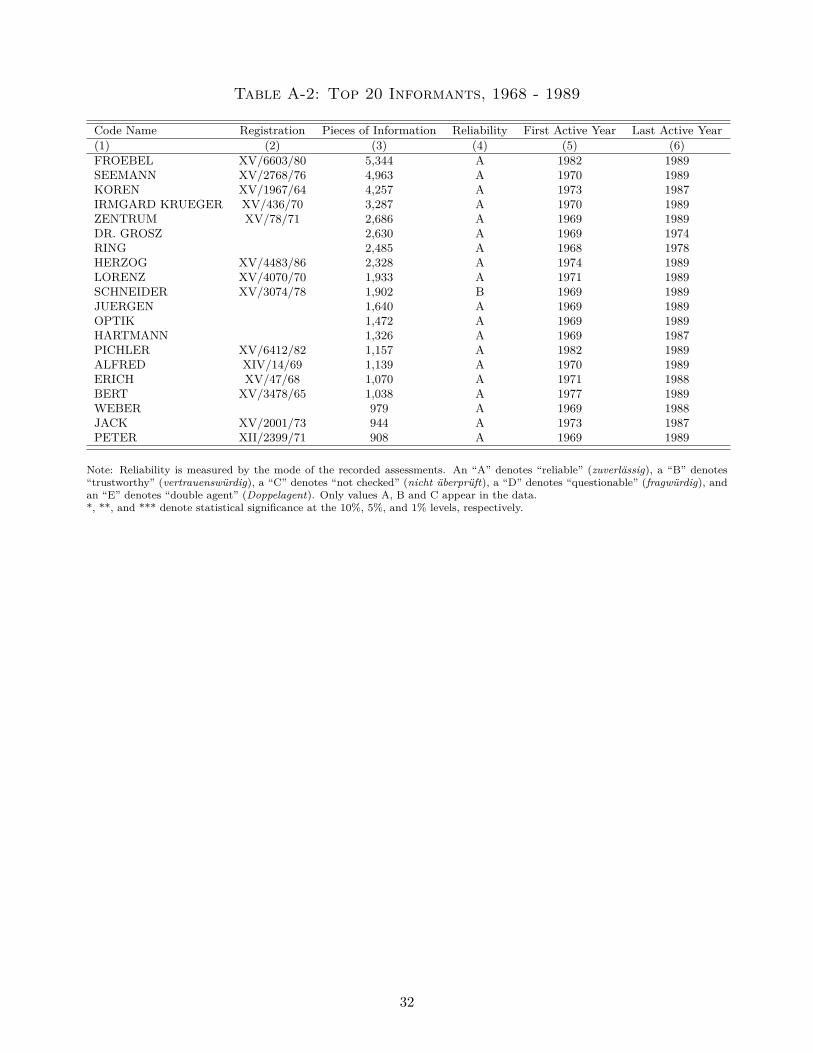
Table A-2: Top 20 Informants, 1968 - 1989
Code Name Registration Pieces of Information Reliability First Active Year Last Active Year(1) (2) (3) (4) (5) (6)FROEBEL XV/6603/80 5,344 A 1982 1989SEEMANN XV/2768/76 4,963 A 1970 1989KOREN XV/1967/64 4,257 A 1973 1987IRMGARD KRUEGER XV/436/70 3,287 A 1970 1989ZENTRUM XV/78/71 2,686 A 1969 1989DR. GROSZ 2,630 A 1969 1974RING 2,485 A 1968 1978HERZOG XV/4483/86 2,328 A 1974 1989LORENZ XV/4070/70 1,933 A 1971 1989SCHNEIDER XV/3074/78 1,902 B 1969 1989JUERGEN 1,640 A 1969 1989OPTIK 1,472 A 1969 1989HARTMANN 1,326 A 1969 1987PICHLER XV/6412/82 1,157 A 1982 1989ALFRED XIV/14/69 1,139 A 1970 1989ERICH XV/47/68 1,070 A 1971 1988BERT XV/3478/65 1,038 A 1977 1989WEBER 979 A 1969 1988JACK XV/2001/73 944 A 1973 1987PETER XII/2399/71 908 A 1969 1989
Note: Reliability is measured by the mode of the recorded assessments. An “A” denotes “reliable” (zuverlässig), a “B” denotes“trustworthy” (vertrauenswürdig), a “C” denotes “not checked” (nicht überprüft), a “D” denotes “questionable” (fragwürdig), andan “E” denotes “double agent” (Doppelagent). Only values A, B and C appear in the data.*, **, and *** denote statistical significance at the 10%, 5%, and 1% levels, respectively.
32
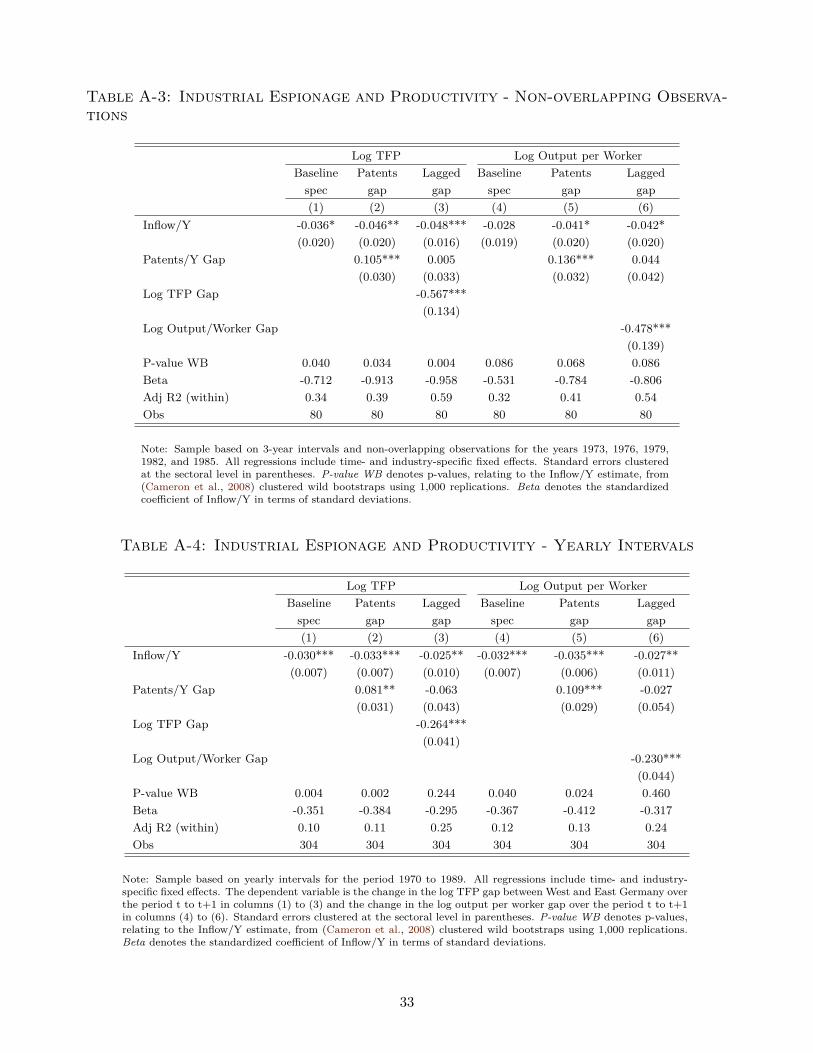
Table A-3: Industrial Espionage and Productivity - Non-overlapping Observa-tions
Log TFP Log Output per WorkerBaseline Patents Lagged Baseline Patents Laggedspec gap gap spec gap gap(1) (2) (3) (4) (5) (6)
Inflow/Y -0.036* -0.046** -0.048*** -0.028 -0.041* -0.042*(0.020) (0.020) (0.016) (0.019) (0.020) (0.020)
Patents/Y Gap 0.105*** 0.005 0.136*** 0.044(0.030) (0.033) (0.032) (0.042)
Log TFP Gap -0.567***(0.134)
Log Output/Worker Gap -0.478***(0.139)
P-value WB 0.040 0.034 0.004 0.086 0.068 0.086Beta -0.712 -0.913 -0.958 -0.531 -0.784 -0.806Adj R2 (within) 0.34 0.39 0.59 0.32 0.41 0.54Obs 80 80 80 80 80 80
Note: Sample based on 3-year intervals and non-overlapping observations for the years 1973, 1976, 1979,1982, and 1985. All regressions include time- and industry-specific fixed effects. Standard errors clusteredat the sectoral level in parentheses. P-value WB denotes p-values, relating to the Inflow/Y estimate, from(Cameron et al., 2008) clustered wild bootstraps using 1,000 replications. Beta denotes the standardizedcoefficient of Inflow/Y in terms of standard deviations.
Table A-4: Industrial Espionage and Productivity - Yearly Intervals
Log TFP Log Output per WorkerBaseline Patents Lagged Baseline Patents Laggedspec gap gap spec gap gap(1) (2) (3) (4) (5) (6)
Inflow/Y -0.030*** -0.033*** -0.025** -0.032*** -0.035*** -0.027**(0.007) (0.007) (0.010) (0.007) (0.006) (0.011)
Patents/Y Gap 0.081** -0.063 0.109*** -0.027(0.031) (0.043) (0.029) (0.054)
Log TFP Gap -0.264***(0.041)
Log Output/Worker Gap -0.230***(0.044)
P-value WB 0.004 0.002 0.244 0.040 0.024 0.460Beta -0.351 -0.384 -0.295 -0.367 -0.412 -0.317Adj R2 (within) 0.10 0.11 0.25 0.12 0.13 0.24Obs 304 304 304 304 304 304
Note: Sample based on yearly intervals for the period 1970 to 1989. All regressions include time- and industry-specific fixed effects. The dependent variable is the change in the log TFP gap between West and East Germany overthe period t to t+1 in columns (1) to (3) and the change in the log output per worker gap over the period t to t+1in columns (4) to (6). Standard errors clustered at the sectoral level in parentheses. P-value WB denotes p-values,relating to the Inflow/Y estimate, from (Cameron et al., 2008) clustered wild bootstraps using 1,000 replications.Beta denotes the standardized coefficient of Inflow/Y in terms of standard deviations.
33
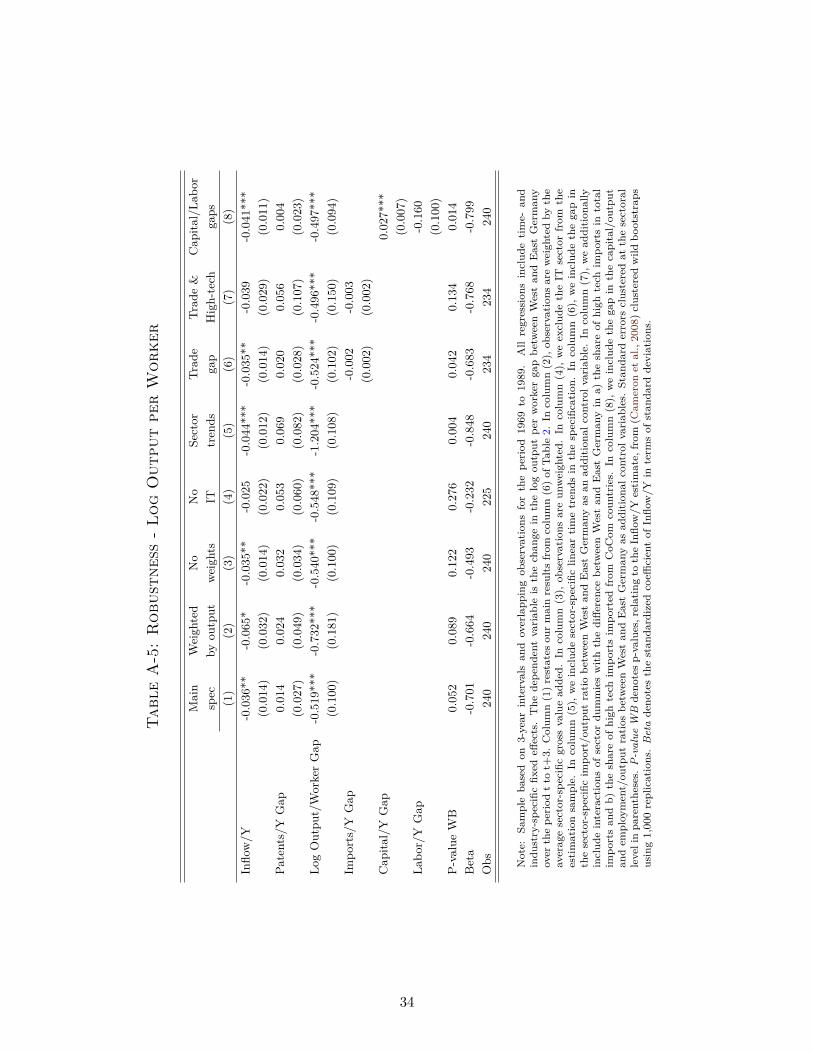
Tab
leA
-5:
Rob
ustn
ess
-Lo
gO
utpu
tpe
rW
orke
r
Main
Weigh
ted
No
No
Sector
Trad
eTr
ade&
Cap
ital/La
bor
spec
byou
tput
weigh
tsIT
tren
dsgap
High-tech
gaps
(1)
(2)
(3)
(4)
(5)
(6)
(7)
(8)
Inflo
w/Y
-0.036**
-0.065*
-0.035**
-0.025
-0.044***
-0.035**
-0.039
-0.041***
(0.014)
(0.032)
(0.014)
(0.022)
(0.012)
(0.014)
(0.029)
(0.011)
Patents/Y
Gap
0.014
0.024
0.032
0.053
0.069
0.020
0.056
0.004
(0.027)
(0.049)
(0.034)
(0.060)
(0.082)
(0.028)
(0.107)
(0.023)
LogOutpu
t/WorkerGap
-0.519***
-0.732***
-0.540***
-0.548***
-1.204***
-0.524***
-0.496***
-0.497***
(0.100)
(0.181)
(0.100)
(0.109)
(0.108)
(0.102)
(0.150)
(0.094)
Impo
rts/Y
Gap
-0.002
-0.003
(0.002)
(0.002)
Cap
ital/Y
Gap
0.027***
(0.007)
Labo
r/Y
Gap
-0.160
(0.100)
P-value
WB
0.052
0.089
0.122
0.276
0.004
0.042
0.134
0.014
Beta
-0.701
-0.664
-0.493
-0.232
-0.848
-0.683
-0.768
-0.799
Obs
240
240
240
225
240
234
234
240
Note:
Sampleba
sed
on3-year
intervalsan
doverlapp
ingob
servations
forthepe
riod
1969
to1989.
All
regression
sinclud
etime-
and
indu
stry-spe
cific
fixed
effects.The
depe
ndentvariab
leis
thechan
gein
thelogou
tput
perworkergapbe
tweenWestan
dEastGerman
yover
thepe
riod
tto
t+3.
Colum
n(1)restates
ourmainresultsfrom
column(6)of
Table2.
Incolumn(2),ob
servations
areweigh
tedby
the
averagesector-spe
cific
grossvaluead
ded.
Incolumn(3),
observations
areun
weigh
ted.
Incolumn(4),
weexclud
etheIT
sector
from
the
estimationsample.
Incolumn(5),
weinclud
esector-spe
cific
lineartimetrends
inthespecification
.In
column(6),
weinclud
ethegapin
thesector-spe
cific
impo
rt/outpu
tratiobe
tweenWestan
dEastGerman
yas
anad
dition
alcontrolv
ariable.
Incolumn(7),wead
dition
ally
includ
einteractions
ofsector
dummieswiththediffe
rencebe
tweenWestan
dEastGerman
yin
a)theshareof
high
tech
impo
rtsin
total
impo
rtsan
db)
theshareof
high
tech
impo
rtsim
ported
from
CoC
omcoun
tries.
Incolumn(8),
weinclud
ethegapin
thecapital/ou
tput
andem
ploy
ment/ou
tput
ratios
betw
eenWestan
dEastGerman
yas
addition
alcontrolv
ariables.Stan
dard
errors
clusteredat
thesectoral
levelinpa
rentheses.
P-v
alue
WB
deno
tesp-values,relatingto
theInflo
w/Y
estimate,
from
(Cam
eron
etal.,2008)clusteredwild
bootstraps
using1,000replications.
Bet
adeno
testhestan
dardized
coeffi
cientof
Inflo
w/Y
interm
sof
stan
dard
deviations.
34
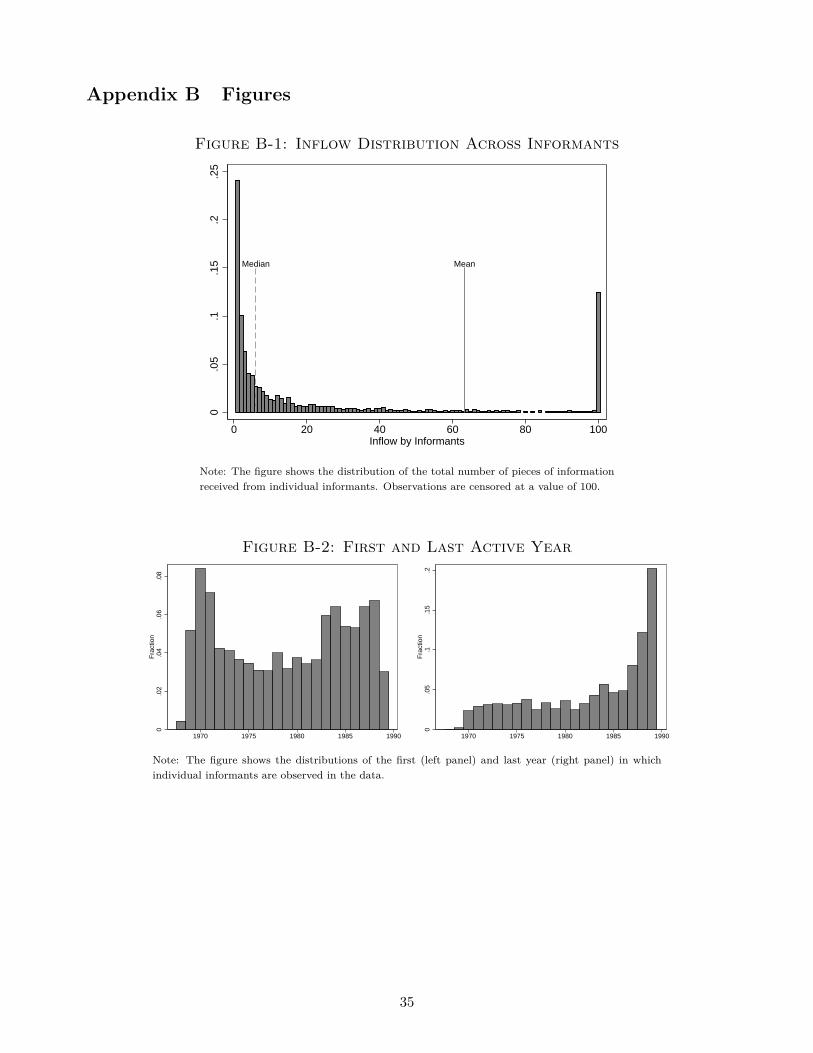
Appendix B Figures
Figure B-1: Inflow Distribution Across Informants
Median Mean
0.0
5.1
.15
.2.2
5
0 20 40 60 80 100Inflow by Informants
Note: The figure shows the distribution of the total number of pieces of informationreceived from individual informants. Observations are censored at a value of 100.
Figure B-2: First and Last Active Year
0.0
2.0
4.0
6.0
8F
ract
ion
1970 1975 1980 1985 1990
0.0
5.1
.15
.2F
ract
ion
1970 1975 1980 1985 1990
Note: The figure shows the distributions of the first (left panel) and last year (right panel) in whichindividual informants are observed in the data.
35
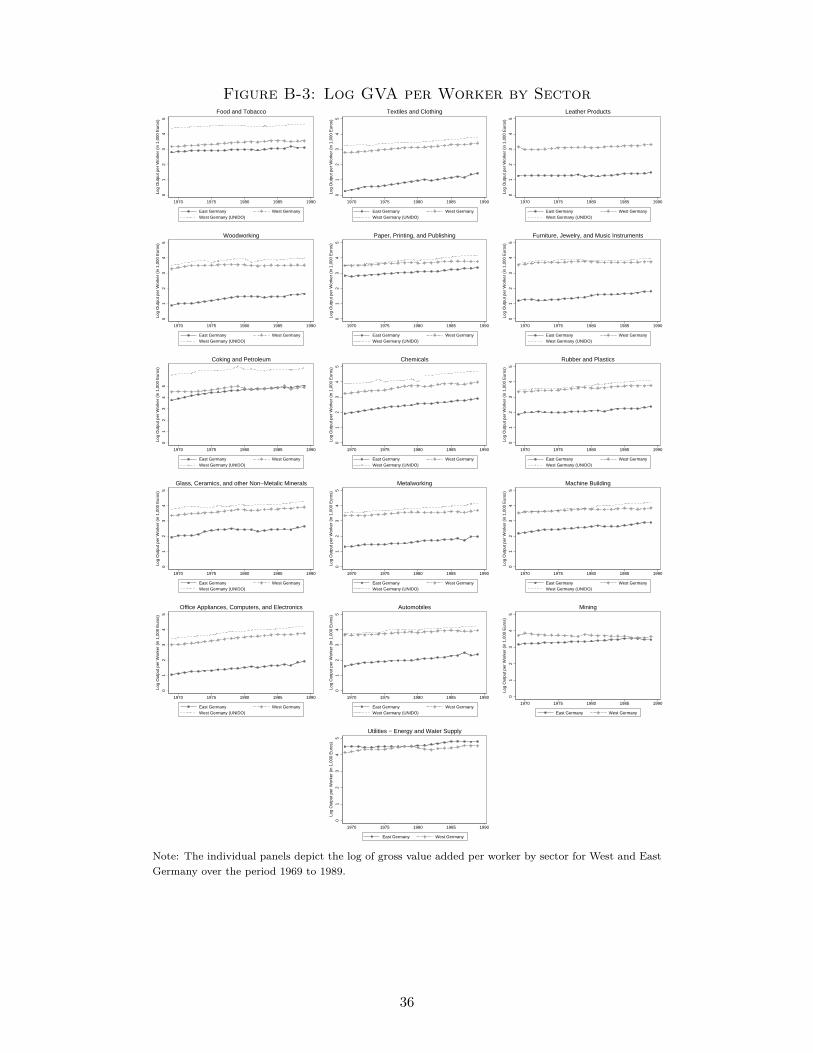
Figure B-3: Log GVA per Worker by Sector
01
23
45
Log
Out
put p
er W
orke
r (in
1,0
00 E
uros
)
1970 1975 1980 1985 1990
East Germany West GermanyWest Germany (UNIDO)
Food and Tobacco
01
23
45
Log
Out
put p
er W
orke
r (in
1,0
00 E
uros
)
1970 1975 1980 1985 1990
East Germany West GermanyWest Germany (UNIDO)
Textiles and Clothing
01
23
45
Log
Out
put p
er W
orke
r (in
1,0
00 E
uros
)
1970 1975 1980 1985 1990
East Germany West GermanyWest Germany (UNIDO)
Leather Products
01
23
45
Log
Out
put p
er W
orke
r (in
1,0
00 E
uros
)
1970 1975 1980 1985 1990
East Germany West GermanyWest Germany (UNIDO)
Woodworking
01
23
45
Log
Out
put p
er W
orke
r (in
1,0
00 E
uros
)1970 1975 1980 1985 1990
East Germany West GermanyWest Germany (UNIDO)
Paper, Printing, and Publishing
01
23
45
Log
Out
put p
er W
orke
r (in
1,0
00 E
uros
)
1970 1975 1980 1985 1990
East Germany West GermanyWest Germany (UNIDO)
Furniture, Jewelry, and Music Instruments
01
23
45
Log
Out
put p
er W
orke
r (in
1,0
00 E
uros
)
1970 1975 1980 1985 1990
East Germany West GermanyWest Germany (UNIDO)
Coking and Petroleum
01
23
45
Log
Out
put p
er W
orke
r (in
1,0
00 E
uros
)
1970 1975 1980 1985 1990
East Germany West GermanyWest Germany (UNIDO)
Chemicals
01
23
45
Log
Out
put p
er W
orke
r (in
1,0
00 E
uros
)
1970 1975 1980 1985 1990
East Germany West GermanyWest Germany (UNIDO)
Rubber and Plastics
01
23
45
Log
Out
put p
er W
orke
r (in
1,0
00 E
uros
)
1970 1975 1980 1985 1990
East Germany West GermanyWest Germany (UNIDO)
Glass, Ceramics, and other Non−Metalic Minerals
01
23
45
Log
Out
put p
er W
orke
r (in
1,0
00 E
uros
)
1970 1975 1980 1985 1990
East Germany West GermanyWest Germany (UNIDO)
Metalworking
01
23
45
Log
Out
put p
er W
orke
r (in
1,0
00 E
uros
)
1970 1975 1980 1985 1990
East Germany West GermanyWest Germany (UNIDO)
Machine Building
01
23
45
Log
Out
put p
er W
orke
r (in
1,0
00 E
uros
)
1970 1975 1980 1985 1990
East Germany West GermanyWest Germany (UNIDO)
Office Appliances, Computers, and Electronics
01
23
45
Log
Out
put p
er W
orke
r (in
1,0
00 E
uros
)
1970 1975 1980 1985 1990
East Germany West GermanyWest Germany (UNIDO)
Automobiles
01
23
45
Log
Out
put p
er W
orke
r (in
1,0
00 E
uros
)
1970 1975 1980 1985 1990
East Germany West Germany
Mining
01
23
45
Log
Out
put p
er W
orke
r (in
1,0
00 E
uros
)
1970 1975 1980 1985 1990
East Germany West Germany
Utilities − Energy and Water Supply
Note: The individual panels depict the log of gross value added per worker by sector for West and EastGermany over the period 1969 to 1989.
36
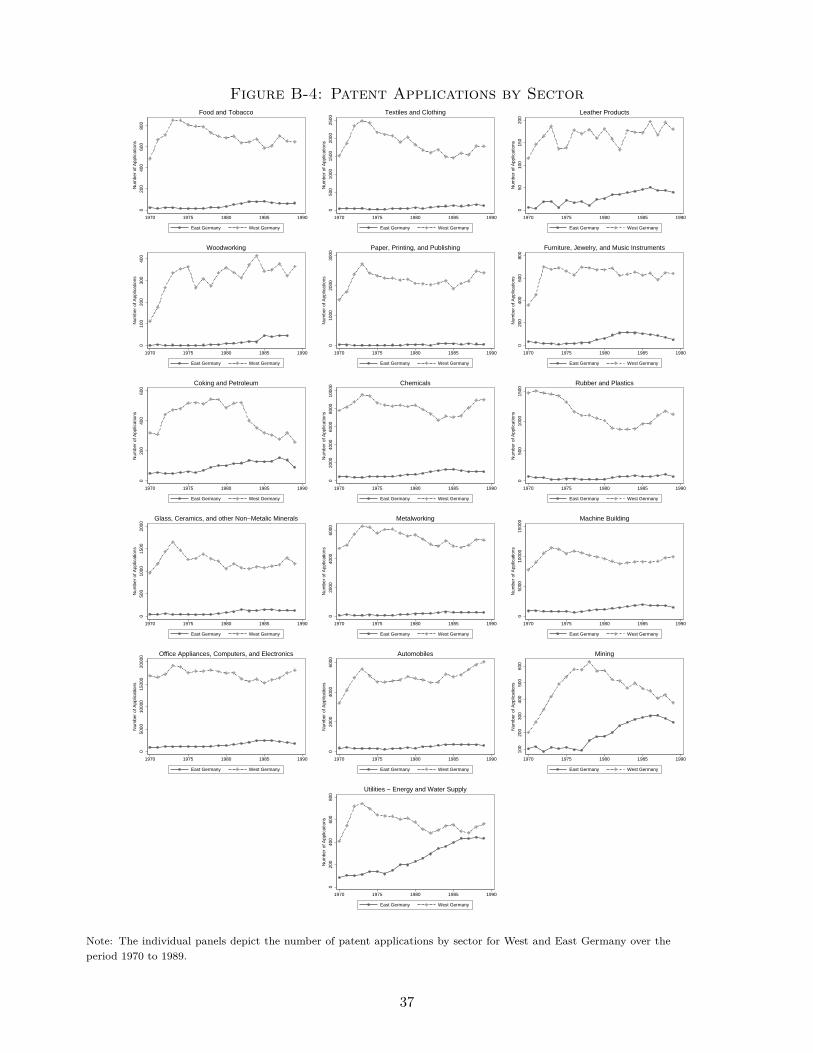
Figure B-4: Patent Applications by Sector
020
040
060
080
0
Num
ber
of A
pplic
atio
ns
1970 1975 1980 1985 1990
East Germany West Germany
Food and Tobacco
050
010
0015
0020
0025
00
Num
ber
of A
pplic
atio
ns
1970 1975 1980 1985 1990
East Germany West Germany
Textiles and Clothing
050
100
150
200
Num
ber
of A
pplic
atio
ns
1970 1975 1980 1985 1990
East Germany West Germany
Leather Products
010
020
030
040
0
Num
ber
of A
pplic
atio
ns
1970 1975 1980 1985 1990
East Germany West Germany
Woodworking
010
0020
0030
00
Num
ber
of A
pplic
atio
ns
1970 1975 1980 1985 1990
East Germany West Germany
Paper, Printing, and Publishing
020
040
060
080
0
Num
ber
of A
pplic
atio
ns
1970 1975 1980 1985 1990
East Germany West Germany
Furniture, Jewelry, and Music Instruments
020
040
060
0
Num
ber
of A
pplic
atio
ns
1970 1975 1980 1985 1990
East Germany West Germany
Coking and Petroleum
020
0040
0060
0080
0010
000
Num
ber
of A
pplic
atio
ns
1970 1975 1980 1985 1990
East Germany West Germany
Chemicals
050
010
0015
00
Num
ber
of A
pplic
atio
ns
1970 1975 1980 1985 1990
East Germany West Germany
Rubber and Plastics
050
010
0015
0020
00
Num
ber
of A
pplic
atio
ns
1970 1975 1980 1985 1990
East Germany West Germany
Glass, Ceramics, and other Non−Metalic Minerals
020
0040
0060
00
Num
ber
of A
pplic
atio
ns
1970 1975 1980 1985 1990
East Germany West Germany
Metalworking0
5000
1000
015
000
Num
ber
of A
pplic
atio
ns
1970 1975 1980 1985 1990
East Germany West Germany
Machine Building
050
0010
000
1500
020
000
Num
ber
of A
pplic
atio
ns
1970 1975 1980 1985 1990
East Germany West Germany
Office Appliances, Computers, and Electronics
020
0040
0060
00
Num
ber
of A
pplic
atio
ns
1970 1975 1980 1985 1990
East Germany West Germany
Automobiles
100
200
300
400
500
600
Num
ber
of A
pplic
atio
ns
1970 1975 1980 1985 1990
East Germany West Germany
Mining
020
040
060
080
0
Num
ber
of A
pplic
atio
ns
1970 1975 1980 1985 1990
East Germany West Germany
Utilities − Energy and Water Supply
Note: The individual panels depict the number of patent applications by sector for West and East Germany over theperiod 1970 to 1989.
37