Embed Size (px)
Citation preview
Anomaly Detection for Scientific WorkflowApplications on Networked Clouds
Prathamesh Gaikwad, Anirban Mandal, Paul RuthRENCI - UNC Chapel Hill
[email protected]{anirban, pruth}@renci.org
Gideon Juve, Dariusz Krol, Ewa DeelmanUSC Information Sciences Institute{gideon, darek, deelman}@isi.edu
Abstract—Recent advances in cloud technologies and on-demandnetwork circuits have created an unprecedented opportunity toenable complex scientific workflow applications to run on dy-namic, networked cloud infrastructure. However, it is extremelychallenging to reliably execute these workflows on distributedclouds because performance anomalies and faults are frequentin these systems. Hence, accurate, automatic, proactive, onlinedetection of anomalies is extremely important to pinpoint thetime and source of the observed anomaly and to guide theadaptation of application and infrastructure. In this work, wepresent an anomaly detection algorithm that uses auto-regression(AR) based statistical methods on online monitoring time-seriesdata to detect performance anomalies when scientific workflowsand applications execute on networked cloud systems. We presenta thorough evaluation of our auto-regression based anomalydetection approach by injecting artificial, competing loads intothe system. Results show that our AR based detection algorithmcan accurately detect performance anomalies for a variety ofexemplar scientific workflows and applications.
Keywords—anomaly detection; scientific workflows; networked
clouds; performance monitoring
I. INTRODUCTION
With the advent of pervasive virtualization, compute, net-work and storage infrastructure is becoming increasingly pro-grammable at all layers, and end-to-end virtual environmentscan be provisioned dynamically in support of science applica-tions. The recent advances in enabling on-demand network cir-cuits, coupled with programmable cloud technologies [1], [2]create an unprecedented opportunity to enable complex data-intensive scientific applications to run on elastic networkedcloud infrastructure. We refer to this model as NetworkedInfrastructure-as-a-Service (NIaaS).
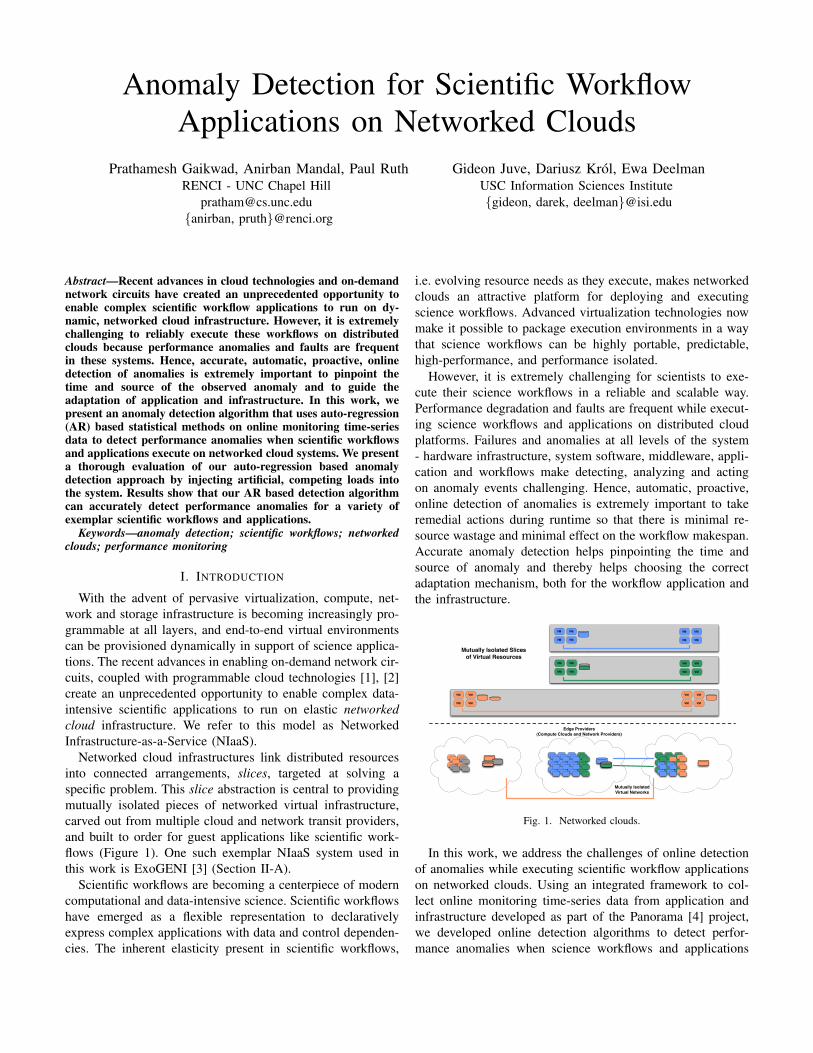
Networked cloud infrastructures link distributed resourcesinto connected arrangements, slices, targeted at solving aspecific problem. This slice abstraction is central to providingmutually isolated pieces of networked virtual infrastructure,carved out from multiple cloud and network transit providers,and built to order for guest applications like scientific work-flows (Figure 1). One such exemplar NIaaS system used inthis work is ExoGENI [3] (Section II-A).
Scientific workflows are becoming a centerpiece of moderncomputational and data-intensive science. Scientific workflowshave emerged as a flexible representation to declarativelyexpress complex applications with data and control dependen-cies. The inherent elasticity present in scientific workflows,
i.e. evolving resource needs as they execute, makes networkedclouds an attractive platform for deploying and executingscience workflows. Advanced virtualization technologies nowmake it possible to package execution environments in a waythat science workflows can be highly portable, predictable,high-performance, and performance isolated.
However, it is extremely challenging for scientists to exe-cute their science workflows in a reliable and scalable way.Performance degradation and faults are frequent while execut-ing science workflows and applications on distributed cloudplatforms. Failures and anomalies at all levels of the system- hardware infrastructure, system software, middleware, appli-cation and workflows make detecting, analyzing and actingon anomaly events challenging. Hence, automatic, proactive,online detection of anomalies is extremely important to takeremedial actions during runtime so that there is minimal re-source wastage and minimal effect on the workflow makespan.Accurate anomaly detection helps pinpointing the time andsource of anomaly and thereby helps choosing the correctadaptation mechanism, both for the workflow application andthe infrastructure.
Mutually Isolated Virtual Networks
VM VM
VM VM
VM VM
VM VM
VM VM
VM VM
VM VM
VM VM
VM VM
VM VM
VM VM
VM VM
Edge Providers(Compute Clouds and Network Providers)
Mutually Isolated Slicesof Virtual Resources
Fig. 1. Networked clouds.
In this work, we address the challenges of online detectionof anomalies while executing scientific workflow applicationson networked clouds. Using an integrated framework to col-lect online monitoring time-series data from application andinfrastructure developed as part of the Panorama [4] project,we developed online detection algorithms to detect perfor-mance anomalies when science workflows and applications
are executed. The detection algorithms use regression basedstatistical methods to generate model parameters to fit the dataand calculate error based on predicted and actual values togenerate anomaly triggers. We present a thorough evaluation ofour auto-regression (AR) based anomaly detection approach todetect performance anomalies for a variety of scientific work-flows and applications. We execute several HPC applicationsand workflows on the ExoGENI networked cloud testbed toshow the effectiveness of AR based time series analysis todetect anomalies when artificial, competing loads are injectedinto the system.
The paper is organized as follows. Section II providesbackground on ExoGENI, the Pegasus workflow managementsystem, and deployment of the workflows on ExoGENI.Section III describes the monitoring framework and the ARbased anomaly detection algorithm. Section IV presents anevaluation of the anomaly detection technique for severalexemplar scientific workflows and applications. Section Vpresents related work and section VI concludes the paper.
II. BACKGROUND
A. ExoGENIExoGENI [3] orchestrates a federation of independent cloud
sites located across the US and circuit providers, like Inter-net2 and ESNet, through their native IaaS API interfaces. Itis a widely distributed networked infrastructure-as-a-service(NIaaS) platform geared towards experimentation and compu-tational tasks. Virtual compute, storage, and network resourcesare stitched together to form mutually isolated “slices” of in-frastructure. Experimental slices can have complex topologiesthat span one or more ExoGENI sites. Users and applicationscan get resources from ExoGENI racks by submitting theirslice requests using several command-line and GUI tools. Ex-oGENI employs sophisticated topology embedding algorithmsthat take advantage of semantic resource descriptions, and mapslice topology requests to underlying infrastructure actions thatinstantiate the virtual infrastructure for guest applications.
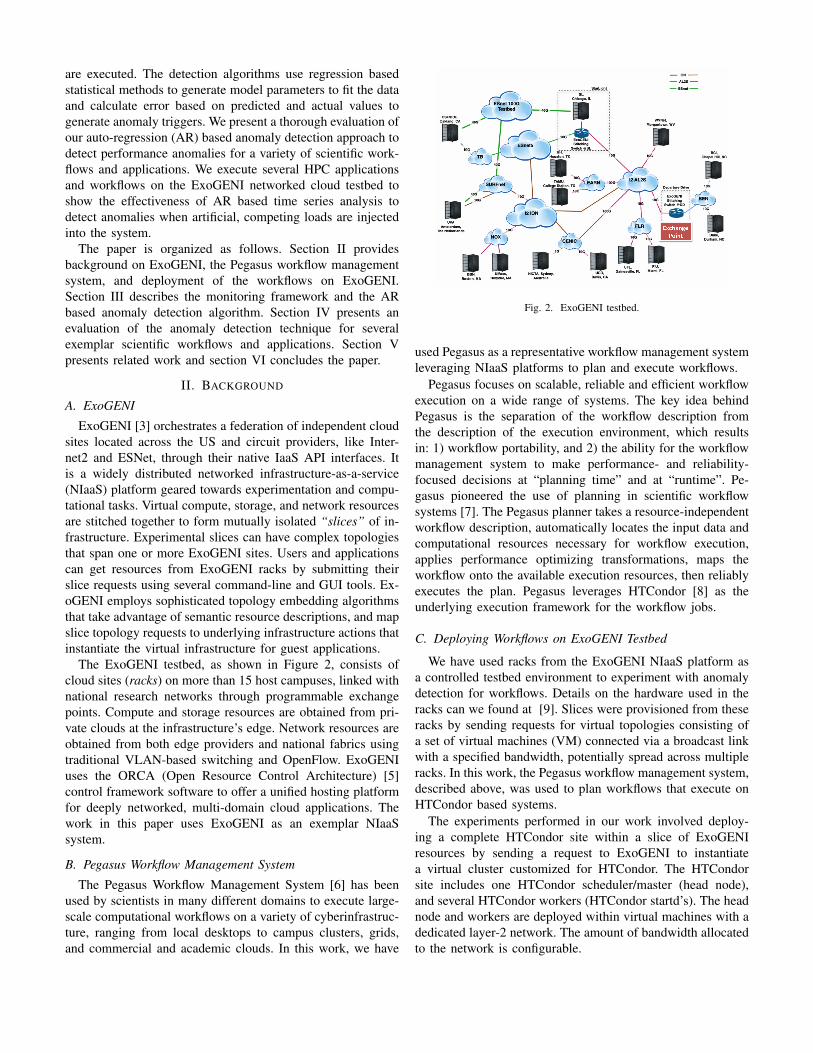
The ExoGENI testbed, as shown in Figure 2, consists ofcloud sites (racks) on more than 15 host campuses, linked withnational research networks through programmable exchangepoints. Compute and storage resources are obtained from pri-vate clouds at the infrastructure’s edge. Network resources areobtained from both edge providers and national fabrics usingtraditional VLAN-based switching and OpenFlow. ExoGENIuses the ORCA (Open Resource Control Architecture) [5]control framework software to offer a unified hosting platformfor deeply networked, multi-domain cloud applications. Thework in this paper uses ExoGENI as an exemplar NIaaSsystem.
B. Pegasus Workflow Management SystemThe Pegasus Workflow Management System [6] has been
used by scientists in many different domains to execute large-scale computational workflows on a variety of cyberinfrastruc-ture, ranging from local desktops to campus clusters, grids,and commercial and academic clouds. In this work, we have
Fig. 2. ExoGENI testbed.
used Pegasus as a representative workflow management systemleveraging NIaaS platforms to plan and execute workflows.
Pegasus focuses on scalable, reliable and efficient workflowexecution on a wide range of systems. The key idea behindPegasus is the separation of the workflow description fromthe description of the execution environment, which resultsin: 1) workflow portability, and 2) the ability for the workflowmanagement system to make performance- and reliability-focused decisions at “planning time” and at “runtime”. Pe-gasus pioneered the use of planning in scientific workflowsystems [7]. The Pegasus planner takes a resource-independentworkflow description, automatically locates the input data andcomputational resources necessary for workflow execution,applies performance optimizing transformations, maps theworkflow onto the available execution resources, then reliablyexecutes the plan. Pegasus leverages HTCondor [8] as theunderlying execution framework for the workflow jobs.
C. Deploying Workflows on ExoGENI Testbed
We have used racks from the ExoGENI NIaaS platform asa controlled testbed environment to experiment with anomalydetection for workflows. Details on the hardware used in theracks can we found at [9]. Slices were provisioned from theseracks by sending requests for virtual topologies consisting ofa set of virtual machines (VM) connected via a broadcast linkwith a specified bandwidth, potentially spread across multipleracks. In this work, the Pegasus workflow management system,described above, was used to plan workflows that execute onHTCondor based systems.
The experiments performed in our work involved deploy-ing a complete HTCondor site within a slice of ExoGENIresources by sending a request to ExoGENI to instantiatea virtual cluster customized for HTCondor. The HTCondorsite includes one HTCondor scheduler/master (head node),and several HTCondor workers (HTCondor startd’s). The headnode and workers are deployed within virtual machines with adedicated layer-2 network. The amount of bandwidth allocatedto the network is configurable.
The VM images had pre-requisite software installed likeHTCondor, Pegasus, including monitoring extensions de-scribed later. The ExoGENI postboot script feature was lever-aged to start various HTCondor daemons on VM startup sothat the HTCondor environment is ready as soon as the slicesetup is complete. In addition, the various scientific workflowsand applications were pre-installed as part of virtual machineimages. In essence, the ExoGENI platform enables users torequest tailored networked cloud infrastructure, which can thenbe used to rapidly deploy applications and science workflowsusing workflow management systems like Pegasus.
III. ANOMALY DETECTION SYSTEM
In this section, we present an overview of the monitoringand data collection architecture for obtaining online perfor-mance data for science workflows and applications running onthe ExoGENI testbed, and how the collected data can be usedfor runtime detection of anomalies using statistical methodsand algorithms. First, we present our monitoring framework.
A. Monitoring and Data Collection Framework
Cloud Infrastructure
Monitoring DB<InfluxDB>
WorkflowMonitor
<monitord>
Real TimeJob Monitor<Kickstart>
MonitoringEvents
ActualPerformance
Workflow Planner
<Pegasus>
Workflow Logs
Workflow Engine<DAGMan>
Job Manager<Condor>
ApplicationJob
Message Broker
<RabbitMQ>
Anomaly DetectionEngine
App MonitoringTimeseries
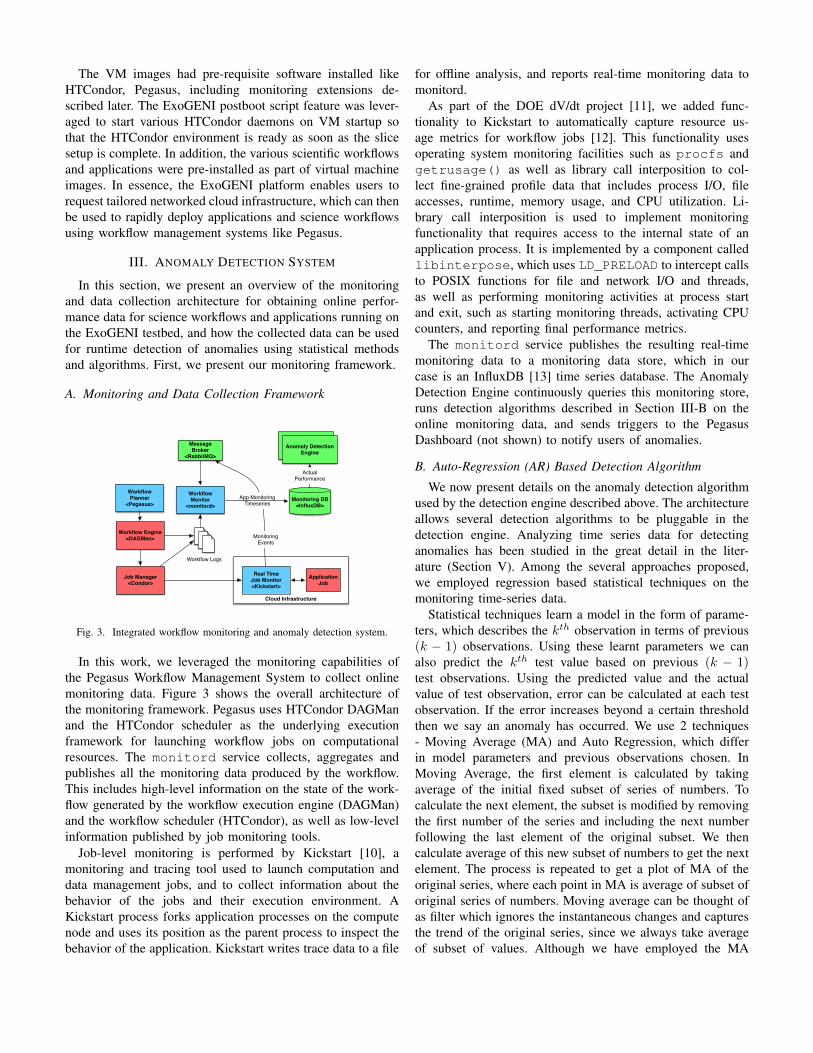
Fig. 3. Integrated workflow monitoring and anomaly detection system.
In this work, we leveraged the monitoring capabilities ofthe Pegasus Workflow Management System to collect onlinemonitoring data. Figure 3 shows the overall architecture ofthe monitoring framework. Pegasus uses HTCondor DAGManand the HTCondor scheduler as the underlying executionframework for launching workflow jobs on computationalresources. The monitord service collects, aggregates andpublishes all the monitoring data produced by the workflow.This includes high-level information on the state of the work-flow generated by the workflow execution engine (DAGMan)and the workflow scheduler (HTCondor), as well as low-levelinformation published by job monitoring tools.
Job-level monitoring is performed by Kickstart [10], amonitoring and tracing tool used to launch computation anddata management jobs, and to collect information about thebehavior of the jobs and their execution environment. AKickstart process forks application processes on the computenode and uses its position as the parent process to inspect thebehavior of the application. Kickstart writes trace data to a file
for offline analysis, and reports real-time monitoring data tomonitord.
As part of the DOE dV/dt project [11], we added func-tionality to Kickstart to automatically capture resource us-age metrics for workflow jobs [12]. This functionality usesoperating system monitoring facilities such as procfs andgetrusage() as well as library call interposition to col-lect fine-grained profile data that includes process I/O, fileaccesses, runtime, memory usage, and CPU utilization. Li-brary call interposition is used to implement monitoringfunctionality that requires access to the internal state of anapplication process. It is implemented by a component calledlibinterpose, which uses LD_PRELOAD to intercept callsto POSIX functions for file and network I/O and threads,as well as performing monitoring activities at process startand exit, such as starting monitoring threads, activating CPUcounters, and reporting final performance metrics.
The monitord service publishes the resulting real-timemonitoring data to a monitoring data store, which in ourcase is an InfluxDB [13] time series database. The AnomalyDetection Engine continuously queries this monitoring store,runs detection algorithms described in Section III-B on theonline monitoring data, and sends triggers to the PegasusDashboard (not shown) to notify users of anomalies.
B. Auto-Regression (AR) Based Detection AlgorithmWe now present details on the anomaly detection algorithm
used by the detection engine described above. The architectureallows several detection algorithms to be pluggable in thedetection engine. Analyzing time series data for detectinganomalies has been studied in the great detail in the liter-ature (Section V). Among the several approaches proposed,we employed regression based statistical techniques on themonitoring time-series data.
Statistical techniques learn a model in the form of parame-ters, which describes the kth observation in terms of previous(k � 1) observations. Using these learnt parameters we canalso predict the kth test value based on previous (k � 1)test observations. Using the predicted value and the actualvalue of test observation, error can be calculated at each testobservation. If the error increases beyond a certain thresholdthen we say an anomaly has occurred. We use 2 techniques- Moving Average (MA) and Auto Regression, which differin model parameters and previous observations chosen. InMoving Average, the first element is calculated by takingaverage of the initial fixed subset of series of numbers. Tocalculate the next element, the subset is modified by removingthe first number of the series and including the next numberfollowing the last element of the original subset. We thencalculate average of this new subset of numbers to get the nextelement. The process is repeated to get a plot of MA of theoriginal series, where each point in MA is average of subset oforiginal series of numbers. Moving average can be thought ofas filter which ignores the instantaneous changes and capturesthe trend of the original series, since we always take averageof subset of values. Although we have employed the MA
approach to detect anomalies in infrastructure time series data,i.e. monitoring data from the infrastructure, the focus of thispaper is on detecting workflow application anomalies. Weemployed the Auto Regression technique for application timeseries data.
The AR model in terms of filter is sometimes referred toas recursive filter or infinite impulse response filter becauseit uses previous values of its own series to calculate thenext value. In AR model of order p, the current term can beestimated by linear weighted sum of previous terms in series.The value of y(t) can be calculated using the followingequation:
y(t) =i=pX
i=1
aiyt�i + ✏
where ai are the AR coefficients, y is the series and p is orderof the AR filter which is usually much less than the actuallength of series y. The noise term in the above equation (✏) isassumed to be Gaussian white noise.
The problem statement in AR is to find the “best” valuesfor ai for a given series y of length N. AR model usuallyassumes series y is linear and stationary and has a zero mean.If the series y does have not have zero mean, we simply adda0 in front of summation in the equation above.
The AR coefficients can be estimated using 3 differenttechniques 1) Yule-Walker method 2) Burg method and 3)Least squares method. The least squares method is basedon the Yule-Walker method of estimating AR coefficients.In our detection framework, we have implemented the leastsquares method to estimate the AR coefficients. The equationto estimate AR coefficients using least square method formodel of order p is given by:
0
BBBBBB@
c11 c12 ... c1pc21 c22 ... c2p. . ... .. . ... .. . ... .
cp1 cp2 ... cpp
1
CCCCCCA
0
BBBBBB@
a1a2...ap
1
CCCCCCA= �
0
BBBBBB@
c01c02...
c0p
1
CCCCCCA
where,
cij = 1/N � pt=NX
t=p+1
yt�iyt�j
and cij is an estimate of the auto-covariance function for delay(i - j) between yt�i and yt�j and N is the length of series. Wesolve the above set of equations to obtain a1, a1 .. ap, whichare estimated coefficients of AR(p) model.
To calculate the optimal value of order of model (p) wemust draw a plot of Root Mean Square (RMS) error vs.order of model. When we gradually increase the order, wesee RMS error keeps on reducing until there is no significanteffect of increasing order on the RMS error. After a certainorder, the RMS error is almost constant and plot of RMSerror vs. order(p) looks like flat line parallel to the X-axis.
The optimal value of order(p) is somewhere near where linestarts to flatten out. More formal techniques like AkaikeInformation Criterion [14] can be used to calculate optimalvalue of p. The advantages of the AR approach are (a) ARmodel can be used when train and test time series are ofdifferent lengths, (b) it does not require a distance measureused in similarity calculations in window and clustering basedtechniques, and (c) it captures the trend of time series usingthe AR coefficients.
We have chosen the above AR technique to detect anomaliesusing our framework. After a series of experiments withdifferent orders for minimizing errors, which are not reportedhere for space limitations, we chose the AR model of order5 to detect anomalies in our application metrics. For eachworkflow application we studied, we first made training runs ofthe workflows to collect the training time series data. The con-trolled testbed environment provided by ExoGENI was criticalto obtaining “clean” training series data. The AR coefficients,and hence the AR(p) model parameters were calculated basedon this offline training data. During future executions of theworkflow applications, we used the AR model to predict thevalue for the next time instant and compared it with the actualonline monitoring data for errors. When errors exceeded acertain threshold (say 20%), we generated anomaly triggers.
IV. EVALUATION
In this section, we present an evaluation of the AR basedanomaly detection approach for several example scientificworkflows and applications running on the ExoGENI cloudtestbed. For each example, we created artificial loads usingcompeting applications or system tools while the workflowapplication is executing, and ran the AR based algorithmto determine errors from predicted metric values to pinpointthe time when an anomaly is triggered. All workflows andapplications were pre-installed in virtual machine images.For the experiments, we used these images to instantiateHTCondor based virtual clusters on-demand on the ExoGENIrack at the Wayne State University (WSU), and then usedPegasus to plan and execute the workflows. We now presentthe results for each workflow/application example.
A. Periodogram WorkflowThe Kepler satellite [15] produces a light curve recording
the brightness of stars over time. Analyzing these light curvesto identify the periodic signals that arise from transiting exo-planets requires the computation of periodograms that revealperiodicities in the time-series data along with estimates oftheir significance. Periodograms are computationally intensive,and the volume of data generated by Kepler requires high-performance processing. The periodogram workflow [16] par-allelizes and distributes the computation of periodograms usingseveral different algorithms and parameter sets over manythousands of light curves.
The periodogram application is computationally intensive,and hence we used a CPU intensive anomaly load generator,a competing application called the Conjugate Gradient (CG)
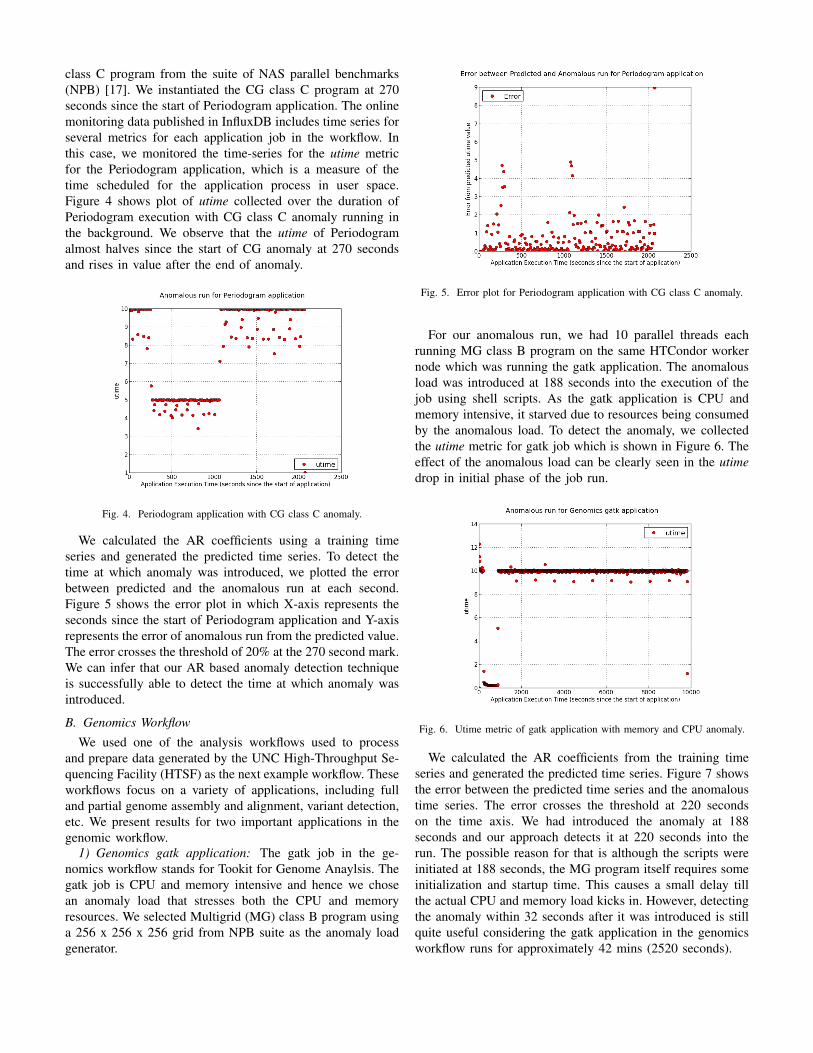
class C program from the suite of NAS parallel benchmarks(NPB) [17]. We instantiated the CG class C program at 270seconds since the start of Periodogram application. The onlinemonitoring data published in InfluxDB includes time series forseveral metrics for each application job in the workflow. Inthis case, we monitored the time-series for the utime metricfor the Periodogram application, which is a measure of thetime scheduled for the application process in user space.Figure 4 shows plot of utime collected over the duration ofPeriodogram execution with CG class C anomaly running inthe background. We observe that the utime of Periodogramalmost halves since the start of CG anomaly at 270 secondsand rises in value after the end of anomaly.
Fig. 4. Periodogram application with CG class C anomaly.
We calculated the AR coefficients using a training timeseries and generated the predicted time series. To detect thetime at which anomaly was introduced, we plotted the errorbetween predicted and the anomalous run at each second.Figure 5 shows the error plot in which X-axis represents theseconds since the start of Periodogram application and Y-axisrepresents the error of anomalous run from the predicted value.The error crosses the threshold of 20% at the 270 second mark.We can infer that our AR based anomaly detection techniqueis successfully able to detect the time at which anomaly wasintroduced.
B. Genomics WorkflowWe used one of the analysis workflows used to process
and prepare data generated by the UNC High-Throughput Se-quencing Facility (HTSF) as the next example workflow. Theseworkflows focus on a variety of applications, including fulland partial genome assembly and alignment, variant detection,etc. We present results for two important applications in thegenomic workflow.
1) Genomics gatk application: The gatk job in the ge-nomics workflow stands for Tookit for Genome Anaylsis. Thegatk job is CPU and memory intensive and hence we chosean anomaly load that stresses both the CPU and memoryresources. We selected Multigrid (MG) class B program usinga 256 x 256 x 256 grid from NPB suite as the anomaly loadgenerator.
Fig. 5. Error plot for Periodogram application with CG class C anomaly.
For our anomalous run, we had 10 parallel threads eachrunning MG class B program on the same HTCondor workernode which was running the gatk application. The anomalousload was introduced at 188 seconds into the execution of thejob using shell scripts. As the gatk application is CPU andmemory intensive, it starved due to resources being consumedby the anomalous load. To detect the anomaly, we collectedthe utime metric for gatk job which is shown in Figure 6. Theeffect of the anomalous load can be clearly seen in the utimedrop in initial phase of the job run.
Fig. 6. Utime metric of gatk application with memory and CPU anomaly.
We calculated the AR coefficients from the training timeseries and generated the predicted time series. Figure 7 showsthe error between the predicted time series and the anomaloustime series. The error crosses the threshold at 220 secondson the time axis. We had introduced the anomaly at 188seconds and our approach detects it at 220 seconds into therun. The possible reason for that is although the scripts wereinitiated at 188 seconds, the MG program itself requires someinitialization and startup time. This causes a small delay tillthe actual CPU and memory load kicks in. However, detectingthe anomaly within 32 seconds after it was introduced is stillquite useful considering the gatk application in the genomicsworkflow runs for approximately 42 mins (2520 seconds).
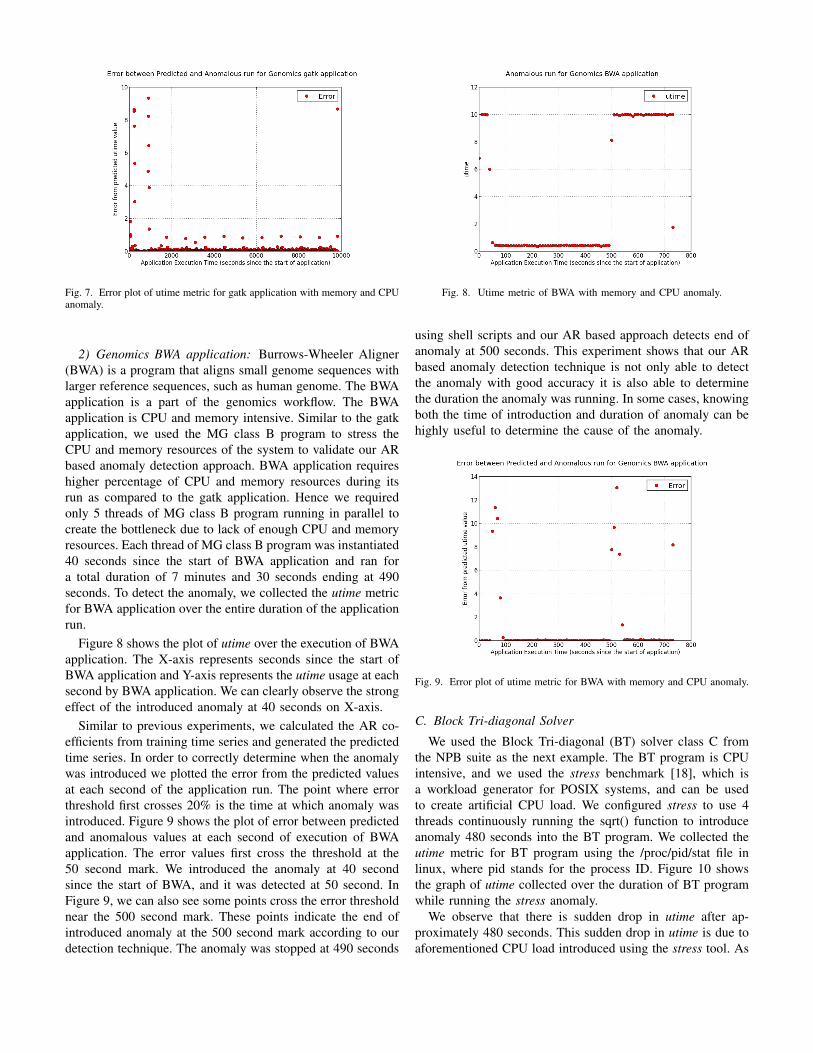
Fig. 7. Error plot of utime metric for gatk application with memory and CPUanomaly.
2) Genomics BWA application: Burrows-Wheeler Aligner(BWA) is a program that aligns small genome sequences withlarger reference sequences, such as human genome. The BWAapplication is a part of the genomics workflow. The BWAapplication is CPU and memory intensive. Similar to the gatkapplication, we used the MG class B program to stress theCPU and memory resources of the system to validate our ARbased anomaly detection approach. BWA application requireshigher percentage of CPU and memory resources during itsrun as compared to the gatk application. Hence we requiredonly 5 threads of MG class B program running in parallel tocreate the bottleneck due to lack of enough CPU and memoryresources. Each thread of MG class B program was instantiated40 seconds since the start of BWA application and ran fora total duration of 7 minutes and 30 seconds ending at 490seconds. To detect the anomaly, we collected the utime metricfor BWA application over the entire duration of the applicationrun.
Figure 8 shows the plot of utime over the execution of BWAapplication. The X-axis represents seconds since the start ofBWA application and Y-axis represents the utime usage at eachsecond by BWA application. We can clearly observe the strongeffect of the introduced anomaly at 40 seconds on X-axis.
Similar to previous experiments, we calculated the AR co-efficients from training time series and generated the predictedtime series. In order to correctly determine when the anomalywas introduced we plotted the error from the predicted valuesat each second of the application run. The point where errorthreshold first crosses 20% is the time at which anomaly wasintroduced. Figure 9 shows the plot of error between predictedand anomalous values at each second of execution of BWAapplication. The error values first cross the threshold at the50 second mark. We introduced the anomaly at 40 secondsince the start of BWA, and it was detected at 50 second. InFigure 9, we can also see some points cross the error thresholdnear the 500 second mark. These points indicate the end ofintroduced anomaly at the 500 second mark according to ourdetection technique. The anomaly was stopped at 490 seconds
Fig. 8. Utime metric of BWA with memory and CPU anomaly.
using shell scripts and our AR based approach detects end ofanomaly at 500 seconds. This experiment shows that our ARbased anomaly detection technique is not only able to detectthe anomaly with good accuracy it is also able to determinethe duration the anomaly was running. In some cases, knowingboth the time of introduction and duration of anomaly can behighly useful to determine the cause of the anomaly.
Fig. 9. Error plot of utime metric for BWA with memory and CPU anomaly.
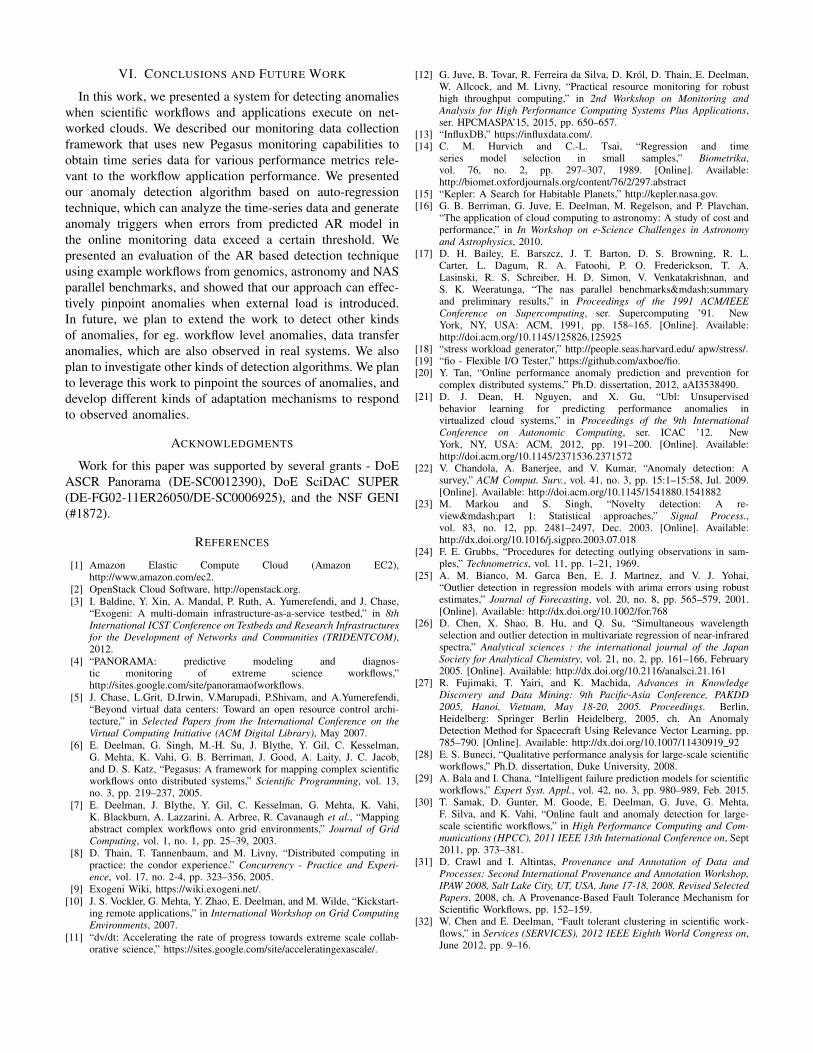
C. Block Tri-diagonal SolverWe used the Block Tri-diagonal (BT) solver class C from
the NPB suite as the next example. The BT program is CPUintensive, and we used the stress benchmark [18], which isa workload generator for POSIX systems, and can be usedto create artificial CPU load. We configured stress to use 4threads continuously running the sqrt() function to introduceanomaly 480 seconds into the BT program. We collected theutime metric for BT program using the /proc/pid/stat file inlinux, where pid stands for the process ID. Figure 10 showsthe graph of utime collected over the duration of BT programwhile running the stress anomaly.
We observe that there is sudden drop in utime after ap-proximately 480 seconds. This sudden drop in utime is due toaforementioned CPU load introduced using the stress tool. As
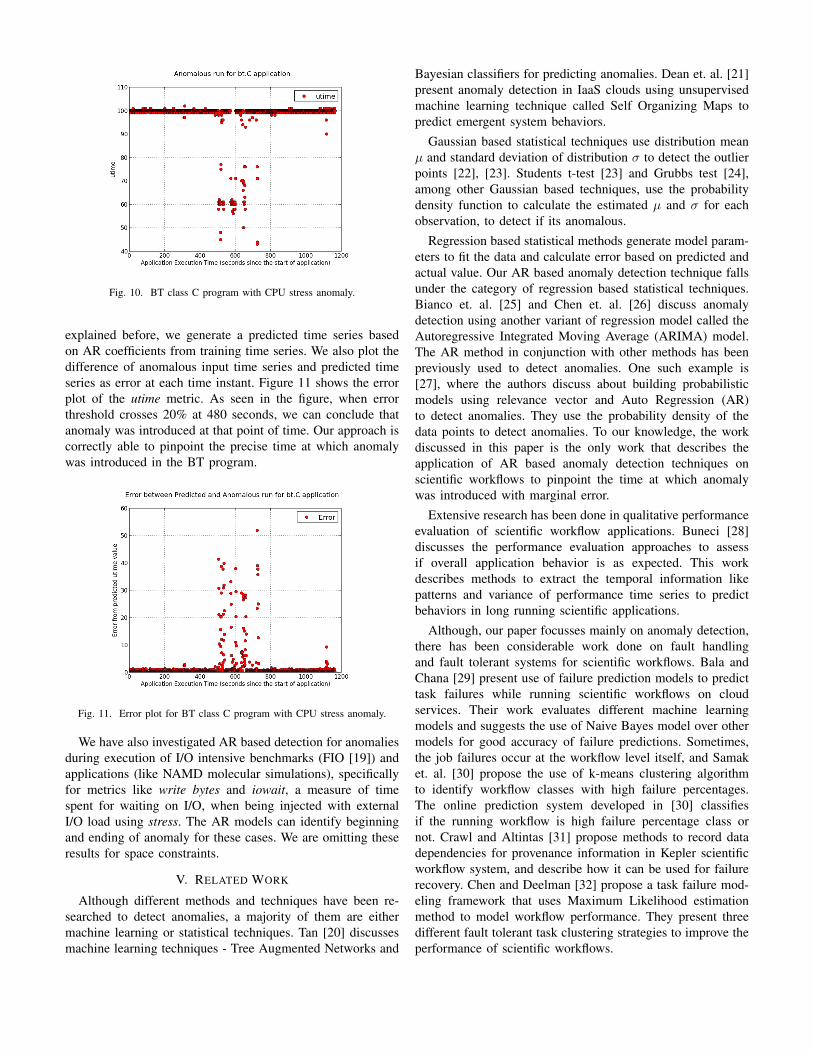
Fig. 10. BT class C program with CPU stress anomaly.
explained before, we generate a predicted time series basedon AR coefficients from training time series. We also plot thedifference of anomalous input time series and predicted timeseries as error at each time instant. Figure 11 shows the errorplot of the utime metric. As seen in the figure, when errorthreshold crosses 20% at 480 seconds, we can conclude thatanomaly was introduced at that point of time. Our approach iscorrectly able to pinpoint the precise time at which anomalywas introduced in the BT program.
Fig. 11. Error plot for BT class C program with CPU stress anomaly.
We have also investigated AR based detection for anomaliesduring execution of I/O intensive benchmarks (FIO [19]) andapplications (like NAMD molecular simulations), specificallyfor metrics like write bytes and iowait, a measure of timespent for waiting on I/O, when being injected with externalI/O load using stress. The AR models can identify beginningand ending of anomaly for these cases. We are omitting theseresults for space constraints.
V. RELATED WORK
Although different methods and techniques have been re-searched to detect anomalies, a majority of them are eithermachine learning or statistical techniques. Tan [20] discussesmachine learning techniques - Tree Augmented Networks and
Bayesian classifiers for predicting anomalies. Dean et. al. [21]present anomaly detection in IaaS clouds using unsupervisedmachine learning technique called Self Organizing Maps topredict emergent system behaviors.
Gaussian based statistical techniques use distribution meanµ and standard deviation of distribution � to detect the outlierpoints [22], [23]. Students t-test [23] and Grubbs test [24],among other Gaussian based techniques, use the probabilitydensity function to calculate the estimated µ and � for eachobservation, to detect if its anomalous.
Regression based statistical methods generate model param-eters to fit the data and calculate error based on predicted andactual value. Our AR based anomaly detection technique fallsunder the category of regression based statistical techniques.Bianco et. al. [25] and Chen et. al. [26] discuss anomalydetection using another variant of regression model called theAutoregressive Integrated Moving Average (ARIMA) model.The AR method in conjunction with other methods has beenpreviously used to detect anomalies. One such example is[27], where the authors discuss about building probabilisticmodels using relevance vector and Auto Regression (AR)to detect anomalies. They use the probability density of thedata points to detect anomalies. To our knowledge, the workdiscussed in this paper is the only work that describes theapplication of AR based anomaly detection techniques onscientific workflows to pinpoint the time at which anomalywas introduced with marginal error.
Extensive research has been done in qualitative performanceevaluation of scientific workflow applications. Buneci [28]discusses the performance evaluation approaches to assessif overall application behavior is as expected. This workdescribes methods to extract the temporal information likepatterns and variance of performance time series to predictbehaviors in long running scientific applications.
Although, our paper focusses mainly on anomaly detection,there has been considerable work done on fault handlingand fault tolerant systems for scientific workflows. Bala andChana [29] present use of failure prediction models to predicttask failures while running scientific workflows on cloudservices. Their work evaluates different machine learningmodels and suggests the use of Naive Bayes model over othermodels for good accuracy of failure predictions. Sometimes,the job failures occur at the workflow level itself, and Samaket. al. [30] propose the use of k-means clustering algorithmto identify workflow classes with high failure percentages.The online prediction system developed in [30] classifiesif the running workflow is high failure percentage class ornot. Crawl and Altintas [31] propose methods to record datadependencies for provenance information in Kepler scientificworkflow system, and describe how it can be used for failurerecovery. Chen and Deelman [32] propose a task failure mod-eling framework that uses Maximum Likelihood estimationmethod to model workflow performance. They present threedifferent fault tolerant task clustering strategies to improve theperformance of scientific workflows.
VI. CONCLUSIONS AND FUTURE WORK
In this work, we presented a system for detecting anomalieswhen scientific workflows and applications execute on net-worked clouds. We described our monitoring data collectionframework that uses new Pegasus monitoring capabilities toobtain time series data for various performance metrics rele-vant to the workflow application performance. We presentedour anomaly detection algorithm based on auto-regressiontechnique, which can analyze the time-series data and generateanomaly triggers when errors from predicted AR model inthe online monitoring data exceed a certain threshold. Wepresented an evaluation of the AR based detection techniqueusing example workflows from genomics, astronomy and NASparallel benchmarks, and showed that our approach can effec-tively pinpoint anomalies when external load is introduced.In future, we plan to extend the work to detect other kindsof anomalies, for eg. workflow level anomalies, data transferanomalies, which are also observed in real systems. We alsoplan to investigate other kinds of detection algorithms. We planto leverage this work to pinpoint the sources of anomalies, anddevelop different kinds of adaptation mechanisms to respondto observed anomalies.
ACKNOWLEDGMENTS
Work for this paper was supported by several grants - DoEASCR Panorama (DE-SC0012390), DoE SciDAC SUPER(DE-FG02-11ER26050/DE-SC0006925), and the NSF GENI(#1872).
REFERENCES
[1] Amazon Elastic Compute Cloud (Amazon EC2),http://www.amazon.com/ec2.
[2] OpenStack Cloud Software, http://openstack.org.[3] I. Baldine, Y. Xin, A. Mandal, P. Ruth, A. Yumerefendi, and J. Chase,
“Exogeni: A multi-domain infrastructure-as-a-service testbed,” in 8thInternational ICST Conference on Testbeds and Research Infrastructuresfor the Development of Networks and Communities (TRIDENTCOM),2012.
[4] “PANORAMA: predictive modeling and diagnos-tic monitoring of extreme science workflows,”http://sites.google.com/site/panoramaofworkflows.
[5] J. Chase, L.Grit, D.Irwin, V.Marupadi, P.Shivam, and A.Yumerefendi,“Beyond virtual data centers: Toward an open resource control archi-tecture,” in Selected Papers from the International Conference on theVirtual Computing Initiative (ACM Digital Library), May 2007.
[6] E. Deelman, G. Singh, M.-H. Su, J. Blythe, Y. Gil, C. Kesselman,G. Mehta, K. Vahi, G. B. Berriman, J. Good, A. Laity, J. C. Jacob,and D. S. Katz, “Pegasus: A framework for mapping complex scientificworkflows onto distributed systems,” Scientific Programming, vol. 13,no. 3, pp. 219–237, 2005.
[7] E. Deelman, J. Blythe, Y. Gil, C. Kesselman, G. Mehta, K. Vahi,K. Blackburn, A. Lazzarini, A. Arbree, R. Cavanaugh et al., “Mappingabstract complex workflows onto grid environments,” Journal of GridComputing, vol. 1, no. 1, pp. 25–39, 2003.
[8] D. Thain, T. Tannenbaum, and M. Livny, “Distributed computing inpractice: the condor experience.” Concurrency - Practice and Experi-ence, vol. 17, no. 2-4, pp. 323–356, 2005.
[9] Exogeni Wiki, https://wiki.exogeni.net/.[10] J. S. Vockler, G. Mehta, Y. Zhao, E. Deelman, and M. Wilde, “Kickstart-
ing remote applications,” in International Workshop on Grid ComputingEnvironments, 2007.
[11] “dv/dt: Accelerating the rate of progress towards extreme scale collab-orative science,” https://sites.google.com/site/acceleratingexascale/.
[12] G. Juve, B. Tovar, R. Ferreira da Silva, D. Krol, D. Thain, E. Deelman,W. Allcock, and M. Livny, “Practical resource monitoring for robusthigh throughput computing,” in 2nd Workshop on Monitoring andAnalysis for High Performance Computing Systems Plus Applications,ser. HPCMASPA’15, 2015, pp. 650–657.
[13] “InfluxDB,” https://influxdata.com/.[14] C. M. Hurvich and C.-L. Tsai, “Regression and time
series model selection in small samples,” Biometrika,vol. 76, no. 2, pp. 297–307, 1989. [Online]. Available:http://biomet.oxfordjournals.org/content/76/2/297.abstract
[15] “Kepler: A Search for Habitable Planets,” http://kepler.nasa.gov.[16] G. B. Berriman, G. Juve, E. Deelman, M. Regelson, and P. Plavchan,
“The application of cloud computing to astronomy: A study of cost andperformance,” in In Workshop on e-Science Challenges in Astronomyand Astrophysics, 2010.
[17] D. H. Bailey, E. Barszcz, J. T. Barton, D. S. Browning, R. L.Carter, L. Dagum, R. A. Fatoohi, P. O. Frederickson, T. A.Lasinski, R. S. Schreiber, H. D. Simon, V. Venkatakrishnan, andS. K. Weeratunga, “The nas parallel benchmarks—summaryand preliminary results,” in Proceedings of the 1991 ACM/IEEEConference on Supercomputing, ser. Supercomputing ’91. NewYork, NY, USA: ACM, 1991, pp. 158–165. [Online]. Available:http://doi.acm.org/10.1145/125826.125925
[18] “stress workload generator,” http://people.seas.harvard.edu/ apw/stress/.[19] “fio - Flexible I/O Tester,” https://github.com/axboe/fio.[20] Y. Tan, “Online performance anomaly prediction and prevention for
complex distributed systems,” Ph.D. dissertation, 2012, aAI3538490.[21] D. J. Dean, H. Nguyen, and X. Gu, “Ubl: Unsupervised
behavior learning for predicting performance anomalies invirtualized cloud systems,” in Proceedings of the 9th InternationalConference on Autonomic Computing, ser. ICAC ’12. NewYork, NY, USA: ACM, 2012, pp. 191–200. [Online]. Available:http://doi.acm.org/10.1145/2371536.2371572
[22] V. Chandola, A. Banerjee, and V. Kumar, “Anomaly detection: Asurvey,” ACM Comput. Surv., vol. 41, no. 3, pp. 15:1–15:58, Jul. 2009.[Online]. Available: http://doi.acm.org/10.1145/1541880.1541882
[23] M. Markou and S. Singh, “Novelty detection: A re-view—part 1: Statistical approaches,” Signal Process.,vol. 83, no. 12, pp. 2481–2497, Dec. 2003. [Online]. Available:http://dx.doi.org/10.1016/j.sigpro.2003.07.018
[24] F. E. Grubbs, “Procedures for detecting outlying observations in sam-ples,” Technometrics, vol. 11, pp. 1–21, 1969.
[25] A. M. Bianco, M. Garca Ben, E. J. Martnez, and V. J. Yohai,“Outlier detection in regression models with arima errors using robustestimates,” Journal of Forecasting, vol. 20, no. 8, pp. 565–579, 2001.[Online]. Available: http://dx.doi.org/10.1002/for.768
[26] D. Chen, X. Shao, B. Hu, and Q. Su, “Simultaneous wavelengthselection and outlier detection in multivariate regression of near-infraredspectra,” Analytical sciences : the international journal of the JapanSociety for Analytical Chemistry, vol. 21, no. 2, pp. 161–166, February2005. [Online]. Available: http://dx.doi.org/10.2116/analsci.21.161
[27] R. Fujimaki, T. Yairi, and K. Machida, Advances in KnowledgeDiscovery and Data Mining: 9th Pacific-Asia Conference, PAKDD2005, Hanoi, Vietnam, May 18-20, 2005. Proceedings. Berlin,Heidelberg: Springer Berlin Heidelberg, 2005, ch. An AnomalyDetection Method for Spacecraft Using Relevance Vector Learning, pp.785–790. [Online]. Available: http://dx.doi.org/10.1007/11430919 92
[28] E. S. Buneci, “Qualitative performance analysis for large-scale scientificworkflows,” Ph.D. dissertation, Duke University, 2008.
[29] A. Bala and I. Chana, “Intelligent failure prediction models for scientificworkflows,” Expert Syst. Appl., vol. 42, no. 3, pp. 980–989, Feb. 2015.
[30] T. Samak, D. Gunter, M. Goode, E. Deelman, G. Juve, G. Mehta,F. Silva, and K. Vahi, “Online fault and anomaly detection for large-scale scientific workflows,” in High Performance Computing and Com-munications (HPCC), 2011 IEEE 13th International Conference on, Sept2011, pp. 373–381.
[31] D. Crawl and I. Altintas, Provenance and Annotation of Data andProcesses: Second International Provenance and Annotation Workshop,IPAW 2008, Salt Lake City, UT, USA, June 17-18, 2008. Revised SelectedPapers, 2008, ch. A Provenance-Based Fault Tolerance Mechanism forScientific Workflows, pp. 152–159.
[32] W. Chen and E. Deelman, “Fault tolerant clustering in scientific work-flows,” in Services (SERVICES), 2012 IEEE Eighth World Congress on,June 2012, pp. 9–16.