Embed Size (px)
Citation preview
FACTA UNIVERSITATIS Series: Working and Living Environmental Protection Vol. 5, No 1, 2008, pp. 11 - 23
INDUSTRIAL NOISE MODELLING AND MAPPING - THE CASE OF A CEMENT FACTORY
UDC 534.835:7.021.23
Momir Praščević, Dragan Cvetković, Darko Mihajlov
Faculty of Occupational Safety in Niš, Laboratory for Noise and Vibration, 18000 Niš, Čarnojevića 10a, E-mail: [email protected]
Abstract. Noise pollution is closely related to human activity and generally occurs where this activity is concentrated, typically in urban areas. Occupational noise is also one of the most important problems which affect millions of workers around the world as well as residential areas near industrial plants. The new strategy in fighting against noise in the 21st century with the basic aim that "no person should be exposed to noise levels which endanger health and quality of life" is based on the European directive 2002/49/EC. According to this directive, the design of strategic noise maps is the initial step in carrying out the following activities: developing and implementing action plans for noise reduction and informing the public about noise exposure. Strategic noise maps put a special emphasis on road and rail traffic, airports and industrial activity sites. Industrial activities near residential areas have an unavoidable influence on the environment and the noise level to which residents are exposed. Industrial noise maps that point to dominant noise sources and to environment noise levels are necessary for the assessment of industrial activity influence on the environment. Noise mapping is the initial step in informing the public about noise exposure and the development of action plans for noise reduction. An example of designing of noise map for a cement factory will be given in this paper.
Key Words: industrial noise, noise map, noise modeling, noise mapping
1. INTRODUCTION Nearly all human activities and technical equipment associated with them generate
sound. Most of these sounds either exceed acceptable levels or provide no benefit to the person exposed to them and are hence unwanted, annoying, disturbing or even damaging to health. In this case, sound is perceived as noise and it is necessary to take measures for noise reduction.
In the past, noise policy in Europe was divided into two major categories, EU legisla-tion on noise emission by products (cars, trucks, aircraft and individual equipment) and Member State legislation on allowable noise levels in the residential environment [1].
Received October 30, 2008
M. PRAŠČEVIĆ, D. CVETKOVIĆ, D. MIHAJLOV 12
Although noise limits have become increasingly stringent over the years, no corre-sponding significant reduction in noise emission in residential areas has been observed. It was estimated in 1996 that in the European Union about 80 million people were exposed to noise levels considered unacceptable because they lead to sleep disturbance and other adverse health effects. It was estimated that a further 170 million people live in the so called »grey areas« where noise causes serious annoyance.
In response to this unsatisfactory situation, the European noise policy was revised to focus on noise reception. Thus, the Green Paper of 1996 [2] defines as the aim of future noise policy that »no person should be exposed to noise levels which endanger health and quality of life«. Although targets in relation to this objective were only set up to the year 2000, the aim continues to be valid and has been adopted as the long-term goal because the estimation from 2004 points out that 100 million people are exposed to noise levels considered unacceptable and a further 300 million people live in the so called »grey ar-eas«. The increasing number of exposed people is partly a consequence of the increasing number of Member States but also the increasing number of sound sources.
In order to improve the situation, the Commission had suggested a new framework for future action starting with »a proposal for a directive providing for the harmonization of methods of assessment of noise exposure and the mutual exchange of information. The proposal could include recommendations for noise mapping and provision of information on noise exposure to the public. In the second stage, consideration could be given to the establishment of target values and the obligation to take action to reach the targets«.
Bearing in mind the vision for 2020 »to avoid harmful effects of noise exposure from all sources and to preserve quiet areas«, the new strategy for noise control focuses on the two cornerstones of the European noise policy, the Environmental Noise Directive [3] with its three elements of assessment, action and information, and the emission related legislation for controlling noise at the source [4].
The aim of the Environmental Noise Directive is to provide for a common approach to the avoidance, prevention and reduction of the harmful effects of exposure to environ-mental noise. The Directive seeks to harmonize noise indicators and assessment methods for environmental noise. Using these common indicators and assessment methods, it seeks to gather information in the form of ‘strategic noise maps’. Such information will be made available to the public and will form the basis for ‘action plans’ at the local level. The Directive does not seek to set common EU-wide noise limits. The setting of limits re-mains the responsibility of Member States.
The Directive applies to environmental noise to which humans are exposed, particu-larly in built-up areas, public parks, quiet parts of urban areas, quiet areas in the open country and near schools, hospitals and other sensitive buildings and areas. It focuses ex-plicitly on major roads, major railways and major airports.
The basis for the assessment of environmental noise are strategic noise maps, which are to be established by common noise indicators and methods for all key sound sources (road, rail, airport and industrial plants). On the basis of the assessment provided by the strategic noise maps, competent authorities must draw up action plans to reduce noise where it is necessary and to maintain environmental noise quality where it is good. Typi-cal examples of action plans might include:
• traffic planning (including redirection of traffic, shifts between transport modes e.g. from road to rail transport);
• land-use planning;
Industrial Noise Modelling and Mapping - The Case of a Cement Factory 13
• technical measures at noise sources (including road surfaces and railway tracks); • selection of quieter sources; • reduction of sound propagation (noise barriers, tunnels, insulation of dwellings etc.). The third key element of the Directive, information for the public, comprises noise
maps and action plans. It will establish an information database of noise maps and publish summary reports on noise maps and action plans every five years.
Industrial activities near residential areas have an unavoidable influence on the envi-ronment and the noise level to which residents are exposed. Industrial noise maps that point to dominant noise sources and to environment noise levels are necessary for the assessment of industrial activity influence on the environment.
Although national legislation is not harmonized with the European directives, the management of the cement factory “Holcim” in Serbia, starting from the adopted envi-ronment policy, has decided to design noise maps for the assessment of noise levels at the factory location and its environment.
A noise map should be the starting basis for noise management by creating an action plan to reduce the level of noise at the factory location and its surroundings and inform the public about the state of the noise and the effects of noise on the health of the population.
An example of the impact assessment of industrial activity on the environment noise level will be shown in this paper in the case of the technological process of cement pro-duction in the factory "Holcim” in Serbia.
2. THE TECHNOLOGICAL PROCESS OF CEMENT PRODUCTION
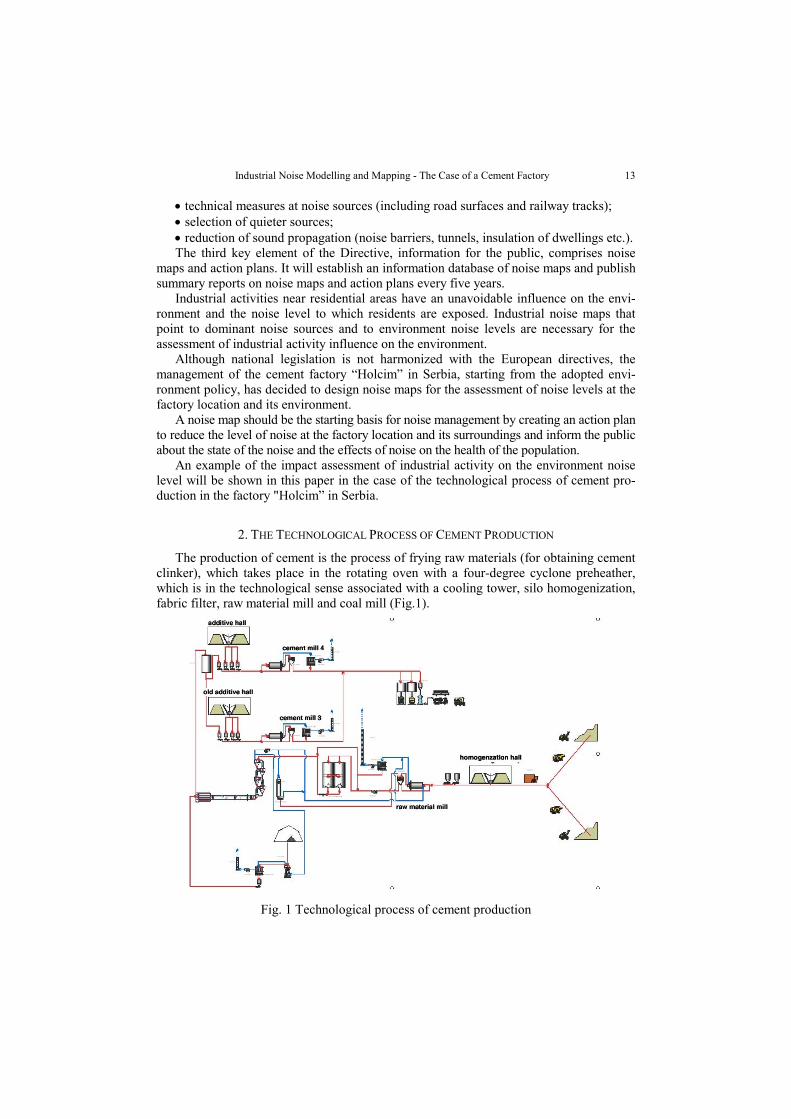
The production of cement is the process of frying raw materials (for obtaining cement clinker), which takes place in the rotating oven with a four-degree cyclone preheather, which is in the technological sense associated with a cooling tower, silo homogenization, fabric filter, raw material mill and coal mill (Fig.1).
Fig. 1 Technological process of cement production
M. PRAŠČEVIĆ, D. CVETKOVIĆ, D. MIHAJLOV 14
The technological process is shown in Fig. 1 and clearly defines all potential sources of noise that are taken into account in the noise mapping of the factory and its environment.
3. PROJECT TASK DESCRIPTION
The aim of the acoustic map of the industrial noise of the cement factory was to de-termine the dominant sources of noise at the Holcim facility (Serbia) which have the most significant impact on the noise level in the environment and to create a noise map as the basis for the creation of action plans that would result in lowering the noise level.
The purpose of the project was to create a noise map that would be the basis for the implementation of future activities of the management of cement factories, which can be grouped into the following groups:
• "fighting" against the noise with planned measures for its reduction, • informing the public about the state of the level of noise, • resolving the complaints of citizens, • planning the future development of factories, • tracking changes by updating the noise map.
4. PROJECT IMPLEMENTATION
The project is being implemented in several phases: • collecting data about the terrain, the buildings in the area of the factory and its envi-
ronment and the noise sources • creating a digital model of the terrain, buildings and noise sources • calculating the noise levels at the individual points and grid points • tabular and graphical presentations of the obtained results, • verification of the model and the results by measuring noise levels at the calibration
points. For the realization of the mentioned phase of the project the following activities were
carried out: • digitizing the terrain of the cement factory and the Popovac village; • digitizing all the buildings in the cement factory area (about 70 objects) defining
their spatial limits, heights and reflective characteristics; • digitizing all the buildings in the Popovac village (about 300 objects) defining their
spatial limits, heights and reflective characteristics; • digitizing all noise sources in the cement factory, stationary and moving (conveyor belts),
defining their spatial limits, heights, emission characteristics (level of noise emission and noise character - tonal, impulse ...), directivity and time interval to utilize sources;
• digitizing receivers - calibration points in the boundary of the cement factory (free-field receivers) and in the area of the Popovac village (façade receivers) - a total of 50 points;
• creating and checking the model of the terrain, buildings, noise sources and the receivers based on the 3D model;
• calculation of noise levels using the standard ISO 9613-2 at a height of 1.5m above the ground at the grid points with a grid increment of 5m;
• calculation of noise levels using the standard ISO 9613-2 at a height of 1.5m above the ground at the calibration points;
Industrial Noise Modelling and Mapping - The Case of a Cement Factory 15
• creating the noise map based on the calculated noise levels for the day time and night time period;
• calibration of the noise map; • calibration points; • printing the noise map for the day time and night time period. The software package LIMA, version 5.1.05 [5], with all the modules that enable the
creation of models, calculation of the noise level and presentation of the results was used to create the model and the noise map.
The international standard ISO 9613-2 [5] that describes the noise propagation in free-field conditions was used as a model for the prediction of the noise level and estimated state of the noise level in the areas of larger dimensions, such as residential areas, areas next to motorways, main rail routes, airport and industrial complexes.
5. RESULTS
5.1 Creating a model for buildings and terrain
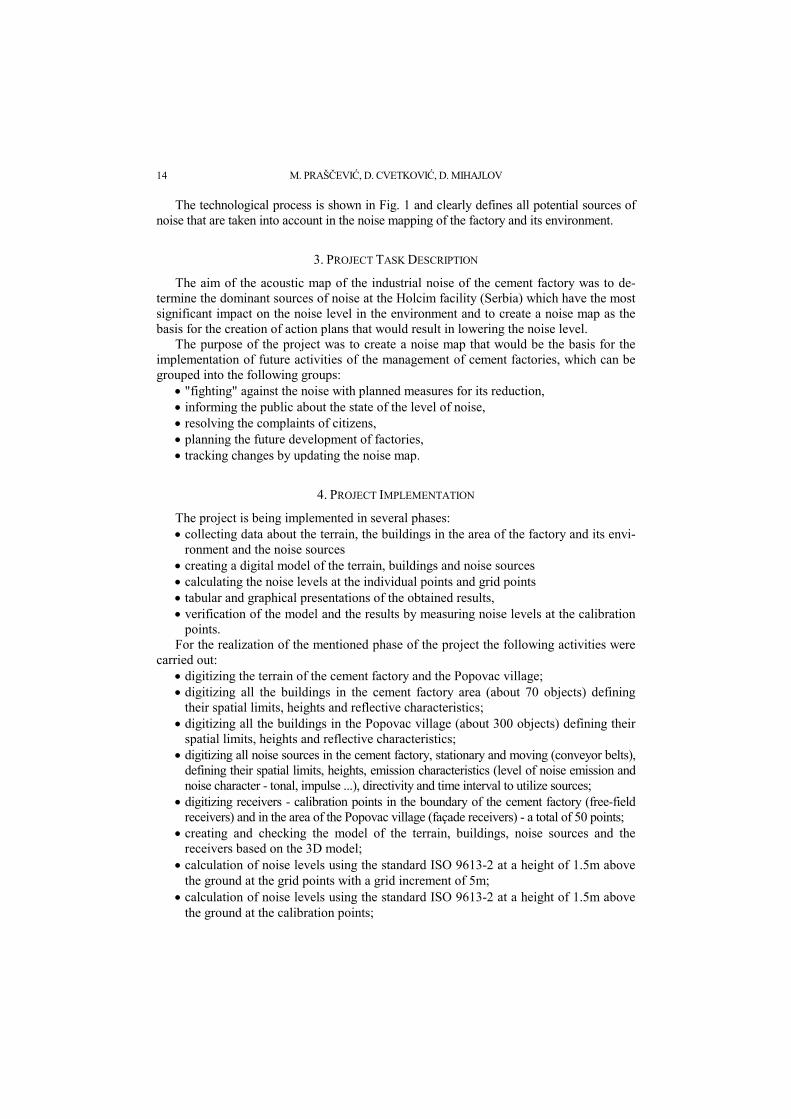
The digital model of terrain and building in the area of Holcim cement factory (Ser-bia) was created on the basis of:
• the orthophoto clip from the year 2004, dimensions of 3x2.7km2; • the real estate registry background from the year 1937, and • the AutoCAD background of buildings in area of the cement factory. The procedure of creating a model of the terrain and buildings included the following steps: 1. Setting the model size and the area which includes all the potential noise sources,
barriers and receivers. 2. Importing the orthophoto clip, the real estate registry background and the Auto-
CAD background and their overlap, and calibration. 3. Digitization of buildings with setting the reflective feature of the facades and the
height of the buildings. 4. Digitization of the terrain on the basis of contour lines and data about the altitude
in the form of points. 5. Digitization of topographic terrain by entering data on the green and concrete surfaces Digital 3D model of the errain and objects is shown in Fig. 2.
Fig. 2 3D model of the terrain and objects
M. PRAŠČEVIĆ, D. CVETKOVIĆ, D. MIHAJLOV 16
A large number of objects, the complex structure and geometry of the objects brought about the occasional problems in the digitalization of the objects, but once they were solved, important results were obtained that help in the digitalization and the creation of models of terrain and buildings.
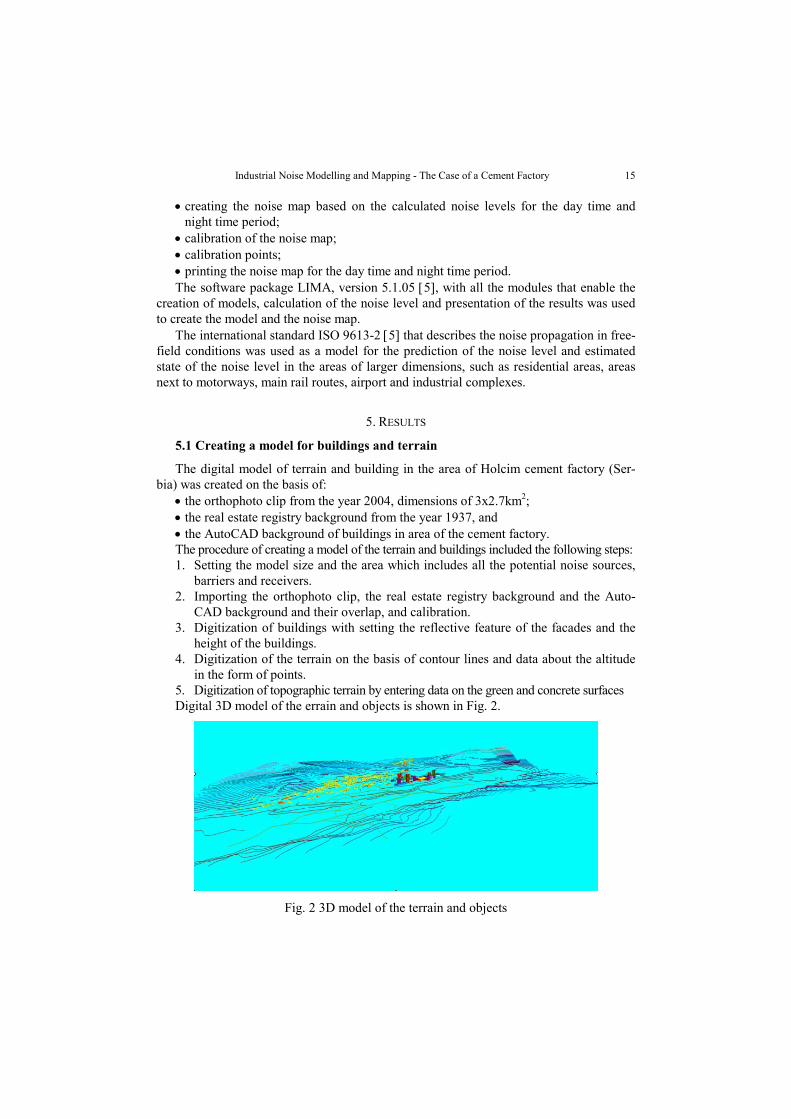
1. Creating buildings that are located one above the other at different levels. If we do not use an attribute that defines the level of the building, an inadequate model
is obtained. Case study: the silo on top of which there are plants with complex geometry (Fig. 3):
Fig. 3 Poorly designed model of objects at different levels
The model shown on Fig. 3 is designed by following LIMA commands: HIN 1 Z 45 R; the silo on the right side of the figure; HIN 2 Z 2 D; the plant placed directly onto the silo; HIN 3 Z 5 D; the platform where the second plant is placed; HIN 4 Z 3 D; the plant on the platform. If the attribute that defines the levels of the objects is used in the design of the build-
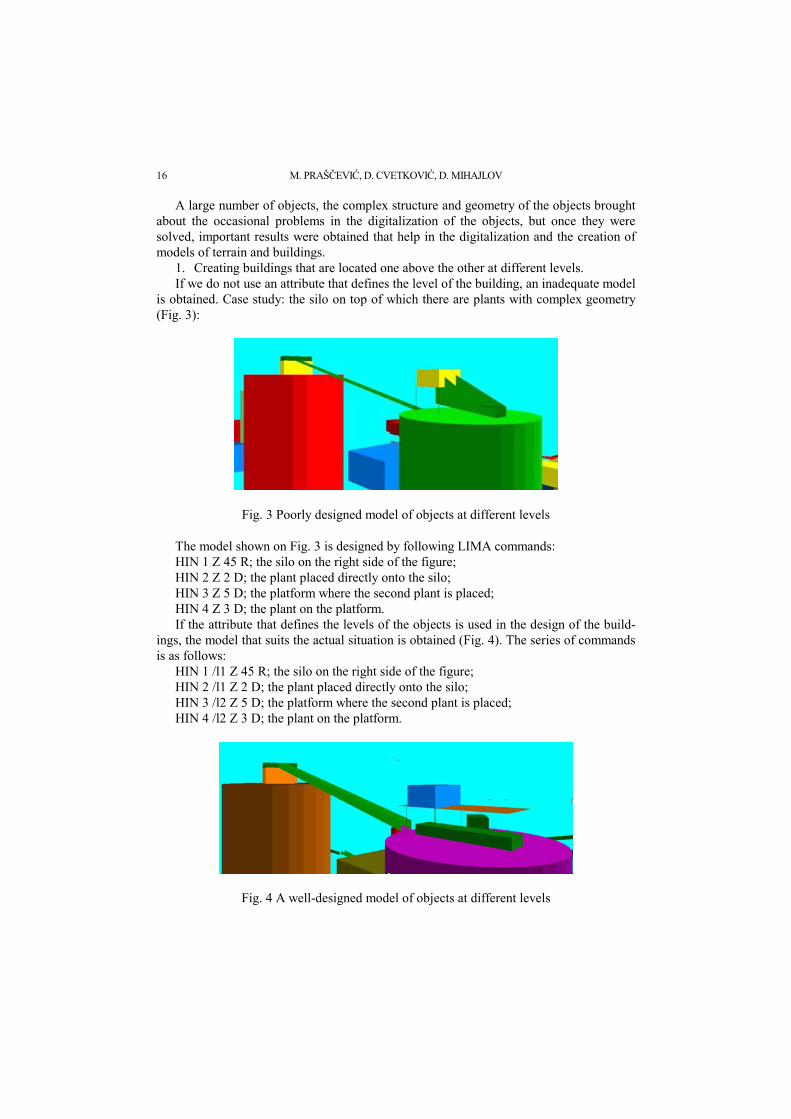
ings, the model that suits the actual situation is obtained (Fig. 4). The series of commands is as follows:
HIN 1 /l1 Z 45 R; the silo on the right side of the figure; HIN 2 /l1 Z 2 D; the plant placed directly onto the silo; HIN 3 /l2 Z 5 D; the platform where the second plant is placed; HIN 4 /l2 Z 3 D; the plant on the platform.
Fig. 4 A well-designed model of objects at different levels
Industrial Noise Modelling and Mapping - The Case of a Cement Factory 17
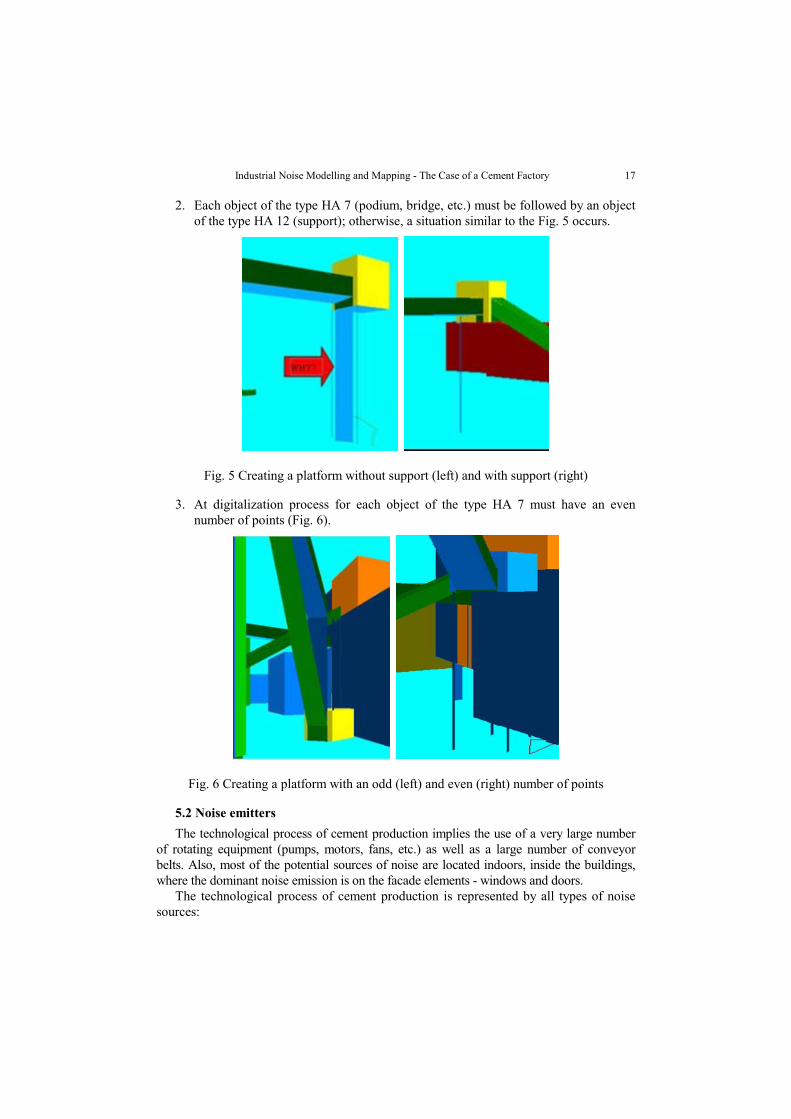
2. Each object of the type HA 7 (podium, bridge, etc.) must be followed by an object of the type HA 12 (support); otherwise, a situation similar to the Fig. 5 occurs.
Fig. 5 Creating a platform without support (left) and with support (right)
3. At digitalization process for each object of the type HA 7 must have an even number of points (Fig. 6).
Fig. 6 Creating a platform with an odd (left) and even (right) number of points
5.2 Noise emitters The technological process of cement production implies the use of a very large number
of rotating equipment (pumps, motors, fans, etc.) as well as a large number of conveyor belts. Also, most of the potential sources of noise are located indoors, inside the buildings, where the dominant noise emission is on the facade elements - windows and doors.
The technological process of cement production is represented by all types of noise sources:
M. PRAŠČEVIĆ, D. CVETKOVIĆ, D. MIHAJLOV 18
• point sources (pumps, motors, fans, etc), • line sources (conveyor belts, etc), and • area sources (windows and doors on buildings where the noise sources are located). Since the Holcim cement factory (Serbia) had no data about the emissions of potential
noise sources, it was up to the procedure to define the activities of potential noise sources at exactly the defined distance from the noise source. Noise level data at these points were used in the process of further defining the emission noise sources.
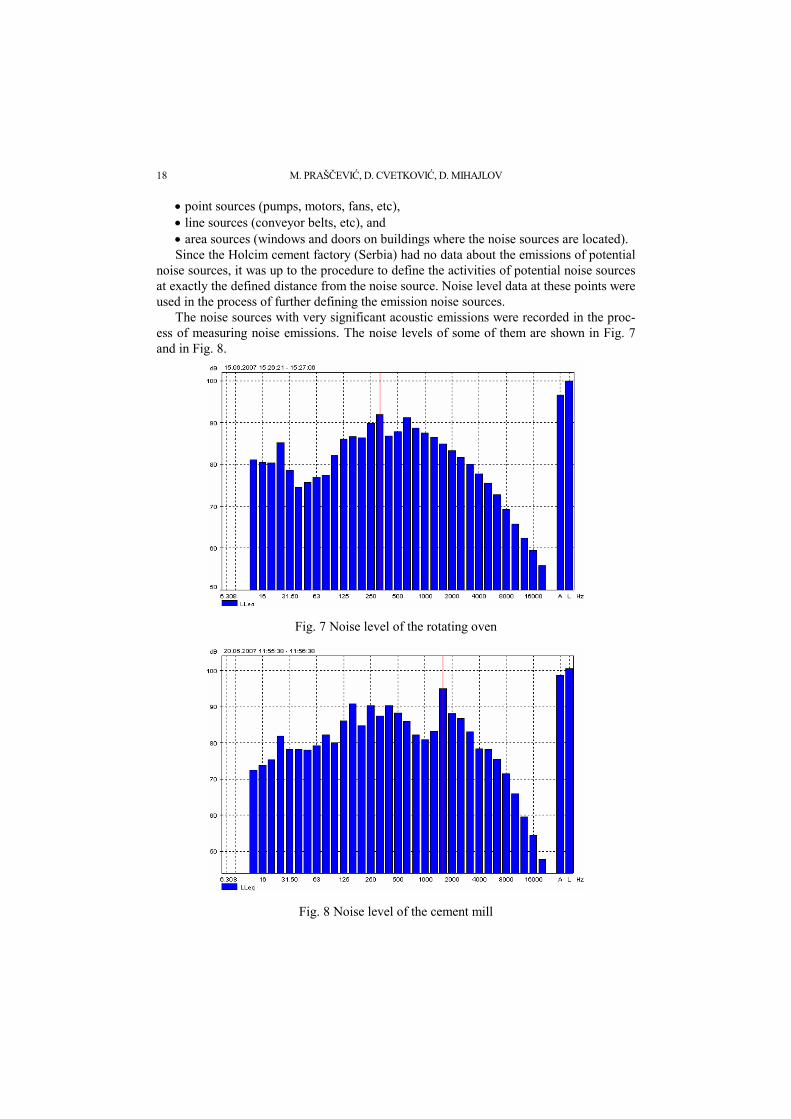
The noise sources with very significant acoustic emissions were recorded in the proc-ess of measuring noise emissions. The noise levels of some of them are shown in Fig. 7 and in Fig. 8.
Fig. 7 Noise level of the rotating oven
Fig. 8 Noise level of the cement mill
Industrial Noise Modelling and Mapping - The Case of a Cement Factory 19
The emission quantity of noise sources (sound power level) is determined using the module of the LIMA software package that allows us to determine the level of sound power for the selected noise sources based on the noise level at the defined points in the vicinity of the potential noise sources. For this purpose it is necessary to add the attribute /EMG for noise sources and the attribute /MEP for receiving points, followed by meas-ured noise levels for the day time and night time period. Examples of the commands are:
IND /EMG 01; sources group No. 1; IND /EMG 02; sources group No. 2; AUF /MEP1 50.2 90.5; receiver No. 1 with day noise level of 50.2dB and night noise
level of 90.5; AUF /MEP2 98.5 80.5; receiver No. 2 with day noise level of 50.2dB and night noise
level of 90.5; The number of receivers and sources does not have to be identical. After the start of
the calculation, the calculated data are moved to the file NameOfProjectKON.BNA.
5.3 Noise map
On the basis the digital model whose general features are:
• number of emitters - 97 • number of buildings - 1407 • number of receivers - 130 • number of terrain objects - 752
the calculation of the noise level was done using the calculation model defined in the ISO 9613-2 for this case:
a. at single points at a height of 1.5m and b. at grid points at a height of 1.5m above the ground and with a grid increment of 5m;
The calculations included all the noise sources in the 2.5km distance from the referent point.
While the calculation for single points was relatively quick (about 250s), the calcula-tion at the grid points for the entire model took about 5 days. The division of the model into 16 segments enabled the calculation to be rapid and last about 2 days.
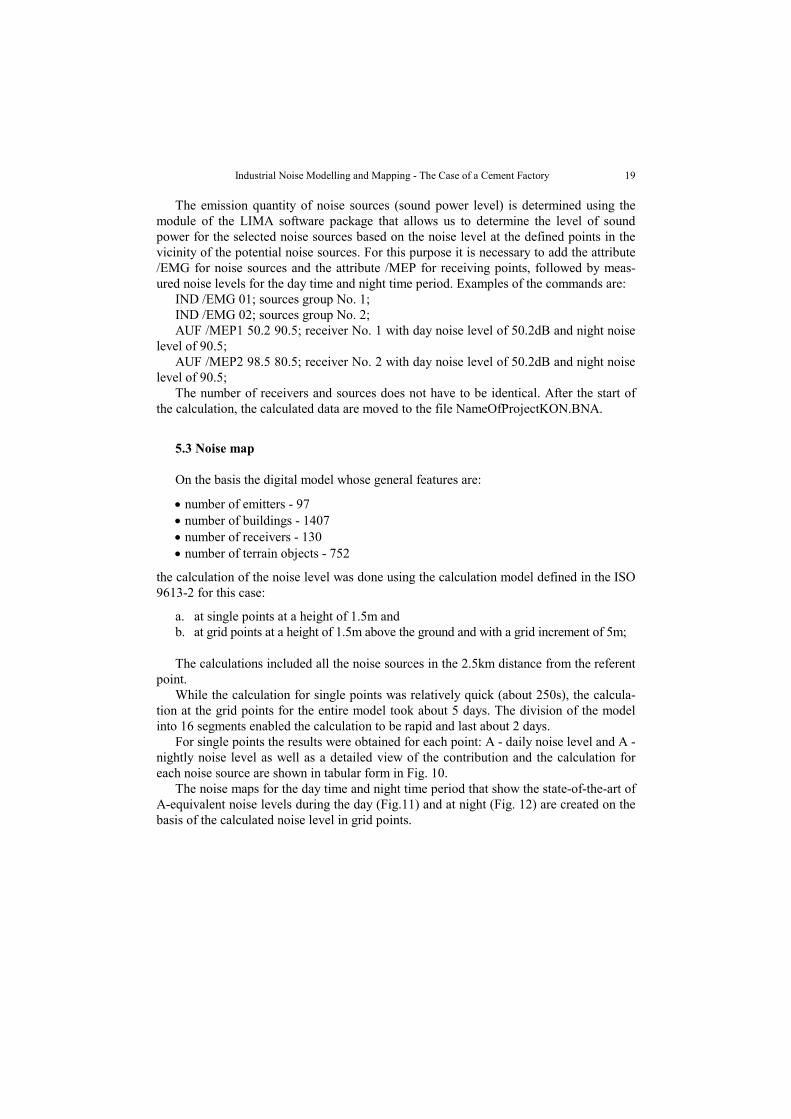
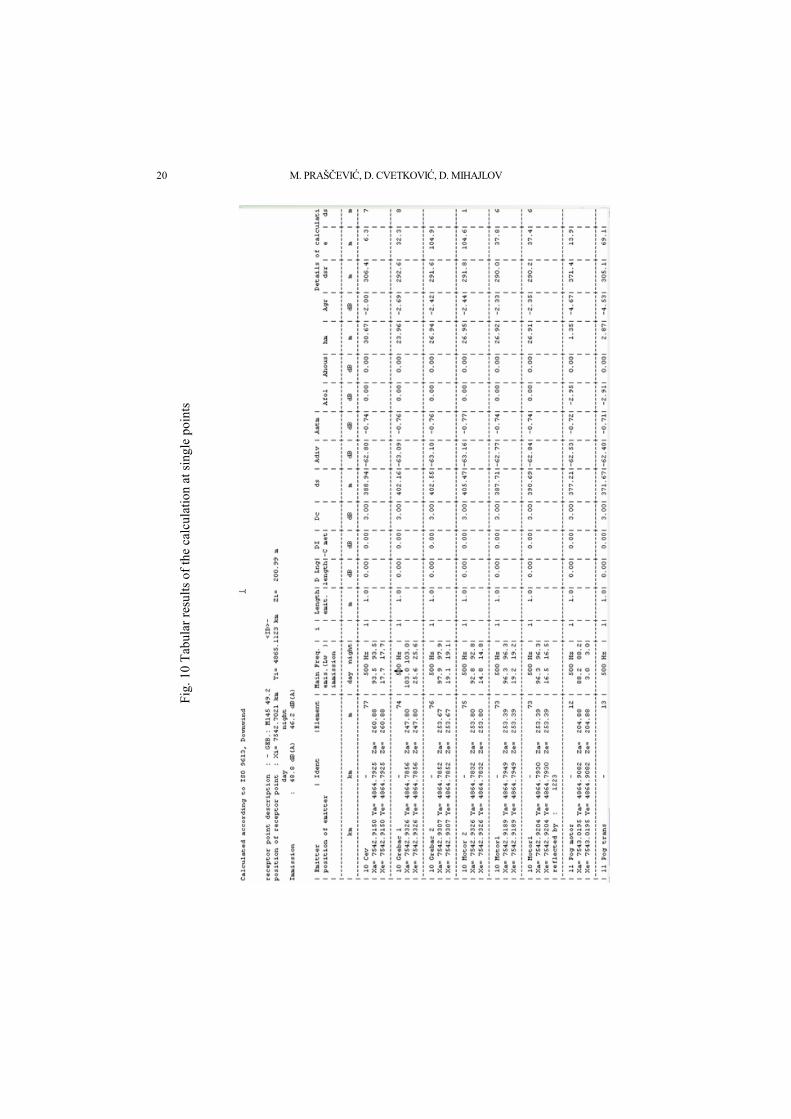
For single points the results were obtained for each point: A - daily noise level and A - nightly noise level as well as a detailed view of the contribution and the calculation for each noise source are shown in tabular form in Fig. 10.
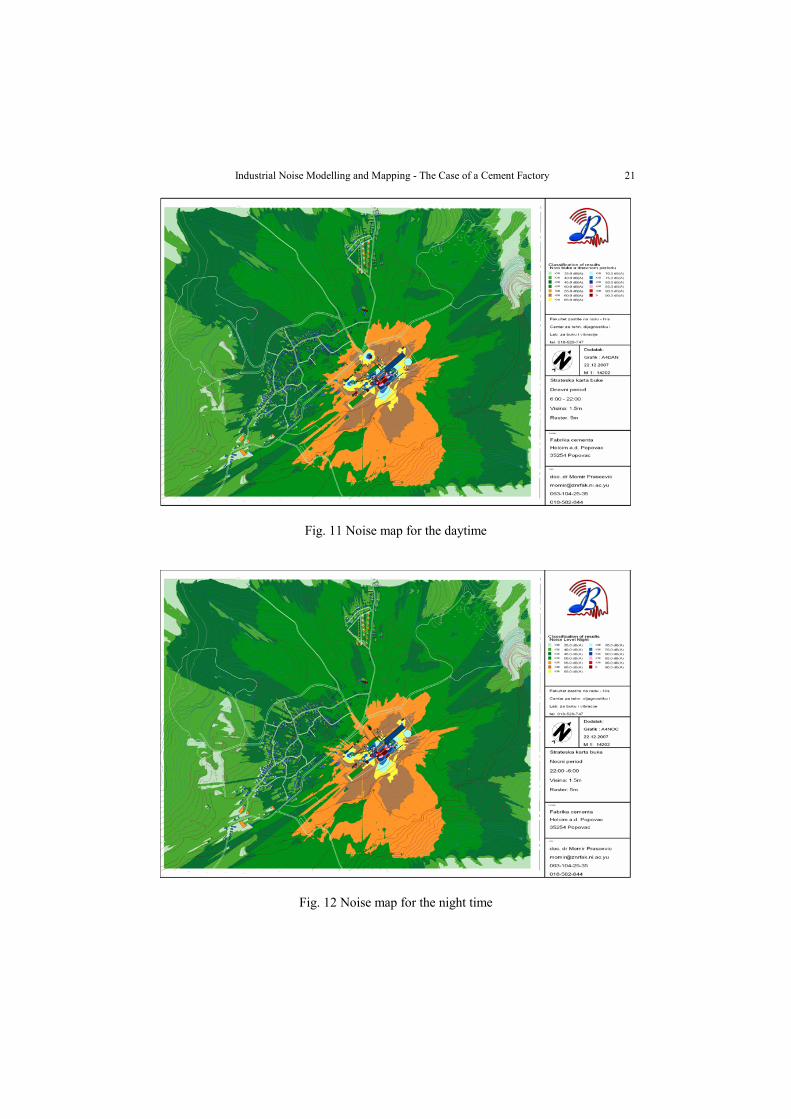
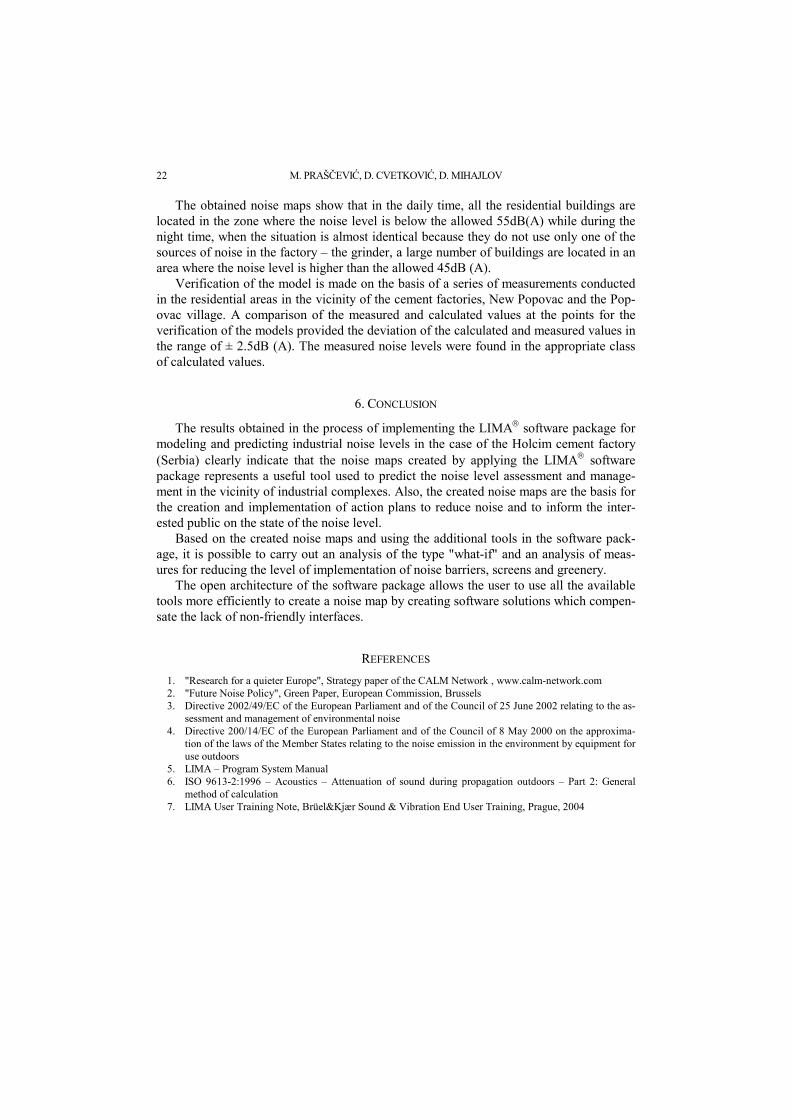
The noise maps for the day time and night time period that show the state-of-the-art of A-equivalent noise levels during the day (Fig.11) and at night (Fig. 12) are created on the basis of the calculated noise level in grid points.
M. PRAŠČEVIĆ, D. CVETKOVIĆ, D. MIHAJLOV 20 Fi
g. 1
0 Ta
bula
r res
ults
of t
he c
alcu
latio
n at
sing
le p
oint
s
Industrial Noise Modelling and Mapping - The Case of a Cement Factory 21
Fig. 11 Noise map for the daytime
Fig. 12 Noise map for the night time
M. PRAŠČEVIĆ, D. CVETKOVIĆ, D. MIHAJLOV 22
The obtained noise maps show that in the daily time, all the residential buildings are located in the zone where the noise level is below the allowed 55dB(A) while during the night time, when the situation is almost identical because they do not use only one of the sources of noise in the factory – the grinder, a large number of buildings are located in an area where the noise level is higher than the allowed 45dB (A).
Verification of the model is made on the basis of a series of measurements conducted in the residential areas in the vicinity of the cement factories, New Popovac and the Pop-ovac village. A comparison of the measured and calculated values at the points for the verification of the models provided the deviation of the calculated and measured values in the range of ± 2.5dB (A). The measured noise levels were found in the appropriate class of calculated values.
6. CONCLUSION
The results obtained in the process of implementing the LIMA® software package for modeling and predicting industrial noise levels in the case of the Holcim cement factory (Serbia) clearly indicate that the noise maps created by applying the LIMA® software package represents a useful tool used to predict the noise level assessment and manage-ment in the vicinity of industrial complexes. Also, the created noise maps are the basis for the creation and implementation of action plans to reduce noise and to inform the inter-ested public on the state of the noise level.
Based on the created noise maps and using the additional tools in the software pack-age, it is possible to carry out an analysis of the type "what-if" and an analysis of meas-ures for reducing the level of implementation of noise barriers, screens and greenery.
The open architecture of the software package allows the user to use all the available tools more efficiently to create a noise map by creating software solutions which compen-sate the lack of non-friendly interfaces.
REFERENCES 1. "Research for a quieter Europe", Strategy paper of the CALM Network , www.calm-network.com 2. "Future Noise Policy", Green Paper, European Commission, Brussels 3. Directive 2002/49/EC of the European Parliament and of the Council of 25 June 2002 relating to the as-
sessment and management of environmental noise 4. Directive 200/14/EC of the European Parliament and of the Council of 8 May 2000 on the approxima-
tion of the laws of the Member States relating to the noise emission in the environment by equipment for use outdoors
5. LIMA – Program System Manual 6. ISO 9613-2:1996 – Acoustics – Attenuation of sound during propagation outdoors – Part 2: General
method of calculation 7. LIMA User Training Note, Brüel&Kjær Sound & Vibration End User Training, Prague, 2004
Industrial Noise Modelling and Mapping - The Case of a Cement Factory 23
MODELIRANJE I MAPIRANJE INDUSTRIJSKE BUKE - PRIMER FABRIKE CEMENTA
Momir Praščević, Dragan Cvetković, Darko Mihajlov
Strategijsko mapiranje buke predstavlja jedan od tri ključna elementa evropske direktive 2002/49/EC koja definiše novu strategiju borbe protiv buke u 21. veku sa osnovnim ciljem da "ni jedna osoba ne treba da bude izložena nivou buke koji može ugroziti zdravlje i kvalitet života". Strategijske mape predstavljaju inicijalni korak u sprovođenju aktivnosti izrade akcionih planova za redukciju nivoa buke i informisanja javnosti o stanju nivoa buke. Strategijske mape buke koje se izrađuju primenom zajedničkim metoda i indikatora buke čine osnovu za ocenu stanja nivoa buke. Strategijskim mapama se tretiraju drumski i železnički saobraćaj, aerodromi i industrijski kompleksi.
Industrijske aktivnosti pored stambenih zona imaji neminovan uticaj na stanje životne sredine pa i na povećanje nivoa buke kojima su izloženi stanovnici tih zona. Za procenu uticaja industrijskih aktivnosti na neposredno okolinu neophodno je raspolagati mapama buke kojima se identifikuju najdominatniji izvori buke i stanje nivoa buke u okolini. Mape buke su polazna osnova za informisanje javnosti o stanju nivoa buke i za izradu akcionih planova sa smanjenje nivoa buke.
U radu će biti prikazan primer mapiranja industrijske buke na lokaciji i neposrednoj okolini fabrike cementa "Holcim" u Popovcu.
Ključne reči: industrijska buka, mape buke, modeliranje buke, mapiranje buke