Embed Size (px)
Citation preview

BIG-BOXMarket Report
2016 Year-End Review & Outlook
North America Report
INDUSTRIAL LOGISTICS& TRANSPORTATION SOLUTIONS
2 A Colliers International publication
32016 Year-End Review & Outlook | Big-Box Market Report
Welcome to the third edition of the Colliers International Logistics & Transportation Solutions Group Big-Box Market Report. A year-end recap of 2016 with a look ahead at 2017, this report studies big-box activity in North America and six of its major distribution markets:
> Atlanta, GA > Chicago, IL > Dallas, TX > Greater Los Angeles, CA > New Jersey, Lehigh Valley/Eastern PA > Toronto, ON
Fueled by the engine of e-commerce, 2016 finished as the strongest year ever for big-box development and leasing. We continued to see greater demand versus development with 87.4 million square feet (MSF) developed and 104.8 MSF leased. It was truly a great year for all involved in the industrial real estate sector!
Colliers International’s Logistics & Transportation Solutions Group (L&T) includes 70 members in North America, London and Mexico. Our members are hand-picked for their knowledge, experience and commitment to adding supply chain expertise to their real estate transaction management skills.
In 2016 alone, L&T brokers toured the Port of Virginia, the Port of Rotterdam, the BNSF intermodal yard in Memphis and FedEx’s world headquarters. The group also held a joint conference in Amsterdam with our European counterparts and participated in supply chain training at Georgia Tech.
L&T’s goal and the objective of this report is to bring thought leadership and supply chain knowledge to investors and occupiers as we all execute our business plans for the next few years.
Best regards,
JACK ROSENBERGNational Director,Logistics & Transportation Solutions Group
DWIGHT HOTCHKISSNational Director,Industrial | USA
A NOTE FROM OUR LEADERS
JAMES BREEZENational Director,Industrial Research | USA

4 A Colliers International publication
Service in Motion 7
North American Overview 8
North America Market Reports
1. Atlanta, GA 10
2. Chicago, IL 11
3. Dallas, TX 12
4. Greater Los Angeles, CA 13
5. New Jersey, Lehigh Valley/Eastern PA 14
6. Toronto, ON 15
How can we help you?
Speak to one of our property experts today.
Strategic advice
Make fully informed decisions.
Learn about Colliers
Visit our website to explore the ways we can accelerate your success.
www.colliers.com
Contents
52016 Year-End Review & Outlook | Big-Box Market Report
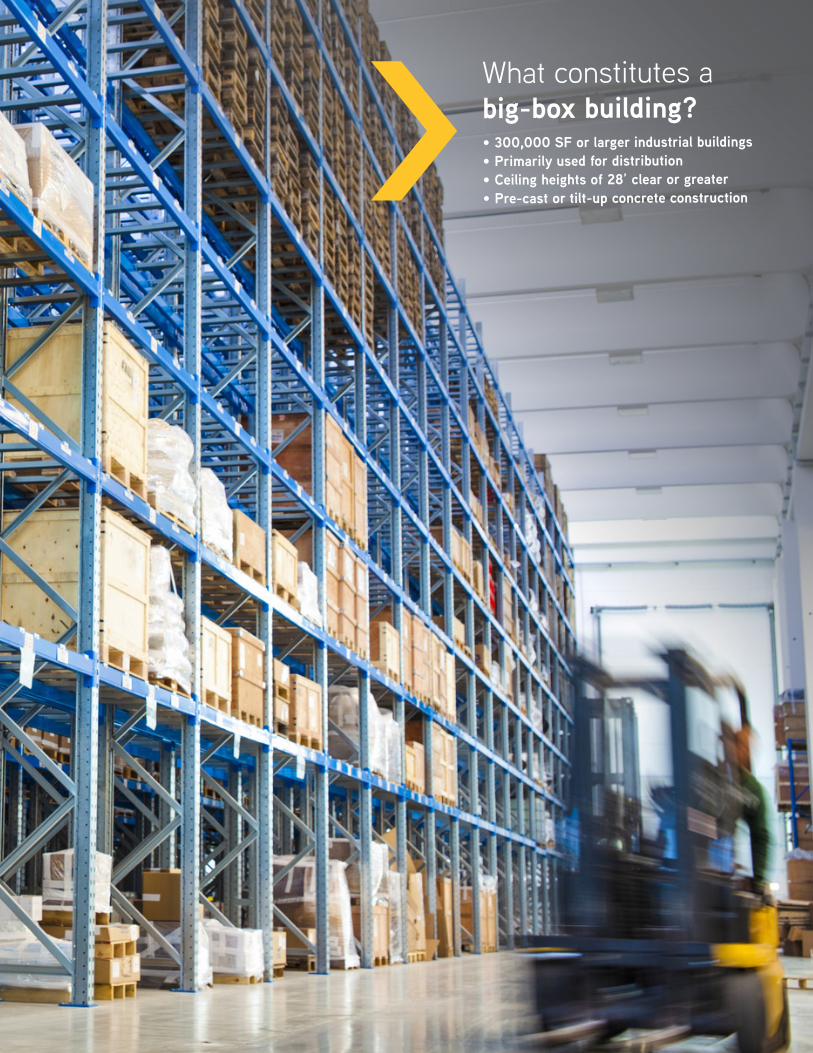
> What constitutes abig-box building?• 300,000 SF or larger industrial buildings• Primarily used for distribution• Ceiling heights of 28’ clear or greater• Pre-cast or tilt-up concrete construction
6 A Colliers International publication
More
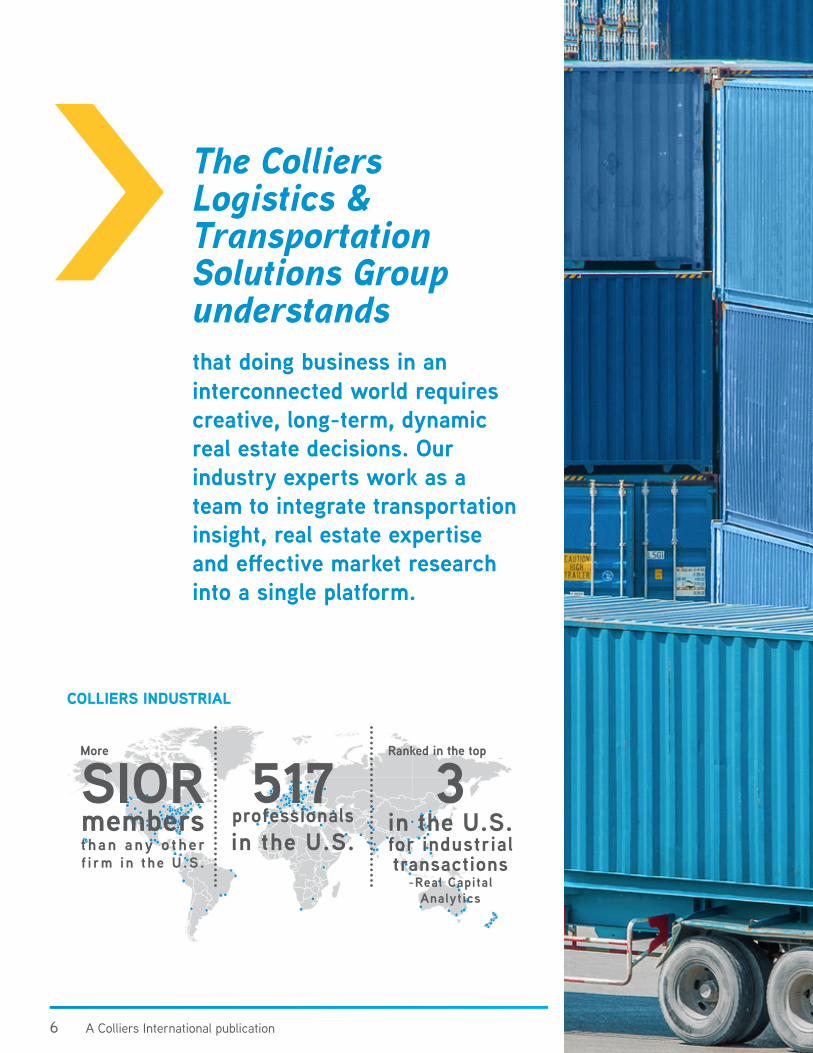
SIOR membersthan any o ther f i rm in the U.S.
517professionalsin the U.S.
Ranked in the top
3in the U.S.for industrial transactions
-Real Capital Analytics
COLLIERS INDUSTRIAL
> The Colliers Logistics & Transportation Solutions Group understandsthat doing business in an interconnected world requires creative, long-term, dynamic real estate decisions. Our industry experts work as a team to integrate transportation insight, real estate expertise and effective market research into a single platform.

72016 Year-End Review & Outlook | Big-Box Market Report
Service in MotionColliers’ Logistics & Transportation Solutions Group delivers advisory,brokerage and management services to domestic and international clients, targeting the expanding relationship between goods movement and real estate.
Our industry specialists understand the issues that shape and drive the transportation industry: skyrocketing energy, transportation and laborcosts; heightened security needs; stringent environmental requirements; and profound changes in global supply chains. Our experience, talent and insight help us address these issues through flexible and efficient industrial real estate solutions.
Whether researching new advances or issues, participating in industryorganizations or taking the lead in trade conferences, our specialistsimmerse themselves in the business of the transportation industry and connect Colliers to the global transportation community.
Built upon the principles of specialization and innovation—coupled with a global reach and local knowledge—Colliers’ Logistics & Transportation Solutions Group delivers high-impact results thanks to our expertise in logistics and commercial real estate.
8 A Colliers International publication
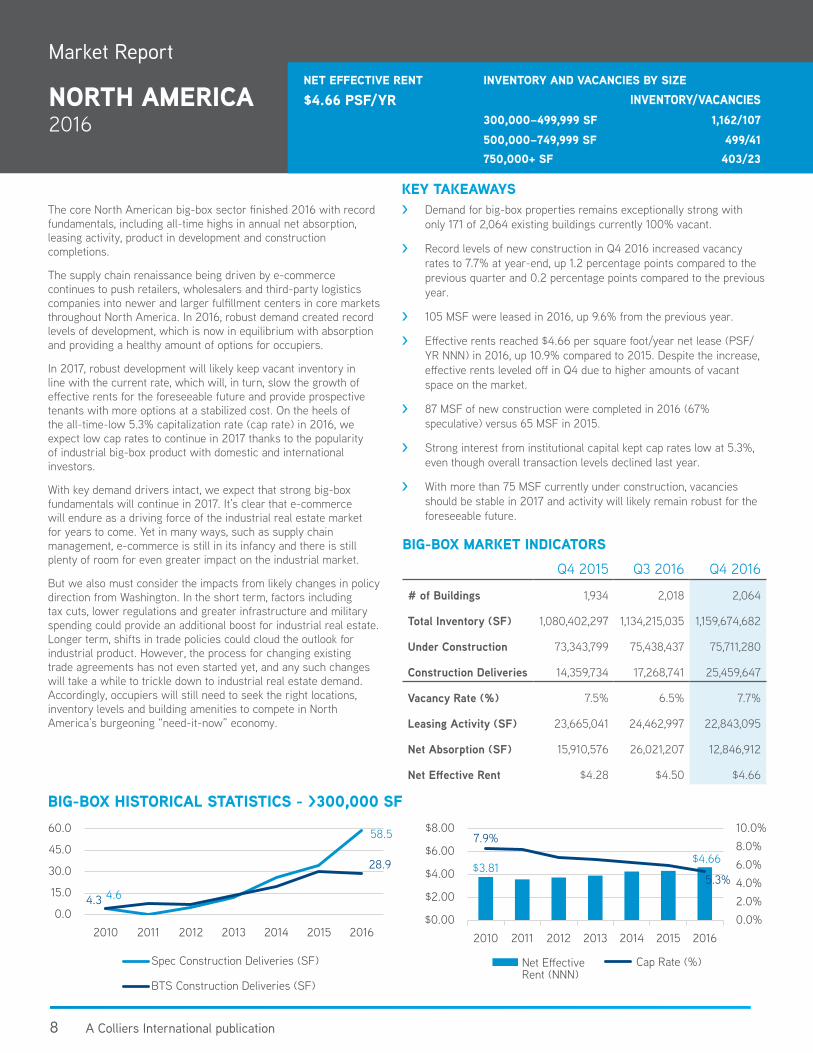
> Demand for big-box properties remains exceptionally strong with only 171 of 2,064 existing buildings currently 100% vacant.
> Record levels of new construction in Q4 2016 increased vacancy rates to 7.7% at year-end, up 1.2 percentage points compared to the previous quarter and 0.2 percentage points compared to the previous year.
> 105 MSF were leased in 2016, up 9.6% from the previous year.
> Effective rents reached $4.66 per square foot/year net lease (PSF/YR NNN) in 2016, up 10.9% compared to 2015. Despite the increase, effective rents leveled off in Q4 due to higher amounts of vacant space on the market.
> 87 MSF of new construction were completed in 2016 (67% speculative) versus 65 MSF in 2015.
> Strong interest from institutional capital kept cap rates low at 5.3%, even though overall transaction levels declined last year.
> With more than 75 MSF currently under construction, vacancies should be stable in 2017 and activity will likely remain robust for the foreseeable future.
BIG-BOX HISTORICAL STATISTICS - >300,000 SF
The core North American big-box sector finished 2016 with record fundamentals, including all-time highs in annual net absorption, leasing activity, product in development and construction completions.
The supply chain renaissance being driven by e-commerce continues to push retailers, wholesalers and third-party logistics companies into newer and larger fulfillment centers in core markets throughout North America. In 2016, robust demand created record levels of development, which is now in equilibrium with absorption and providing a healthy amount of options for occupiers.
In 2017, robust development will likely keep vacant inventory in line with the current rate, which will, in turn, slow the growth of effective rents for the foreseeable future and provide prospective tenants with more options at a stabilized cost. On the heels of the all-time-low 5.3% capitalization rate (cap rate) in 2016, we expect low cap rates to continue in 2017 thanks to the popularity of industrial big-box product with domestic and international investors.
With key demand drivers intact, we expect that strong big-box fundamentals will continue in 2017. It’s clear that e-commerce will endure as a driving force of the industrial real estate market for years to come. Yet in many ways, such as supply chain management, e-commerce is still in its infancy and there is still plenty of room for even greater impact on the industrial market.
But we also must consider the impacts from likely changes in policy direction from Washington. In the short term, factors including tax cuts, lower regulations and greater infrastructure and military spending could provide an additional boost for industrial real estate. Longer term, shifts in trade policies could cloud the outlook for industrial product. However, the process for changing existing trade agreements has not even started yet, and any such changes will take a while to trickle down to industrial real estate demand. Accordingly, occupiers will still need to seek the right locations, inventory levels and building amenities to compete in North America’s burgeoning “need-it-now” economy.
KEY TAKEAWAYS
Q4 2015 Q3 2016 Q4 2016
# of Buildings 1,934 2,018 2,064
Total Inventory (SF) 1,080,402,297 1,134,215,035 1,159,674,682
Under Construction 73,343,799 75,438,437 75,711,280
Construction Deliveries 14,359,734 17,268,741 25,459,647
Vacancy Rate (%) 7.5% 6.5% 7.7%
Leasing Activity (SF) 23,665,041 24,462,997 22,843,095
Net Absorption (SF) 15,910,576 26,021,207 12,846,912
Net Effective Rent $4.28 $4.50 $4.66
BIG-BOX MARKET INDICATORS
4.6
58.5
4.3
28.9
0.0
15.0
30.0
45.0
60.0
2010 2011 2012 2013 2014 2015 2016
Spec Construction Deliveries (SF)
BTS Construction Deliveries (SF)
Market Report
NORTH AMERICA2016
NET EFFECTIVE RENT$4.66 PSF/YR
INVENTORY AND VACANCIES BY SIZEINVENTORY/VACANCIES
300,000–499,999 SF 1,162/107500,000–749,999 SF 499/41750,000+ SF 403/23
$3.81$4.66
7.9%
5.3%
$0.00
$2.00
$4.00
$6.00
$8.00
2010 2011 2012 2013 2014 2015 20160.0%2.0%4.0%6.0%8.0%10.0%
Cap Rate (%)

Colliers Office Locations
Featured Distribution Markets
ATLANTA, GAAvg. Rental Rate: $3.15Big-Box Vacancies: 56
Big-Box Vacancy Rate: 14.2%Net Absorption: 9,805,386 SF
2016
DALLAS, TXAvg. Rental Rate: $3.51Big-Box Vacancies: 36
Big-Box Vacancy Rate: 9.4%Net Absorption: 13,835,061 SF
2016
GREATER LOS ANGELES, CAAvg. Rental Rate: $5.40Big-Box Vacancies: 25
Big-Box Vacancy Rate: 3.8%Net Absorption: 18,223,504 SF
2016
NEW JERSEY, LEHIGH VALLEY/EASTERN PA
Avg. Rental Rate: $4.98Big-Box Vacancies: 16
Big-Box Vacancy Rate: 5.9%Net Absorption: 23,660,611 SF
2016
TORONTO, ONAvg. Rental Rate: $6.50Big-Box Vacancies: 16
Big-Box Vacancy Rate: 4.7%Net Absorption: 1,144,377 SF
2016CHICAGO, IL
Avg. Rental Rate: $4.43Big-Box Vacancies: 22
Big-Box Vacancy Rate: 8.5%Net Absorption: 12,637,898 SF
2016
SnapshotMAJOR NORTH AMERICAN
DISTRIBUTION MARKETS
10 A Colliers International publication
ATLA
NTA
BIG-BOX MARKET INDICATORS KEY TAKEAWAYS
Market Report
ATLANTA, GA2016
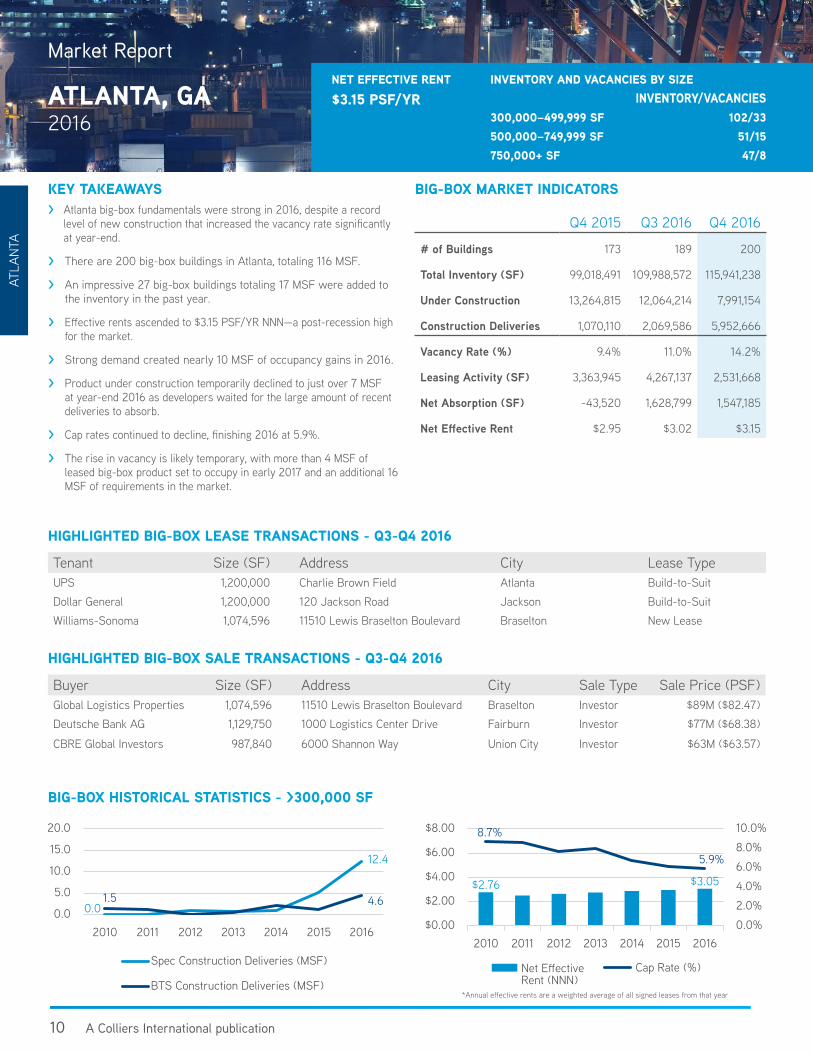
> Atlanta big-box fundamentals were strong in 2016, despite a record level of new construction that increased the vacancy rate significantly at year-end.
> There are 200 big-box buildings in Atlanta, totaling 116 MSF.
> An impressive 27 big-box buildings totaling 17 MSF were added to the inventory in the past year.
> Effective rents ascended to $3.15 PSF/YR NNN—a post-recession high for the market.
> Strong demand created nearly 10 MSF of occupancy gains in 2016.
> Product under construction temporarily declined to just over 7 MSF at year-end 2016 as developers waited for the large amount of recent deliveries to absorb.
> Cap rates continued to decline, finishing 2016 at 5.9%.
> The rise in vacancy is likely temporary, with more than 4 MSF of leased big-box product set to occupy in early 2017 and an additional 16 MSF of requirements in the market.
BIG-BOX HISTORICAL STATISTICS - >300,000 SF
Q4 2015 Q3 2016 Q4 2016
# of Buildings 173 189 200
Total Inventory (SF) 99,018,491 109,988,572 115,941,238
Under Construction 13,264,815 12,064,214 7,991,154
Construction Deliveries 1,070,110 2,069,586 5,952,666
Vacancy Rate (%) 9.4% 11.0% 14.2%
Leasing Activity (SF) 3,363,945 4,267,137 2,531,668
Net Absorption (SF) -43,520 1,628,799 1,547,185
Net Effective Rent $2.95 $3.02 $3.15
Tenant Size (SF) Address City Lease TypeUPS 1,200,000 Charlie Brown Field Atlanta Build-to-SuitDollar General 1,200,000 120 Jackson Road Jackson Build-to-SuitWilliams-Sonoma 1,074,596 11510 Lewis Braselton Boulevard Braselton New Lease
HIGHLIGHTED BIG-BOX LEASE TRANSACTIONS - Q3-Q4 2016
Buyer Size (SF) Address City Sale Type Sale Price (PSF)Global Logistics Properties 1,074,596 11510 Lewis Braselton Boulevard Braselton Investor $89M ($82.47)Deutsche Bank AG 1,129,750 1000 Logistics Center Drive Fairburn Investor $77M ($68.38)
CBRE Global Investors 987,840 6000 Shannon Way Union City Investor $63M ($63.57)
HIGHLIGHTED BIG-BOX SALE TRANSACTIONS - Q3-Q4 2016
NET EFFECTIVE RENT$3.15 PSF/YR
INVENTORY AND VACANCIES BY SIZEINVENTORY/VACANCIES
300,000–499,999 SF 102/33500,000–749,999 SF 51/15750,000+ SF 47/8
0.0
12.4
1.5 4.60.0
5.0
10.0
15.0
20.0
2010 2011 2012 2013 2014 2015 2016
Spec Construction Deliveries (MSF)
BTS Construction Deliveries (MSF)
$2.76 $3.05
8.7%
5.9%
$0.00
$2.00
$4.00
$6.00
$8.00
2010 2011 2012 2013 2014 2015 20160.0%
2.0%
4.0%
6.0%
8.0%
10.0%
Cap Rate (%)
*Annual effective rents are a weighted average of all signed leases from that year

112016 Year-End Review & Outlook | Big-Box Market Report
CHICAGO
KEY TAKEAWAYS
HIGHLIGHTED BIG-BOX LEASE TRANSACTIONS - Q3-Q4 2016
Tenant Size (SF) Address City Lease TypeUndisclosed Consumer Products Company 1,507,545 RidgePort Logistics Center Wilmington Build-to-SuitMars Corporation 1,388,000 4005 Cedar Creek Drive Elwood Build-to-Suit
Georgia Pacific 1,022,544 21705-21707 W. Mississippi Road Elwood Build-to-Suit
BIG-BOX MARKET INDICATORS
HIGHLIGHTED BIG-BOX SALE TRANSACTIONS - Q3-Q4 2016
Buyer Size (SF) Address City Sale Type Sale Price (PSF)Parking Company of America 1,289,463 5370-5585 S. Archer Avenue
& 5333 S. Laramie AvenueChicago User $50M ($38.78)
Griffin Capital Essential Asset REIT 978,120 1650 Macom Drive DeKalb Investor $69M ($70.91)
Hillwood Investment 915,643 18801 Oak Park Avenue Tinley Park Investor $45M ($48.87)
> E-commerce is driving demand in the Chicago market with Amazon leading the way. The e-commerce giant signed 30.0% of the new big-box leases in Chicago in 2016.
> There are 300 big-box buildings in Chicago, totaling 167 MSF.
> Drawn by the population of nearly 41 million people in a 250-mile radius of Chicago’s industrial core, occupiers continue to move into the market in droves. This level of demand created nearly 13 MSF of occupancy gains for 2016.
> A record 14 MSF were completed in 2016 (57% speculative), with a majority of the space in the Interstate 80 Joliet Corridor.
> Cap rates for big-box buildings have remained under 6% since 2014, finishing 2016 at 5%.
> Effective rental rates rose each quarter in 2016, finishing Q4 at $4.43 PSF/YR NNN. For the year, effective rents averaged $4.35 PSF/YR NNN.
> The need for modern distribution facilities boosted product under construction to 17 MSF—the most for a core big-box market at year-end. Despite the new development, strong leasing is likely to keep vacancies stable for the foreseeable future.
BIG-BOX HISTORICAL STATISTICS - >300,000 SF
Q4 2015 Q3 2016 Q4 2016
# of Buildings 274 292 300
Total Inventory (SF) 153,300,532 163,381,474 167,078,955
Under Construction 6,963,786 8,853,001 16,969,540
Construction Deliveries 4,044,806 2,619,641 3,697,481
Vacancy Rate (%) 8.4% 7.2% 8.5%
Leasing Activity (SF) 3,485,075 2,129,070 2,207,229
Net Absorption (SF) 1,574,488 3,635,958 1,223,114
Net Effective Rent $3.80 $4.38 $4.43
0.0
7.9
1.5
5.9
0.0
2.0
4.0
6.0
8.0
2010 2011 2012 2013 2014 2015 2016
Spec Construction Deliveries (MSF)
BTS Construction Deliveries (MSF)
$2.97
$4.35
7.2%5.0%
$0.00
$2.00
$4.00
$6.00
$8.00
2010 2011 2012 2013 2014 2015 20160.0%
2.0%
4.0%
6.0%
8.0%
Cap Rate (%)
*Annual effective rents are a weighted average of all signed leases from that year
Market Report
CHICAGO, IL2016
NET EFFECTIVE RENT$4.43 PSF/YR
INVENTORY AND VACANCIES BY SIZEINVENTORY/VACANCIES
300,000–499,999 SF 170/18500,000–749,999 SF 78/3750,000+ SF 52/1
12 A Colliers International publication
DALL
AS
KEY TAKEAWAYS
HIGHLIGHTED BIG-BOX LEASE TRANSACTIONS - Q3-Q4 2016
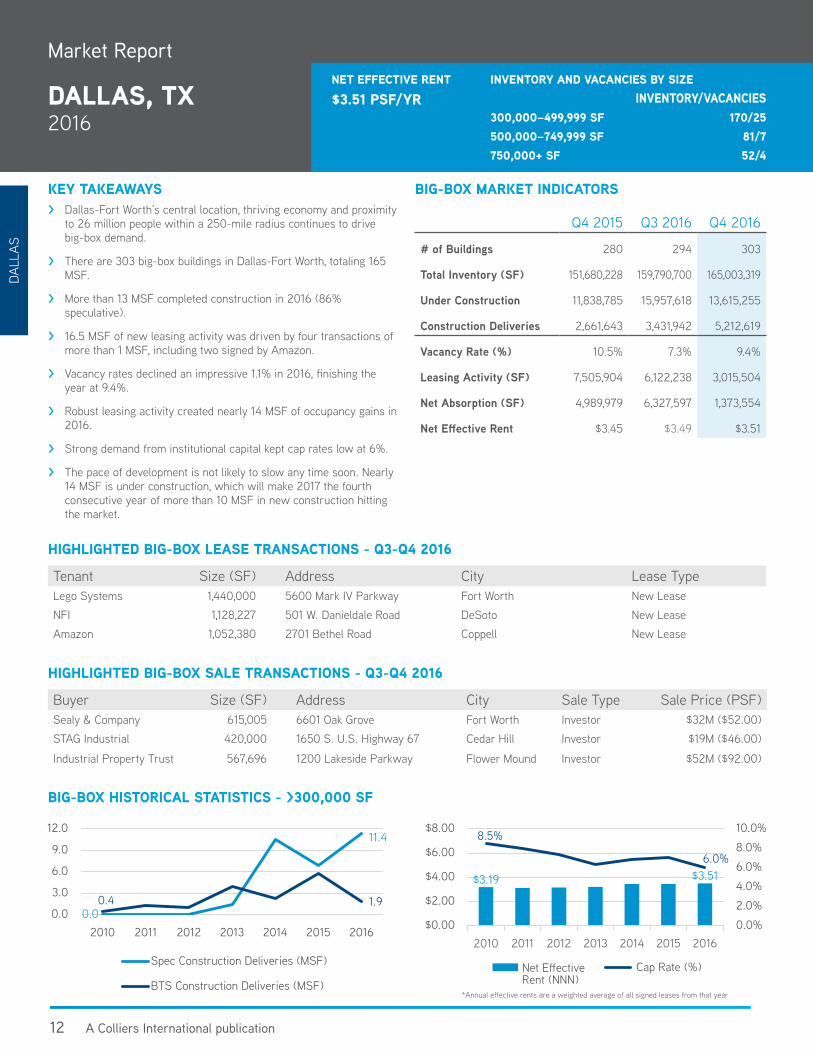
Tenant Size (SF) Address City Lease TypeLego Systems 1,440,000 5600 Mark IV Parkway Fort Worth New LeaseNFI 1,128,227 501 W. Danieldale Road DeSoto New LeaseAmazon 1,052,380 2701 Bethel Road Coppell New Lease
Q4 2015 Q3 2016 Q4 2016
# of Buildings 280 294 303
Total Inventory (SF) 151,680,228 159,790,700 165,003,319
Under Construction 11,838,785 15,957,618 13,615,255
Construction Deliveries 2,661,643 3,431,942 5,212,619
Vacancy Rate (%) 10.5% 7.3% 9.4%
Leasing Activity (SF) 7,505,904 6,122,238 3,015,504
Net Absorption (SF) 4,989,979 6,327,597 1,373,554
Net Effective Rent $3.45 $3.49 $3.51
HIGHLIGHTED BIG-BOX SALE TRANSACTIONS - Q3-Q4 2016
Buyer Size (SF) Address City Sale Type Sale Price (PSF)Sealy & Company 615,005 6601 Oak Grove Fort Worth Investor $32M ($52.00)STAG Industrial 420,000 1650 S. U.S. Highway 67 Cedar Hill Investor $19M ($46.00)
Industrial Property Trust 567,696 1200 Lakeside Parkway Flower Mound Investor $52M ($92.00)
BIG-BOX HISTORICAL STATISTICS - >300,000 SF
> Dallas-Fort Worth’s central location, thriving economy and proximity to 26 million people within a 250-mile radius continues to drive big-box demand.
> There are 303 big-box buildings in Dallas-Fort Worth, totaling 165 MSF.
> More than 13 MSF completed construction in 2016 (86% speculative).
> 16.5 MSF of new leasing activity was driven by four transactions of more than 1 MSF, including two signed by Amazon.
> Vacancy rates declined an impressive 1.1% in 2016, finishing the year at 9.4%.
> Robust leasing activity created nearly 14 MSF of occupancy gains in 2016.
> Strong demand from institutional capital kept cap rates low at 6%.
> The pace of development is not likely to slow any time soon. Nearly 14 MSF is under construction, which will make 2017 the fourth consecutive year of more than 10 MSF in new construction hitting the market.
BIG-BOX MARKET INDICATORS
0.0
11.4
0.4 1.90.0
3.0
6.0
9.0
12.0
2010 2011 2012 2013 2014 2015 2016
Spec Construction Deliveries (MSF)
BTS Construction Deliveries (MSF)
$3.19 $3.51
8.5%
6.0%
$0.00
$2.00
$4.00
$6.00
$8.00
2010 2011 2012 2013 2014 2015 20160.0%
2.0%
4.0%
6.0%
8.0%
10.0%
Cap Rate (%)
*Annual effective rents are a weighted average of all signed leases from that year
Market Report
DALLAS, TX2016
NET EFFECTIVE RENT$3.51 PSF/YR
INVENTORY AND VACANCIES BY SIZEINVENTORY/VACANCIES
300,000–499,999 SF 170/25500,000–749,999 SF 81/7750,000+ SF 52/4
132016 Year-End Review & Outlook | Big-Box Market Report
GREATER LOS ANGELES
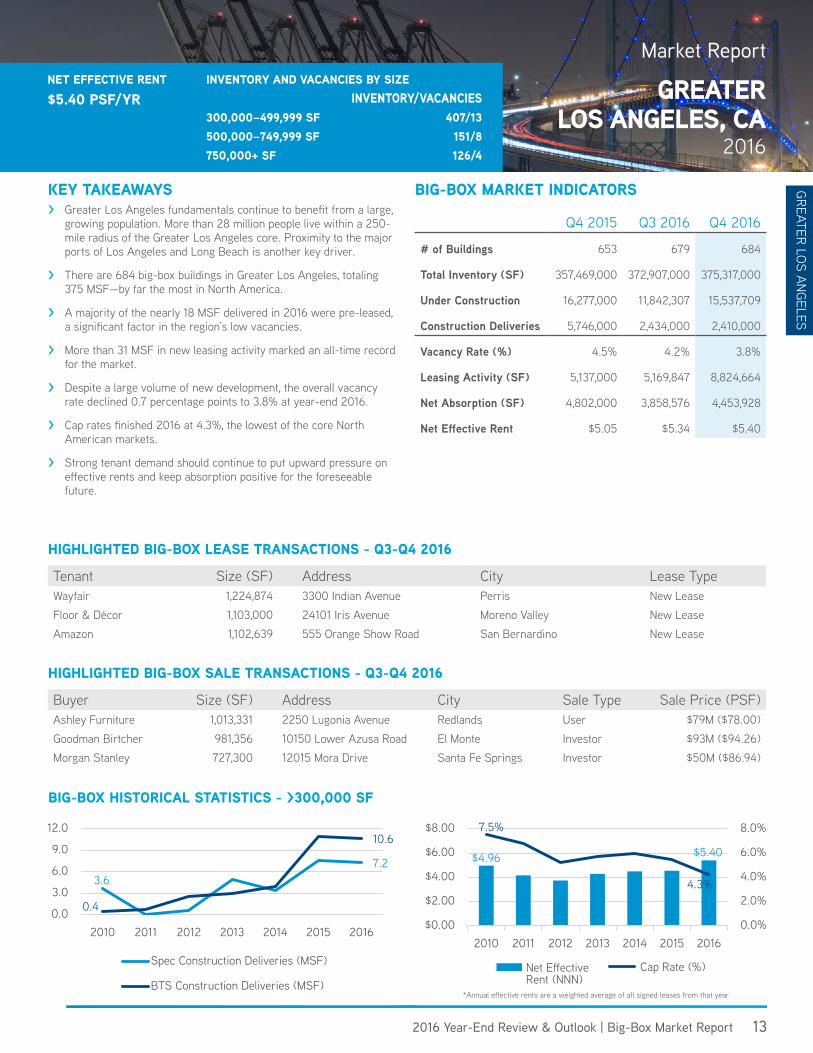
KEY TAKEAWAYS> Greater Los Angeles fundamentals continue to benefit from a large,
growing population. More than 28 million people live within a 250-mile radius of the Greater Los Angeles core. Proximity to the major ports of Los Angeles and Long Beach is another key driver.
> There are 684 big-box buildings in Greater Los Angeles, totaling 375 MSF—by far the most in North America.
> A majority of the nearly 18 MSF delivered in 2016 were pre-leased, a significant factor in the region’s low vacancies.
> More than 31 MSF in new leasing activity marked an all-time record for the market.
> Despite a large volume of new development, the overall vacancy rate declined 0.7 percentage points to 3.8% at year-end 2016.
> Cap rates finished 2016 at 4.3%, the lowest of the core North American markets.
> Strong tenant demand should continue to put upward pressure on effective rents and keep absorption positive for the foreseeable future.
HIGHLIGHTED BIG-BOX LEASE TRANSACTIONS - Q3-Q4 2016
Tenant Size (SF) Address City Lease TypeWayfair 1,224,874 3300 Indian Avenue Perris New LeaseFloor & Décor 1,103,000 24101 Iris Avenue Moreno Valley New LeaseAmazon 1,102,639 555 Orange Show Road San Bernardino New Lease
HIGHLIGHTED BIG-BOX SALE TRANSACTIONS - Q3-Q4 2016
Buyer Size (SF) Address City Sale Type Sale Price (PSF)Ashley Furniture 1,013,331 2250 Lugonia Avenue Redlands User $79M ($78.00)Goodman Birtcher 981,356 10150 Lower Azusa Road El Monte Investor $93M ($94.26)Morgan Stanley 727,300 12015 Mora Drive Santa Fe Springs Investor $50M ($86.94)
BIG-BOX HISTORICAL STATISTICS - >300,000 SF
Market Report
GREATERLOS ANGELES, CA
2016
NET EFFECTIVE RENT$5.40 PSF/YR
INVENTORY AND VACANCIES BY SIZEINVENTORY/VACANCIES
300,000–499,999 SF 407/13500,000–749,999 SF 151/8750,000+ SF 126/4
BIG-BOX MARKET INDICATORS
Q4 2015 Q3 2016 Q4 2016
# of Buildings 653 679 684
Total Inventory (SF) 357,469,000 372,907,000 375,317,000
Under Construction 16,277,000 11,842,307 15,537,709
Construction Deliveries 5,746,000 2,434,000 2,410,000
Vacancy Rate (%) 4.5% 4.2% 3.8%
Leasing Activity (SF) 5,137,000 5,169,847 8,824,664
Net Absorption (SF) 4,802,000 3,858,576 4,453,928
Net Effective Rent $5.05 $5.34 $5.40
3.67.2
0.4
10.6
0.0
3.0
6.0
9.0
12.0
2010 2011 2012 2013 2014 2015 2016
Spec Construction Deliveries (MSF)
BTS Construction Deliveries (MSF)
$4.96 $5.40
7.5%
4.3%
$0.00
$2.00
$4.00
$6.00
$8.00
2010 2011 2012 2013 2014 2015 20160.0%
2.0%
4.0%
6.0%
8.0%
Cap Rate (%)
*Annual effective rents are a weighted average of all signed leases from that year

14 A Colliers International publication
NEW
JER
SEY,
LEH
IGH
VAL
LEY/
EAST
ERN
PA > Proximity to consumers remains the top demand driver for the New Jersey, Lehigh Valley/Eastern Pennsylvania market, as more than 61 million people live within 250 miles of the core.
> There are 300 big-box buildings in region, totaling 185 MSF.
> In 2016, 33 big-box buildings totaling 22 MSF were added to the inventory.
> Vacancy rates declined significantly in 2016 to 5.9%—much lower than the 9% total at year-end 2015.
> At 32 MSF, the market saw the most leasing activity in 2016 of any core North American market. This strong leasing activity led to nearly 24 MSF of occupancy gains in 2016.
> Nearly 22 MSF completed construction in 2016, a large majority of which was speculative (74%).
> Cap rates for big-box buildings continue to decline, finishing 2016 at 5.8%.
> The market’s proximity to the largest population concentration in the nation should keep demand strong and fundamentals sound for the foreseeable future.
KEY TAKEAWAYS
Q4 2015 Q3 2016 Q4 2016
# of Buildings 267 287 300
Total Inventory (SF) 164,895,505 177,231,081 185,417,962
Under Construction 17,689,499 16,886,343 16,083,301
Construction Deliveries 2,849,990 4,723,329 8,186,881
Vacancy Rate (%) 9.0% 4.3% 5.9%
Leasing Activity (SF) 2,660,995 6,774,705 5,824,700
Net Absorption (SF) 3,369,663 9,312,279 4,209,445
Net Effective Rent $4.30 $5.04 $4.98
BIG-BOX MARKET INDICATORS
BIG-BOX HISTORICAL STATISTICS - >300,000 SF
Tenant Size (SF) Address City Lease TypeWayfair 1,240,967 Station Road Cranbury, NJ New LeaseStarbucks 1,200,000 1605 Bartlett Drive Manchester, PA New LeaseMattel 1,002,000 575 Old Forge Road Jonestown, PA New Lease
HIGHLIGHTED BIG-BOX LEASE TRANSACTIONS - Q3-Q4 2016
Buyer Size (SF) Address City Sale Type Sale Price (PSF)Exeter Property Group 1,369,000 2086 Corporate Center Drive W Tobyhanna, PA Investor $73M ($52.96)AEW Capital Management 785,400 325 S. Salem Church Road York, PA Investor $60M ($76.39)
RREEF Management LLC 600,600 401 Cabot Drive Hamilton, NJ Investor $54M ($89.58)
HIGHLIGHTED BIG-BOX SALE TRANSACTIONS - Q3-Q4 2016
1.0
16.1
0.55.5
0.0
5.0
10.0
15.0
20.0
2010 2011 2012 2013 2014 2015 2016
Spec Construction Deliveries (SF)
BTS Construction Deliveries (SF)
$3.59
$6.157.7%
5.8%
$0.00
$2.00
$4.00
$6.00
$8.00
2010 2011 2012 2013 2014 2015 20160.0%
2.0%
4.0%
6.0%
8.0%
10.0%
Cap Rate (%)
*Annual effective rents are a weighted average of all signed leases from that year
Market Report
NEW JERSEY, LEHIGH VALLEY/EASTERN PA2016
NET EFFECTIVE RENT$4.98 PSF/YR
INVENTORY AND VACANCIES BY SIZEINVENTORY/VACANCIES
300,000–499,999 SF 130/9500,000–749,999 SF 89/4750,000+ SF 81/3
152016 Year-End Review & Outlook | Big-Box Market Report
TORO
NTO
Market Report
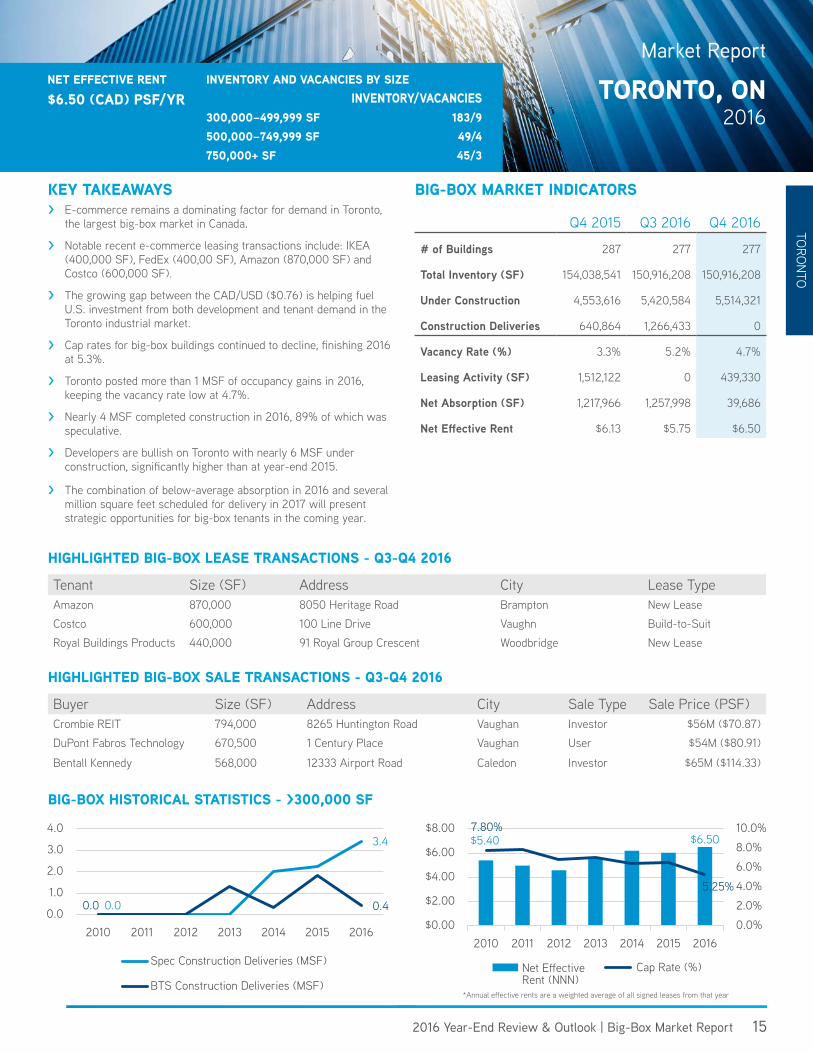
TORONTO, ON2016
BIG-BOX HISTORICAL STATISTICS - >300,000 SF
> E-commerce remains a dominating factor for demand in Toronto, the largest big-box market in Canada.
> Notable recent e-commerce leasing transactions include: IKEA (400,000 SF), FedEx (400,00 SF), Amazon (870,000 SF) and Costco (600,000 SF).
> The growing gap between the CAD/USD ($0.76) is helping fuel U.S. investment from both development and tenant demand in the Toronto industrial market.
> Cap rates for big-box buildings continued to decline, finishing 2016 at 5.3%.
> Toronto posted more than 1 MSF of occupancy gains in 2016, keeping the vacancy rate low at 4.7%.
> Nearly 4 MSF completed construction in 2016, 89% of which was speculative.
> Developers are bullish on Toronto with nearly 6 MSF under construction, significantly higher than at year-end 2015.
> The combination of below-average absorption in 2016 and several million square feet scheduled for delivery in 2017 will present strategic opportunities for big-box tenants in the coming year.
NET EFFECTIVE RENT$6.50 (CAD) PSF/YR
INVENTORY AND VACANCIES BY SIZEINVENTORY/VACANCIES
300,000–499,999 SF 183/9500,000–749,999 SF 49/4750,000+ SF 45/3
KEY TAKEAWAYS BIG-BOX MARKET INDICATORS
Q4 2015 Q3 2016 Q4 2016
# of Buildings 287 277 277
Total Inventory (SF) 154,038,541 150,916,208 150,916,208
Under Construction 4,553,616 5,420,584 5,514,321
Construction Deliveries 640,864 1,266,433 0
Vacancy Rate (%) 3.3% 5.2% 4.7%
Leasing Activity (SF) 1,512,122 0 439,330
Net Absorption (SF) 1,217,966 1,257,998 39,686
Net Effective Rent $6.13 $5.75 $6.50
Tenant Size (SF) Address City Lease TypeAmazon 870,000 8050 Heritage Road Brampton New LeaseCostco 600,000 100 Line Drive Vaughn Build-to-SuitRoyal Buildings Products 440,000 91 Royal Group Crescent Woodbridge New Lease
HIGHLIGHTED BIG-BOX LEASE TRANSACTIONS - Q3-Q4 2016
Buyer Size (SF) Address City Sale Type Sale Price (PSF)Crombie REIT 794,000 8265 Huntington Road Vaughan Investor $56M ($70.87)DuPont Fabros Technology 670,500 1 Century Place Vaughan User $54M ($80.91)
Bentall Kennedy 568,000 12333 Airport Road Caledon Investor $65M ($114.33)
HIGHLIGHTED BIG-BOX SALE TRANSACTIONS - Q3-Q4 2016
0.0
3.4
0.0 0.40.0
1.0
2.0
3.0
4.0
2010 2011 2012 2013 2014 2015 2016
Spec Construction Deliveries (MSF)
BTS Construction Deliveries (MSF)
$5.40 $6.507.80%
5.25%
$0.00
$2.00
$4.00
$6.00
$8.00
2010 2011 2012 2013 2014 2015 20160.0%
2.0%
4.0%
6.0%
8.0%
10.0%
Cap Rate (%)
*Annual effective rents are a weighted average of all signed leases from that year

16 A Colliers International publication
Copyright © 2017 Colliers International.
The information contained herein has been obtained from sources deemed reliable. While every reasonable effort has been made to ensure its accuracy, we cannot guarantee it. No responsibility is assumed for any inaccuracies. Readers are encouraged to consult their professional advisors prior to acting on any of the material contained in this report.
404 offices in 68 countries on 6 continents
colliers.com/us/logistics
All statistics are for 2016 and include affiliates
$2.6billion in annual revenue
2billion square feet under management
15,000professionals and staff
Big-BoxMarket Report
2016 Outlook
North America Report
industrial logistics& transportation solutions

2 A Colliers International publication
Colliers International’s Logistics & Transportation Solutions Group is pleased to present our inaugural research report on 2015’s industrial big-box transactions in North America’s eight largest distribution markets. 2015 was one of the strongest years ever for North America’s industrial real estate market, and the big-box market led the way. This report will give you a summary of North American industrial activity for Class A industrial big-box buildings over 300,000 square feet within the following markets: > Atlanta, GA> Chicago, IL> Dallas, TX> Houston, TX> Greater Los Angeles, CA> Pennsylvania (Eastern) & New Jersey (Southern)> New Jersey (Northern & Central)> Toronto, ON Colliers International’s Logistics & Transportation Solutions Group includes 65 members in North America. Our members are hand-picked for their knowledge, experience, and commitment to broaden their expertise regarding the supply chain issues that drive industrial distribution decisions of our occupier clients. Our goal is to provide thought leadership that helps our investor clients grow their portfolios and our occupier clients understand the market dynamics that affect their location choices and market rents. We hope this report will assist you in formulating your strategy for 2016. Please let us know if you have any questions or feedback.
Best regards,
Jack RosenbeRgNational LeaderLogistics & Transportation Solutions GroupColliers International
Dwight hotchkissNational Director, Industrial | USAColliers International
notes from leadership
32016 Colliers International Big-Box Market Report
service in Motion 5
current snapshot: big-box Rental Rates 6
north america Market Reports 8
1. Atlanta, GA 8
2. Chicago, IL 9
3. Dallas, TX 10
4. Houston, TX 11
5. Greater Los Angeles, CA 12
6. Pennsylvania (Eastern) & New Jersey (Southern) 13
7. New Jersey (Northern & Central) 14
8. Toronto, ON 15
How else can we help you?
Speak to one of our property experts today.
Strategic advice
Ensuring your decisions are fully informed.
Learn about Colliers
Visit our website to explore the ways we can accelerate your success.
www.colliers.com
Contents> What constitutes a
Big-Box Building?• 300,000 SF or Larger Industrial Buildings• Primarily used for Distribution• Ceiling Heights of 28’ Clear or Greater• Pre-Cast or Tilt-Up Concrete Construction

4 A Colliers International publication
>The Logistics & Transportation Solutions Group understandsthat doing business in an interconnected world requires creative, long-term, dynamic real estate decisions. Our industry experts operate with teams to integrate transportation insight, real estate expertise, and effective market research into a single platform.
52016 Colliers International Big-Box Market Report
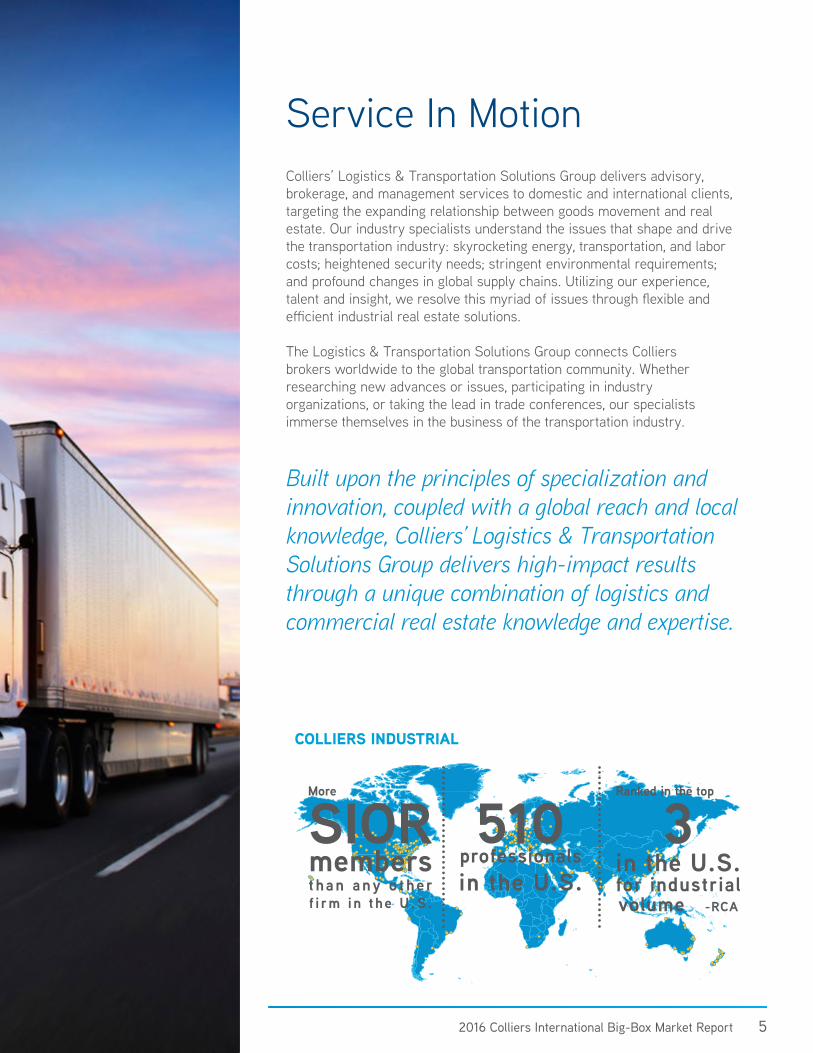
Service In MotionColliers’ Logistics & Transportation Solutions Group delivers advisory,brokerage, and management services to domestic and international clients,targeting the expanding relationship between goods movement and realestate. Our industry specialists understand the issues that shape and drivethe transportation industry: skyrocketing energy, transportation, and laborcosts; heightened security needs; stringent environmental requirements;and profound changes in global supply chains. Utilizing our experience,talent and insight, we resolve this myriad of issues through flexible andefficient industrial real estate solutions.
The Logistics & Transportation Solutions Group connects Colliersbrokers worldwide to the global transportation community. Whetherresearching new advances or issues, participating in industryorganizations, or taking the lead in trade conferences, our specialistsimmerse themselves in the business of the transportation industry.
Built upon the principles of specialization and innovation, coupled with a global reach and local knowledge, Colliers’ Logistics & Transportation Solutions Group delivers high-impact results through a unique combination of logistics and commercial real estate knowledge and expertise.
Updated March 2015
More
SIOR membersthan any o ther f i rm i n the U.S.
510professionalsin the U.S.
Ranked in the top
3in the U.S.for industrial volume -RCA
colliers industrial
6 A Colliers International publication
Updated March 2015
Current Snapshot:Big-Box Rental Rates
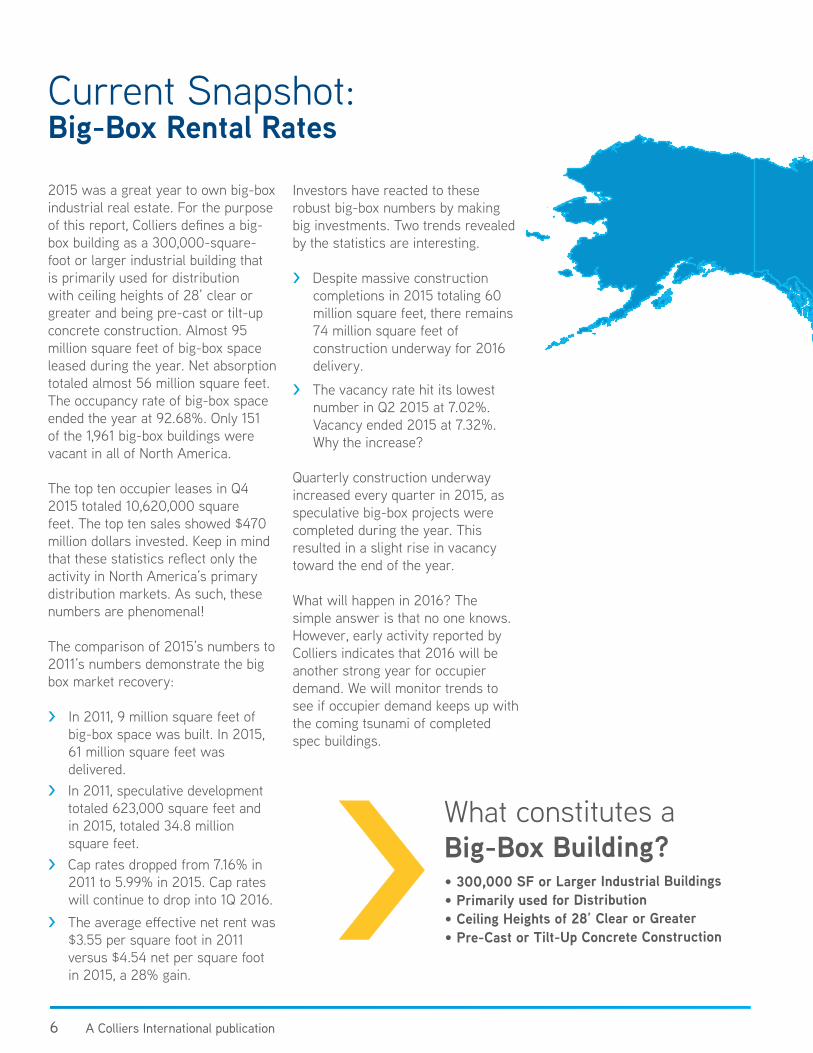
2015 was a great year to own big-box industrial real estate. For the purpose of this report, Colliers defines a big-box building as a 300,000-square-foot or larger industrial building that is primarily used for distribution with ceiling heights of 28’ clear or greater and being pre-cast or tilt-up concrete construction. Almost 95 million square feet of big-box space leased during the year. Net absorption totaled almost 56 million square feet. The occupancy rate of big-box space ended the year at 92.68%. Only 151 of the 1,961 big-box buildings were vacant in all of North America.
The top ten occupier leases in Q4 2015 totaled 10,620,000 square feet. The top ten sales showed $470 million dollars invested. Keep in mind that these statistics reflect only the activity in North America’s primary distribution markets. As such, these numbers are phenomenal!
The comparison of 2015’s numbers to 2011’s numbers demonstrate the big box market recovery:
> In 2011, 9 million square feet of big-box space was built. In 2015, 61 million square feet was delivered. > In 2011, speculative development totaled 623,000 square feet and in 2015, totaled 34.8 million square feet.> Cap rates dropped from 7.16% in 2011 to 5.99% in 2015. Cap rates will continue to drop into 1Q 2016.> The average effective net rent was $3.55 per square foot in 2011 versus $4.54 net per square foot in 2015, a 28% gain.
Investors have reacted to these robust big-box numbers by making big investments. Two trends revealed by the statistics are interesting. > Despite massive construction completions in 2015 totaling 60 million square feet, there remains 74 million square feet of construction underway for 2016 delivery.
> The vacancy rate hit its lowest number in Q2 2015 at 7.02%. Vacancy ended 2015 at 7.32%. Why the increase? Quarterly construction underway increased every quarter in 2015, as speculative big-box projects were completed during the year. This resulted in a slight rise in vacancy toward the end of the year.
What will happen in 2016? The simple answer is that no one knows. However, early activity reported by Colliers indicates that 2016 will be another strong year for occupier demand. We will monitor trends to see if occupier demand keeps up with the coming tsunami of completed spec buildings.
> What constitutes aBig-Box Building?• 300,000 SF or Larger Industrial Buildings• Primarily used for Distribution• Ceiling Heights of 28’ Clear or Greater• Pre-Cast or Tilt-Up Concrete Construction

Updated March 2015
AtlAntA, GAAvg. Rental Rate: $2.95Big-Box Vacancies: 26
Big-Box Vacancy Rate: 8.7%net Absorption: 637,832 SF
tOROntO, OnAvg. Rental Rate: $6.20Big-Box Vacancies: 11
Big-Box Vacancy Rate: 3.3%net Absorption: 1,217,966 SF
ChICAGO, IlAvg. Rental Rate: $3.80Big-Box Vacancies: 19
Big-Box Vacancy Rate: 8.4%net Absorption: 1,574,488 SF
Penn./new JeRSeyAvg. Rental Rate: $4.24Big-Box Vacancies: 17
Big-Box Vacancy Rate: 8.6%net Absorption: 430,931 SF
northern/Centralnew JeRSey
Avg. Rental Rate: $6.22Big-Box Vacancies: 17
Big-Box Vacancy Rate: 12.8%net Absorption: 664,914 SF
DAllAS, tXAvg. Rental Rate: $3.42Big-Box Vacancies: 50
Big-Box Vacancy Rate: 14.0%net Absorption: 2,814,081 SF
hOUStOn, tXAvg. Rental Rate: $4.56Big-Box Vacancies: 10
Big-Box Vacancy Rate: 14.5%net Absorption: 80,320 SF
GReAteR lOS AnGeleS, CAAvg. Rental Rate: $4.94Big-Box Vacancies: 30
Big-Box Vacancy Rate: 4.4%net Absorption: 5,096,250 SF
Colliers Locations
Featured Distribution Markets
Updated March 2015
Q4
Q4
Q4
Q4 Q4 Q4
Q4
Q4

8 A Colliers International publication
ATLA
NTA
Big-Box historical statistics: >300,000 sf
Big-Box market indicators:
overview
Big-Box lease transactions - Q4 2015
Market Report
atlanta, gaQ4 2015
Tenant Size (SF) Address City Lease TypeMedline 1,287,000 1500 Medline Place McDonough New LeaseExel 987,840 625 Shannon Way Union City New LeaseBest Buy 461,700 2 Broadmoor Boulevard Buford New Lease
net effective rent:
$2.95current Big-Box vacancies:300,000-499,999 sf 12500,000-749,999 sf 9750,000+ sf 5
Q4 2014 Q3 2015 Q4 2015# of Buildings 137 143 144total Inventory (SF) 75,930,452 80,101,656 80,419,176Under Construction 6,224,754 8,430,815 10,654,043Construction Deliveries 0 1,822,564 317,520
Q4 2014 Q3 2015 Q4 2015Vacancy Rate (%) 11.1% 9.1% 8.7%leasing Activity (%) 4,699,073 407,517 2,481,666net Absorption (SF) 2,311,031 721,687 627,832net effective Rent $2.87 $2.91 $2.95
Leasing activity totaled 2.5 million square feet during the fourth quarter of 2015, a 525% increase over last quarter’s tally of 400,000 square feet. The fourth quarter activity brought the total big-box leasing volume for 2015 to 6.99 million square feet. The largest big-box lease signed during the fourth quarter involved Medline leasing the 1,287,000 square foot facility at 1500 Medline Place in McDonough. The largest big-box sale completed during the fourth quarter involved Glen Una Investments purchasing the 1,054,500 square foot building located at 3312 North Berkeley Lake Road in Duluth for $31.7 million.
Capitalization rates for big-box buildings continue to compress, averaging 6.2% in 2015, a 50-basis-point decrease from 2014’s average cap rate of 6.7%. The average net effective taking rent for big-box spaces was
$2.95 per square foot net during the fourth quarter of 2015, representing an 2.7% increase when compared to the $2.87 per square foot net rate recorded a year ago. This rate has been on the increase for the five years after bottoming at $2.50 per square foot net in 2011, representing an 18% increase.
Big-box construction activity continues to expand. Currently, 10.7 million square feet of new big-box construction is underway in the Atlanta market. 4.5 million square feet of new big-box development was completed during 2015. 71.1%, or about 3.2 million square feet of the new construction completions were built on a speculative basis, while an additional 1.3 million square feet were build-to-suit projects.
Cap Rate net effective Rent
2012 7.1% $2.63
2013 7.3% $2.75
2014 6.7% $2.87
2015 6.2% $2.950
1,000,000
2,000,000
3,000,000
4,000,000
2012 2013 2014 2015
Spec Construction Deliveries (SF)BTS Construction Deliveries (SF)
92016 Colliers International Big-Box Market Report
CHICAGO
Market Report
chicago, ilQ4 2015
net effective rent:
$3.80current Big-Box vacancies:300,000-499,999 sf 14500,000-749,999 sf 4750,000+ sf 1
Big-Box historical statistics: >300,000 sf
Big-Box market indicators:
overview
Big-Box lease transactions - Q4 2015
Tenant Size (SF) Address City Lease TypeMars Candy 1,388,000 4005 Cedar Creek Drive Elwood New Lease3M 978,120 Park 88 DeKalb New LeaseOzburn-Hessey Logistics 672,080 790 Taylor Road Romeoville New Lease
Q4 2014 Q3 2015 Q4 2015# of Buildings 256 271 274total Inventory (SF) 143,867,522 151,909,405 153,300,532Under Construction 8,291,650 7,039,723 9,720,084Construction Deliveries 2,941,487 2,466,448 1,391,127
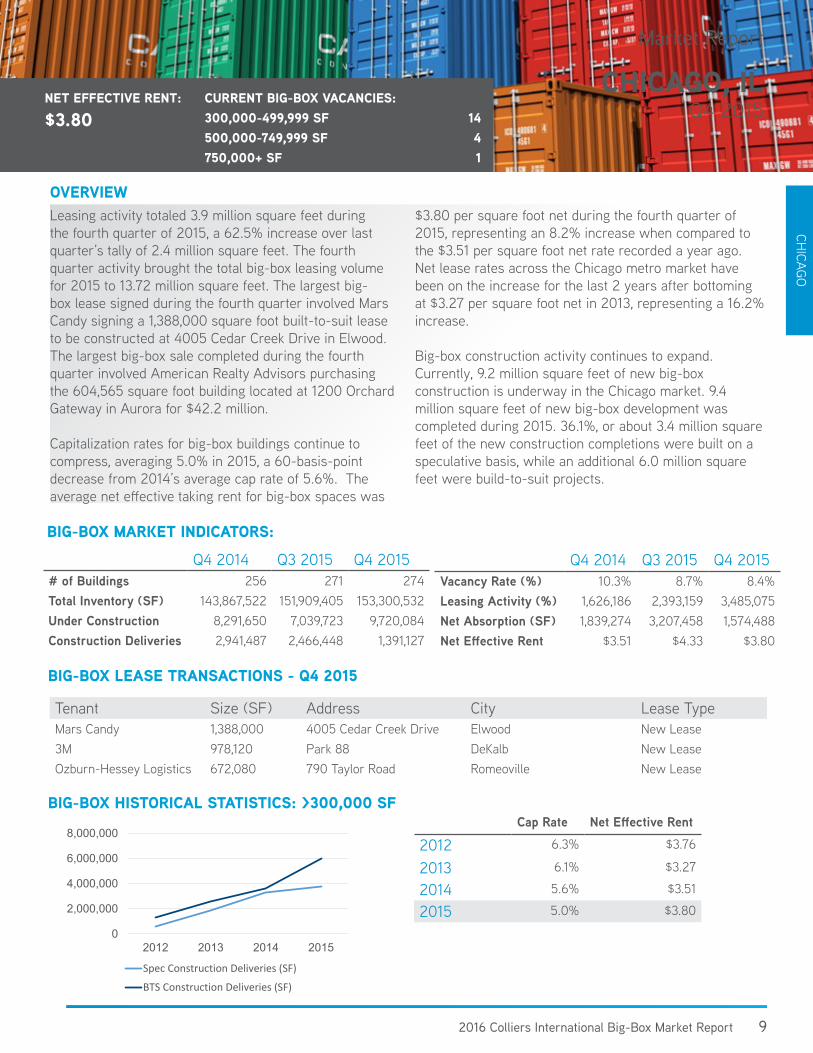
Leasing activity totaled 3.9 million square feet during the fourth quarter of 2015, a 62.5% increase over last quarter’s tally of 2.4 million square feet. The fourth quarter activity brought the total big-box leasing volume for 2015 to 13.72 million square feet. The largest big-box lease signed during the fourth quarter involved Mars Candy signing a 1,388,000 square foot built-to-suit lease to be constructed at 4005 Cedar Creek Drive in Elwood. The largest big-box sale completed during the fourth quarter involved American Realty Advisors purchasing the 604,565 square foot building located at 1200 Orchard Gateway in Aurora for $42.2 million.
Capitalization rates for big-box buildings continue to compress, averaging 5.0% in 2015, a 60-basis-point decrease from 2014’s average cap rate of 5.6%. The average net effective taking rent for big-box spaces was
$3.80 per square foot net during the fourth quarter of 2015, representing an 8.2% increase when compared to the $3.51 per square foot net rate recorded a year ago. Net lease rates across the Chicago metro market have been on the increase for the last 2 years after bottoming at $3.27 per square foot net in 2013, representing a 16.2% increase.
Big-box construction activity continues to expand. Currently, 9.2 million square feet of new big-box construction is underway in the Chicago market. 9.4 million square feet of new big-box development was completed during 2015. 36.1%, or about 3.4 million square feet of the new construction completions were built on a speculative basis, while an additional 6.0 million square feet were build-to-suit projects.
Q4 2014 Q3 2015 Q4 2015Vacancy Rate (%) 10.3% 8.7% 8.4%leasing Activity (%) 1,626,186 2,393,159 3,485,075net Absorption (SF) 1,839,274 3,207,458 1,574,488net effective Rent $3.51 $4.33 $3.80
Cap Rate net effective Rent
2012 6.3% $3.76
2013 6.1% $3.27
2014 5.6% $3.51
2015 5.0% $3.80
0
2,000,000
4,000,000
6,000,000
8,000,000
2012 2013 2014 2015
Spec Construction Deliveries (SF)
BTS Construction Deliveries (SF)

10 A Colliers International publication
DALL
AS
Market Report
dallas, txQ4 2015
net effective rent:
$3.42current Big-Box vacancies:300,000-499,999 sf 32500,000-749,999 sf 13750,000+ sf 5
Big-Box historical statistics: >300,000 sf
Big-Box market indicators:
overview
Big-Box lease transactions - Q4 2015
Tenant Size (SF) Address City Lease TypeMission Foods 768,587 2401 W Pioneer Parkway Arlington New LeaseNiagra Water 630,000 Grady Niblo Road Dallas New LeaseProctor and Gamble 504,125 6601 Oak Grove Road Fort Worth Renewal
Q4 2014 Q3 2015 Q4 2015# of Buildings 220 234 237total Inventory (SF) 116,052,377 123,790,390 125,308,926Under Construction 9,256,549 4,584,602 9,977,581Construction Deliveries 7,153,722 1,856,140 1,518,536
Q4 2014 Q3 2015 Q4 2015Vacancy Rate (%) 14.2% 15.2% 14.0%leasing Activity (%) 2,970,665 4,406,326 4,017,509net Absorption (SF) 181,440 750,333 2,814,081net effective Rent $3.42 $3.45 $3.42
Leasing activity totaled 4.0 million square feet during the fourth quarter of 2015, a 9% decrease compared to last quarter’s tally of 4.4 million square feet. The fourth quarter activity brought the total big-box leasing volume for 2015 to 17.8 million square feet. The largest big-box lease signed during the fourth quarter involved Mission Foods leasing the 768,587 square foot facility at 2401 West Pioneer Parkway in Arlington. The largest big-box sale completed during the fourth quarter involved Stone Lake Capital Partners purchasing the 529,103 SF building located at 3613-3717 Pipestone Road in Dallas for $21.7 million.
Capitalization rates for big-box buildings continue to compress, averaging 6.1% in 2015, a 20-basis-point decrease from 2014’s average cap rate of 6.3%. The
average net effective taking rent for big-box spaces was $3.42 per square foot net during the fourth quarter of 2015, representing an 0% change when compared to the $3.42 per square foot net rate recorded a year ago. This rate has been on the increase for the five years after bottoming at $3.21 per square foot net in 2011, representing a 6.5% increase.
Big-box construction activity continues to expand. Currently, 9.8 million square feet of new big-box construction is underway in the Dallas market. 9.3 million square feet of new big-box development was completed during 2015. 66.6%, or about 6.2 million square feet of the new construction completions were built on a speculative basis, while an additional 3.1 million square feet were build-to-suit projects.
Cap Rate net effective Rent
2012 7.0% $3.21
2013 6.8% $3.22
2014 6.3% $3.42
2015 6.1% $3.420
5,000,000
10,000,000
15,000,000
2012 2013 2014 2015
Spec Construction Deliveries (SF)BTS Construction Deliveries (SF)

112016 Colliers International Big-Box Market Report
HO
USTON
Market Report
houston, txQ4 2015
net effective rent:
$4.56current Big-Box vacancies:300,000-499,999 sf 8500,000-749,999 sf 2750,000+ sf 0
Big-Box historical statistics: >300,000 sf
Big-Box market indicators:
overview
Big-Box lease transactions - Q4 2015
Tenant Size (SF) Address City Lease TypeExel 905,000 City Park East Houston RenewalMichelin North America, Inc. 663,821 8800 Citypark Loop Houston RenewalDunavant 565,760 Bay Area Business Park La Porte New Lease
Q4 2014 Q3 2015 Q4 2015# of Buildings 54 62 64total Inventory (SF) 26,325,641 29,206,083 29,912,313Under Construction 4,444,930 6,104,119 6,230,289Construction Deliveries 351,672 736,255 706,230
Leasing activity totaled 1.3 million square feet during the fourth quarter of 2015, a 165% increase compared to last quarter’s tally of 488,752 square feet. The fourth quarter activity brought the total big-box leasing volume for 2015 to 4.38 million square feet. The largest big-box lease signed during the fourth quarter involved Exel renewing the 905,000 square feet facility at City Park East in Houston. The largest big-box sale completed during the fourth quarter involved Liberty Property Trust purchasing the 921,196 square foot building located on South 16th Street in La Porte for $93 million (including 130 acres).
Capitalization rates for big-box buildings continue to compress, averaging 7.8% in 2015, a 30-basis-point increase from 2014’s average cap rate of 7.5%. The average net effective taking rent for big-box spaces was
$4.56 per square foot net during the fourth quarter of 2015, representing an 2.7% increase when compared to the $4.44 per square foot net rate recorded a year ago. This rate has been on the increase for the 3 years after bottoming at $4.20 per square foot net in 2012, representing an 8.5% increase.
Big-box construction activity continues to expand. Currently, 6.2 million square feet of new big-box construction is underway in the Houston market. 1.8 million square feet of new big-box development was completed during 2015. 94.4%, or about 1.7 million square feet of the new construction completions were built on a speculative basis, while an additional 357,000 square feet were build-to-suit projects.
Q4 2014 Q3 2015 Q4 2015Vacancy Rate (%) 10.8% 12.7% 14.5%leasing Activity (%) 695,007 488,752 1,294,242net Absorption (SF) 121,646 385,608 80,320net effective Rent $4.31 $4.59 $4.59
Cap Rate net effective Rent
2012 7.8% $4.20
2013 7.7% $4.32
2014 7.5% $4.44
2015 7.8% $4.560
1,000,000
2,000,000
3,000,000
4,000,000
2012 2013 2014 2015
Spec Construction Deliveries (SF)
BTS Construction Deliveries (SF)

12 A Colliers International publication
GREA
TER
LOS
ANGE
LES
Market Report
greaterlos angeles, caQ4 2015
net effective rent:
$4.94current Big-Box vacancies:300,000-499,999 sf 17500,000-749,999 sf 7750,000+ sf 6
Big-Box historical statistics: >300,000 sf
Big-Box market indicators:
overview
Big-Box lease transactions - Q4 2015
Tenant Size (SF) Address City Lease TypeGeneral Mills 1,547,342 SF 4120 Indian Perris New LeaseBlack & Decker 970,747 SF 15750 Jurupa Fontana New LeaseWayfair, LLC 783,400 AD 3500 Indian Perris New Lease
Q4 2014 Q3 2015 Q4 2015# of Buildings 662 701 711total Inventory (SF) 365,404,362 379,441,362 385,187,562Under Construction 15,032,000 20,957,000 16,227,432Construction Deliveries 3,200,000 4,858,000 5,746,200
Q4 2014 Q3 2015 Q4 2015Vacancy Rate (%) 4.5% 4.3% 4.4%leasing Activity (%) 11,560,000 8,192,000 8,623,000net Absorption (SF) 4,212,800 4,011,000 5,096,250net effective Rent $4.54 $5.10 $4.94
Leasing activity totaled 8.6 million square feet during the fourth quarter of 2015, a 4.8% increase over last quarter’s tally of 8.2 million square feet. The fourth quarter activity brought the total big-box leasing volume for 2015 to 33.0 million square feet. The largest big-box lease signed during the fourth quarter involved General Mills leasing a 1.1 million square foot facility at 4120 Indian Street in Perris. General Mills signed the lease and the developer is completing the extra 400,000 square feet of the building. The largest big-box sale completed during the fourth quarter involved Costco Wholesale purchasing the 525,700 square foot building located at 11280 Riverside Drive in Jurupa Valley for $62.6 million. Although the building is currently occupied by manufacturer Quik Set, Costco plans to eventually use the building as a regional distribution center.
Capitalization rates for big-box buildings continue to
compress, averaging 4.5% in 2015, a 100-basis-point decrease from 2014’s average cap rate of 5.5%. The average net effective taking rent for big-box spaces was $4.94 per square foot net during the fourth quarter of 2015, representing an 8.8% increase when compared to the $4.54 per square foot net rate recorded a year ago. This rate has been on the increase for the four years after bottoming at $3.73 per square foot net in 2011, representing a 32.4% increase.
Big-box construction activity continues to expand. Currently, 16.2 million square feet of new big-box construction is underway in the Greater Los Angeles market. 19.8 million square feet of new big-box development was completed during 2015. 45%, or about 9.1 million square feet of the new construction completions were built on a speculative basis, while an additional 10.7 million square feet were build-to-suit projects.
Cap Rate net effective Rent
2012 5.7% $4.27
2013 6.0% $4.48
2014 5.5% $4.54
2015 4.5% $4.940
2,000,0004,000,0006,000,0008,000,000
10,000,00012,000,000
2012 2013 2014 2015
Spec Construction Deliveries (SF)BTS Construction Deliveries (SF)
132016 Colliers International Big-Box Market Report
PA & NJ
Market Report
pennsylvania & new Jersey Q4 2015
net effective rent:
$4.24current Big-Box vacancies: 300,000-499,999 sf 9500,000-749,999 sf 5750,000+ sf 3
Big-Box historical statistics: >300,000 sf
Big-Box market indicators:
overview
Big-Box lease transactions - Q4 2015
Tenant Size (SF) Address City Lease TypeStitchFix 483,990 4770 Hanoverville Road Bethlehem, PA New LeaseFedEx 305,733 600 River Road King of Prussia, PA New LeaseXPO Logistics 283,145 1520 Van Buren Road Easton, PA New Lease
Q4 2014 Q3 2015 Q4 2015# of Buildings 116 131 137total Inventory (SF) 81,018,384 89,738,396 93,129,886Under Construction 7,092,265 11,302,195 13,306,229Construction Deliveries 400,060 2,425,434 3,391,490
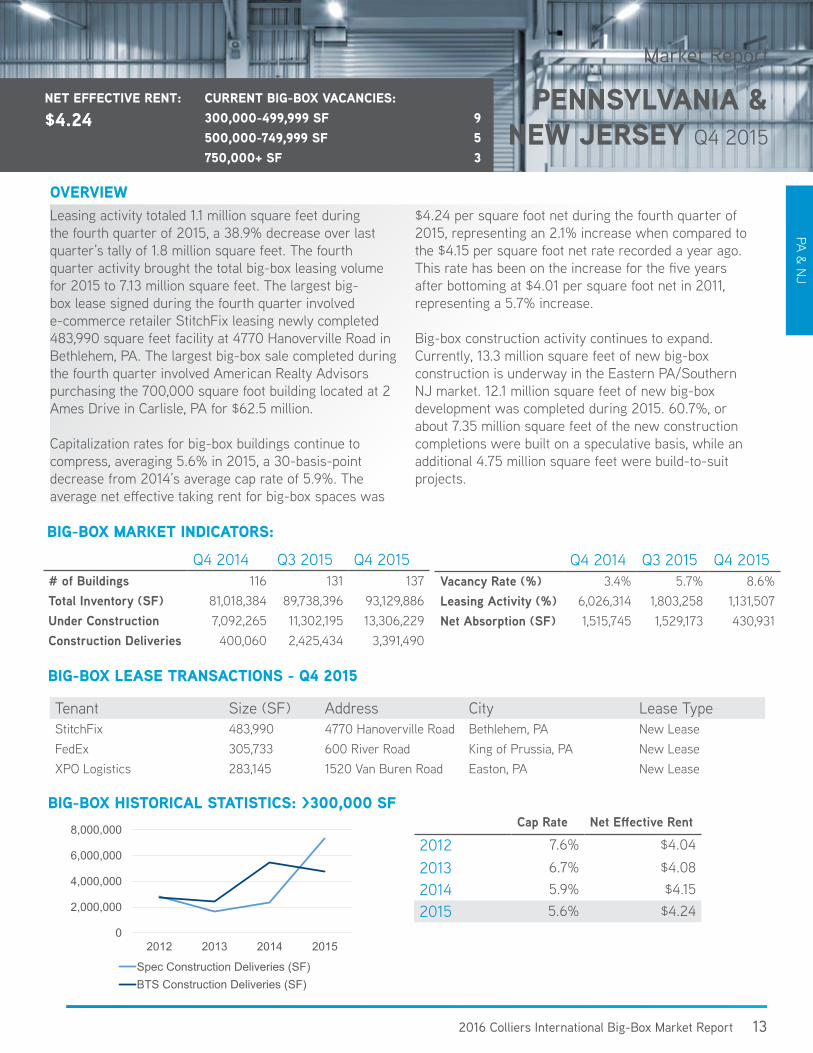
Leasing activity totaled 1.1 million square feet during the fourth quarter of 2015, a 38.9% decrease over last quarter’s tally of 1.8 million square feet. The fourth quarter activity brought the total big-box leasing volume for 2015 to 7.13 million square feet. The largest big-box lease signed during the fourth quarter involved e-commerce retailer StitchFix leasing newly completed 483,990 square feet facility at 4770 Hanoverville Road in Bethlehem, PA. The largest big-box sale completed during the fourth quarter involved American Realty Advisors purchasing the 700,000 square foot building located at 2 Ames Drive in Carlisle, PA for $62.5 million.
Capitalization rates for big-box buildings continue to compress, averaging 5.6% in 2015, a 30-basis-point decrease from 2014’s average cap rate of 5.9%. The average net effective taking rent for big-box spaces was
$4.24 per square foot net during the fourth quarter of 2015, representing an 2.1% increase when compared to the $4.15 per square foot net rate recorded a year ago. This rate has been on the increase for the five years after bottoming at $4.01 per square foot net in 2011, representing a 5.7% increase.
Big-box construction activity continues to expand. Currently, 13.3 million square feet of new big-box construction is underway in the Eastern PA/Southern NJ market. 12.1 million square feet of new big-box development was completed during 2015. 60.7%, or about 7.35 million square feet of the new construction completions were built on a speculative basis, while an additional 4.75 million square feet were build-to-suit projects.
Q4 2014 Q3 2015 Q4 2015Vacancy Rate (%) 3.4% 5.7% 8.6%leasing Activity (%) 6,026,314 1,803,258 1,131,507net Absorption (SF) 1,515,745 1,529,173 430,931
Cap Rate net effective Rent
2012 7.6% $4.04
2013 6.7% $4.082014 5.9% $4.152015 5.6% $4.24
0
2,000,000
4,000,000
6,000,000
8,000,000
2012 2013 2014 2015
Spec Construction Deliveries (SF)BTS Construction Deliveries (SF)

14 A Colliers International publication
NY &
NJ
Market Report
northern/central
new JerseyQ4 2015
current Big-Box vacancies:300,000-499,999 sf 11500,000-749,999 sf 5750,000+ sf 1
net effective rent:
$6.22
Big-Box historical statistics: >300,000 sf
Big-Box market indicators:
overview
Big-Box lease transactions - Q4 2015
Tenant Size (SF) Address City Lease TypeHome Depot 812,739 66 Station Road Cranbury RenewalList Logistics 571,000 75 Mill Road Edison New LeaseFedway 539,170 10 North Avenue Elizabeth New Lease
Q4 2014 Q3 2015 Q4 2015# of Buildings 128 131 131total Inventory (SF) 70,349,509 71,812,857 71,812,857Under Construction 2,002,348 2,769,150 3,841,770Construction Deliveries 1,672,446 1,463,348 0
Q4 2014 Q3 2015 Q4 2015Vacancy Rate (%) 13.3% 13.7% 12.8%leasing Activity (%) 1,292,422 1,144,503 1,529,488net Absorption (SF) 1,399,983 39,769 664,914net effective Rent $4.46 $4.44 $4.36
Leasing activity totaled 1.5 million square feet during the fourth quarter of 2015, a 36.3% increase over last quarter’s tally of 1.1 million square feet. The fourth quarter activity brought the total big-box leasing volume for 2015 to 6.21 million square feet. The largest big-box lease signed during the fourth quarter involved Home Depot’s renewal of 812,739 square feet at 66 Station Road in Cranbury.
Capitalization rates for big-box buildings continue to compress, averaging 6.2% in 2015, a 100-basis-point decrease from 2014’s average cap rate of 7.2%. The average net effective taking rent for big-box spaces was $6.22 per square foot net during the fourth quarter of 2015, representing an 0.5% increase when compared to the $6.19 per square foot net rate recorded a year ago.
This rate has been on the increase for the two years after bottoming at $4.78 per square foot net in 2013 representing a 30.1% increase.
Big-box construction activity continues to expand. Currently, 3.8 million square feet of new big-box construction is underway in the New Jersey market. 1.4 million square feet of new big-box development was completed during 2015. 100% of the new construction completions were built on a speculative basis.
Cap Rate net effective Rent
2012 7.7% $5.46
2013 7.1% $4.782014 7.2% $6.192015 6.2% $6.22
0
1,000,000
2,000,000
3,000,000
4,000,000
2012 2013 2014 2015
Spec Construction Deliveries (SF)BTS Construction Deliveries (SF)
152016 Colliers International Big-Box Market Report
TORO
NTO
Market Report
toronto, on4Q 2015
net effective rent:
$6.20current Big-Box vacancies: 300,000-499,999 sf 7500,000-749,999 sf 2750,000+ sf 2
Big-Box historical statistics: >300,000 sf
Big-Box market indicators:
overview
Big-Box lease transactions - Q4 2015
Tenant Size (SF) Address City Lease TypeAmazon 868,122 8050 Heritage Road Brampton New LeaseSherway Logistics 330,000 6525 Northwest Drive Mississauga New LeaseContinental Tires 314,000 12333 Airport Road Caledon New Lease
Q4 2014 Q3 2015 Q4 2015# of Buildings 283 285 287total Inventory (SF) 152,148,447 153,397,677 154,038,541Under Construction 4,305,232 4,883,480 4,553,616Construction Deliveries 406,485 0 640,864
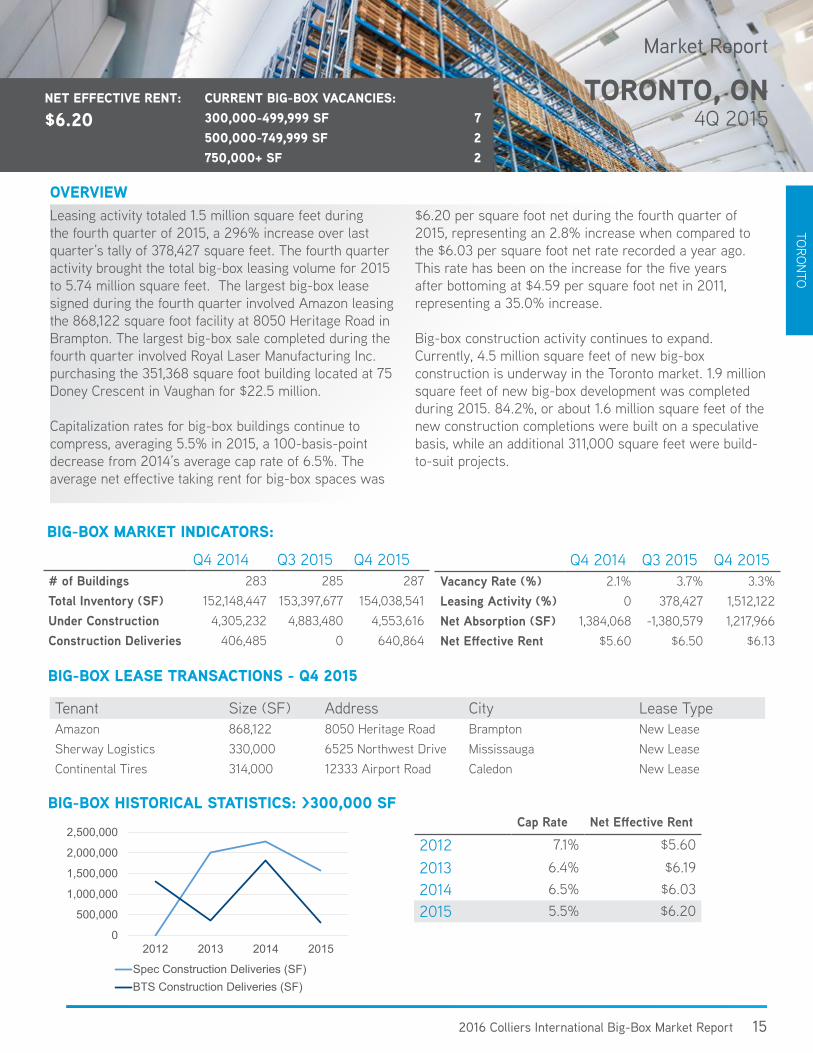
Leasing activity totaled 1.5 million square feet during the fourth quarter of 2015, a 296% increase over last quarter’s tally of 378,427 square feet. The fourth quarter activity brought the total big-box leasing volume for 2015 to 5.74 million square feet. The largest big-box lease signed during the fourth quarter involved Amazon leasing the 868,122 square foot facility at 8050 Heritage Road in Brampton. The largest big-box sale completed during the fourth quarter involved Royal Laser Manufacturing Inc. purchasing the 351,368 square foot building located at 75 Doney Crescent in Vaughan for $22.5 million.
Capitalization rates for big-box buildings continue to compress, averaging 5.5% in 2015, a 100-basis-point decrease from 2014’s average cap rate of 6.5%. The average net effective taking rent for big-box spaces was
$6.20 per square foot net during the fourth quarter of 2015, representing an 2.8% increase when compared to the $6.03 per square foot net rate recorded a year ago. This rate has been on the increase for the five years after bottoming at $4.59 per square foot net in 2011, representing a 35.0% increase.
Big-box construction activity continues to expand. Currently, 4.5 million square feet of new big-box construction is underway in the Toronto market. 1.9 million square feet of new big-box development was completed during 2015. 84.2%, or about 1.6 million square feet of the new construction completions were built on a speculative basis, while an additional 311,000 square feet were build-to-suit projects.
Q4 2014 Q3 2015 Q4 2015Vacancy Rate (%) 2.1% 3.7% 3.3%leasing Activity (%) 0 378,427 1,512,122net Absorption (SF) 1,384,068 -1,380,579 1,217,966net effective Rent $5.60 $6.50 $6.13
Cap Rate net effective Rent
2012 7.1% $5.60
2013 6.4% $6.192014 6.5% $6.032015 5.5% $6.20
0
500,000
1,000,000
1,500,000
2,000,000
2,500,000
2012 2013 2014 2015
Spec Construction Deliveries (SF)BTS Construction Deliveries (SF)
16 A Colliers International publication
Copyright © 2016 Colliers International.
The information contained herein has been obtained from sources deemed reliable. While every reasonable effort has been made to ensure its accuracy, we cannot guarantee it. No responsibility is assumed for any inaccuracies. Readers are encouraged to consult their professional advisors prior to acting on any of the material contained in this report.
502 offices in 67 countries on 6 continentsUnited States: 140 Canada: 31 Latin America: 24 Asia Pacific: 199 EMEA: 108
$2.3billion in annual revenue
1.7billion square feet under management
16,300professionals and staff
colliers.com/us/logistics