Embed Size (px)
Citation preview

DPRIETI Discussion Paper Series 14-E-068
Industrial Agglomeration and Dispersion in China:Spatial reformation of the “workshop of the world”
ITO AseiUniversity of Tokyo
The Research Institute of Economy, Trade and Industryhttp://www.rieti.go.jp/en/

INDUSTRIAL AGGLOMERATION AND DISPERSION IN CHINA
1
RIETI Discussion Paper Series 14-E-068 November 2014
Industrial Agglomeration and Dispersion in China: Spatial reformation of the “workshop of the world”*
ITO Asei
The Institute of Social Science, University of Tokyo;
National Institute for the Humanities, Japan
Abstract
With rising labor costs in China, some scholars assert that its labor-intensive industries will succumb to
latecomer economies, and China’s era as the “workshop of the world” will end. There is, however, little
agreement regarding whether labor-intensive industries, now concentrated along the coast, are relocating
to other regions. How does agglomeration affect this relocation? How does this relocation process affect
the Asian Production Network (APN)? To approach these issues, this paper examines the determinants of
industrial relocation in China by using province- and city-level data from 2004 to 2010, which some
scholars call the “post-Lewisian turning point.” We particularly focus on the significant gap in economic
development in China, especially in regard to industrial agglomeration and dispersion. The results show
that the capital–labor ratio is positively related to industrial growth in the coastal areas but negatively
related in the central regions. Although agglomeration economies have been weak, the absolute scale of
local industry includes a positive effect. In sum, both dispersion and agglomeration forces are observed,
suggesting the existence of multi-force dynamics of spatial relocation in China. Keywords: Location of industry, Agglomeration and dispersion, China, “Domestic flying geese pattern” JEL classification: R12, O14, O53
RIETI Discussion Papers Series aims at widely disseminating research results in the form of professional papers, thereby
stimulating lively discussion. The views expressed in the papers are solely those of the author(s), and neither represent those of
the organization to which the author(s) belong(s) nor the Research Institute of Economy, Trade and Industry.
* This study is conducted as a part of the Project “Global Markets and Japan's Industrial Growth” undertaken at Research Institute of Economy, Trade and Industry (RIETI). This paper is a revised version prepared for presentations at the International Conference of Asia Pacific Economic Association on “China and the World Economy”, March 15, 2013, Tokyo, and the 2nd annual Conference on the Chinese Spatial Economics Association at Zhejiang University, China, November 17–18, 2012. The author would like to thank all the participants and discussants for their helpful comments. The field researches conducted at the Pearl River Delta in 2010-2012 were supported by the Department of Management at Sun Yat-sen University, Guangzhou, China, and the author expresses deep gratitude to Prof. Zhengping Fu at the university. This work is also supported by JSPS, Grant-in-Aid for Young Scientists (Start-up: 24830024), Regional Study Project of the National Institute for the Humanities, Japan.

INDUSTRIAL AGGLOMERATION AND DISPERSION IN CHINA
2
1. Introduction: the End of China as the Workshop of the World?
During the 2000s, China played a central role in so-called “Factory Asia” by assembling a wide
range of manufacturing products utilizing regional intermediate good production network in Asia (ADB,
2013). Since labor costs in China have dramatically increased since the mid-2000s, numerous Chinese
scholars and foreign observers have begun discussing whether China has reached its “Lewisian turning
point” in economic development which implying losing low cost advantage (Cai, 2010; Golley and Meng,
2011). Certain scholars assert that China’s labor-intensive industries, with its high labor costs, will
succumb to latecomer economies, and China’s era as the “workshop of the world” will end1. There is,
however, little agreement regarding whether labor-intensive industries, now concentrated in coastal China
(eastern China), are relocating to other regions. How does agglomeration affect toward this relocation?
How does this relocation process affect Global Value Chains (GVCs) and Asian Production Network
(APN)?2 To examine these issues, this paper investigates the patterns of domestic industrial relocations in
China by utilizing province- and city-level data from 2004 to 2010 and two case studies in China.
With regard to industrial relocations from coastal China, Lin (2011) insists on the possibility of
industrial relocation to sub-Saharan Africa. In contrast, partially due to the significant benefits of the
existing industrial agglomerations in Asia and China, Collier (2007) argues that there are many obstacles
to shifting production to lesser developed countries. Another perspective in recent literature is the
“domestic flying geese pattern,” which focuses on the large gap in economic development and factor
endowments between China’s coastal and interior regions (Ruan and Zhang, 2010; Cai, et al, 2009).
These issues are important to debates on the stability and continuity of China’s economic growth as well
as to Asian and global economies, especially in regard to the industrialization of late comer economies
(Hanson and Robertson, 2010; Wood and Mayer, 2011).
The theory of economic geography insists that the dynamic process of agglomeration economies
typically includes three major benefits (information sharing, labor market polling, and input material
sharing), which contribute toward industrial clustering (Cohen and Paul, 2009). On the other hand, input
factor prices such as wage and land use costs increase with the rapid growth of the economy, resulting in
industrial relocations across regions and countries (Puga and Venables, 1996; Fujita, et al, 1999). In the
case of Japan, during the rapid growth period between 1955 and 1970, manufacturing industries shifted
from the core Tokyo Area to surrounding Kanto region. This relocation led to the formation of the Pacific
industrial belt in Japan (Fujita and Tabuchi, 1997; Mano and Otsuka, 2000). In the case of China, however,
the land mass of China is 26 times larger than that of Japan, which included two major industrial cores
such as the Pearl River and Yangtze Deltas; therefore, spatial reformation can be significantly more 1 China has been called as “workshop of the world” since the early 2000s which typically meaning a large amount of export in a wide range of manufacturing products (from labor-intensive to capital-intensive products) to all over the world. This labelling is actually “Made in Japan.” Zhang ed. (2006), Gao (2012), and Xinhua News Agency(2004) all mentioned the naming is imported from Japanese media and METI’s reports. 2 Regarding facts and features of Asian production network, see Kimura and Obashi(2011).

INDUSTRIAL AGGLOMERATION AND DISPERSION IN CHINA
3
complex and multilayered (Chan, et al, 2008). To approach industrial relocations in China, this paper
(using province- and city-level data) particularly focuses on labor-intensive industries, conducts empirical
estimations of inter-province relocations, and performs two case study on intra-province relocation in
Guangdong.
The rest of this paper is structured as follows. Section 2 summarizes China’s global competitiveness
in labor-intensive products and the basic situation of domestic industrial locations in China. Section 3
specifies the regression model and Section 4 presents the results. As additional case studies, Section 5
investigates the case of Guangdong and Electronics Manufacturing Service (EMS), and Section 6
concludes the paper.
2. Global Product Shares and Domestic Industrial Relocations
2.1. China’s global shares
Before examining domestic industrial locations in China, we briefly summarize the global
competitiveness of China’s labor-intensive products. Figure 1 shows the export specialization indices of
selected emerging economies in labor-intensive products from 1995 to 2010.3 During this period, China
gradually increased its export competitiveness to 0.8 on the export specialization index. During the 2000s,
the indices of no other developing economies increased and China’s export dominance was obvious.4
Table 1 provides the global export shares of Chinese products in more detailed product categories. Until
2010, China’s shares were generally high and displayed a continuous upward trend. Although, they
declined from 2010 to 2011 in product categories such as travel goods and footwear, China’s shares were
still significantly higher in 2011 than in 2000, presenting a clear dominance as the “Workshop of the
World.”
Figure 1
Table 1
2.2. Domestic relocations: literature, data, and policy actions
The spatial economics provides a series of theory regarding locations of industry, which pay
attention to the agglomeration force with input-output linkage, dispersion force including wage gaps, and
other factors such as trade costs (Ottaviano and Puga, 1998; Fujita, et al, 1999). Some of contributions in
this field are highly suggestive to examine the case of China. First, Puga and Venables (1996) describes
3 The export specialization indices are calculated as (Export – Import) /(Export + Import) by product categories. 4 Milberg and Winkler (2010) also show that China expanded its global market shares after the global financial crisis in 2008.
INDUSTRIAL AGGLOMERATION AND DISPERSION IN CHINA
4
the pattern of spread of industry which concluding the labor intensive industries tend to leave first from
the core region due to the higher cost pressure. In addition to that, Puga (1999) shows that the lack of
labor mobility plays dispersion force of industry (“if workers do not move, firms move”). As Golley and
Meng(2011) points out, China’s labor market is not perfectly mobile due to the institutional restrictions
(Hukou system), some call as “temporary working visa system” or “guest worker system,” and wage are
rapidly increasing during the 2000s. Thus, it is valuable to examine the China’s pattern of spatial
relocations.
Empirical researches on China’s industrial location show that industries agglomerated to coastal
areas from the 1980s onward, however, due to the rapid rise in labor and land costs in such areas, they
began dispersing toward interior regions in mid-2000s. Figure 2 shows coastal share of industrial output
from the 1950s to the 2000s. Historically speaking, the recent trend of decreasing coastal share is a totally
different pattern from that of so-called “Reform and Opening” period starting from 1980s. As for spatial
feature of “Reform and Opening” period, Long and Zhang (2011) utilizing China’s economic census data,
shows that China’s industrialization pattern from the 1990s to 2004 was cluster based and the rapid
industrial growth of coastal regions resulted in a high degree of spatial concentration in China.
Figure 2
Regarding to recent change, The Institute of Industrial Economics of CASS (2012) examines China’s
industrial location during the 2000s and demonstrated that the coastal industrial output share began
declining in 2005. Figure 3 shows the coastal area’s share of manufacturing output value in China from
2003 to 2010. In seven selected industries, industrial productions are clearly concentrated, with 70%–95%
of production in 2004 and 2005 being from coastal areas, while its share dropped after the late 2000s. In
this process, the central region increased its output shares by 2%–5%, while the coastal regions’ shares
generally decreased.
Figure 3
As theoretical prediction tells, there are transportation development, migrant mobility, and remaining
wage gap behind the industrial relocations. First, China’s transportation infrastructures, namely the length
of each transportation channels, such as railway, road and highway, river transport, and air route have
been developed drastically during the 2000s. The biggest development has been observed in public road
and highway, expanding 1.67 million km in 2000 to 4.23 million km in 2012 (China Statistical Yearbook,
2013). Second, at the same time, the mobility of migrant worker is decreased in terms of distance during
the 2000s. Table 2 indicates the number of migrant by destinations. The most impressive change is the
total number of intra-province migrant surpassed that of inter-province migrant in 2011. The rural

INDUSTRIAL AGGLOMERATION AND DISPERSION IN CHINA
5
peasants are now choosing the more closed-distance job opportunities from their home town. Third,
despite the decades of vast migration among China, as Figure 4 shows, there is still large income gap,
especially between urban and rural region.
Table 2
Figure 4
Combining the decreasing mobility of worker, rapid development of transportation (which means
decrease of transportation cost), and remaining wage gap together, recently labor intensive industries tend
to relocate to inland provinces as Puga(1999) theoretically predicted (“if workers do not move, firms
move”). This type of domestic industrial dispersion, called the “domestic flying geese pattern” in China,
has been empirically investigated by some Chinese scholars. This perspective implies that labor-intensive
industries relocated from core coastal regions to interior regions because of the higher input cost in the
developed regions. Cai, et al (2009) and Zhang and Liang (2010) estimate production functions by region
and discover that, due to the high-unit labor productivity per wage, industries in the central region have
greater potential to develop during the mid-2000s. Ruan and Zhang (2010), using manufacturing output
data of China’s textile and apparel industries, examine the applicability of the “domestic flying geese
pattern,” finding that domestic industrial location began in coastal regions and relocation to interior
regions commenced in 2005.5 Furthermore, since 2005, China’s central and local governments have
established several industrial relocation programs called chanye zhuanyi zhengce (产业转移政策, see
Table 3). Interior regions such as the Sichuan and Henan provinces attempted to attract manufacturing
industries from the coastal areas. In contrast, coastal provinces such as Guangdong have promoted
intra-province industrial relocation programs since 2004.
Table 3
As mentioned earlier, although researchers such as Cai, et al (2009) and Ruan and Zhang (2010)
have propounded that the domestic industrial relocation model in China, and found an interesting pattern
of relocation, they did not quantitatively evaluate both the agglomeration and dispersion forces proposed
by special economics simultaneously. China includes substantial industrial agglomerations as well as
large factor price gaps. Thus, this study particularly focuses on the multi-force of industrial relocation in
China.
5 Bao et al (2013) pay particular attention to the role of market potential in China, however, their argument focuses on the concentration toward the coastal region. In this paper, our primary interest is to investigate the regional and structural changes among China’s industrial location especially after the late 2000s.

INDUSTRIAL AGGLOMERATION AND DISPERSION IN CHINA
6
3. Model, Data, and Methodology
3.1. Model
To examine both agglomeration and dispersion forces in China, this paper estimates the following
specification presented Hanson (1998) and Gao (2004). The industrial output in i region j industry can be
written as
𝑌𝑖𝑖 = 𝑦�𝑤𝑖𝑖 ,𝐴𝑖𝑖 ,𝐸𝑖𝑖 ,𝑂𝑖𝑖� , (1)
where 𝑤𝑖𝑖 is the wage rate, 𝐴𝑖𝑖 is the technology level, 𝐸𝑖𝑖 denotes external effects in the
local industry, and 𝑂𝑖𝑖 indicates other factors. Taking logarithmic form and differencing Eq.
(1), we have
∆log (𝑌𝑖𝑖) = 𝛼∆log (𝑤𝑖𝑖) + 𝛽∆log (𝐴𝑖𝑖) + ∑ 𝛾𝑘∆𝑙𝑙𝑙(𝐸𝑖𝑖𝑘 ) + ∑ 𝛿𝑚∆𝑙𝑙𝑙(𝑂𝑖𝑖𝑚)𝑀
𝑚=1𝐾𝑘=1 . (2)
Based on Eq. (2), we empirically estimate role of dynamic externality of agglomeration and dispersion forces. The variables are defined in Table 4. The dependent variable is the annual
relative output growth in the i province j industry relative to the national industry average. The
independent variables are as follows. The first and second terms are regarding industrial dispersion forces
which capture the 𝑤𝑖𝑖 and 𝐴𝑖𝑖 in Eq. (2). The first term, relative wage, is the province-industry wage
relative to the national average wage in the previous year to avoid the simultaneity problem. The second
term, “relative KL ratio,” is the province-industry capital labor ratio relative to the national average of all
industry capital labor ratio.6 If labor intensive industry tends to grow faster in the Central and Western
areas, the estimated coefficient will be negative. By contrast, in the coastal area, the coefficient will be
positive due to the structural upgrading of industry at the advanced region. Since that, we hypothesize the
positive coefficient in the coastal area and the negative coefficient in the Central and Western areas.
The third to fifth terms represent dynamic externalities by the agglomeration economies. The third
term, absolute scale of local industry, is the national employment share of i province j industry, while the
fourth term, the local industrial specialization, is measured as the share of province output in the industry
relative to the share of national output in the industry. A higher value of this index indicates more
industrial specialization relative to the national average of the industry. The fifth term, the third source of
agglomeration economies, is the local industrial diversity that measures the sum of the square of province
output shares for all industries, also known as the Hirschman–Herfindahl index. In this regard, a higher
6 If the relative KL ratio is calculated by that of relative to the average j industry capital labor ratio, a part of the province-industry variable at a labor-intensive industry (for example, an apparel industry in x province) becomes larger than that of a capital-intensive industry (for example, a communication equipment industry in y province), evaluating the former is more “capital intensive” than the later. To avoid this problem, we adopted the KL ratio relative to the national average.

INDUSTRIAL AGGLOMERATION AND DISPERSION IN CHINA
7
value indicates less industrial diversity in the province. The sixth to seventh terms include other factors
that may affect output growth. The sixth term denotes the relative scale of establishment calculated by
employment. Finally, the eighth term, profitability of the province-industry, measures the return on assets
related to the industry average.
Table 4
3.2. Data and methodology
Since the Statistical Yearbook of the Chinese Industrial Economy (original title is China Industry
Economy Statistical Yearbook) does not provide some regional two-digit level industry data, we use the
Michigan University China Data Centre Database, which contains two-digit Chinese industrial
classification industries for all provinces, autonomous regions, and municipalities.7
The unit and level of analysis, definitions of regions as well as the descriptive statistics are shown in
Tables 5–6. We constructed the dataset with 28 two-digit industry classifications of 30 province-level
areas for the period from 2004 to 2010. Because of outlying observations, we removed the data for the
Tibet autonomous region. The summary statistics indicate that, during the studied period, relative output
growth was highest in the central region, while relative wage and relative KL ratio were highest in the
eastern region. With regard to agglomeration proxies, the average absolute scale of province-industry by
region is highest in the eastern region. By contrast, the local specialization and local industrial diversity
indices are higher in the western and northeastern regions.
Table 5 and 6
Before presenting the results of a regression analysis, Figures 5 and 6 show basic features of the
relative output growth and KL ratio. In Figure 5, the horizontal axis indicates the KL ratio of the industry
relative to the national industry average, and the vertical axis indicates annual output share changes of the
aggregated eastern region in the national industry (definitions of sub-region are shown in Table 5). The
clear positive correlation implies that growth rates of labor-intensive industries tend to be lower in the
eastern region. At the same time, as Figure 6 shows, the relation between relative output growth and KL
ratio is unclear when decomposed to the province-industry level in the eastern region. Therefore, to fully
understand the determinants of industrial relocation at the province-industry level, it is necessary to
regress to more comprehensive variables.
7 In the case of the Statistical Yearbook of the Chinese Industrial Economy 2011, although it provides 27 of 39 two-digit industry data by province, it does not contain some major labor-intensive industries such as manufacturing of leather products, timber products, and furniture, as well as production of craftwork and cultural, educational, and sports articles. Since industrial agglomerations and relocations are rapidly progressing in these industries in China, estimations on industrial relocation without this industry data is misleading.

INDUSTRIAL AGGLOMERATION AND DISPERSION IN CHINA
8
Figure 5 and 6
Since the Breusch–Pagan–Godfrey test does not reject the existence of heteroscedasticity, the
Feasible Generalized Least Square (FGLS) estimations with control variables (such as year dummy) are
conducted. We estimate both the national and regional regressions to investigate the regional differences.
During the examined period, the Chow test indicates statistically significant structural changes of
parameters at the 1% level, and the strongest support is observed while t = 2008. Thus, we also estimated
the first and second halves of the period separately.
4. Results and Discussions
4.1. Estimation results
Table 7 presents the baseline results for national regressions with and without semi-macro regional
dummies such as the eastern, central, western, and northeastern regions. Results suggest that the relative
wage generally had a negative effect on relative output growth, which means that the industrial growth
rate was inversely proportional to the relative wage in the industry. By contrast, the parameters of the
relative KL ratio are inconsistent and not statistically significant because its roles varied across regions as
we see in the following step. Next, with regard to agglomeration forces, the parameters of the absolute
scale are negative in columns [1], [3], and [5], but they are positive after controlling the semi-macro
regional dummy variable as columns [2], [4], and [6]. Since the eastern region dummies are generally
negative and statistically significant, the absolute scale of province-industry positively influences relative
output growth. A part of reasons for negative parameters of the eastern region dummy would be the effect
of policy adjustments taken by the central government on the regional development. On the other hand,
both the local specialization and concentration of local-industry-composition indices are generally
negative, indicating that the specialization and concentration has a negative effect.
Table 7
This study primarily investigates the regional differences among industrial relocations in China.
Table 8 indicates the results of regional regressions. The most important result is the role of the relative
KL ratio; positive results are obtained in the eastern region (columns [1]–[3]). In contrast, negative
coefficients are observed in the central region (columns [4] and [6]). These results suggest that the
capital-intensive industries grow faster in eastern regions while labor-intensive industries grow faster in
central regions especially after the 2007, which support the progression of the “domestic flying geese

INDUSTRIAL AGGLOMERATION AND DISPERSION IN CHINA
9
pattern” in industrial relocation based on the relative KL ratio. In addition, although the local industrial
specialization results in slower growth during this period, the absolute scale of the province-industry has a
simultaneous positive effect, suggesting existence of an agglomeration effect
Table 8
In sum, the results suggest that, during this period, both diversion and agglomeration forces affect
industrial relocation in China. To assess the robustness of the results, estimations with provincial
dummies are conducted, as shown in the appendix. These results also support that both the previously
mentioned forces are effective.
4.2. Discussion
The empirical results describe the general features of the “post-Lewisian turning point” pattern of
industrial relocations in China. First, as the relative KL ratio has varying effects across regions, the
“domestic flying geese pattern” has been observed. Labor-intensive industries in the central region may
have grown faster based on cheaper wages relative to coastal regions. Second, although these dispersion
patterns have been observed, agglomeration forces and other factors such as profitability is also important
to understanding industrial relocation in China. Thus, the viewpoint of the “domestic flying geese pattern”
stated by the related literatures is biased. Therefore, we should approach China’s domestic industrial
relocations using a more complicated, multilayered perspective.
5. Additional Case Studies
5.1. Intra-province relocations in Guangdong Province
To deeply understand industrial relocations in China, additional case studies are helpful. An aspect
that the above provincial-level analysis cannot examine is intra-provincial relocations, that is, city- and
county-level relocations. As Table 4 shows, Guangdong initiated intra-province relocation programs in
2005, immediately after rapidly rising wages were observed in the Pearl River Delta.8
Major policy initiatives undertaken by the Guangdong provincial government are presented in Table
9. Their policy aimed to relocate labor-intensive industries from the six “core” cities (Guangzhou,
Shenzhen, Dongduan, Zhongshan, Zhuhai, and Foshan) to eastern, western, and “mountain areas” in order
to promote the development of more high-tech and research and development (R&D) based industries in
the core region.9 Such policy tools include preferential tax treatment, administrative treatment, and
8 Another well-known intra-provincial relocation emerged in the Jiangsu province of the Yangtze Delta; some industries relocated from the southern part of Jiangsu (Sunan) to its northern part (Subei). 9 Policy documents refer to these six cities as the “core six cities of the Pearl River Delta (Zhusanjiao Hexin liushi).”
INDUSTRIAL AGGLOMERATION AND DISPERSION IN CHINA
10
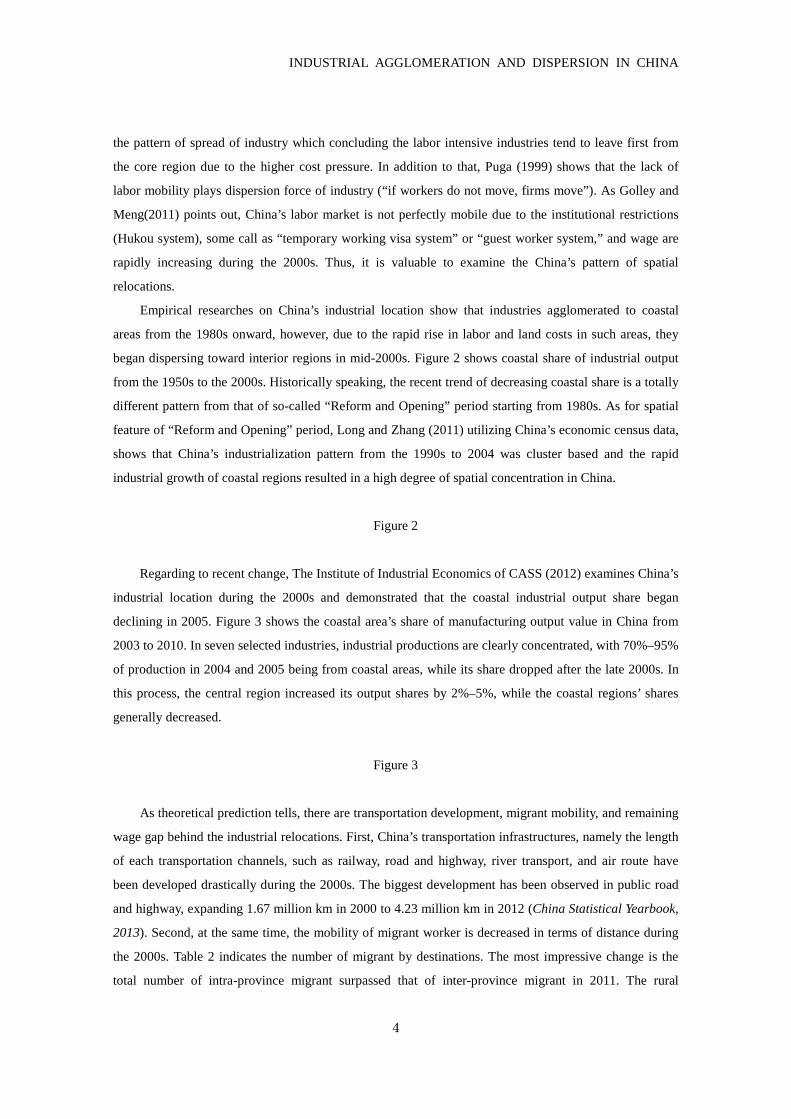
establishment of Industrial Relocation Parks. These parks have been the most direct tool for
intra-province relocation; 24 were established by June 2008, and they increased to 36 by December 2011.
Table 9
Although it is difficult to construct the city-industry level dataset nationwide, in the case of
Guangdong, we can utilize city-industry level data provided by the Statistical Yearbook of Guangdong
Province. Table 10 summarizes the shares of the six core cities, especially with regard to the number of
firms and industrial output in the selected industries. In the case of labor-intensive industries, these core
cities generally decrease shares, while substantial increases have been observed in electronics and
communication industries. The core cities develop more capital- or technology-intensive industries
compared to the remainder of the province.
Table 10
Figure 7 presents the industrial output shares by cities in cultural, educational, and sports products
manufacturing industries, a labor intensive industry. Certain core cities, such as Guangzhou, Dongguan,
and Shenzhen, decreased their output shares, while non-core cities, such as Shantou and Qingyuan,
increased its output by 6% to 9%. Shantou, in western Guangdong, contains developing toy clusters in
Chenghai10. Since the toy industry in Guangdong dominates—with a 60% share in cultural, educational,
and sports products manufacturing industries—these share changes are primarily caused by newly
growing clusters outside the core of the Pearl River Delta. From 2005 to 2009, the Pearl River Delta
(Guangdong) increased its national output share by 1.05% in spite of the average labor-intensive industry
dropping its shares in coastal China. In addition, China’s global shares exhibited an upward trend in
product categories such as toys and sporting goods during the same period (see Table 1).
Figure 7
By contrast, there are also developing clusters of labor-intensive industries within the core of the
Pearl River Delta. Figure 8 shows the city-level output shares in craftwork and other industries in
Guangdong. Figure 8 clearly presents Shenzhen’s rapid share expansion from 2004 to 2010. Similar to the
case of the cultural, educational, and sports product industry, Guangdong’s share in this industry’s
national output has increased, proving that, even in the core cities in the coastal China, some local
10 Author also conducted field interviews in Chenghai city in 2011. Local government officers suggest that Chenghai has grown more rapidly after the financial crisis in 2008, partially because of decline of Dongguan city, an well-known toy manufacturing city in Pearl River Delta. Another reason was relatively low-cost land price and wage in Chenghai.

INDUSTRIAL AGGLOMERATION AND DISPERSION IN CHINA
11
labor-intensive industries are continuously growing.
Figure 8
The above facts reflect that growth of city- or even county-level industrial clusters in and outside the
core cities were a primary cause for the expansion of Guangdong’s domestic share and China’s global
competitiveness. Although a regression analysis suggests that capital-intensive industries tend to grow
faster in coastal areas, there is significant divergence within the coastal labor intensive industry clusters as
some of them continue developing (due to the high capabilities of local industrial clusters) and some lose
competitiveness, especially after 2004.
5.2. Impact of EMS relocation on Asian Production Network
To examine the impact on Global Value Chain and Asian Production Network driven by relocations
of Chinese industry, another case study on Electronics Manufacturing Service (EMS), such as Foxconn,
an well-known Taiwanese assembler of Apple products, is especially informative. Since the 2010,
Foxconn decided to invest inland China regions instead of coastal region, started up massive scale
factories in Zhengzhou city (Henan province), Chengdu city (Sichuan province), Chongqing city (a
municipal city), and etc. Each factory has over 100,000 employees and exporting a large amount of
electronics products including i-phone and i-pad. These relocations are driven by mainly Taiwanese EMS
companies, and resulting a sky-rocketing export boost in inland cities as Figure 9 present. Export value of
inland major cities increased dramatically after the 2010.
Figure 9
In the case of Zhengzhou city in Henan province, since there was no notable electronics industry and
other exporting industry, its trade volume increased by multi-hundred percent in recent years. Noteworthy,
Foxconn’s set up and export of Apple products completely changed the trade structure of whole
Zhengzhou city. Electrical Apparatus for telephone (HS 8517) dominates 94.3% export share of
Zhengzhou city in 2012 while the share was just 0.1% in 2009 surprisingly. Figure 10 shows the shares of
import partner of the city from 2007 to 2012. Remarkable share increases of Korea, China (means import
from China’s Free Trade Zones), Japan, Taiwan, Vietnam, and Malaysia have been observed. Details of
import by HS 8 digit level are shown in Table 11. To produce IT products, Apple products including
i-phone 4 for example, Zhengzhou imported a large amount of intermediate goods including processor
memory from Korea and Taiwan, phone parts from Free Trade Zones of China, cameras from Vietnam
and Korea, and machining center from Japan. It is noteworthy that major imported products in 2012, all
INDUSTRIAL AGGLOMERATION AND DISPERSION IN CHINA
12
the products in listed Table 11 except iron ores from Australia, accounted for 41.69% of Zhengzhou’s
import in 2012 (7771 million USD), however, it accounted for only 1.43% in 2010 (58 million USD), just
two years ago.
Figure 10
Table 11
This import structure clearly presents a new adjustment of Asian Production Network. Note that the
domestic industrial relocations in China expanded the spatial frontier of Asian Production Network. The
old-fashioned “China as workshop of the world” largely meant “made in coastal China” in the 2000s,
however, it is not a case anymore. In the 2010s, the China’s domestic industrial relocations show a new
spatial feature, and it also has large impacts on reformation and adjustment of Asian Production Network,
in other word, Factory Asia.
6. Concluding Remarks
This paper examined the patterns of domestic industrial relocation in China. Many recent studies
have argued the “Lewisian turning point,” which presents the exhaustion of rural surplus labor. However,
few studies have examined the patterns of industrial relocation during the late 2000s. Following the
perspective of spatial economics, this paper focused on the dynamic role of both agglomeration and
dispersion forces. The regression results show that the capital–labor ratio is positively related to industrial
output growth in coastal areas but negatively related in the Central region. Although agglomeration
economies have been weak, the absolute scale of local industry includes a positive effect, suggesting both
of the dispersion and agglomeration forces influenced local industrial growth during the late 2000s. Thus,
so-called “domestic flying geese pattern” view which typically insists only the dispersion force, is
one-sided. As a continental state often called the “workshop of the world,” China’s spatial economy
shows both substantial agglomerations and dispersion forces.
It is noteworthy that the same pattern was observed in the case of the Guangdong intra-province
relocations. As presented earlier, some labor-intensive industry clusters are continuously growing in and
around the core of the Pearl River Delta. From the view point of a firm, there are several options to
choose; relocate within a province, relocate to other province, and upgrading without moving. At the
same time, policy makers including the central and local governments have different policy goals of
industrial relocations in China. At least we can point out that there are domestic mechanisms, namely
domestic relocation and agglomeration economies sustaining the global competitiveness even in labor
intensive industries in China.

INDUSTRIAL AGGLOMERATION AND DISPERSION IN CHINA
13
A case study on Foxconn in Zhengzhou city also suggests expansion of a spatial frontier toward
inland China and a massive impact on Asian Production Network. Although some asserts the end of
“China as workshop of the world,” it is more reasonable to have a hypothesis that “Factory Asia” and
“China as workshop of the world” are stepping into a next stage, say “Factory Asian version 2.0” which
connecting inland China and ASEAN countries with a larger amount of manufacturing trade. To examine
new changes of Asian Production Network after the late 2000s, China’s multi-force dynamics, namely
China’s local agglomerations, domestic relocations, factor price gaps, and related industrial policies
should be further investigated.

INDUSTRIAL AGGLOMERATION AND DISPERSION IN CHINA
14
Figures and Tables
Figure 1. Export specialization index of labor intensive products in selected countries and regions
Figure 2. Industrial output share by coastal and two delta regions
-0.6
-0.4
-0.2
0
0.2
0.4
0.6
0.8
119
9519
9619
9719
9819
9920
0020
0120
0220
0320
0420
0520
0620
0720
0820
0920
10
China
ASEAN
LatinAmerica
Sub-SaharanAfrica
India
Source: UNCTAD database.
0%
10%
20%
30%
40%
50%
60%
70%
80%
195
2 1
954
195
6 1
958
196
0 1
962
196
4 1
966
196
8 1
970
197
2 1
974
197
6 1
978
198
0 1
982
198
4 1
986
198
8 1
990
199
2 1
994
199
6 1
998
200
0 2
002
200
4 2
006
200
8 2
010
Coastal Two Delta Regions
Note: Coastal Region includes Beijing, Tianjin, Hebei, Shandong, Jiangsu, Shanghai, Zhejiang, Fujian, and Guangdong, and Two Delta Regions include Jiangsu, Shanghai, Zhejiang, and Guangdong. Since there are many missing data of Guangdong before the 1978, only limited years are shown during the 1950s to 1970s.Source: University of Michigan, China Data Centre Data Base.
Planned Economy period Reform and Opening period

INDUSTRIAL AGGLOMERATION AND DISPERSION IN CHINA
15
Figure 3. Falls of coastal output in labor intensive industries
Figure 4. Yearly wage of private manufacturing enterprises by province (2011, RMB)
50%
55%
60%
65%
70%
75%
80%
85%
90%
95%
100%
2003 2004 2005 2006 2007 2008 2009 2010
Textiles
Apparel, shoes, andhats
Leather goods
Wood related goods
Furniture
Stationery, education,and sports relatedgoodsHandcraft goods
Source: University of Michigan, China Data Centre Database .
0
5000
10000
15000
20000
25000
30000
35000
40000
Beiji
ngTi
anjin
Zhej
iang
Jiang
suG
uang
dong
Chon
gqin
gIn
ner M
ongo
riaSh
angh
aiFu
jian
Shan
dong
Xinj
iang
Nat
iona
l Ave
rage
Anhu
iG
uizh
ouLi
aoni
ngN
ingx
iaSi
chua
nHe
bei
Huna
nHa
inan
Jiang
xiHu
bei
Qin
ghai
Gua
ngxi
Yunn
anHe
ilong
jiang Jilin
Shan
xiSh
aanx
iHe
nan
Gan
su
Urban
Rural
Note: Rural data of Guizhou is not available. Rural wage in Shanghai exceeds that of urban in original data.Source: Urban wage data is from China Statistical Yearbook, and rural data is from China Township and Village Enterprises and Agricultural Processing Industry Yearbook.

INDUSTRIAL AGGLOMERATION AND DISPERSION IN CHINA
16
Figure 5. KL ratio and regional output share changes of the aggregated eastern region
(2004-2010)
Figure 6. KL ratio and regional output share changes of
individual province-industry in eastern region (2004-2010)
-.1-.0
50
.05
Yea
rly s
hare
cha
nge
0 1 2 3 4 5relative KL-ratio of industry
-.04
-.02
0.0
2.0
4ye
arly
sha
re c
hang
e
-4 -3 -2 -1 0 1 2 3 4ln(relative KL-ratio of i province j industry)

INDUSTRIAL AGGLOMERATION AND DISPERSION IN CHINA
17
Figure 7. City-level output shares of cultural, educational, and sporting goods industries in
Guangdong
Note: Cities with less than 5% share in the province are omitted.
Source: Statistical Yearbook of Guangdong Province.
Figure 8. City-level output shares of craft and other industries in Guangdong
Note: Cities with less than 5% share in the province are omitted.
Source: Statistical Yearbook of Guangdong Province.
0%
5%
10%
15%
20%
25%
2003 2004 2005 2006 2007 2008 2009 2010
Guangzhou
Shenzhen
Shantou
Foshan
Dongguan
Zhongshan
Qingyuan
0%
5%
10%
15%
20%
25%
30%
35%
40%
45%
50%
2003 2004 2005 2006 2007 2008 2009 2010
Guangzhou
Shenzhen
Shantou
Foshan
Dongguan
Zhongshan
Jiangmen
Zhaoqing

INDUSTRIAL AGGLOMERATION AND DISPERSION IN CHINA
18
Figure 9. Export by Chinese inland cities
Source: GTA data.
Figure 10. Import partner change of Zhengzhou city, Henan province
Source: GTA database.
0
5
10
15
20
25
1999
2000
2001
2002
2003
2004
2005
2006
2007
2008
2009
2010
2011
2012
Billi
on U
SD
Nanning
Wuhan
Chongqing
Chengdu
Tiayuan
Changsha
Xian
Zhengzhou
0%
5%
10%
15%
20%
25%
2007 2008 2009 2010 2011 2012
Korea, South
China
Japan
Taiwan
Australia
United States
Vietnam
Malaysia
Germany
Brazil

INDUSTRIAL AGGLOMERATION AND DISPERSION IN CHINA
19
Table1. China's global export share in labor-intensive products
Table 2. Destination of migrant worker (%)
Table 3. Industrial relocation programs in China
Product 1995 2000 2005 2006 2007 2008 2009 2010 2011Leather products 3% 6% 13% 14% 12% 10% 11% 11% 12%Manufactured wood products 4% 8% 13% 15% 16% 17% 17% 19% 20%Paper and paper related products 1% 2% 4% 5% 6% 6% 6% 7% 8%Textile related products 10% 12% 21% 23% 23% 25% 27% 29% 29%Lime, cement, fabrica, etc. 4% 7% 13% 15% 16% 16% 17% 18% 19%Glassware 3% 6% 11% 12% 14% 15% 15% 17% 18%Pottery 27% 39% 49% 52% 52% 53% 55% 59% 58%Furniture and parts 7% 15% 27% 29% 29% 30% 31% 34% 32%Travel goods, handbags, etc. 47% 54% 60% 60% 59% 59% 58% 60% 56%Articles of apparel 22% 25% 35% 36% 38% 39% 41% 43% 42%Footwear 33% 41% 46% 47% 46% 46% 47% 50% 48%Baby carriages, toys, games, andsporting goods
40% 55% 61% 63% 66% 66% 66% 66% 64%
Source: UNCTAD database.
Intra-province migrant
Inter-province migrant
Intra-province migrant
Inter-province migrant
Intra-province migrant
Inter-province migrant
Intra-province migrant
Inter-province migrant
2008 46.7 53.3 79.7 20.3 29.0 71.0 37.0 63.02009 48.8 51.2 79.6 20.4 30.6 69.4 40.9 59.12010 49.7 50.3 80.3 19.7 30.9 69.1 43.1 56.92011 52.9 47.1 83.4 16.6 32.8 67.2 43.0 57.02012 53.2 46.8 83.7 16.3 33.8 66.2 43.4 56.6
National total from Eastern Region from Central region from Western region
Note: Eastern region includes Beijing, Tianjin, Liaoning, Shanghai, Jiangsu, Zhejiang, Fujian, Shandong,Guangdong, and Hainan, Central region includes Shanxi, Jilin, Heilongjiang, Anhui, Jiangxi, Henan, Hubei,and Hunan, Western region contains Inner Mongria, Guangxi, Chongqing, Sichuan, Guizhou, Yunnan,Tibet, Shaanxi, Gansu, Qinghai, Ningxia, and Xinjiang.Source: China National Statistical Bureau "National Peasant Supervision Research Report," 2009,2011, and 2012.

INDUSTRIAL AGGLOMERATION AND DISPERSION IN CHINA
20
Table 4. Definition of variables
The dependent
variable
Relative output growth 𝑙𝑙 �
𝑌𝑖𝑖𝑖𝑌𝑖� − 𝑙𝑙 �
𝑌𝑖𝑖𝑖−1𝑌𝑖−1
�
Dispersion
forces
(1) Relative wage 𝑙𝑙 �
𝑊𝑊𝑙𝑊𝑖𝑖𝑖−1𝐿𝑖𝑖𝑖−1
� − 𝑙𝑙 �𝑊𝑊𝑙𝑊𝑖−1𝐿𝑖−1
�
(2) Relative KL ratio 𝑙𝑙 �
𝐴𝐴𝐴𝑊𝐴𝑖𝑖𝑖−1𝐿𝑖𝑖𝑖−1
� − 𝑙𝑙 �𝐴𝐴𝐴𝑊𝐴𝑖−1𝐿𝑖−1
�
Agglomeration
forces
(3) Absolute scale of
local industry
𝑙𝑙 �𝐿𝑖𝑖𝑖−1 𝐿𝑖−1� �
(4) Local industrial
specialization 𝑙𝑙 �
𝑌𝑖𝑖𝑖−1𝑌𝑖𝑖−1
� − 𝑙𝑙 �𝑌𝑖𝑖−1𝑌𝑖−1
�
Date Policy maker Name of policies
Mar., 2005People's government of
Guangdong province
An opinion on strengtheningcooperative industrial relocations inmountain, west, and east regions withPearl River Delta in our province
Aug., 2005People's government of
Sichuan province
An opinion on strengtheningcooperation in receiving industrial
relocations with Greater Pearl RiverDelta
May, 2008People's government ofInner Mongolia province
An instructive opinion on receivingindustrial relocations from developed
regions
Aug., 2009People's government of
Henan province
A circular on a meeting on receivingindustrial relocations of Taiwanese
companies
Dec., 2010People's government of
Hebei province
An implementation opinion onstrengthening receiving industrial
relocations
Apr., 2011People's government of
Hainan provinceAn implementation opinion onreceiving industrial relocations
Jun., 2011People's government of
Qinghai province
A circular on plan of implementationof receiving industrial relocation from
Eastern area
Jul., 2010Ministry of industry and information technology
of the PRC
An instructive opinion on progressthe relocations of textile industries
Aug., 2010State Council of thePeople's Republic of
China
An instructive opinion on receivingindustrial relocations in Central and
Western regions
Dec., 2011State administration forindustry and commerce
of the PRC
A working opinion on coherentregister of receiving industrial
relocations in Central and Westernregions
Provincial government
Central government
Source: Each government's documents, local newspapers, and related domestic literatures.

INDUSTRIAL AGGLOMERATION AND DISPERSION IN CHINA
21
(5) Local industrial
diversity ln �∑ �𝑌𝑖𝑖𝑖−1 𝑌𝑖𝑖−1
� �𝑖 �2
Other
independent
variables
(6) Relative scale 𝑙𝑙 �
𝐿𝑖𝑖𝑖−1𝐸𝐸𝐸𝑖𝑖𝑖−1
� − 𝑙𝑙 �𝐿𝑖−1𝐸𝐸𝐸𝑖−1
�
(7) Relative
profitability 𝑙𝑙
⎝
⎜⎛𝑃𝑃𝑙𝑃𝑃𝐴𝑖𝑖𝑖−1 𝐴𝐴𝐴𝑊𝐴𝑖𝑖𝑖−1⁄
𝑃𝑃𝑙𝑃𝑃𝐴𝑖−1 𝐴𝐴𝐴𝑊𝐴𝑖−1⁄� + 1
⎠
⎟⎞
Note: t = initial period, i = province, j = industry, Y = output, L = employment, Asset = fix asset,
T_Asset = total asset, EST = number of firms, Profit = total profit.
Table 5. Studied industries, areas, and period
Table 6. Descriptive statistics
Industries(28 two-digit)
Food Production; Beverage Production; Tobacco Products Processing;Textile Industry; Clothes, Shoes and Hat Manufacture; Leather, Furs, Downand Related Products; Timber Processing, Bamboo, Cane, Palm Fiber andStraw Products; Furniture Manufacturing; Papermaking and Paper Products;Priting and Record Medium Reproduction; Cultural, Educational and SportsArticles Production; Raw Chemical Material and Chemical Products; Medicaland Pharmaceutical Products; Chemical Fiber; Rubber Products; PlasticProducts; Nonmetal Mineral Products; Smelting and Pressing of FerrousMetals; Smelting and Pressing of Non-ferrous Metals; Metal Products;Ordinary Machinery Manufacturing; Special Equipment Manufacturing;Transport Equipment Manufacturing; Electric Machines and ApparatusesManufacturing; Communications Equipment, Computer and Other ElectronicEquipment Manufacturing; Instruments, Meters, Cultural and Office MachineryManufacture; Craftwork and Other Manufactures
Areas(30 provinces)
East:Beijing, Tianjin, Hebei, Shandong, Jiangsu, Shanghai, Zhejiang, Fujian,Guangdong, HainanCentral:Shanxi, Henan, Hubei, Hunan, Jiangxi, AnhuiWestern and North-East:Sichuan, Chongqing, Gansu, Guizhou, Ningxia,Qignhai, Shaanxi, Guangxi, Yunnan, Xinjiang, Inner Mongoria, Liaoning, Jilin,Heilongjiang
Period(7 years)
from 2004 to 2010

INDUSTRIAL AGGLOMERATION AND DISPERSION IN CHINA
22
Table 7. National estimation results
Mean Std. Dev. Min Max Mean Std. Dev. Min MaxRelative output growth 1.034 0.299 0.048 11.315 0.970 0.212 0.299 7.138Relative wage 0.969 0.512 0.161 9.623 1.122 0.642 0.290 9.623Relative KL ratio 1.187 1.206 0.024 25.962 1.317 1.670 0.055 25.962Absolute scale of local industry 0.001 0.003 0.000 0.038 0.003 0.004 0.000 0.038Local industrial specialization 1.037 1.203 0.004 22.799 1.025 0.771 0.027 6.855Local industrial diversity 0.114 0.050 0.054 0.259 0.104 0.039 0.054 0.208Relative scale of establishments 1.275 1.231 0.100 26.769 1.065 0.836 0.237 9.001relative profitability 0.906 0.754 -1.033 7.699 1.054 0.677 -0.659 7.062
Mean Std. Dev. Min Max Mean Std. Dev. Min MaxRelative output growth 1.081 0.185 0.478 2.421 1.061 0.380 0.048 11.315Relative wage 0.853 0.407 0.290 4.104 0.906 0.404 0.161 4.586Relative KL ratio 1.047 0.815 0.109 9.012 1.152 0.877 0.024 9.398Absolute scale of local industry 0.001 0.001 0.000 0.007 0.000 0.001 0.000 0.006Local industrial specialization 0.984 0.776 0.004 5.736 1.070 1.581 0.005 22.799Local industrial diversity 0.103 0.059 0.063 0.254 0.127 0.051 0.062 0.259Relative scale of establishments 1.348 1.295 0.110 17.494 1.403 1.421 0.100 26.769relative profitability 1.112 0.939 -0.657 7.699 0.695 0.652 -1.033 7.193
Mean Std. Dev. Mean Std. Dev. Mean Std. Dev. Mean Std. Dev.ln(Relative output growth) 0.009 0.213 -0.045 0.160 0.064 0.168 0.025 0.254ln(Relative wage) -0.118 0.390 0.026 0.383 -0.236 0.366 -0.174 0.374ln(Relative KL ratio) -0.111 0.739 -0.073 0.788 -0.191 0.691 -0.102 0.719ln(Absolute scale of local industry) -7.767 1.615 -6.942 1.623 -7.582 1.186 -8.491 1.444ln(Local industrial specialization) -0.390 1.009 -0.235 0.779 -0.325 0.872 -0.541 1.189ln(Local industrial diversity) -2.256 0.407 -2.330 0.378 -2.389 0.433 -2.137 0.382ln(Relative scale of establishments) 0.023 0.597 -0.102 0.522 0.089 0.575 0.089 0.646ln(relative profitability) 0.575 0.381 0.672 0.311 0.667 0.393 0.457 0.392
the Central regionthe Western and
Northeastern
National Eastern CentralWestern andNortheastern
National the Eastern region
[1] [2] [3] [4] [5] [6]
-0.0883 -0.0338 -0.1094 -0.0583 -0.0528 -0.0045[0.0070]*** [0.0071]*** [0.0096]*** [0.0099]*** [0.0105]*** [0.0102]
0.0167 0.0052 0.0242 0.0142 0.0067 -0.006[0.0036]*** [0.0034] [0.0050]*** [0.0048]*** [0.0052] [0.0048]
-0.0022 0.0171 0.0022 0.0195 -0.0073 0.0139[0.0018] [0.0020]*** [0.0024] [0.0028]*** [0.0025]*** [0.0028]***
-0.0077 -0.0218 -0.0046 -0.018 -0.0129 -0.0262[0.0033]** [0.0032]*** [0.0045] [0.0045]*** [0.0047]*** [0.0046]***
-0.0229 -0.011 -0.0334 -0.0228 -0.0056 0.0047[0.0060]*** [0.0057]* [0.0081]*** [0.0078]*** [0.0090] [0.0084]
-0.0128 -0.0346 -0.0059 -0.0272 -0.0243 -0.0436[0.0040]*** [0.0040]*** [0.0056] [0.0057]*** [0.0058]*** [0.0057]***
0.0523 0.066 0.054 0.0744 0.053 0.0506[0.0069]*** [0.0068]*** [0.0096]*** [0.0096]*** [0.0102]*** [0.0099]***
-0.097 -0.0836 -0.1087[0.0079]*** [0.0117]*** [0.0107]***
0.0147 0.0158 0.0169[0.0082]* [0.0118] [0.0114]
0.0078 0.0076 0.0094[0.0082] [0.0117] [0.0115]
Year Dummy Yes Yes Yes Yes Yes Yes-0.1097 0.0876 -0.1061 0.0637 -0.0884 0.1331
[0.0210]*** [0.0224]*** [0.0282]*** [0.0307]** [0.0308]*** [0.0321]***Adjusted R square 0.0663 0.1515 0.0789 0.1387 0.0589 0.1748
Observations 4694 4694 2341 2341 2353 2353
2004-2010 2004-2007 2007-2010
ln(relative profitability)
Eastern region dummy
Central region dummy
Western dummy(not include Northeastern)
Constant
Note: * indicates statistical significance at the 0.1 level, ** indicates statistical significance at the 0.05 level, ***indicates statistical significance at the 0.01 level.
ln(Relative wage)
ln(Relative KL ratio)
ln(Absolute local industry scale)
ln(Local industrial specialization)
ln(Local industrial diversity)
ln(Relative scale of establishments)

INDUSTRIAL AGGLOMERATION AND DISPERSION IN CHINA
23
Table 8. Regional estimation results
Table 9. Intra-province relocation programs taken by the Guangdong provincial government
Table 10. "Core" six cities' shares in selected industries in Guangdong province
[1] [2] [3] [4] [5] [6] [7] [8] [9]
2004-2010 2004-2007 2007-2010 2004-2010 2004-2007 2007-2010 2004-2010 2004-2007 2007-2010-0.0658 -0.0668 -0.0541 0.0048 -0.0759 0.0804 -0.0295 -0.0494 -0.0002
[0.0095]*** [0.0129]*** [0.0144]*** [0.0152] [0.0226]*** [0.0203]*** [0.0175]* [0.0252]* [0.0246]0.023 0.0254 0.0185 -0.0221 0.0036 -0.0521 0.0019 0.0065 -0.0027
[0.0044]*** [0.0061]*** [0.0065]*** [0.0082]*** [0.0115] [0.0112]*** [0.0097] [0.0145] [0.0130]0.0173 0.0209 0.0125 0.0056 0.0027 0.0089 0.0224 0.0234 0.0204
[0.0025]*** [0.0035]*** [0.0035]*** [0.0049] [0.0071] [0.0066] [0.0048]*** [0.0071]*** [0.0064]***-0.0186 -0.0179 -0.0188 -0.0107 -0.0039 -0.0252 -0.0246 -0.0149 -0.0378
[0.0050]*** [0.0069]** [0.0071]*** [0.0079] [0.0110] [0.0109]** [0.0071]*** [0.0102] [0.0097]***-0.0168 -0.035 0.0077 -0.0469 -0.0581 -0.0259 0.0034 0.0002 0.0069
[0.0078]** [0.0108]*** [0.0113] [0.0140]*** [0.0183]*** [0.0215] [0.0132] [0.0194] [0.0180]-0.0074 -0.009 -0.007 -0.0524 -0.0297 -0.0679 -0.0361 -0.0265 -0.0491
[0.0057] [0.0078] [0.0085] [0.0084]*** [0.0132]** [0.0104]*** [0.0087]*** [0.0130]** [0.0115]***0.0777 0.0624 0.0985 0.0158 0.0607 -0.0209 0.0594 0.0545 0.057
[0.0107]*** [0.0147]*** [0.0158]*** [0.0134] [0.0192]*** [0.0191] [0.0148]*** [0.0209]*** [0.0216]***Year Dummy Yes Yes Yes Yes Yes Yes Yes Yes Yes
-0.0099 -0.0196 -0.0133 -0.0174 -0.1086 0.122 0.1383 0.1363 0.1901[0.0269] [0.0366] [0.0392] [0.0543] [0.0745] [0.0759] [0.0560]** [0.0822]* [0.0743]**
Adjusted R square 0.0906 0.119 0.0688 0.1365 0.1491 0.1958 0.0719 0.0437 0.1011Observations 1618 810 808 983 492 491 1606 797 809
The Eastern Region The Central RegionThe Western and
Northeastern Region
ln(relative profitability)
Constant
ln(Relative wage)
ln(Relative KL ratio)
ln(Absolute local industry scale)
ln(Local industrial specialization)
ln(Local industrial diversity)
ln(Relative scale of establishments)
Date Responsible unit of program Name of programs Major contents
Sep 27, 2002People's government of
Guangdong province
A decision on acceleration ofthe development in the
mountain regions
Promoting infrastructuredevelopment and industrialdevelopment in moutain areas
March 7, 2005People's government of
Guangdong province
An opinion on strengtheningcooperative industrial
relocations in mountain, west,and east regions with PearlRiver Delta in our province
Establishing the "IndustrialRelocation Parks"
May 24, 2008People's government of
Guangdong province
A decision on promotingindustrial relocations and labor
migrations
Setting the policy goals andprinciple of programs, andpresenting major policy tools
June 17, 2008The Administration for
industry and commerce ofGuangdong Province
Carrying out "A decision onpromoting industrial relocations
and labor migrations"
Permitting the use of companyname in relocated areas, andprohibiting relocation ofpollutions, and minimizing theadministrative cost of firmrelocations
June 23, 2008The Economic and Trade
Commission of GuangdongProvince
An Instructive opinion on theformation of industrial
relocation in Guangdongprovince
Listing relocation-promotedindustries and relocation-prohibited industries, andsetting the main industries ofeach of "Industrial RelocationParks"
June 24, 2008The Economic and Trade
Commission of GuangdongProvince
A Trial law of policy targetsand responsibility on industrial
relocations in Guangdongprovince
Setting the evaluation systemto city-level governmentactions toward industrialrelocations
2009The Academy of SocialSciences of Guangdong
Province
A master plan of regionalformation of industrial
relocations in Guangdongprovince
Presenting the needs, priciples,targets, and overall plan ofspatial relocations
Source: Local government documents and local newspapers.

INDUSTRIAL AGGLOMERATION AND DISPERSION IN CHINA
24
Table 11. Zhengzhou's major import products (2010-2012)
Appendix table
Sharesin 2003
Shares in 2007
Shares in 2010
ShareChangesin 2003-
2010
Sharesin 2003
Shares in 2007
Shares in 2010
ShareChangesin 2003-
2010Texitile industry 62.81% 60.59% 60.83% -1.98% 63.32% 64.55% 63.13% -0.19%Clothes, Shoes, and Hatmanufacturings
67.81% 66.14% 60.92% -6.89% 66.53% 71.44% 62.50% -4.03%
Leather, Furs, Down andrelated producsmanufacturings
62.05% 63.72% 64.19% 2.15% 68.06% 73.21% 64.64% -3.43%
Timber processing andrelated productsmanufacturing
45.05% 47.32% 36.28% -8.77% 45.28% 44.73% 39.11% -6.17%
Furniture manufacturing 68.80% 79.27% 80.72% 11.92% 77.62% 80.77% 79.35% 1.73%Cultural Educational andSports Articlesmanufacturings
73.79% 67.21% 63.09% -10.70% 82.61% 77.05% 61.28% -21.33%
Craftwork and othermanufacrturings
54.43% 56.94% 57.97% 3.54% 65.16% 80.36% 80.70% 15.53%
Electric Machines andApparatuses Manufacturing
75.16% 83.66% 81.96% 6.80% 84.23% 88.05% 86.88% 2.65%
Communications Equipment,Computer and OtherElectronic EquipmentManufacturing
78.45% 84.34% 82.53% 4.08% 85.50% 88.42% 87.01% 1.50%
Source: Statistical Yearbook of Guangdong Province .
Number of firms Industrial output
2010 2011 2012 2010 2011 2012Total - - 4091.7 9085.3 18641.5 100% 100% 100% -
1Korea,South
85423100 Processors And Controllers 2.0 875.9 3168.4 0.05% 9.64% 17.00% 16.95%
2 China 85177030 Parts Of Wireless TelephoneHandsets (Excl. Antenna)
0.0 272.5 1030.7 0.00% 3.00% 5.53% 5.53%
3 Vietnam 85258013 Other Television Cameras, NotFor Special Purposes
0.0 64.7 750.0 0.00% 0.71% 4.02% 4.02%
4 Taiwan 85423100 Processors And Controllers 6.1 120.3 674.6 0.15% 1.32% 3.62% 3.47%5 Japan 84571010 Vertical Machining Centres 50.3 247.4 618.4 1.23% 2.72% 3.32% 2.09%
6 Australia 26011120 Non-Agglomerated Iron Ores &Concentrates
344.6 488.0 511.7 8.42% 5.37% 2.75% -5.68%
7Korea,South
85258013 Other Television Cameras, NotFor Special Purposes
0.0 309.9 437.7 0.00% 3.41% 2.35% 2.35%
8Korea,South
85423200 Memories 0.0 216.1 420.8 0.00% 2.38% 2.26% 2.26%
9 China 85423200 Memories 0.0 26.9 354.8 0.00% 0.30% 1.90% 1.90%10 Taiwan 85423200 Memories 0.0 189.1 316.0 0.00% 2.08% 1.70% 1.70%Source: GTA database.
Sharechangeduring
2010-2012
Import value (million USD)
Share in city's total importProduct descriptionHS codePartner

INDUSTRIAL AGGLOMERATION AND DISPERSION IN CHINA
25
References
Asian Development Bank(ADB). 2013. Beyond the Factory Asia: Fuelling growth in a changing world.
Mandaluyong City, Philippines: Asian Development Bank.
Bao, Chengchao, Zhao Chen, Jianfeng Wu. 2013. “Chinese manufacturing on the move: Factor supply or market
access,” China Economic Review, Vol.26: 170-181.
Cai, Fang. 2010. “Demographic transition, Demographic dividend, and Lewis turning point in China.” China
Economic Journal, 3(2): 107–119.
Cai, Fang, Dewen Wang, and Yue Qu. 2009. “Flying Geese within Borders: How China Sustains Its Labor-intensive
Industries?” Economic Research Journal, 9 : 4-14(in Chinese).
Chan, Kam Wing, Vernon Henderson, and Kai Yuen Tsui. 2008. “Spatial Dimensions of Chinese Economic
Development.” In China’s Great Economic Transformation, ed. Brandt, Loren, and Thomas Rawski. New York:
Cambridge University Press.
Cohen, Jeffrey, and Catherine Paul. 2009. “Agglomeration, Productivity, and Regional Growth: Production Theory
Approaches.” In Handbook of Regional Growth and Development Theories, eds. Roberta Capello and Peter
Nijkamp. Edward Elgar.
Collier, Paul. 2007. The Bottom Billion: Why the Poorest Countries Are Failing and What Can Be Done About It.
New York: Oxford University Press.
Fujita, Masahisa, Paul Krugman, and Anthony Venables. 1999. The spatial economy: cities, regions and international
trade. Cambridge: MIT Press.
Fujita, Masahisa, and Takatoshi Tabuchi. 1997. “Regional Growth in postwar Japan.” Regional Science and Urban
Economics, 27: 643–670.
Gao, Ting. 2004. “Regional industrial growth: evidence from Chinese industries.” Regional Science and Urban
[1] [2] [3] [4] [5] [6] [7] [8] [9]
2004-2010 2004-2007 2007-2010 2004-2010 2004-2007 2007-2010 2004-2010 2004-2007 2007-2010
-0.0056 0.0219 -0.0226 0.012 -0.0353 0.0287 -0.026 -0.0343 -0.019[0.0138] [0.0198] [0.0196] [0.0192] [0.0284] [0.0263] [0.0181] [0.0264] [0.0255]
0.0093 0.0038 0.0128 -0.0197 -0.0005 -0.0306 0.0006 0.0043 0.0008[0.0051]* [0.0069] [0.0074]* [0.0086]** [0.0118] [0.0125]** [0.0096] [0.0144] [0.0128]
0.0105 0.0074 0.0151 0.0186 0.0121 0.025 0.012 0.0142 0.0088[0.0033]*** [0.0046] [0.0047]*** [0.0054]*** [0.0080] [0.0071]*** [0.0060]** [0.0087] [0.0083]
-0.0079 0.0032 -0.0187 -0.0252 -0.014 -0.0428 -0.0193 -0.0074 -0.0327[0.0053] [0.0074] [0.0075]** [0.0084]*** [0.0118] [0.0115]*** [0.0076]** [0.0109] [0.0106]***
-0.0368 0.0184 -0.0994 -0.166 0.1469 -0.22 0.1629 0.0826 0.1008[0.0412] [0.0834] [0.0943] [0.0785]** [0.1207] [0.1551] [0.0693]** [0.1345] [0.1108]
-0.0347 -0.0453 -0.027 -0.056 -0.0413 -0.0564 -0.0346 -0.0249 -0.0436[0.0064]*** [0.0089]*** [0.0091]*** [0.0093]*** [0.0145]*** [0.0118]*** [0.0093]*** [0.0140]* [0.0125]***
0.0436 0.01 0.0684 0.0574 0.0688 0.0628 0.0309 0.0105 0.0415[0.0125]*** [0.0171] [0.0185]*** [0.0175]*** [0.0247]*** [0.0259]** [0.0156]** [0.0221] [0.0227]*
Year Dummy Yes Yes Yes Yes Yes Yes Yes Yes YesProvince Dummy Yes Yes Yes Yes Yes Yes Yes Yes Yes
-0.0697 0.0738 -0.1033 -0.309 0.5178 -0.1534 0.3854 0.2462 0.3017[0.1155] [0.1494] [0.1617] [0.2138] [0.3314] [0.2229] [0.1619]** [0.3143] [0.2465]
Adjusted R square 0.145 0.1622 0.1654 0.1869 0.1857 0.2496 0.1081 0.0771 0.1279Observations 1618 810 808 983 492 491 1606 797 809
ln(relative profitability)
Constant
Note: * indicates statistical significance at the 0.1 level, ** indicates statistical significance at the 0.05 level, *** indicates statistical significance at the 0.01level.
The Eastern Region The Central RegionThe Western and
Northeastern Region
ln(Relative wage)
ln(Relative KL ratio)
ln(Absolute local industry scale)
ln(Local industrial specialization)
ln(Local industrial diversity)
ln(Relative scale of establishments)

INDUSTRIAL AGGLOMERATION AND DISPERSION IN CHINA
26
Economics, 34: 101–124.
Gao, Yuning. 2012. China as the Workshop of the World: an Analysis at the National and Industrial Level of China in
the International Division of Labor, New York: Routledge.
Golley, Jane, and Xin Meng. 2011. “Has China run out of surplus labour?” China Economic Review, 22(4): 555–572.
Hanson, Gordon. 1998. “Regional Adjustment to Trade Liberalization.” Regional Science and Urban Economics, 28:
419–444.
Hanson, Gordon, and Raymond Robertson. 2010. “China and the Manufacturing Exports of Other Developing
Countries.” In China’s Growing Role in World Trade, eds. Robert Feenstra and Shangjin Wei. The University of
Chicago Press.
Institute of Industrial Economy of Chinese Academy of Social Sciences. 2011. China’s Industrial Development
Report 2011: The Transformation and Upgrade of Chinese Industry. Beijing: Economy and Management
Publishing House (in Chinese).
Institute of Industrial Economy of Chinese Academy of Social Sciences. 2012. China’s Industrial Development
Report 2012: The Transformation and Upgrade of Chinese Industry. Beijing: Economy and Management
Publishing House (in Chinese).
Kimura, Fukunari, and Ayako Obashi. 2011. “Production Networks in East Asia: What We Know So Far,” ADBI
Working Paper Series, No.320, Asian Development Bank Institute.
Lin, Justin Yifu. 2011. “From Flying Geese to Leading Dragons: New Opportunities and Strategies for Structural
Transformation in Developing Countries.” World Bank Policy Research Working Paper 5702.
Long, Cheryl, and Xiaobo Zhang. 2011. “Patterns of China’s industrialization: Concentration, specialization, and
clustering.” China Economic Review, 23(3): 593–612.
Mano, Yukichi, and Keijiro Otsuka. 2000. “Agglomeration Economies and Geographical Concentration of Industries:
A Case Study of Manufacturing Sectors in Postwar Japan.” Journal of the Japanese and International
Economies, 14(3): 189–203.
Milberg, William, and Deborah Winkler. 2010. “Trade, Crisis, and Recovery: Restructuring Global Value Chains.” In
Global Value Chains in a Postcrisis World: A Development Perspective, eds. Olivier Cattaneo, Gary Gereffi, and
Cornelia Staritz. The World Bank.
Ottaviano, Gianmarco, and Diego Puga. 1998. “Agglomeration in the Global Economy: A Survey of the ‘New
Economic Geography’.” The World Economy, Vol.21, Issue 6: 707-731.
Puga, Diego. 1999. “The Rise and Fall of Regional Inequalities.” European Economic Review, Vol.43, Issue 2:
303-334.
Puga, Diego, and Anthony Venables. 1996. “The Spread of Industry: Spatial Agglomeration in Economic
Development.” Journal of the Japanese and International Economies, 10(4): 440-464.
Ruan, Jianqing, and Xiaobo Zhang. 2010. “Do Geese Migrate Domestically? Evidence from the Chinese Textile and
Apparel Industry.” Discussion Paper 01040, IFPRI, Washington, D.C.
Wood, Adrian, and Jörg Mayer. 2011. “Has China De-Industrialised Other Developing Countries?” Review of World

INDUSTRIAL AGGLOMERATION AND DISPERSION IN CHINA
27
Economics, 147(2): 325–50.
Xinhua News Agency. 2004. “Call China Workshop Instead of World Factory,” April 26, 2004
(www1.china.org.cn/english/features93993.htm).
Zhang, Gongwei, and Qi Liang. 2010. “The Study of Industrial Transfer and the Special Allocative Effect of
Resources.” Review of Industrial Economics: 1-21 (in Chinese).
Zhang, Kevin Honglin ed. 2006. China as the World Factory, New York: Routledge.