Embed Size (px)
Citation preview
Indoor Air Background Concentration Trends
AEHS West Coast ConferenceSan Diego, California
March 23, 2016
PRESENTED BY:Robert Ettinger
Geosyntec Consultants, Inc.
Vapor Intrusion Investigation Trends
• Recent regulatory guidance is leading toward more frequent indoor air sampling
• Impact of background sources on sample results is recognized, but representativeness of literature values has been questioned
• Forensic methods to assess background are available, but understanding “typical” values can help in risk based decision making and risk communication.
2
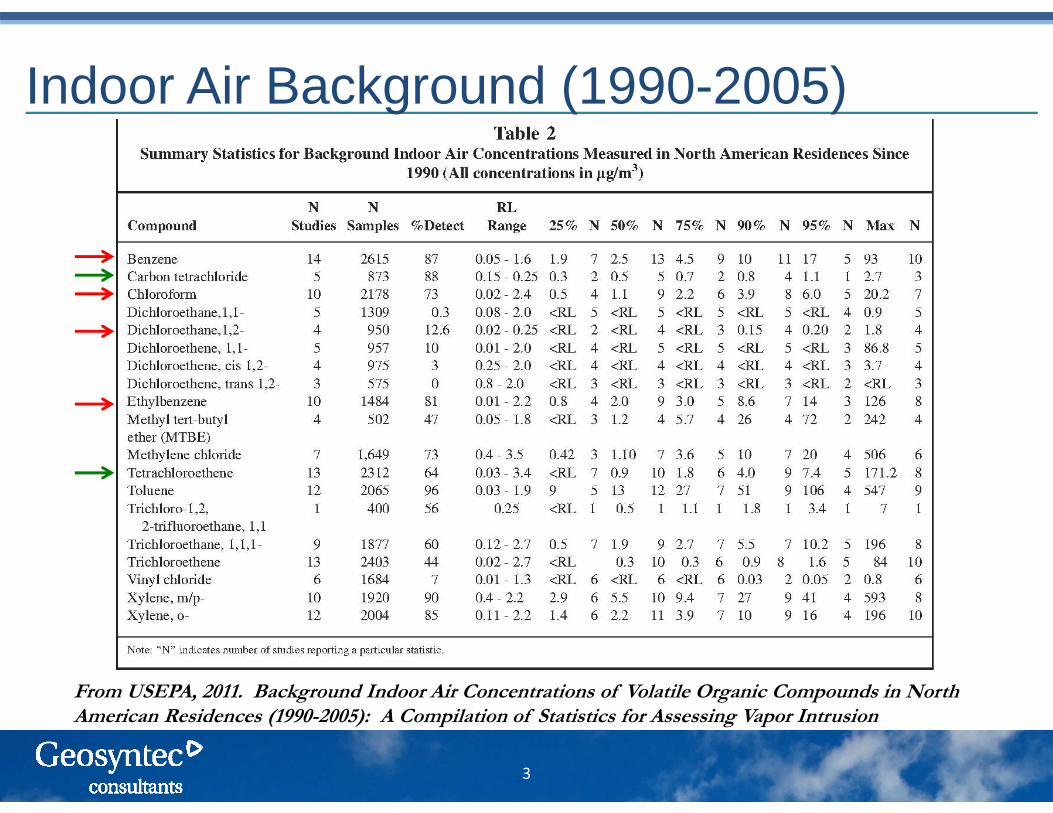
Indoor Air Background (1990-2005)
3
From USEPA, 2011. Background Indoor Air Concentrations of Volatile Organic Compounds in North American Residences (1990-2005): A Compilation of Statistics for Assessing Vapor Intrusion
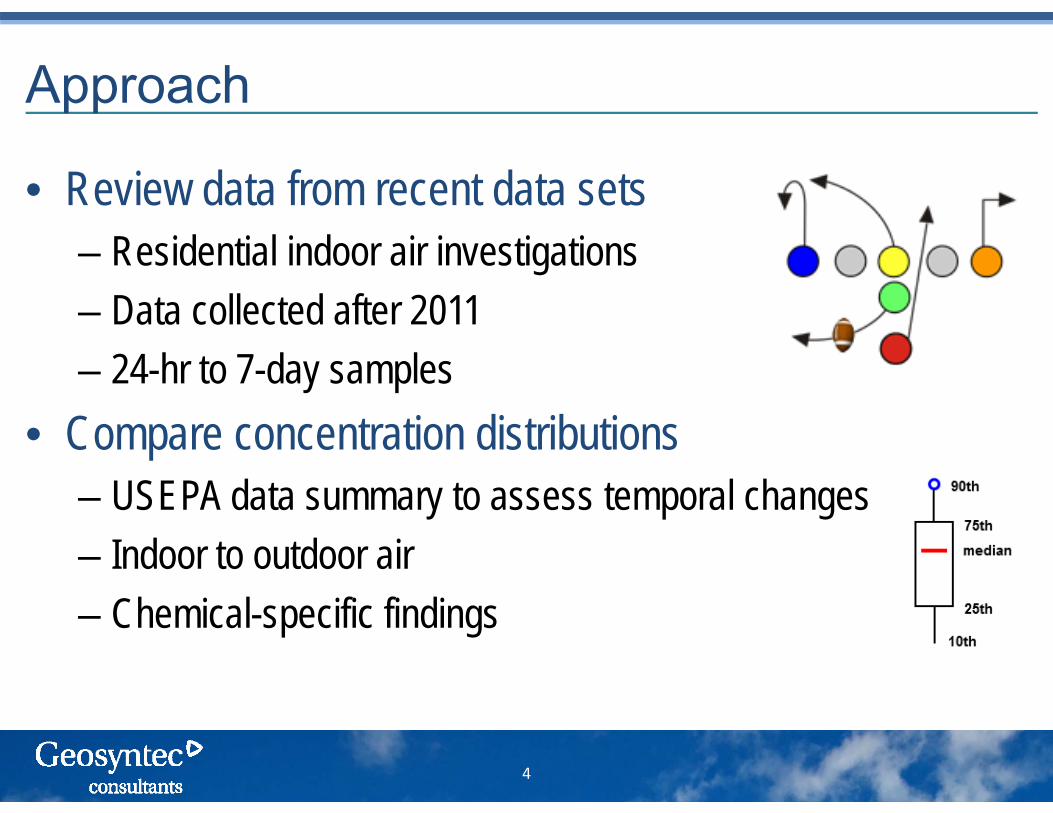
Approach
• Review data from recent data sets– Residential indoor air investigations– Data collected after 2011– 24-hr to 7-day samples
• Compare concentration distributions– USEPA data summary to assess temporal changes– Indoor to outdoor air– Chemical-specific findings
4

Recent Background Data Sets
5
SoCalSample Period: 2015# IA Samples: 209#OA Samples: 52
No. RockiesSample Period: 2012# IA Samples: 50#OA Samples: 0
So. RockiesSample Period: 2011‐2015# IA Samples: 510#OA Samples: 16
Southeast BSample Period: 2014‐2015# IA Samples: 110#OA Samples: 110
Southeast ASample Period: 2014‐2015# IA Samples: 150#OA Samples: 150
Petroleum Hydrocarbons
• Benzene• Naphthalene• Toluene• Ethylbenzene• Xylenes• Trimethylbenzenes
6
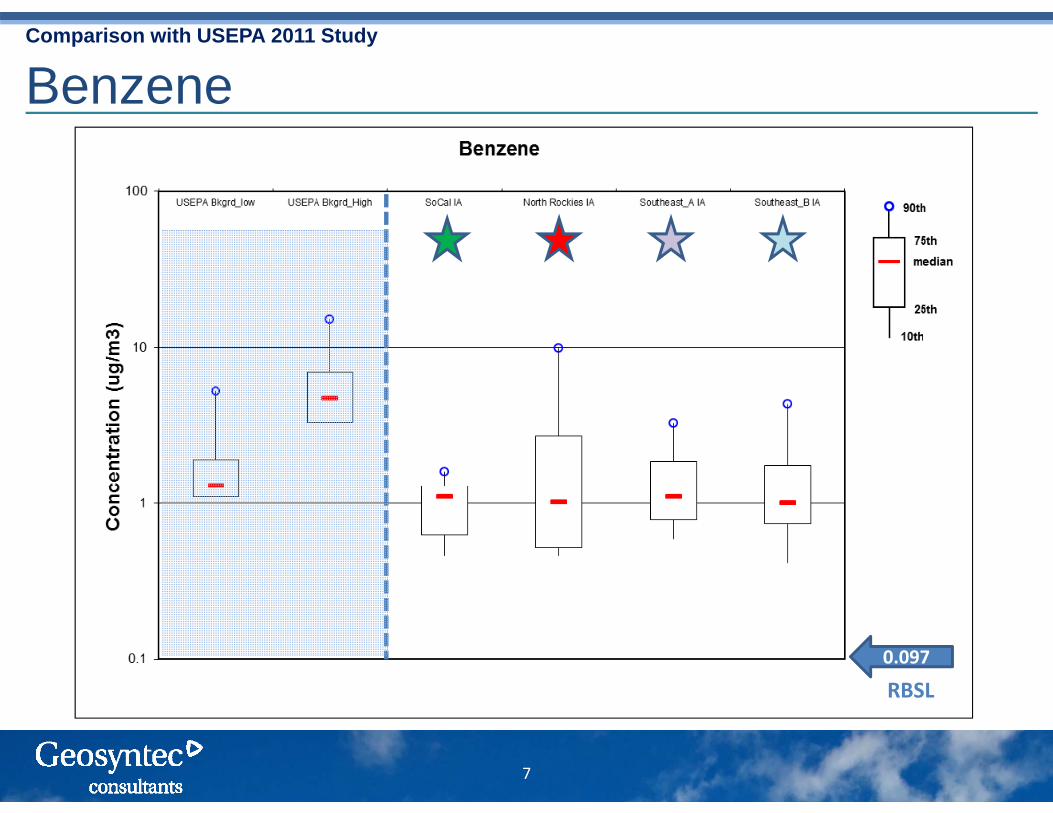
Benzene
7
Comparison with USEPA 2011 Study
0.097
RBSL

Naphthalene
8
Comparison with USEPA 2011 Study
0.083
RBSL
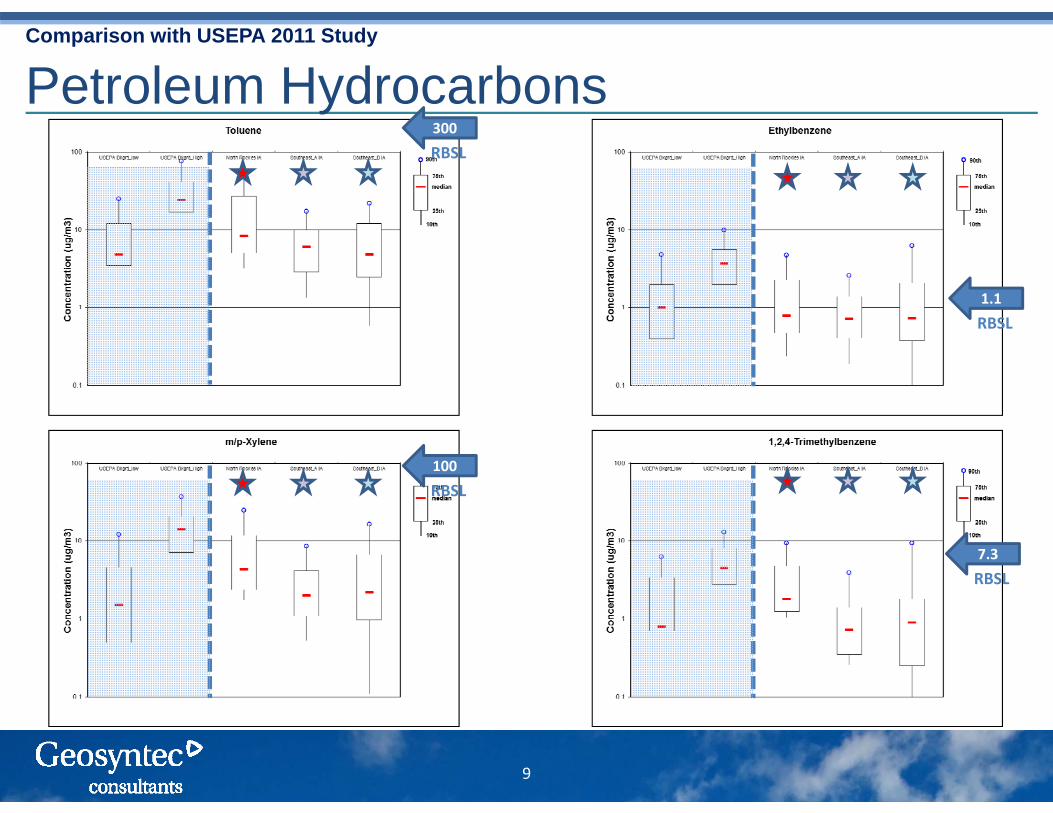
Petroleum Hydrocarbons
9
Comparison with USEPA 2011 Study
1.1RBSL
100RBSL
300RBSL
7.3RBSL

Chlorinated VOCs
• Trichloroethene• Tetrachloroethene• 1,2-Dichloroethane• Carbon tetrachloride• Chloroform• 1,4-Dichlorobenzene
10
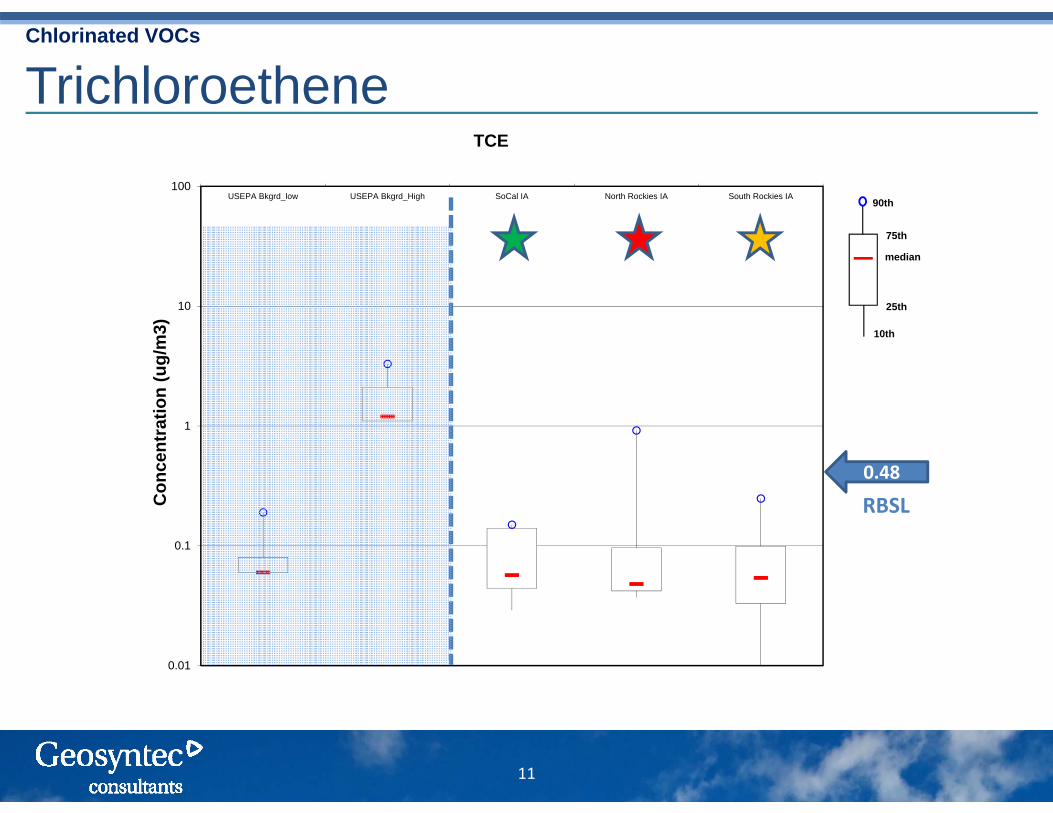
Trichloroethene
11
Chlorinated VOCs
0.01
0.1
1
10
100USEPA Bkgrd_low USEPA Bkgrd_High SoCal IA North Rockies IA South Rockies IA
Con
cent
ratio
n (u
g/m
3)TCE
90th
75th
25th
median
10th
0.48
RBSL

Tetrachloroethene
12
Chlorinated VOCs
0.01
0.1
1
10
100USEPA Bkgrd_low USEPA Bkgrd_High SoCal IA North Rockies IA South Rockies IA Southeast_A IA Southeast_B IA
Con
cent
ratio
n (u
g/m
3)
PCE
90th
75th
25th
median
10th
0.48
RBSL
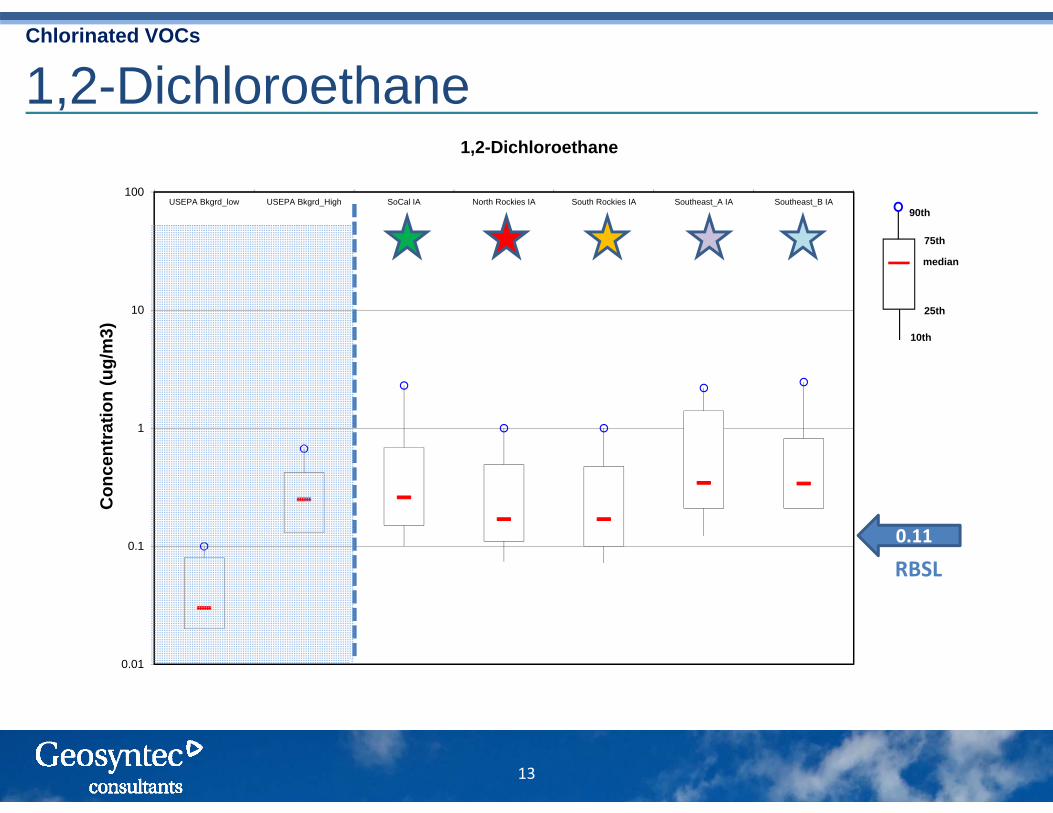
1,2-Dichloroethane
13
Chlorinated VOCs
0.01
0.1
1
10
100USEPA Bkgrd_low USEPA Bkgrd_High SoCal IA North Rockies IA South Rockies IA Southeast_A IA Southeast_B IA
Con
cent
ratio
n (u
g/m
3)
1,2-Dichloroethane
90th
75th
25th
median
10th
0.11
RBSL
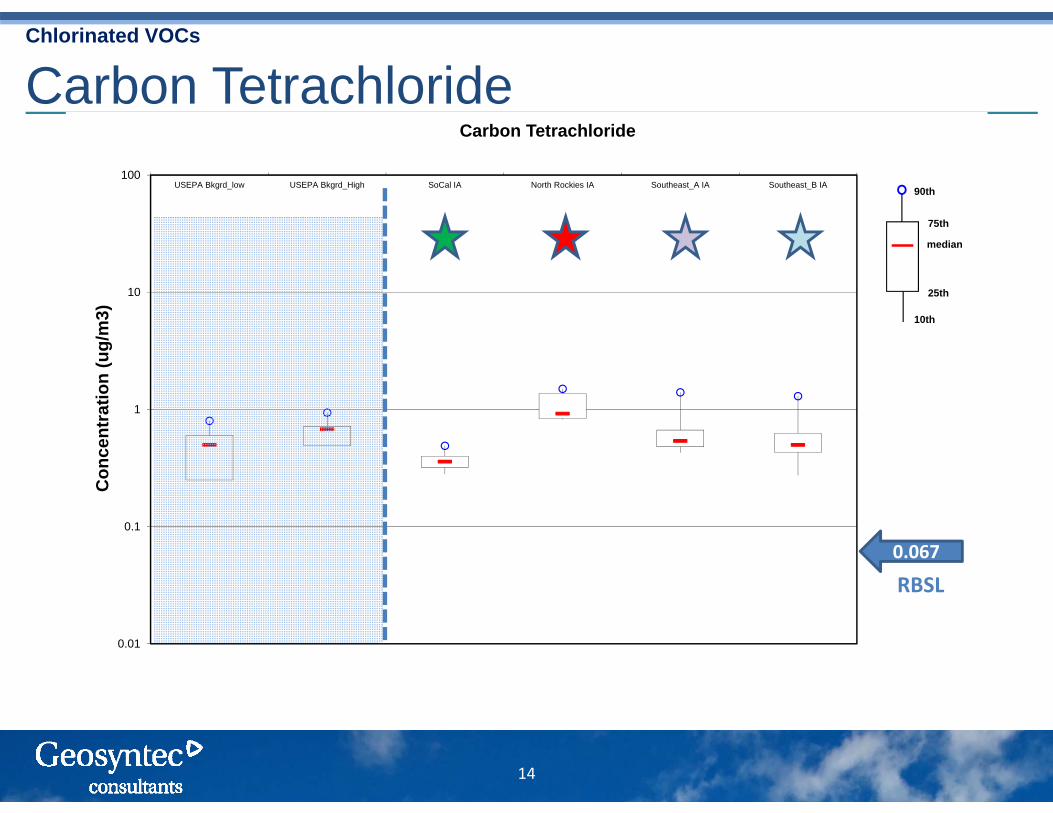
Carbon Tetrachloride
14
Chlorinated VOCs
0.01
0.1
1
10
100USEPA Bkgrd_low USEPA Bkgrd_High SoCal IA North Rockies IA Southeast_A IA Southeast_B IA
Con
cent
ratio
n (u
g/m
3)Carbon Tetrachloride
90th
75th
25th
median
10th
0.067
RBSL
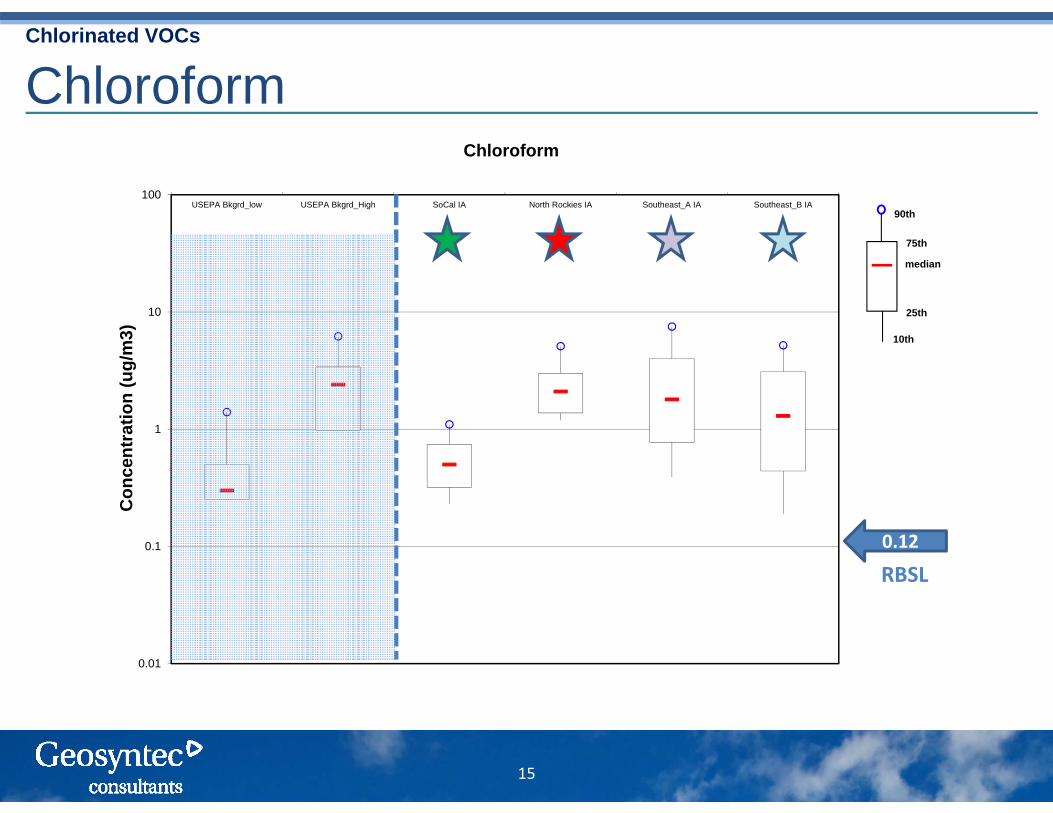
Chloroform
15
Chlorinated VOCs
0.01
0.1
1
10
100USEPA Bkgrd_low USEPA Bkgrd_High SoCal IA North Rockies IA Southeast_A IA Southeast_B IA
Con
cent
ratio
n (u
g/m
3)Chloroform
90th
75th
25th
median
10th
0.12
RBSL
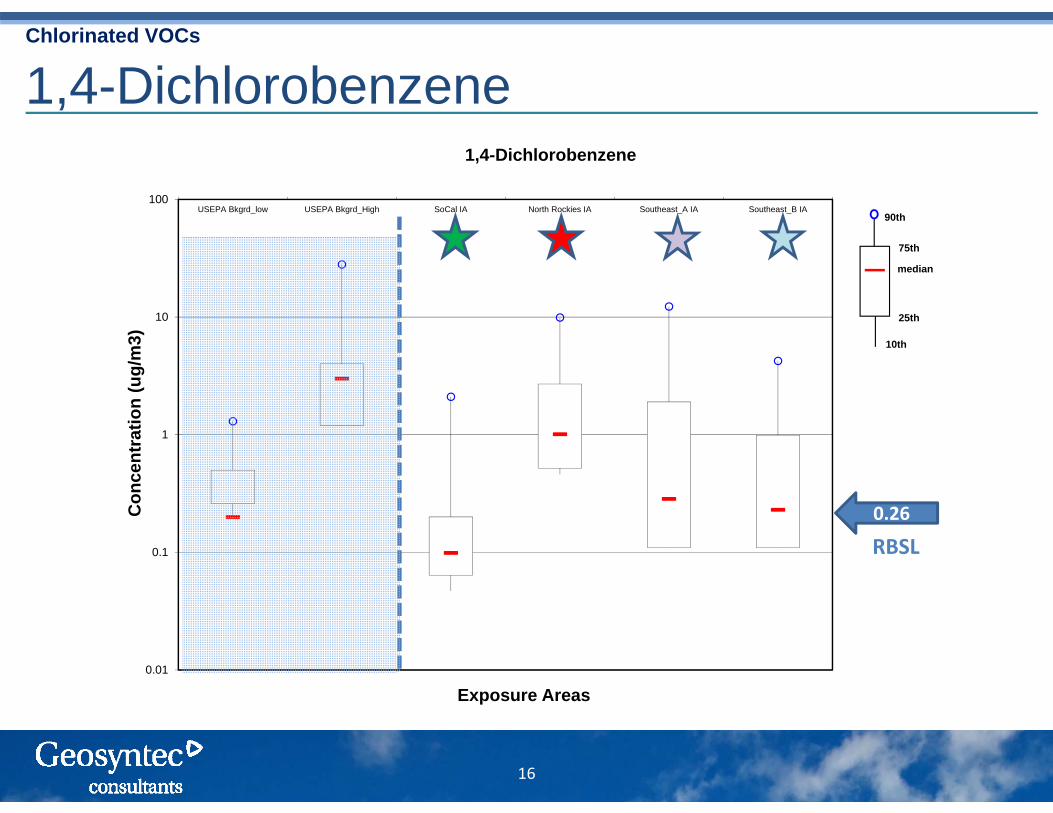
1,4-Dichlorobenzene
16
Chlorinated VOCs
0.01
0.1
1
10
100USEPA Bkgrd_low USEPA Bkgrd_High SoCal IA North Rockies IA Southeast_A IA Southeast_B IA
Con
cent
ratio
n (u
g/m
3)
Exposure Areas
1,4-Dichlorobenzene
90th
75th
25th
median
10th
0.26
RBSL

Outdoor Air Contribution to Background
• Compare distribution of VOCs in indoor and outdoor air to assess the effect of outdoor air on indoor air quality
17
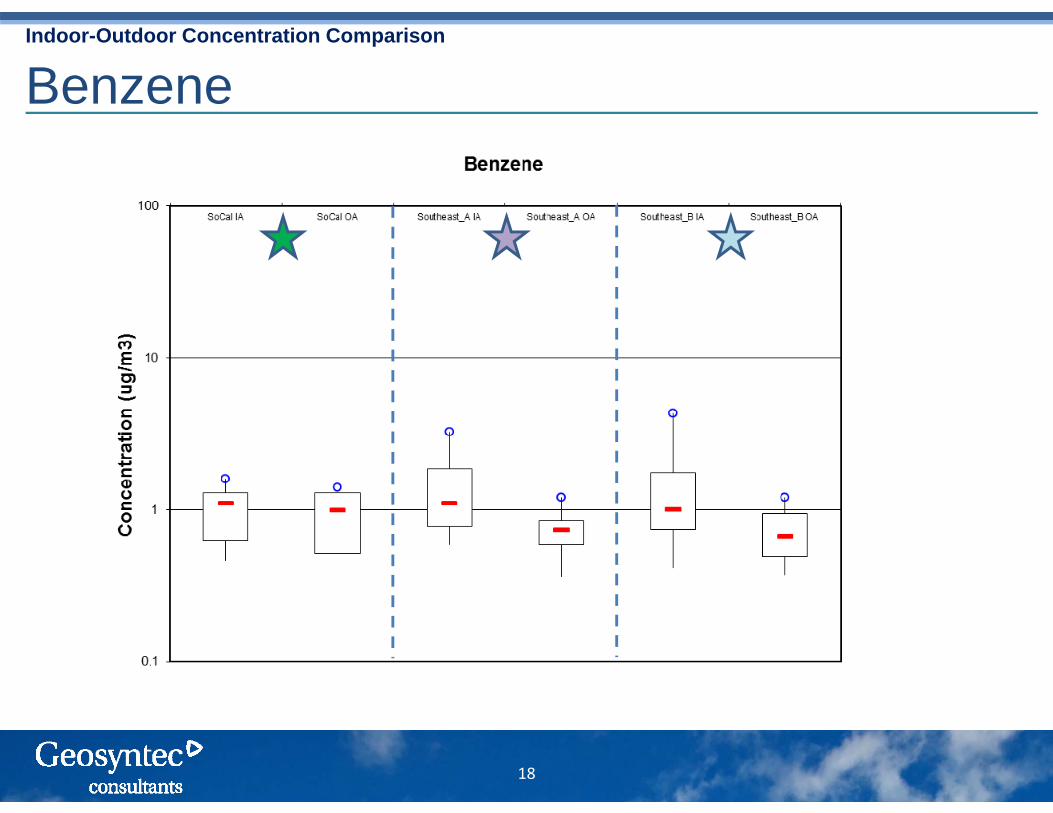
Benzene
18
Indoor-Outdoor Concentration Comparison
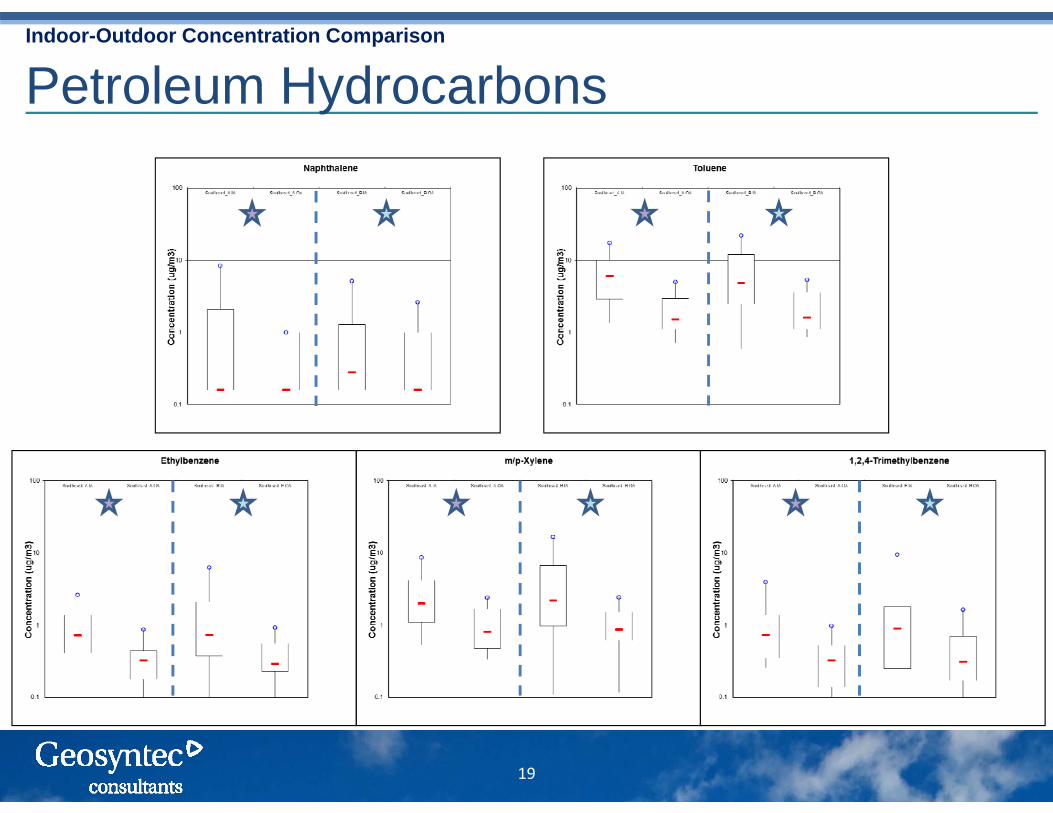
Petroleum Hydrocarbons
19
Indoor-Outdoor Concentration Comparison

Trichloroethene
20
Indoor-Outdoor Concentration Comparison

Carbon Tetrachloride
21
Indoor-Outdoor Concentration Comparison

Chloroform
22
Indoor-Outdoor Concentration Comparison
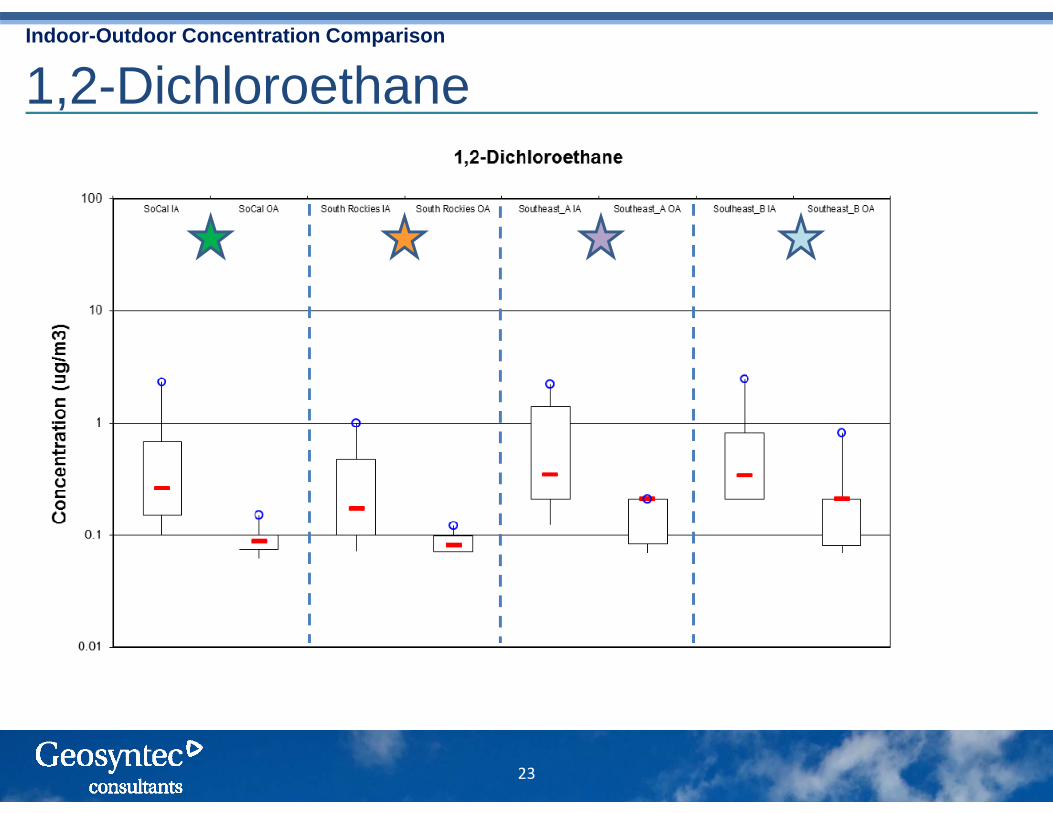
1,2-Dichloroethane
23
Indoor-Outdoor Concentration Comparison

1,4-Dichlorobenzene
24
Indoor-Outdoor Concentration Comparison
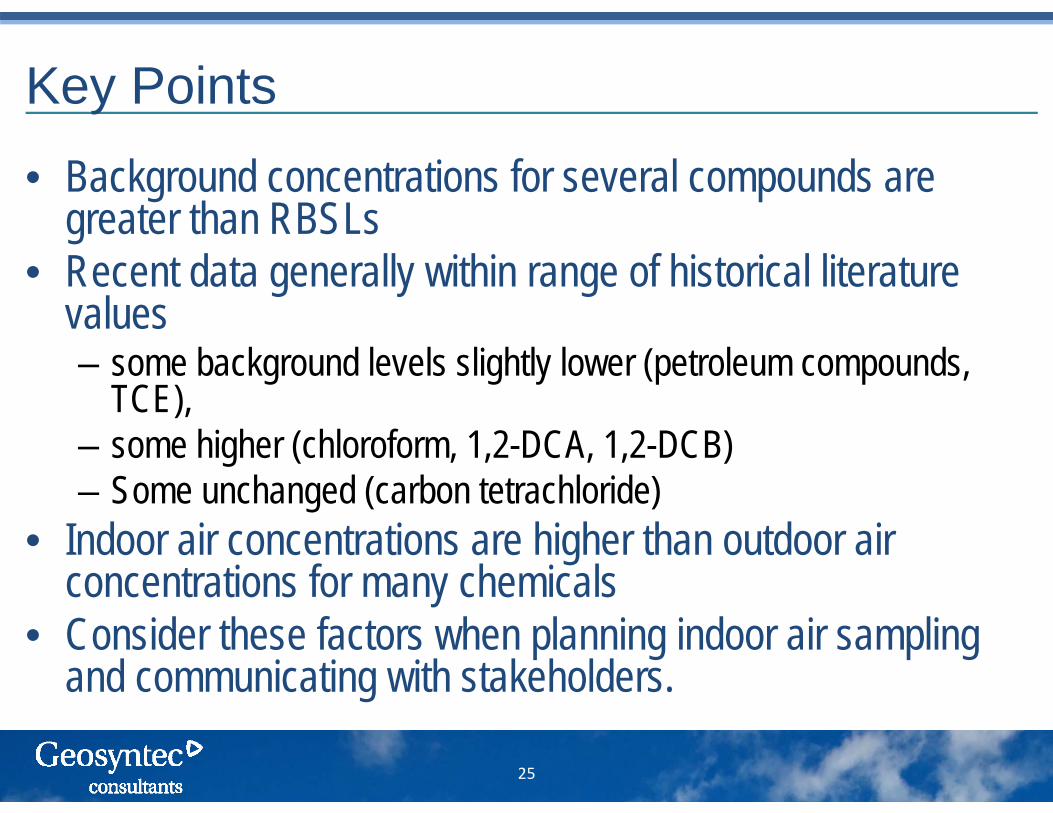
Key Points
• Background concentrations for several compounds are greater than RBSLs
• Recent data generally within range of historical literature values– some background levels slightly lower (petroleum compounds,
TCE), – some higher (chloroform, 1,2-DCA, 1,2-DCB)– Some unchanged (carbon tetrachloride)
• Indoor air concentrations are higher than outdoor air concentrations for many chemicals
• Consider these factors when planning indoor air sampling and communicating with stakeholders.
25


![Indoor Pollution in Work Office: VOCs, Formaldehyde and ... · E. Barrese et al. 50 1. Introduction The indoor air quality (IAQ) [1] [2] depends on the concentration of pollutants](https://img.pdfslide.us/doc/110x75/5b511f5c7f8b9adf538ba422/indoor-pollution-in-work-office-vocs-formaldehyde-and-e-barrese-et-al.jpg)