Embed Size (px)
Citation preview

INDONESIA’s UPPDATE POLICY AND HRDPREPARATION for NPP
Prepared byThe National Team of HRD for NPP
INDONESIABromo

Indonesian Map

3
Indonesia’s Current Energy Condition
Indonesia’s energy consumption increases at an averageof 7% annually in the last ten years;
Oil and gas still play an important role in the nationaleconomy development both as the state’s main source ofrevenue and domestic energy supply;
Oil still dominates the national energy mix
Oil reserves are depleting, although gas and coal reservesare increasing;
Part of energy prices are still subsidized which burdensthe state budget and interferes the development ofalternative energy;
Electrification ratio is currently about 72% (2012);
Energy utilization is still inefficient, or used for non‐productive use with the energy elasticity still > 1 (around1.63 in 2008);
The government is committed to reduce GHG emissionsup to 26% in 2020 with national efforts and 41% withinternational assistance. Renewable energy and energyefficiency programs are currently being prioritized toachieve the emission reduction targets
Primary Energy Mix 2008(1014 Million BOE)
Energy Elasticity = 1.63
Non Fossil Energy (NRE) < 5%
Gas 19.06%
Coal31.84%
Oil49.92%
Geothermal 1.32%
Hydro Power 2.86%

NO RENEWABLE ENERGY RESOURCES (SD) INSTALLED CAPACITY (KT)
RATIO KT/SD(%)
1 2 3 4 5 = 4/3
1 Hydro 75,670 MW 5,705.29 MW 7.54
2 Geothermal 29,038 MW 1,189 MW 4.10
3 Mini/Micro Hydro 1013.5 MW 462.0 MW 46.0
4 Biomass 49,810 MW 1,618.40 MW 3.25
5 Solar 4.80 kWh/m2/day 13.5 MW -
6 Wind 3 – 6 m/s 1.87 MW -
7 Uranium24,112 ton (Uranium)1,500 ton (Thorium)
30 MW 1.00
*) Only in Kalan – West Kalimantan
NATIONAL ENERGY RESOURCES (2010)
No FOSSIL ENERGY RESOURCES(SD)
RESERVES(CAD)
RATIO SD/CAD
(%)PRODUCTION
(PROD)RATIO
CAD/PROD(YEAR*)
1 2 3 4 5 = 4/3 6 7 = 4/6
1 Oil (bill barrel) 56.6 7.99 **) 14 0.346 23
2 Gas (TSCF) 334.5 159.64 51 2.9 55
3 Coal(bill ton) 104.8 20.98 18 0.254 83
4 Coal Bed Methane/CBM(TSCF) 453 - - - -
*) With assume that no new additional reserve**) Including Blok Cepu
ELECTRIFICATION RATIO BY PROVINCE (2011)
2006 2007 2008 2009 2010 2011 2012 2013 2014Rasio Elektrif ikasi
63% 64,3% 65,1% 65,8% 67,2% 72,95% 75,3% 77,65% 80,0%
TARGET (Years)REALIZATION (Years)
NAD87,72%
Sumut83,98%
Sumbar77,72%
Riau 78,17%
Sumsel72,71%
Bengkulu71,15%
Babel82,26%
Lampung70,40%
Jakarta99,99%
Banten68,18%
Jabar70,72%
Jateng77,31%
Jambi76,54%
DIY75,19%
Jatim72,05%
Bali69,77%
NTB52,88%
NTT39,92%
Kalbar65,37%
Kalteng67,28%
Kalsel75,65%
Kaltim63,44%
Sulut73,21%Gorontalo
54,69%
Sulteng64,84%
Sultra56,46%
Sulsel74,19%
Malut70,34%
Maluku70,80%
Papua29,25%
Category :
> 60 %
41 ‐ 60 %
20 ‐ 40 %
Sulbar64,12%
Kepri91,52%
Papua Barat58,24%

1990 1991 1992 1993 1994 1995 1996 1997 1998 1999 2000 2001 2002 2003 2004 2005 2006 2007 2008 2009 2010
Household11,4 %Commercial3,7%
Transportation40,6%
Industry44,2%
NRE4,8 %
Coal26,4%
GROWTH OF ENERGY DEMAND AND SUPPLY1990 ‐ 2010
Gas21,9 %
Oil46,93%`
DEMAND(Million BOE)
SUPPLY(Million BOE)
248,0
350,9
508,9
594,6
739,5
525,4
700,4 726,7
896,4
1066,0
18,5%
30,7%
48,2%
2,5%
4,5 %34,2 %
4,6%
56,6 %

GROWTH OF FOSSIL ENERGY SHARE AND SUBSIDY 2000 – 2009
2000 2001 2002 2003 2004 2005 2006 2007 2008 2009
1. Electricity Subsidy 3,93 4,30 4,10 3,36 3,31 10,65 33,90 37,48 78,58 53,72
2. Electricity Subsidy from fossil energy*) 3.30 3.55 3.49 2.92 2.86 9.20 29.75 32.63 68.16 46.14
3. Fuel Subsidy 55.64 63.26 31.75 30.04 59.18 103.35 64.21 83.79 139.03 45.04
Total Subsidy for Fossil Energy 58.94 66.81 35.24 32.96 62.04 112.55 93.96 116.42 207.19 91.18
43 %
34 %
19 %
4 %
*) Proportional with share of fossil energy in primary energy mix for electricity generation
Average Growth in last 10 years:
1.Oil : 0,52 %/year2.Coal : 13,70 %/year3.Gas : 1,81 %/year
A. Total Growth of Share (in million BOE)
B. Growth of Fossil Energy Subsidy (in billion Rupiah)2000 2001 2002 2003 2004 2005 2006 2007 2008 2009
727772 800
859 873 896 897956
10141065 NRE
Coal
Gas
Oil

Batubara, 33%
Gas; 30%
Oil; 20%
NRE; 17%Coal;
34,6%
Gas; 20,6%
Oil; 41,7%
NRE; 3,1%
Coal; 32%
Gas; 23%
Oil; 20%
NRE; 25%
Coal; 30,7%
Gas; 21,0%
Oil; 43,9%
NRE; 4,4%
POLICY DIRECTION
NRE
Gas
Coal
Oil
21 %30,7 %
43,9%
4,4 %
NRE
Gas
Coal
Oil
2010* 2015 20202025
ENERGY CONSERVATION(37,25%)
ENERGY DIVERSIFICATION
BAU**
Source: *DEN, **Blueprint PEN 2006-2025
PERPRES 5/2006 VISION 25/25
25 %
32 %1131,3 MBOE
20 %
23 %
41.7%
20,6%
34.6%
3,1%
5100 MBOE
3200 MBOE
3200MBOE
Update 4-10-2010

Supplied by Fossil Energy, at any cost
(Subsidize)
Supplied by Fossil Energy, at any cost
(Subsidize)
Renewable Energy as an alternative
Renewable Energy as an alternative
Inefficient Sectoral Energy Demand:‐Household‐ Transport‐ Industry
‐ Commercial
Inefficient Sectoral Energy Demand:‐Household‐ Transport‐ Industry
‐ Commercial Fossil Energy as balancing factor(Conservation)
Fossil Energy as balancing factor(Conservation)
EXISTINGENERGY SUPPLY SIDE MANAGEMENT
FUTUREENERGYDEMAND SIDE MANAGEMENT
TRANSFORMATION ON ENERGY PARADIGM(Green Energy Initiatives)
Efficient Sectoral Energy Demand:
‐Household‐ Transport‐ Industry
‐ Commercial
(Conservation)
Efficient Sectoral Energy Demand:
‐Household‐ Transport‐ Industry
‐ Commercial
(Conservation)
SUPPLY SUPPLYDEMAND DEMAND
“GAP”
Maximize the supply and utilization of New Renewable Energy, with Avoided Fossil
Energy Costs
Maximize the supply and utilization of New Renewable Energy, with Avoided Fossil
Energy Costs
(Diversification)

Unilateraland International Support
President Commitment G-20 Pittsburgh and COP15
To reduce te GHG Emission in 2020
26%
15%Unilateral
NATIONAL ACTION PLAN
26%41%
Scenario of 2020 GHG Emission Reduction

Master Plan of National Energy
Conservation
Master Plan of National Energy Diversification
Master Plan of Development and Utilization of New and Renewable
Energy
Master Plan of Non Renewable
Energy
SECTORAL ENERGY POLICY
Household
Commercial
Transportation Sector
Industrial Sector
CLUSTER POLICY*New Energy
Nuclear Energy Policy
Geothermal Policy
Renewable Energy
CBM Policy
Gasified Coal Policy
Liquified Coal Policy
Hydrogen Energy Policy
Hydro Power Policy
Bio-Energy Policy
Solar Energy Policy
Wind Power Policy
Ocean Energy Policy
Oil Policy
Gas Policy
Coal Policy
NREVision25/25
*Clustering in Accordance with Law No 30/2007
Dem
and Side
Supply S
ide
Non Renewable Energy

• Indonesia has been planning to introduce the operation of NPP inaccordance to support the national electricity production in theperiod of 2015 ~ 2019)(stated in the National Act No. 17 / 2007)
• HRD is an important component of nuclear infrastructure andneeds a long term commitment from the stakeholder.
• The National Team of HRD for NPP has been established (2008)consisting some members from various Intitutions : Ministry of Energy and Mineral Resources (MEMR) Ministry of Research and Technology National Nuclear Energy Agency (BATAN) National Nuclear Regulatory Body (BAPETEN) State Own Electricity Company (PLN)
HRD FOR NPP IN INDONESIA
BACKGROUND

• “Every personnel who works in nuclear research,development and application should be providedadequate education and training in a certain level ofcompetence”
• Indonesia has set the personnel competency standards
STRATEGY OF HRD FOR NPP IN INDONESIA

• Development of Academic Paper on “Preparation of HumanResource Development for NPP in Indonesia” :
Personnel requirements : quantitative and qualification(education, training and experience)
Existing infrastructure of HRD : education, training and licensingsystem
Action Plans• Development of “Blue Print on Human Resource Development for
NPP in Indonesia”(Policy and strategy of HRD)• Establishment of Nuclear Training Center” for NPP Organization aspect Training Program Facilities
HRD’s TEAM PROGRAMME
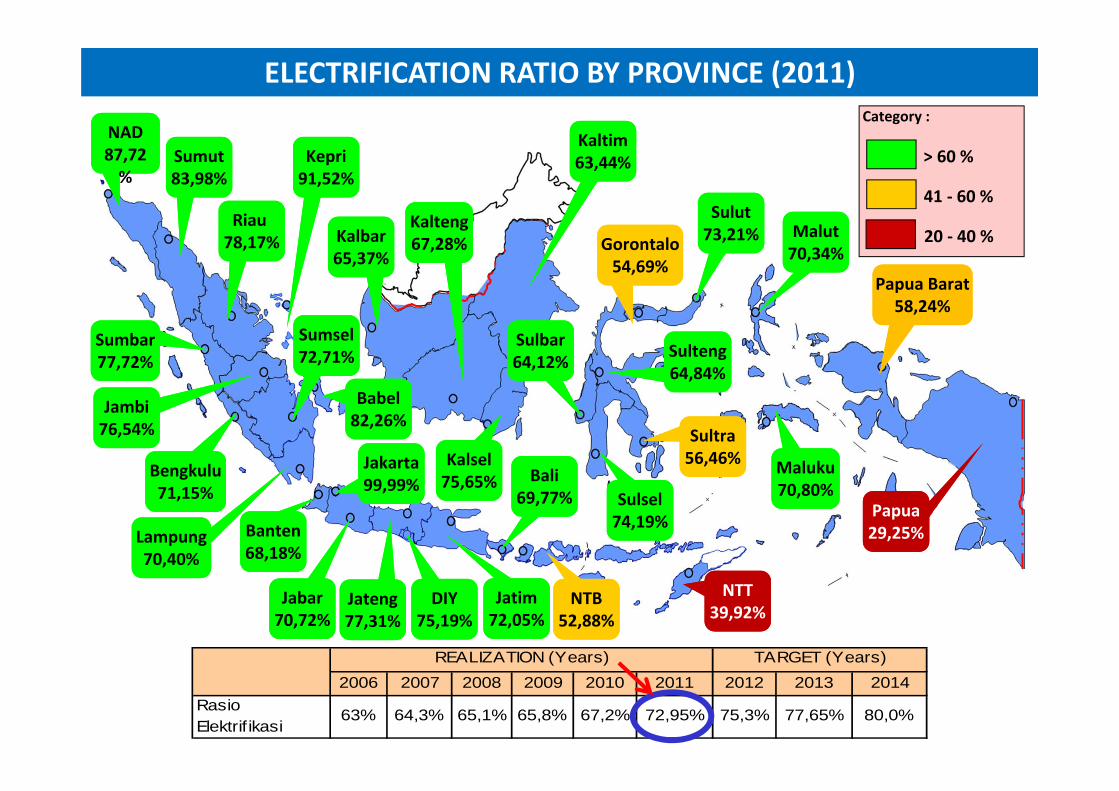
Working Area in NPP
Nuclear Island
Non Nuclear Island
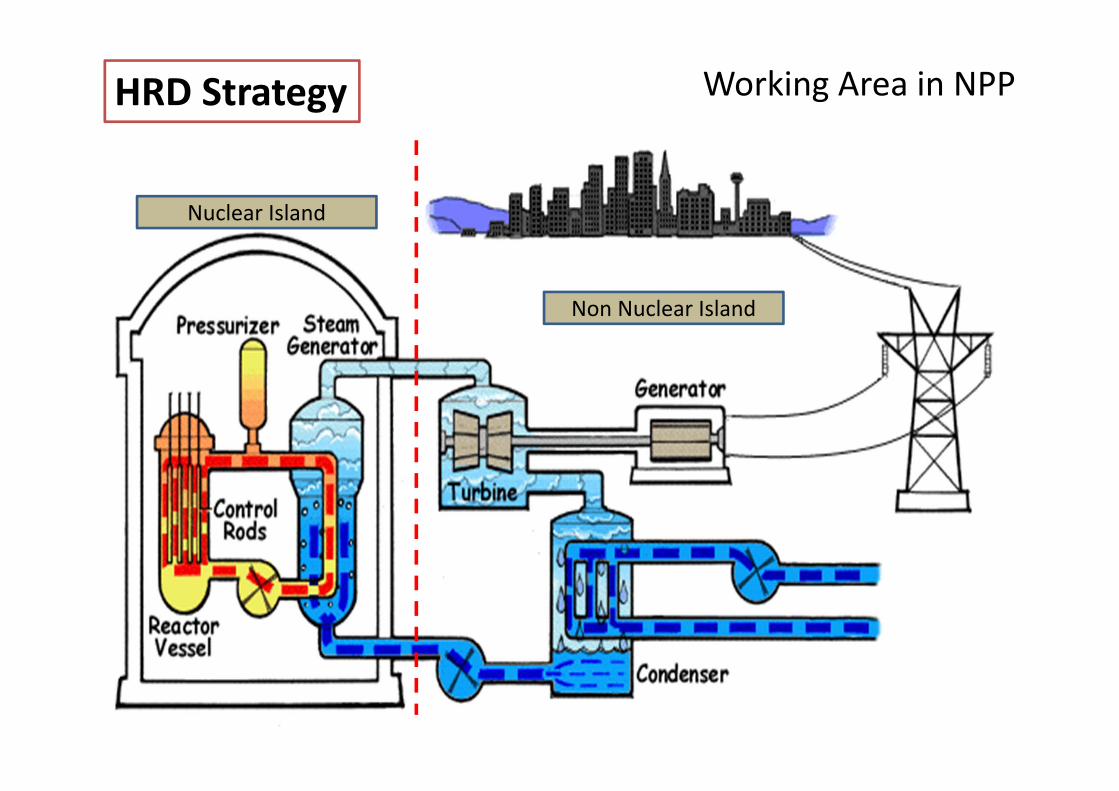
HRD Strategy

Personnel CompetencyDevelopment
HRD Strategy

Personnel Competency Standard
•Basic•Nuclear Island•Non Nuclear Island
Training Institutes Certification Bodies Universities
HRD Strategy
CompetentPersonnel
Personnel ertificationBody (BAPETEN)
Specialized Training on Nuclear Reactor
Basic Training onNuclear Power
TechnicalPersonnel
Specialized Training onElectricity Generation
Personnel CertificationBody (ESDM)
CompetentPersonnel
Nuclear Island non Nuclear Island
Overseas Domestic
HRD Strategy

Nuclear Training Center ( NTC )A specific training institute for implementation of the HRD programfor NPP personnel.
HRD Strategy
Head of NTC
QualityManagement Pool of Experts
AdministrativeSection
OperationalSection
Training FacilitySection
• Full‐time instructor• Part‐time / temporary
• Planning• Development• Implementation
• Development• Maintenance

HRD Strategy
TrainingImplementation
Personnel CompetenceStandard
StandardCurriculum
Training MaterialInstructor
Laboratory
Bali

ACADEMIC PAPER HRD NPP IN INDONESIA 2012 ‐ 2025
• NPP Development Phase– Pre‐project– Project Management– Project Engineering– Procurement– QA dan QC– Plant Construction– Regulation and Licensing– Commissioning– Operations and Maintenance

• Quantitative Human Resource Need– Professional– Technician– Craftsmen
• Personnel Qualification• NPP Organization
ACADEMIC PAPER HRD NPP IN INDONESIA 2012 ‐ 2025

The Basic Structure of Human Resource Development
• Education– University of Gajah Mada (UGM)– Institute Teknologi Bandung (ITB)– University of Indonesia (UI)– Sekolah Tinggi Teknologi Nuklir (STTN)
• Personnel Training and Certification– Subject acquirement in electricity– Subject acquirement in nuclear
• Career Path Guidance– Structural path – Non‐structural path

Action Plan of HR Preparedness
• National Participation on Human Resource Side
• Competency‐based Standard for Nuclear Power
• Personnel Recruitment

COMPETENCE STANDARDS
• SUB FIELD MAINTENANCE• SUB FIELD OPERATIONS

Conclusion
Indonesian Goverment yet has decision todevelop NPP but The National Team hasprepared of Blue Print on HRD for NPP inIndonesia and also develop of Academic Paper The National Team also has prepared PersonnelStandard Competency for NPP Base on Personnel Standard Competency will beformulated Competency’s base standard.

Conclusion
International cooperation with experiencecountry is very beneficial in order to develop andimplement Training Program Cooperation base onpersonnel competency’s standard.

Terimakasih
Borobudur