Embed Size (px)
Citation preview

INDONESIA’S TRADE POLICY
AN OVERVIEW
Iman Pambagyo
February 2016
Disclaimer: opinions presented are personal views & should not in any way
be construed as representing the views of the Government of Indonesia or
the Ministry of Trade of the Republic of Indonesia

• Economic potentials, lack of vision?
• The role of trade
• Challenges: AEC & Beyond
• The need for new direction
• Indonesia does go international
• Export to Africa: how significant?
2

I do esia i …
16th largest economy in the world
45 million members of the consuming class
53% of the population in cities producing 74% of GDP
55 million skilled workers in the Indonesian economy
$0.5 trillion market opportunity in consumer services,
agriculture & fisheries, resources, and education
3

a d I do esia i …
7th largest economy in the world
135 million members of the consuming class
71% of the population in cities producing 86% of GDP
113 million skilled workers in the Indonesian economy
$1.8 trillion market opportunity in consumer services,
agriculture & fisheries, resources, and education
4

Long overdue homework: infrastructure, energy, finance,
human resources, corruption, rules of law, regulatory coherence
etc leaving competitiveness consistently low compared to other
countries in region: Malaysia, Thailand even, to some extent,
Philippines & Viet Nam
Politics got into play: national sovereignty, self-reliance, self-
sufficiency, exports are good & imports are bad, then new
parliament, new cabinet, new ministers; dignity, different
data/statistics creating conflicts among different sectors
…fo usi g o prote ti g se tors rather tha a agi g do esti market & enhancing economic competitiveness; reacting to
sentiments, no clear vision 5
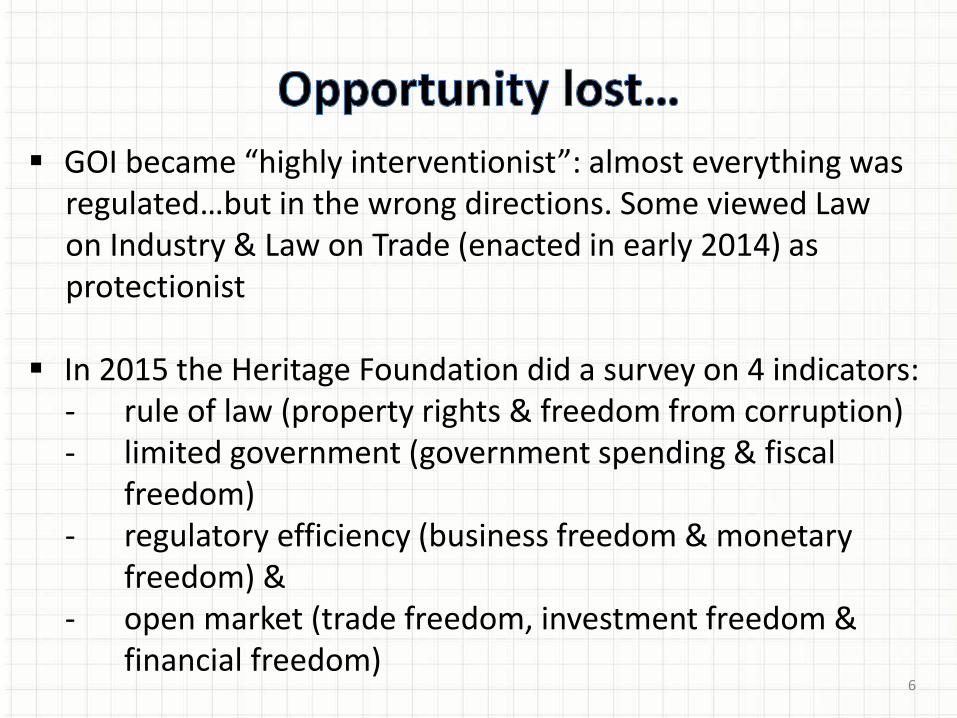
GOI e a e highl i ter e tio ist : al ost e er thi g as regulated… ut i the ro g dire tio s. “o e ie ed La on Industry & Law on Trade (enacted in early 2014) as
protectionist
In 2015 the Heritage Foundation did a survey on 4 indicators:
- rule of law (property rights & freedom from corruption)
- limited government (government spending & fiscal
freedom)
- regulatory efficiency (business freedom & monetary
freedom) &
- open market (trade freedom, investment freedom &
financial freedom) 6

7
The Heritage Foundation, 2015 survey on
178 economies:
I do esia’s e o o i freedo s ore is 58.1, making its economy the 105th freest in the
2015 index. Its score has deteriorated by 0.4
point since 2014, reflecting declines in
business freedom, the control of government
spending, and monetary freedom that
counterbalance improvements in freedom
fro orruptio a d la or freedo ….
Indonesia is ranked 22nd out of 41 countries in
the Asia-Pacific region, and its overall score is
belo the orld a d regio al a erages…
http://www.heritage.org/index/ranking

8
Growth is a resultant of combination of factors:
Investment
Government spending
Export
Consumption
Coordinating Board of Investment: despite sharp fall on commodity
prices, a falling stock market, higher domestic & international bond
yields & a depreciating exchange rate, the economy was able to grow
oderatel . This is due to relati el li ited i porta e of e ports …. & sustained robust domestic consumption.
Domestic consumption—in particular private consumption—
o tri utes arou d 55% to I do esia’s e o o i gro th

9
16.4
11
10.5 8.7
8.1
7.7
7.2
Major Invested Sectors, 2014 (%)
Mining Food
Storage & Communication Metallurgy, Machinery & Electrics
Chemical & Pharmacy Food Farming & Plantations
Transportation
10
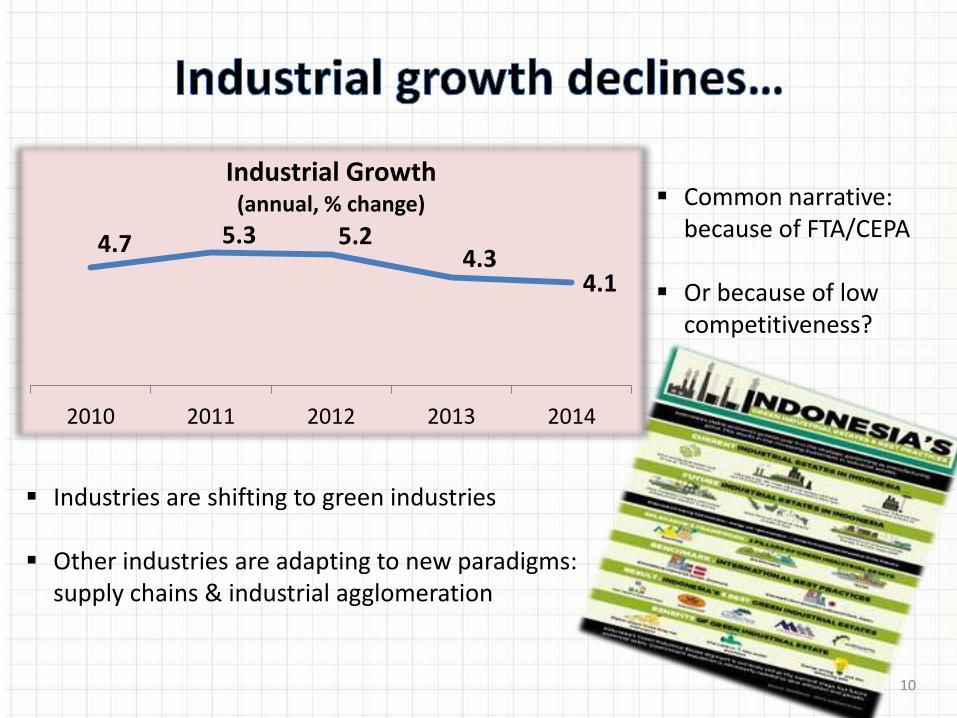
4.7 5.3 5.2 4.3
4.1
2010 2011 2012 2013 2014
Industrial Growth (annual, % change) Common narrative:
because of FTA/CEPA
Or because of low
competitiveness?
Industries are shifting to green industries
Other industries are adapting to new paradigms:
supply chains & industrial agglomeration

11 Institute for Development of Economics & Finance, 2014
Masalah suplai energi: 20 provinces
Masalah konektivitas domestik: 19 provinces

12
…so lo g as gro th of a ufa turi g se tors is lo , so e de li i g

13
219.62
23.59 23.72
50.64
79.65
29.12
187.64
75.05 86.4
31.83 40.07 27.44 30.74
Tanjung Priok
Singapore
Amsterdam

14

15
How about shale gas?
INA has great potential but
extractive operation is
expensive & need to buy the
technology
Energy includes oils, gas, coal, biofuel etc
Non-energy includes palm oil, rubber, thin, cocoa
beans, copper, coffee beans, iron ores etc
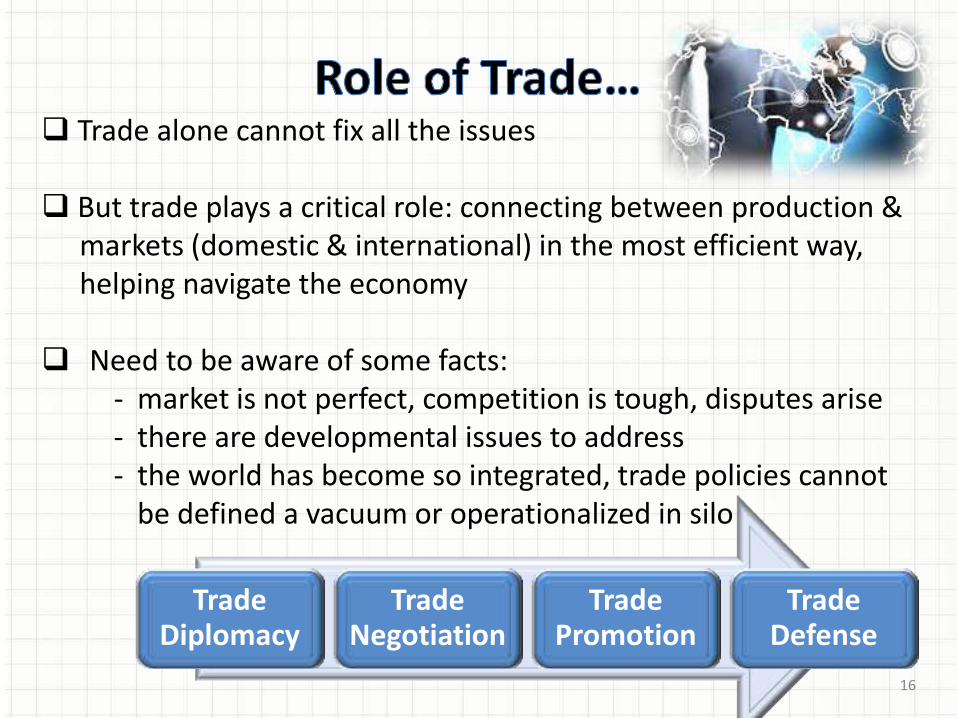
Trade Diplomacy
Trade Negotiation
Trade Promotion
Trade Defense
Trade alone cannot fix all the issues
But trade plays a critical role: connecting between production &
markets (domestic & international) in the most efficient way,
helping navigate the economy
Need to be aware of some facts:
- market is not perfect, competition is tough, disputes arise
- there are developmental issues to address
- the world has become so integrated, trade policies cannot
be defined a vacuum or operationalized in silo
16

17
157.7
203.5 190 182.5
176.3 150.2
135.6
177.4 191.7
186.6 178.2
142.7
22.1 26 -1.7 -4 -1.8
7.5
2010 2011 2012 2013 2014 2015
Export Import Balance
10 main non-oil export markets: China, US, Japan, India, Singapore, Malaysia,
Korea, Thailand, Netherlands, Philippines
10 main sources of non-oil import: China, Japan, Singapore, Thailand, US,
Korea, Malaysia, Australia, Germany, Taiwan

18
7.3% 7.5% 6.9% 7% 7.1% 7.5%
72.8% 73.7% 73% 76% 76.4% 75.3%
19.8% 18.6% 19.9% 16.8% 16.4% 17.2%
2010 2011 2012 2013 2014 2015
Consumption Raw/Intermediate Capital
Total import (Billion)
$135.7 $177.4 $191.7 $186.6 $178.2 $142.7

2013: First Round of RCEP Negotiations
19
E N L A R G E M E N T
D E
E P
E N
I N
G
1967: INA, MAL PHI, SIN, THA
1977: Preferential Trade Arrangement
1992: CEPT AFTA
1984: BRU 1995: VN
1997: LAO, MYM
1999: CAM
1995: ASEAN Framework Agreement on Services
2004: ASN-China
2006: ASN-KOR
2008: ASN-JAP
2009: ASN-ANZ; ASN-India; ASN-China Investment; ASN Korea Investment
EAFTA Study
CEPEA Study
1997: ASEAN Vision 2020
1998: ASEAN Investment Area
2003: 3 Pillars of ASEAN Community 2020; 11 Priority Integration Sectors (PIS)
2007: AEC 2015; ASEAN Charter; AEC Blueprint
2008: first year of AEC Blueprint; ASEAN Charter entered into force
2009: ATIGA, ACIA, AEC Scorecard; Roadmap for an ASEAN Community 2009-2015
ASEAN Economic
Community 2025
2005: Logistics as PIS
2010: ASEAN Plus Working Groups on ROO, Tariff Nomenclature, Customs, Ec Cooperation
2010: Connectivity Master Plan
2011: ASEAN ASEAN Framework for Regional Comprehensive Economic Partnership (AF-RCEP)
2011: ASEAN Framework for Equitable Economic Development
2012: ASEAN Financial Inclusion Forum
2012: Launching of RCEP Negotiations
2015: AEC Blueprint 2025

iPhone5
BOEING 787 AUTO MAKERS & SUPPLYING COYS
20

Origin • Farming
Transport • Overland to Ports/Overland to Island by
Barge (services)
Logistics • Shipping/Storage/Inventory
Management (services)
Processing • Crushing/Refining/Formulating
Marketing • Packaging/Sales/Market
Intelligence (services)
Delivery • Transport/Storage/Inbound Logistic
(services)
21

Boundaries have faded away,
international trade has advanced with
increased role of services, innovation
internet, technology, etc
Countries need to identify
what their competitive
advantages are & how to
capitalize on them.
Specialization becomes key
to climb up the value chains
but needs more investment
on productive sectors
22

23
1% decrease in China’s GDP will cause a decrease of 0.11% in INA’s GDP
1% decrease in US GDP will cause a decrease of only 0.05% in INA’s GDP

24
25

26
Yes…apart fro the fa t that the i ala es in the existing WTO agreements—especially
the Agreement on Agriculture—need to
be rectified, those agreements serve as
the norm & reference point for countries
to develop their national trade policies
& in pursuing deeper engagements
with another country or group of
ou tries…
27
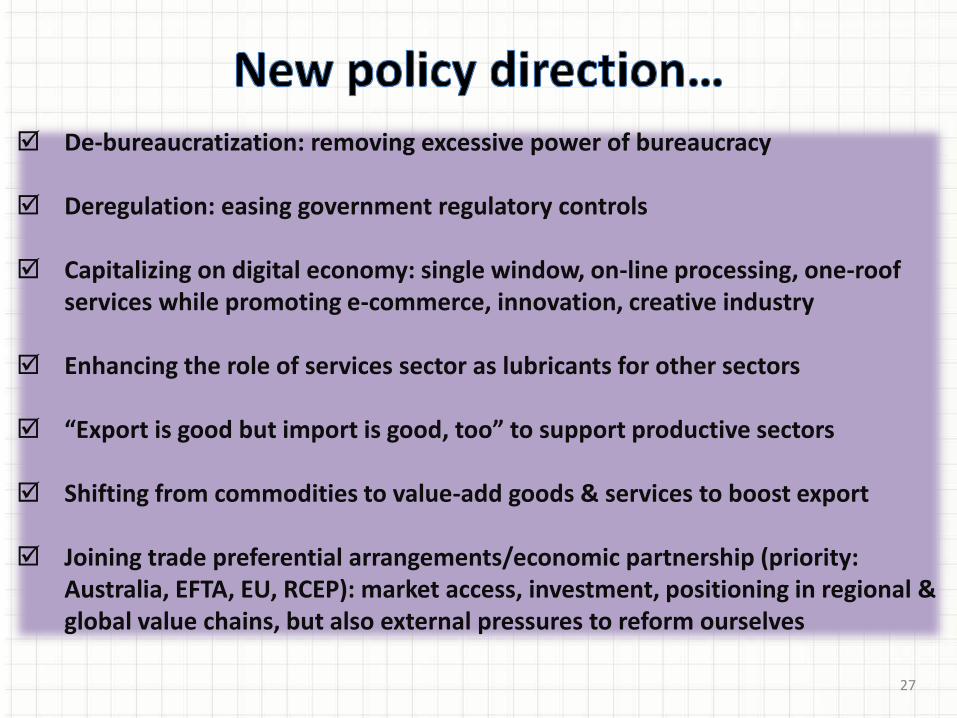
De-bureaucratization: removing excessive power of bureaucracy
Deregulation: easing government regulatory controls
Capitalizing on digital economy: single window, on-line processing, one-roof
services while promoting e-commerce, innovation, creative industry
Enhancing the role of services sector as lubricants for other sectors
E port is good ut i port is good, too to support produ tive se tors
Shifting from commodities to value-add goods & services to boost export
Joining trade preferential arrangements/economic partnership (priority:
Australia, EFTA, EU, RCEP): market access, investment, positioning in regional &
global value chains, but also external pressures to reform ourselves

28
29
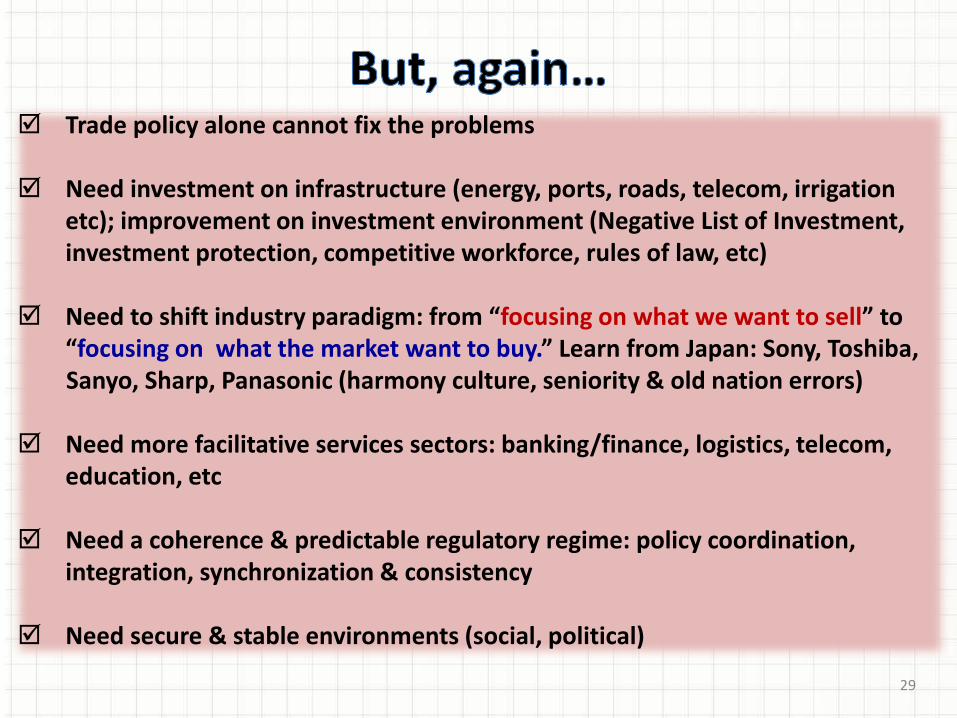
Trade policy alone cannot fix the problems
Need investment on infrastructure (energy, ports, roads, telecom, irrigation
etc); improvement on investment environment (Negative List of Investment,
investment protection, competitive workforce, rules of law, etc)
Need to shift i dustr paradig : fro focusing on what we want to sell to focusing on what the market want to buy. Lear fro Japa : “o , Toshi a,
Sanyo, Sharp, Panasonic (harmony culture, seniority & old nation errors)
Need more facilitative services sectors: banking/finance, logistics, telecom,
education, etc
Need a coherence & predictable regulatory regime: policy coordination,
integration, synchronization & consistency
Need secure & stable environments (social, political)

30

31
Key words: access, shared knowledge, connectivity, self-regulation,
mega data & analysis

32

33
Fashion Bagteria, Sabbatha, Mimsy (lady handbags), Bin House, [x]S.M.L, Mama &
Leon (lady garment) , Partners in Crime (lady shoes), Ouval Research
(sportwear), Suicide Blam (bistro), Lucas Croco, Bellasima, Mitra Jaya,
Benua (lady bags & pouches), Irco, Ki g’s, Seho (safety/protective
shoes), Jasu, Occe, Ovick, Motekar, Baguda, Geeres e ’s shoes & ags , wigs & eye-lashes, celebrity designers, models
Baby Products & Le Monde, Equil (mineral water), Kopi Kapal Api, ExtraJoss, Kopiko,
Food Hatten Bali Wines, Indomie, Mariza Food (cakes, jams), Es Teler 77,
Silver Queen, J.C. Donuts
Homes Essenza (ceramic tiles), cements
Sports & Music Polygon (bicycles), Radix (guitars), rock bands (Burgerkill,
Superman is Dead, the S.I.G.I.T, Noxa, Shaggydog, Vantasma)
Automotive Achilles, Costra, Strada (tire), Innova, Avanza (family car), VW Up!,
VW New Beetle (design by Chris Lesmana), performance exhaust system
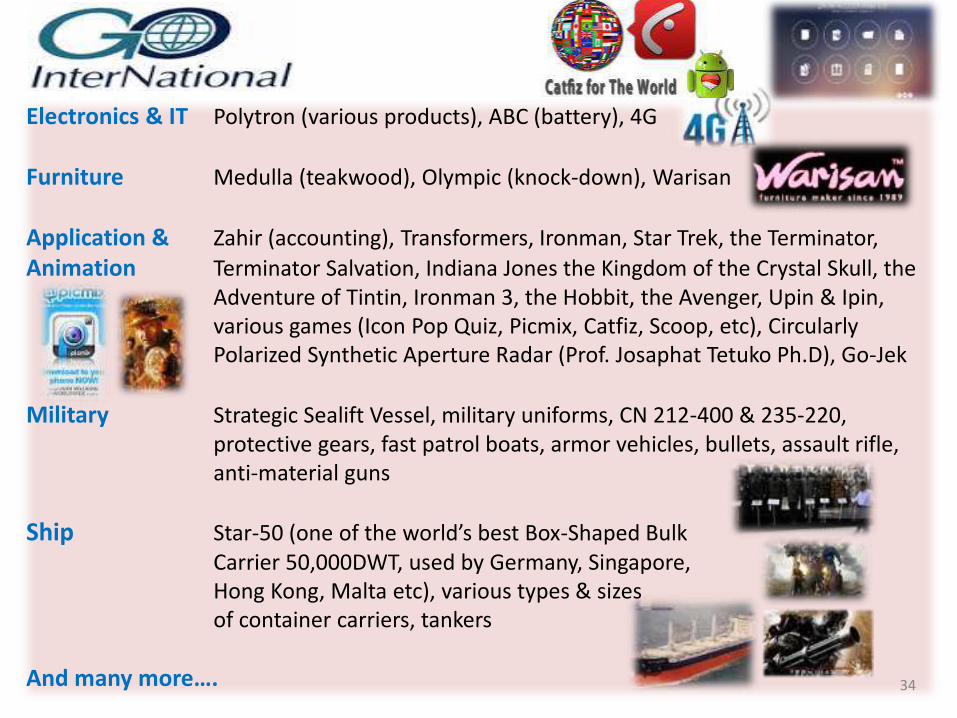
Electronics & IT Polytron (various products), ABC (battery), 4G
Furniture Medulla (teakwood), Olympic (knock-down), Warisan
Application & Zahir (accounting), Transformers, Ironman, Star Trek, the Terminator,
Animation Terminator Salvation, Indiana Jones the Kingdom of the Crystal Skull, the
Adventure of Tintin, Ironman 3, the Hobbit, the Avenger, Upin & Ipin,
various games (Icon Pop Quiz, Picmix, Catfiz, Scoop, etc), Circularly
Polarized Synthetic Aperture Radar (Prof. Josaphat Tetuko Ph.D), Go-Jek
Military Strategic Sealift Vessel, military uniforms, CN 212-400 & 235-220,
protective gears, fast patrol boats, armor vehicles, bullets, assault rifle,
anti-material guns
Ship Star-5 o e of the orld’s est Bo -Shaped Bulk
Carrier 50,000DWT, used by Germany, Singapore,
Hong Kong, Malta etc), various types & sizes
of container carriers, tankers
A d a ore…. 34

35
10 negara tujuan ekspor utama di Afrika:
Afrika Selatan, Mesir, Nigeria, Djibouti, Benin, Ghana, Tanzania,
Kenya, Angola, Algeria
10 produk utama ekspor ke Afrika:
Minyak kelapa sawit & turunannya, perhiasan & logam mulia,
sabun & bahan organik sabun, margarin, kertas & karton, lemari
pendingin, benang serat sintetik non-eceran, asam lemak mono-
karboksilat, karet & produk karet, minyak kelapa (kopra) & kernel
kepala sawit
2011 2012 2013 2014 2015
Total Ekspor ke Afrika ($
milyar)
5,455 5,623 5,571 6,212 4,682
Pangsa Ekspor ke Afrika
terhadap Total Ekspor (%)
3,37 3,67 3,72 4,26 3,55

36