Embed Size (px)
Citation preview

1 © OECD 2016
INDONESIA Since participating in PISA in 2000, science education in Indonesia has undergone an extraordinary transformation to create the foundation for prosperity and sustainable development. Between 2012 and 2015 alone, science performance among 15-year-old students rose by 21 score points. This makes Indonesia the fifth-fastest improving education system among the 72 that took part in this comparison. The pace of innovation in science and technology is accelerating, so it is vital that countries prepare more young talent for jobs in hard science and for many other jobs with a science dimension. But understanding science is important for everyone, not just scientists. Whether buying toothpaste, recycling household waste or talking about global warming, we are constantly bombarded by science-based claims and counter-claims. We all need to be able to separate substance from spin, identify misrepresentations and assess levels of uncertainty and trustworthiness. Indonesia has also seen strong improvements in mathematics and moderate improvements in reading. Equally important, those students in Indonesia who had reached Grade 10 by the age of 15 were significantly ahead.
If Indonesia can keep up that pace of improvement, its children born today have a realistic chance to match the science performance of their peers in the industrialised world by 2030, the year for which the United Nation’s Sustainable Development Goals expect every student to benefit from quality education. That global perspective is important, because as Indonesia joins the global community, its educational success will not just be about improvement by national standards, but about how Indonesian children match up to children around the world.
The enrolment rate in Indonesia has risen over the last decade even as the population has grown. National statistics show that the enrolment rate fort 13-15 year-olds has increased from 88% of students in 2011 to almost 95% just four years later (Statistics Indonesia, 20151). This increase is consistent with the improvement in the PISA coverage rate, a measure of the proportion of 15-year-olds in a country who are eligible to sit the PISA assessment – that is, those who are enrolled in a school at grade 7 or above – which has increased by 15 percentage points in Indonesia since 2006. Looking at countries in the region, Indonesia’s coverage rate (68% of students) is higher than Viet Nam’s (49%) and is now just below that of Thailand (72%).
If the coverage rate would have remained the same throughout the PISA cycles, the improvement in performance would have been much larger in Indonesia. In fact, the performance in science of the median or typical 15-year-old Indonesian ― including all 15-year-olds in the country, not just those covered by the PISA sample ― has risen by 69 score points since 2006, the third-largest jump among all participating school systems and roughly equivalent to two years of schooling. Similar improvements are observed in reading and mathematics.
1 https://www.bps.go.id/linkTableDinamis/view/id/1054

Indonesia Country Note – Results from PISA 2015
2 © OECD 2016
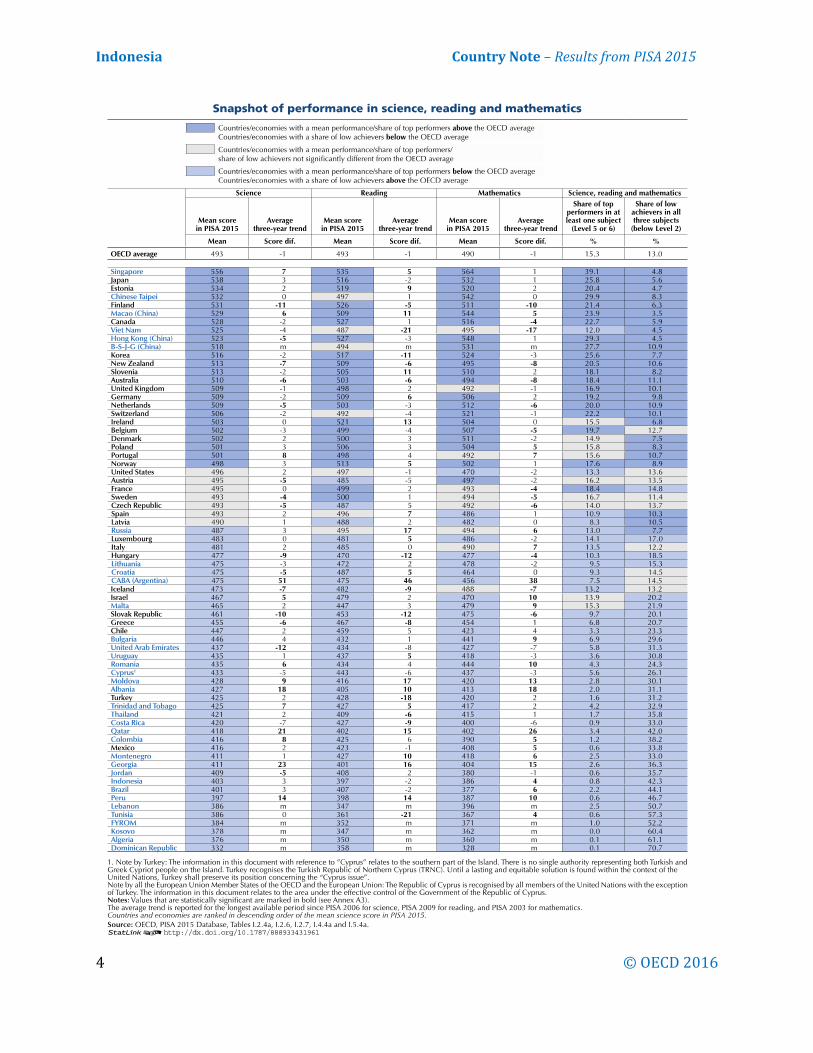
In 2014, the per capita GDP in Indonesia was about one-quarter the average per capita GDP in OECD countries, one-eighth the per capita GDP in neighbouring Singapore, half the per capita GDP in Thailand, and 50% higher than the per capita GDP in Viet Nam. At the same time, the percentage of 35-44 year-olds in Indonesia who were tertiary-educated is more four times smaller than the average across OECD countries (Table I.2.11). These differences should be taken into account when comparing the academic performance of 15-year-olds in Indonesia with their counterparts in other countries. The growing number of PISA-participating countries and economies with a similar GDP per capita to Indonesia, together with Indonesia’s academic improvement, means that Indonesia’s science performance is now above several school systems that participated in PISA 2015.
Students in Indonesia who have already started secondary school (grade 10 or above) perform better in science, with an average 45-point gap over their peers still in grade 9 or below. This is important because more than half of sampled students in Indonesia are on Grade 9 or below (Table A2.4a).
PISA 2015 also asked students about their beliefs about the nature of science knowledge and the validity of scientific methods of enquiry (collectively known as epistemic beliefs). Students whose epistemic beliefs are in agreement with current views about the nature of science can be said to value scientific approaches to enquiry. In Indonesia, students were less likely than students across OECD countries to agree with current views about the nature of science, particularly those about how scientific ideas evolve. For instance, about six in ten students in Indonesia reported that ideas in science or science books sometimes change, compared to eight in ten students across OECD countries (Table I.2.12a).
PISA 2015 asked students what occupation they expect to be working in when they are 30 years old. Even though many 15-year-olds are undecided about their future, almost one in four students across OECD countries reported that they expect to work in an occupation that requires further science training beyond compulsory education, compared with around one in seven students (15%) in Indonesia (Table I.3.10a). However, students who perform better in science are more likely to expect to work in a science-related career, with 13% of low achievers and 31% of students who perform at Level 4 in Indonesia expecting to pursue a science-related career (Table I.3.10b).
Even when equal shares of boys and girls expect to work in a science-related career, boys and girls tend to think of working in different fields of science. In all countries, girls envisage themselves as health professionals more than boys do; and in almost all countries, boys see themselves as becoming ICT professionals, scientists or engineers more than girls do. Boys are more than twice as likely as girls to expect to work as engineers, scientists or architects (science and engineering professionals), on average across OECD countries; only 0.4% of girls, but 4.7% of boys, expect to work as ICT professionals. Girls are almost three times as likely as boys to expect to work as doctors, veterinarians or nurses (health professionals). In Indonesia, gender differences are more pronounced than across OECD countries. Some 22% of girls in Indonesia reported that they expect to pursue a career in science, compared to 9% of boys (Table I.3.10b). Over 9 in 10 Indonesian girls who expect to work in a science-related occupation envision themselves working as a health professional (Tables I.3.11a-d). On average across OECD countries, 94% of students reported that they attend at least one science course per week. But that means that at least one million 15-year-old students are not required to attend any science lesson. In Indonesia, 96% of students reported attending at least science lesson per week (Table II.2.3). Students who reported not attending school science classes are more likely to be in disadvantaged schools. In Indonesia, students in disadvantaged schools are five percentage points more likely than students in advantaged schools to be required to attend science lessons; attending more science courses may help disadvantaged students to close the performance gap with their advantaged peers (Table II.2.4).
Science-related extracurricular activities, such as science clubs and competitions, help students understand scientific concepts, raise interest in science and even nurture future scientists. For instance, across OECD countries, students in schools that offer science competitions score 36 points higher in

Indonesia Country Note – Results from PISA 2015
© OECD 2016 3
science and are 55% more likely to expect to work in a science-related occupation than students in schools that do not offer such activities. Across OECD countries, 39% of students are enrolled in schools that offer a science club and 66% attend schools that offer science competitions. Science clubs are most commonly offered in East Asian countries and economies, while science competitions are most frequently offered in several Eastern European countries. In Indonesia too, more students attend schools that offer these types of activities than the OECD average, with 59% of students attending a school that offers a science club and % of students attending a school that offers science competitions (Table II.2.11).
In Indonesia, advantaged schools offer a science club more often than disadvantaged schools do (Table II.2.12). For example, while 29% of students enrolled in disadvantaged schools are offered a science club, 75% of students in advantaged schools are offered this activity. And students in schools that offer a science club score 38 points higher in science (16 points higher after accounting for students’ and schools’ socio-economic profile).
Compared to principals in other school systems, principals in Indonesia are more concerned about the quality and the lack of material resources at their schools. For instance, 33% of students in Indonesia attend schools whose principal considers that the capacity to provide instruction is hindered a lot by the lack of educational material, compared to 6% of students across OECD and 17% of students in Thailand (Table II.6.1).
Compared to principals in other PISA-participating countries/economies, principals in Indonesia describe a positive school learning environment, one in which student truancy, a lack of respect between students and teachers, students’ use of alcohol, bullying and teacher absenteeism barely hinder student learning (Tables II.3.12 and II.3.17).
As in neighbouring countries, including Singapore, Thailand and Viet Nam, students in Indonesia reported a more positive disciplinary climate in science lessons than on average across OECD countries (Table II.3.10). A positive disciplinary climate is one where there is little noise and disorder, students listen to their teachers, and students start working just after the lesson begins.
About four in ten students in Indonesia are enrolled in a private school, considerably more than the OECD average and in neighbouring countries Singapore, Thailand and Viet Nam (Table II.4.6). Unlike most other school systems participating in PISA, including Thailand, Indonesian students with an average socio-economic status are more likely to attend public schools than both socio-economically advantaged and disadvantaged students (Table II.4.10). Indonesian students in public schools score 16 points higher in science than students in private schools, after accounting for socio-economic status.
Indonesia Country Note – Results from PISA 2015
4 © OECD 2016

Indonesia Country Note – Results from PISA 2015
© OECD 2016 5

Indonesia Country Note – Results from PISA 2015
6 © OECD 2016
What is PISA?
The Programme for International Student Assessment (PISA) is an ongoing triennial survey that assesses the extent to which 15-year-olds students near the end of compulsory education have acquired key knowledge and skills that are essential for full participation in modern societies. The assessment does not just ascertain whether students can reproduce knowledge; it also examines how well students can extrapolate from what they have learned and apply that knowledge in unfamiliar settings, both in and outside of school. This approach reflects the fact that modern economies reward individuals not for what they know, but for what they can do with what they know. PISA offers insights for education policy and practice, and helps monitor trends in students’ acquisition of knowledge and skills across countries and in different demographic subgroups within each country. The findings allow policy makers around the world to gauge the knowledge and skills of students in their own countries in comparison with those in other countries, set policy targets against measurable goals achieved by other education systems, and learn from policies and practices applied elsewhere. Key features of PISA 2015 • The PISA 2015 survey focused on science, with reading, mathematics and collaborative problem-
solving as minor areas of assessment. For the first time, PISA 2015 delivered the assessment of all subjects via computer. Paper-based assessments were provided for countries that chose not to test their students by computer, but the paper-based assessment was limited to questions that could measure trends in science, reading and mathematics performance.
The students • Around 540 000 students completed the assessment in 2015, representing about 29 million 15-year-
olds in the schools of the 72 participating countries and economies.
The assessment • Computer-based tests were used, with assessments lasting a total of two hours for each student. • Test items were a mixture of multiple-choice questions and questions requiring students to construct
their own responses. The items were organised in groups based on a passage setting out a real-life situation. About 810 minutes of test items were covered, with different students taking different combinations of test items.
• Students also answered a background questionnaire, which took 35 minutes to complete. The questionnaire sought information about the students themselves, their homes, and their school and learning experiences. School principals completed a questionnaire that covered the school system and the learning environment. For additional information, some countries/economies decided to distribute a questionnaire to teachers. It was the first time that this optional teacher questionnaire was offered to PISA-participating countries/economies. In some countries/economies, optional questionnaires were distributed to parents, who were asked to provide information on their perceptions of and involvement in their child’s school, their support for learning in the home, and their child’s career expectations, particularly in science. Countries could choose two other optional questionnaires for students: one asked students about their familiarity with and use of information and communication technologies (ICT); and the second sought information about students’ education to date, including any interruptions in their schooling, and whether and how they are preparing for a future career.

Indonesia Country Note – Results from PISA 2015
© OECD 2016 7

Indonesia Country Note – Results from PISA 2015
8 © OECD 2016
This work is published under the responsibility of the Secretary-General of the OECD. The opinions expressed and arguments employed herein do not necessarily reflect the official views of OECD member countries. This document and any map included herein are without prejudice to the status of or sovereignty over any territory, to the delimitation of international frontiers and boundaries and to the name of any territory, city or area. Note regarding data from Israel The statistical data for Israel are supplied by and are under the responsibility of the relevant Israeli authorities. The use of such data by the OECD is without prejudice to the status of the Golan Heights, East Jerusalem and Israeli settlements in the West Bank under the terms of international law.
This work is available under the Creative Commons Attribution-NonCommercial-ShareAlike 3.0 IGO (CC BY-NC-SA 3.0 IGO). For specific information regarding the scope and terms of the licence as well as possible commercial use of this work or the use of PISA data please consult Terms and Conditions on www.oecd.org.
Contacts: Andreas Schleicher Director for the Directorate for Education and Skills Email: [email protected] Telephone: +33 1 45 24 93 66 Alfonso Echazarra Analyst, Directorate for Education and Skills Email: [email protected] For more information on the Programme for International Student Assessment and to access the full set of PISA 2015 results, visit: www.oecd.org.edu/pisa