Embed Size (px)
Citation preview
1PISA IN FOCUS 2012/02 (February) – © OECD 2012
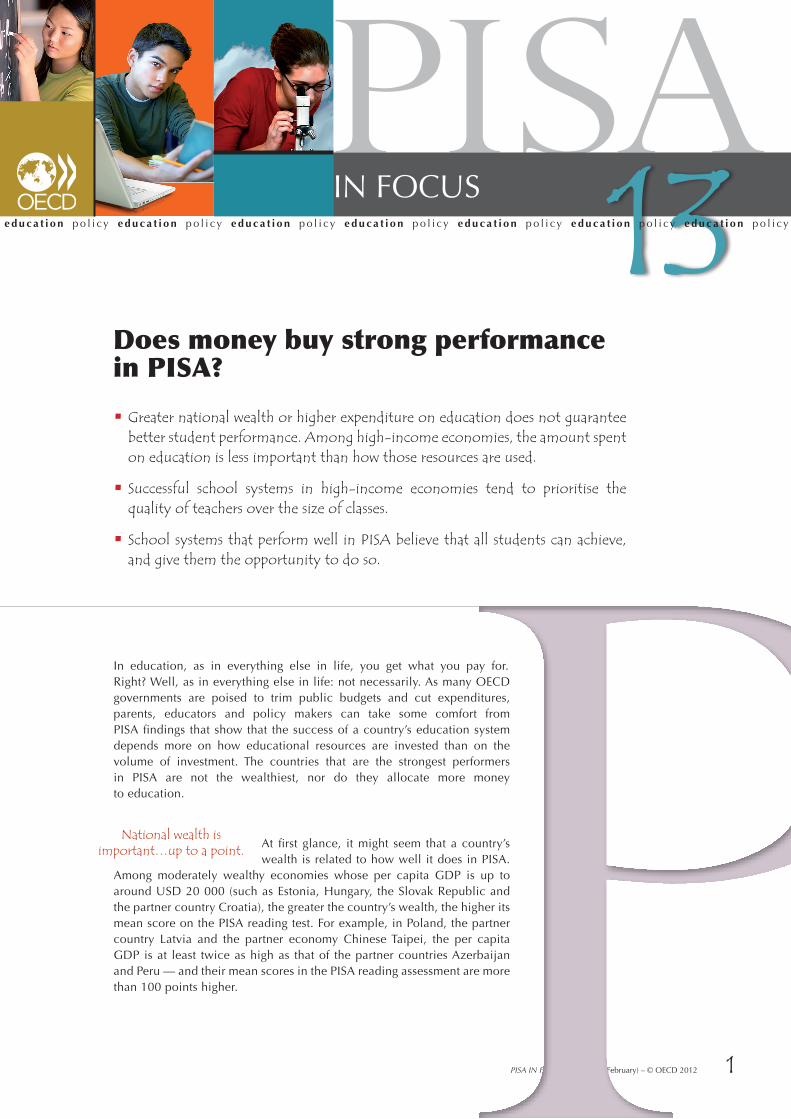
PISADoes money buy strong performance in PISA?
•Greater national wealth or higher expenditure on education does not guarantee better student performance. Among high-income economies, the amount spent on education is less important than how those resources are used.
•Successful school systems in high-income economies tend to prioritise the quality of teachers over the size of classes.
•School systems that perform well in PISA believe that all students can achieve, and give them the opportunity to do so.
in Focus 13e d u c a t i o n p o l i cy e d u c a t i o n p o l i cy e d u c a t i o n p o l i cy e d u c a t i o n p o l i cy e d u c a t i o n p o l i cy e d u c a t i o n p o l i cy e d u c a t i o n p o l i cy
in education, as in everything else in life, you get what you pay for. Right? Well, as in everything else in life: not necessarily. As many oEcD governments are poised to trim public budgets and cut expenditures, parents, educators and policy makers can take some comfort from PisA findings that show that the success of a country’s education system depends more on how educational resources are invested than on the volume of investment. The countries that are the strongest performers in PisA are not the wealthiest, nor do they allocate more money to education.
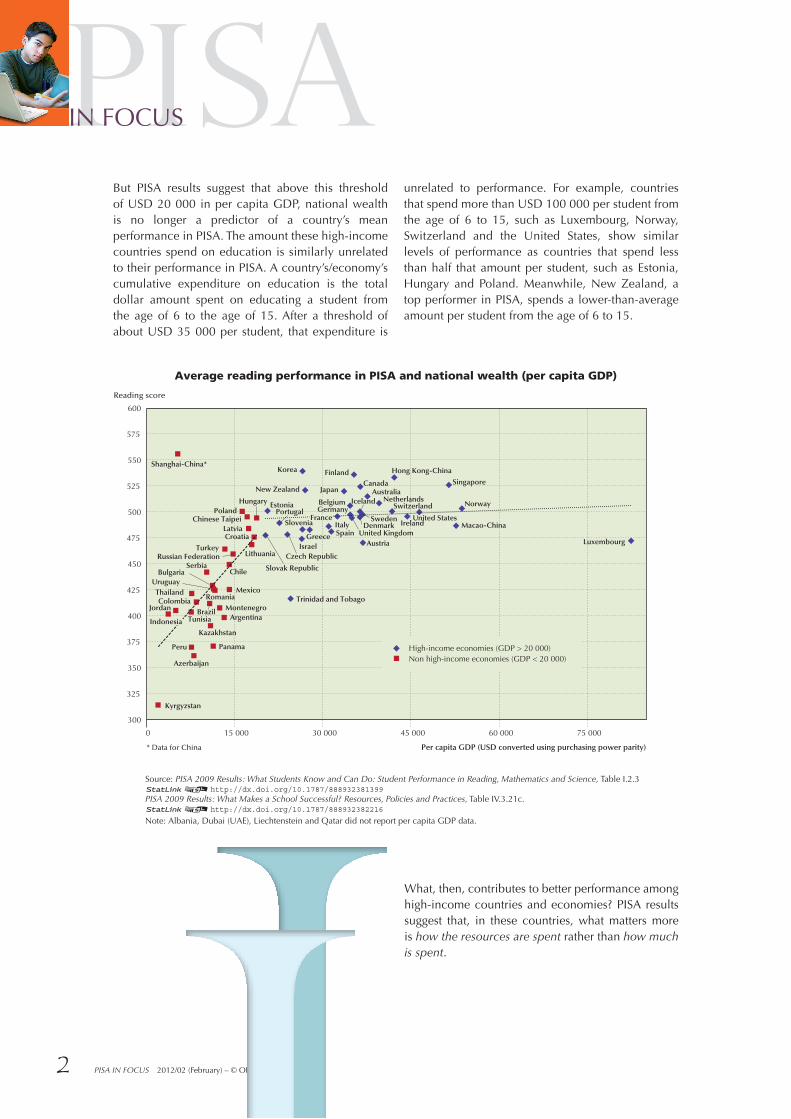
At first glance, it might seem that a country’s wealth is related to how well it does in PisA.
Among moderately wealthy economies whose per capita GDP is up to around usD 20 000 (such as Estonia, Hungary, the slovak Republic and the partner country croatia), the greater the country’s wealth, the higher its mean score on the PisA reading test. For example, in Poland, the partner country Latvia and the partner economy chinese Taipei, the per capita GDP is at least twice as high as that of the partner countries Azerbaijan and Peru — and their mean scores in the PisA reading assessment are more than 100 points higher.
National wealth is important…up to a point.
PISAin Focus
PISA IN FOCUS 2012/02 (February) – © oEcD 20122
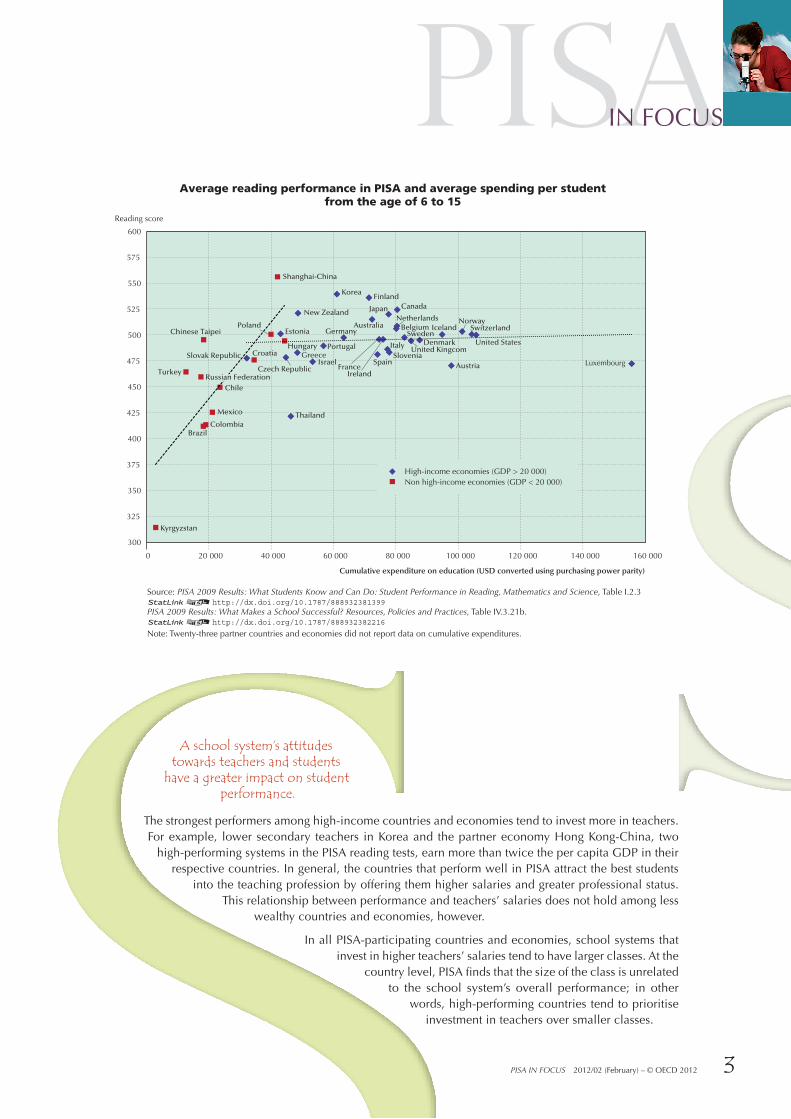
But PisA results suggest that above this threshold of usD 20 000 in per capita GDP, national wealth is no longer a predictor of a country’s mean performance in PisA. The amount these high-income countries spend on education is similarly unrelated to their performance in PisA. A country’s/economy’s cumulative expenditure on education is the total dollar amount spent on educating a student from the age of 6 to the age of 15. After a threshold of about usD 35 000 per student, that expenditure is
unrelated to performance. For example, countries that spend more than usD 100 000 per student from the age of 6 to 15, such as Luxembourg, norway, switzerland and the united states, show similar levels of performance as countries that spend less than half that amount per student, such as Estonia, Hungary and Poland. Meanwhile, new Zealand, a top performer in PisA, spends a lower-than-average amount per student from the age of 6 to 15.
source: PISA 2009 Results: What Students Know and Can Do: Student Performance in Reading, Mathematics and Science, Table i.2.3 12http://dx.doi.org/10.1787/888932381399 PISA 2009 Results: What Makes a School Successful? Resources, Policies and Practices, Table iV.3.21c. 12http://dx.doi.org/10.1787/888932382216
note: Albania, Dubai (uAE), Liechtenstein and Qatar did not report per capita GDP data.
Average reading performance in PISA and national wealth (per capita GDP)
300
325
350
375
400
425
450
475
500
525
550
575
600
0 15 000 30 000 45 000 60 000 75 000
Reading score
* Data for China Per capita GDP (USD converted using purchasing power parity)
Norway
Macao-China
Singapore
United States Ireland
Hong Kong-China
Switzerland Netherlands
Australia
Austria
Canada Finland
United Kingdom
Germany Belgium
Japan
France
Spain Italy
Greece
New Zealand
Korea
Slovenia
Israel
Trinidad and Tobago
Czech Republic
Estonia
Slovak Republic
Hungary
Croatia
Lithuania
Latvia Chinese Taipei
Poland
Russian Federation
Mexico
Chile
Turkey Luxembourg
Denmark
Iceland
Sweden Portugal
Argentina Montenegro
Uruguay
Panama
Bulgaria
Kazakhstan
Brazil
Serbia
Colombia
Azerbaijan
Thailand
Peru
Tunisia
Jordan
Indonesia
Kyrgyzstan
Shanghai-China*
High-income economies (GDP > 20 000)Non high-income economies (GDP < 20 000)
Romania
What, then, contributes to better performance among high-income countries and economies? PisA results suggest that, in these countries, what matters more is how the resources are spent rather than how much is spent.
PISAin Focus
PISA IN FOCUS 2012/02 (February) – © oEcD 2012
The strongest performers among high-income countries and economies tend to invest more in teachers. For example, lower secondary teachers in Korea and the partner economy Hong Kong-china, two
high-performing systems in the PisA reading tests, earn more than twice the per capita GDP in their respective countries. in general, the countries that perform well in PisA attract the best students
into the teaching profession by offering them higher salaries and greater professional status. This relationship between performance and teachers’ salaries does not hold among less
wealthy countries and economies, however.
in all PisA-participating countries and economies, school systems that invest in higher teachers’ salaries tend to have larger classes. At the
country level, PisA finds that the size of the class is unrelated to the school system’s overall performance; in other
words, high-performing countries tend to prioritise investment in teachers over smaller classes.
A school system’s attitudes towards teachers and students
have a greater impact on student performance.
Average reading performance in PISA and average spending per student from the age of 6 to 15
Luxembourg
300
325
350
375
400
425
450
475
500
525
550
575
600
0 20 000 40 000 60 000 80 000 100 000 120 000 140 000 160 000
Reading score
Cumulative expenditure on education (USD converted using purchasing power parity)
High-income economies (GDP > 20 000)Non high-income economies (GDP < 20 000)
Slovak Republic
Estonia
Czech Republic
Thailand
Greece
New Zealand
Israel
Portugal
Korea
Germany
Finland
Australia
Spain France
Ireland
Italy
Japan
Slovenia
Netherlands
Canada
United Kingcom Denmark
Iceland
Austria
Norway Switzerland
United States
Kyrgyzstan
Turkey Russian Federation
Brazil
Chinese Taipei
Colombia
Mexico
Chile
Croatia
Poland
Hungary
Shanghai-China
Belgium Sweden
source: PISA 2009 Results: What Students Know and Can Do: Student Performance in Reading, Mathematics and Science, Table i.2.3 12http://dx.doi.org/10.1787/888932381399 PISA 2009 Results: What Makes a School Successful? Resources, Policies and Practices, Table iV.3.21b. 12http://dx.doi.org/10.1787/888932382216
note: Twenty-three partner countries and economies did not report data on cumulative expenditures.
PISAin Focus
PISA IN FOCUS 2012/02 (February) – © oEcD 20124
For more information
Contact Guillermo Montt ([email protected])
See PISA 2009 Results: What Makes a School Successful? Resources, Policies and Practices (Vol. iV)strong Performers and successful Reformers in Education policy video series
The bottom line: Money alone can’t buy a good education system. Strong performers in PISA are those countries and economies that believe - and act on the belief - that all children can succeed in school. Among wealthier economies, those that prioritise the quality of teachers over smaller classes tend to show
better performance. When it comes to money and education, the question isn’t how much? but rather for what?
Coming next month
What kinds of careers do boys and girls expect for themselves?
Visitwww.pisa.oecd.org www.oecd.org/pisa/infocus
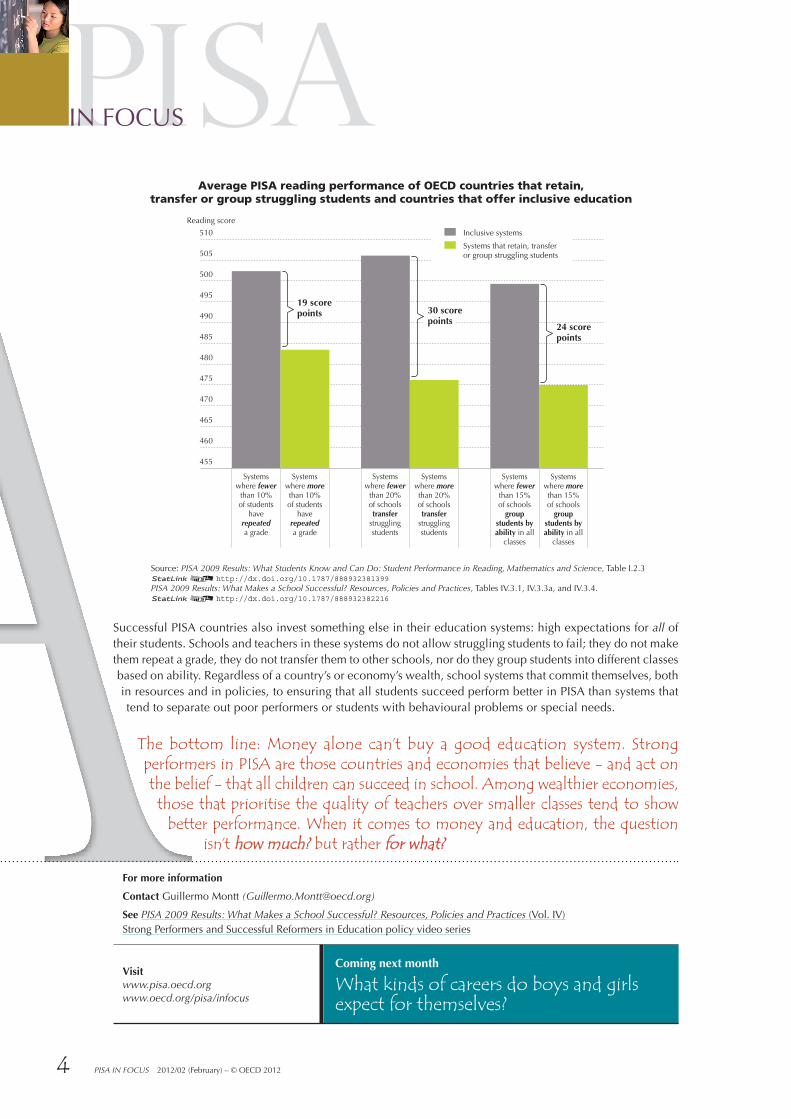
successful PisA countries also invest something else in their education systems: high expectations for all of their students. schools and teachers in these systems do not allow struggling students to fail; they do not make them repeat a grade, they do not transfer them to other schools, nor do they group students into different classes based on ability. Regardless of a country’s or economy’s wealth, school systems that commit themselves, both in resources and in policies, to ensuring that all students succeed perform better in PisA than systems that tend to separate out poor performers or students with behavioural problems or special needs.
Average PISA reading performance of OECD countries that retain, transfer or group struggling students and countries that offer inclusive education
455
460
465
470
475
480
485
490
495
500
505
510
Reading score
24 scorepoints
Systems where fewer
than 20% of schools transfer
struggling students
Systems where fewer
than 10% of students
have repeated a grade
Systems where more than 10% of students
have repeated a grade
Systems where more than 20% of schools transfer
struggling students
Systems where fewer
than 15% of schools
group students by ability in all
classes
Systems where more than 15% of schools
group students by ability in all
classes
Inclusive systems
Systems that retain, transfer or group struggling students
19 scorepoints 30 score
points
source: PISA 2009 Results: What Students Know and Can Do: Student Performance in Reading, Mathematics and Science, Table i.2.3 12http://dx.doi.org/10.1787/888932381399 PISA 2009 Results: What Makes a School Successful? Resources, Policies and Practices, Tables iV.3.1, iV.3.3a, and iV.3.4. 12http://dx.doi.org/10.1787/888932382216