Embed Size (px)
Citation preview

Received on: 14 November 2016
IOTC–2016–SC19–NR10
Indonesia National Report to the Scientific Committee
of the Indian Ocean Tuna Commission, 2016
Authors
Hari Eko Irianto1)
Wudianto1)
Zulkarnaen Fahmi2)
Bram Setyaji2)
Fayakun Satria3)
Lilis Sadiyah1)
Budi Nugraha3)
A Anung Widodo1)
1)
Centre for Fisheries Research and Development, Jakarta. 2)
Research Institute for Tuna Fisheries, Benoa Bali. 3)
Research Institute for Marine Fisheries, Jakarta.
IOTC–2016–SC19–NR10
Page 2 of 26
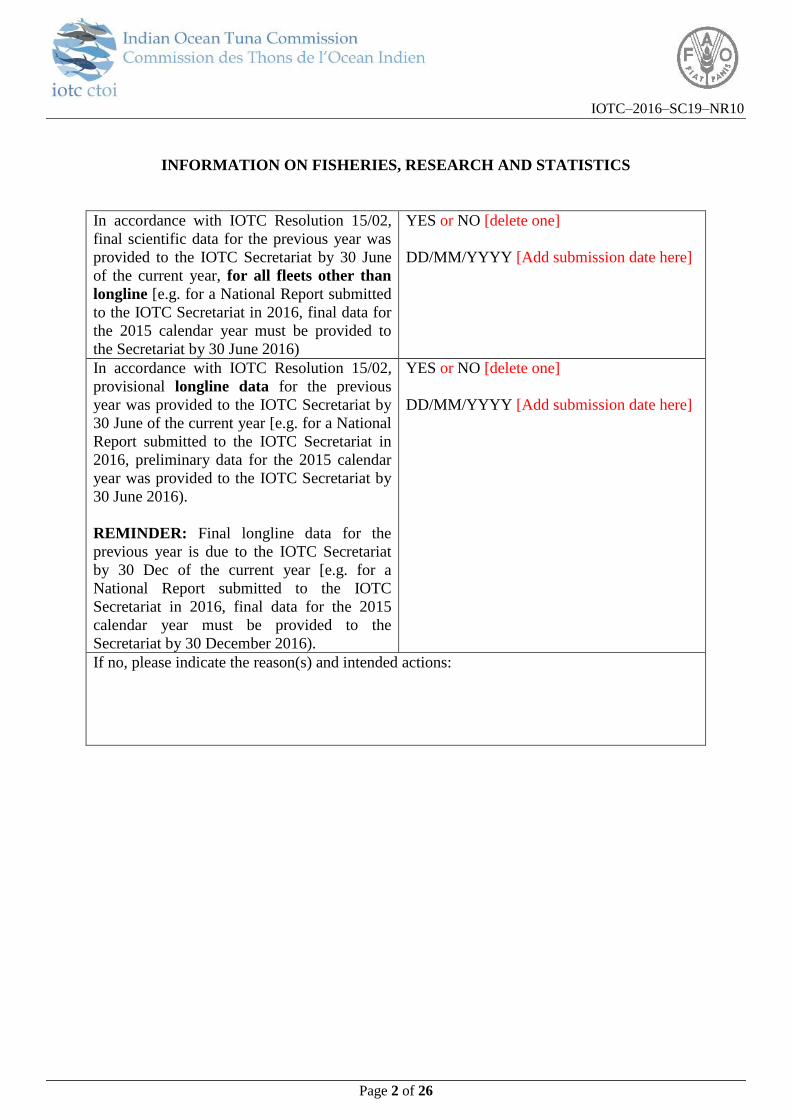
INFORMATION ON FISHERIES, RESEARCH AND STATISTICS
In accordance with IOTC Resolution 15/02,
final scientific data for the previous year was
provided to the IOTC Secretariat by 30 June
of the current year, for all fleets other than
longline [e.g. for a National Report submitted
to the IOTC Secretariat in 2016, final data for
the 2015 calendar year must be provided to
the Secretariat by 30 June 2016)
YES or NO [delete one]
DD/MM/YYYY [Add submission date here]
In accordance with IOTC Resolution 15/02,
provisional longline data for the previous
year was provided to the IOTC Secretariat by
30 June of the current year [e.g. for a National
Report submitted to the IOTC Secretariat in
2016, preliminary data for the 2015 calendar
year was provided to the IOTC Secretariat by
30 June 2016).
REMINDER: Final longline data for the
previous year is due to the IOTC Secretariat
by 30 Dec of the current year [e.g. for a
National Report submitted to the IOTC
Secretariat in 2016, final data for the 2015
calendar year must be provided to the
Secretariat by 30 December 2016).
YES or NO [delete one]
DD/MM/YYYY [Add submission date here]
If no, please indicate the reason(s) and intended actions:

IOTC–2016–SC19–NR10
Page 3 of 26
Executive Summary
For fisheries management purpose, Indonesian waters is divided into eleven Fisheries Management
Areas (FMA). Three of them located within the IOTC area of competence, namely Fisheries Management
Areas (FMAs) 572 (Indian Ocean – West Sumatera), FMA 573 (South of Java – East Nusa Tenggara) and
571 (Malacca Strait and Andaman Sea). Indonesian fishers operate various fishing gears such as Long line,
Purse seine, hand line to catch large pelagic fishes such as tuna, skipjack, marlins etc. Longline is the main
fishing gear type targeting tunas which operated in those FMAs. The national catch of four main tuna
species in 20151 was estimated 135,799 tons which composed of yellowfin tuna (35,060 t), bigeye tuna
(22,433 t), skipjack tuna (70,206 t) and albacore (8,080 t). Port sampling and scientific observer programs
are still continuing and conducting by Research Institute for Tuna fisheries (RITF). Following the issuance
of ministerial regulation No. 1/2013 concerning observer onboard for fishing and carrier vessel, the national
tuna management plan (NTMP) was officially lunched in Bali in 2014 and legalized recently in 2015.
Furthermore, transshipment at sea also banned by ministry regulation no 57/PERMEN/2014 and
implemented by 2015.
1 Current estimation from DGCF (unvalidated)

IOTC–2016–SC19–NR10
Page 4 of 26
Table of Contents.
INDONESIA National Report to the Scientific Committee of the Indian Ocean
Tuna Commission, 2016 ........................................................................................................................ 1
Executive Summary ............................................................................................................................... 3
Contents ............................................................................................................................................. 4
1. Background/General Fishery Information ................................................................................. 5
2. Fleet Structure ............................................................................................................................ 6
3. Catch and Effort ......................................................................................................................... 6
4. Recreational Fishing .................................................................................................................. 12
5. Ecosystem and By Catch Issues ................................................................................................. 12
5.1 Sharks ............................................................................................................................. 12
5.2 Searbirds ........................................................................................................................ 13
5.3 Marine Turtles ............................................................................................................... 14
5.4 Billfishes ......................................................................................................................... 15
5.5 Neritic Tuna ................................................................................................................... 15
5.6 Other ecologically related species (e.g marine mammals, whale sharks) ..................... 16
6. National Data Collection and Processing Systems .................................................................... 16
6.1 Logsheet data collection and verification ...................................................................... 16
6.2 Vessel Monitoring System .............................................................................................. 17
6.3 Regional Observer programme...................................................................................... 18
6.4 Port sampling programme ............................................................................................. 22
6.5 Unloading/Transhipment ............................................................................................... 23
7. National Research Programs ...................................................................................................... 24
8. Implementation of Scientific Committee Recommendations and Resolutions of the IOTC
relevant to the SC ....................................................................................................................... 24
9. Literature Cited .......................................................................................................................... 26

IOTC–2016–SC19–NR10
Page 5 of 26
1. BACKGROUND/GENERAL FISHERY INFORMATION
Indonesia is an archipelagic nation located between the continents of Asia and Australia
surrounded by two oceans, Pacific Ocean in the northern part and Indian Ocean in southern part. It
consists of approximately 17,508 islands and coast line of 81,000 km. Totally, Indonesia has 5.8
million km2 of marine waters consisting of 3.1 million km2 of territorial waters (<12 miles) and 2.7
million km2 of EEZ (12-200 miles). For fisheries management purpose Indonesia waters is divided
into eleven Fisheries Management Areas (FMAs) (Figure 1). FMAs 572 (Indian Ocean – West
Sumatera), 573 (South of Java – East Nusa Tenggara), and 571 (Malacca Strait and Andaman Sea)
are located within the IOTC area of competence (Figure 1).
Figure 1a. The eleven of Fisheries Management Area (FMA) in Indonesian waters
South Indonesian marine waters from Banda Aceh to NTT (East Timor) there are at least 12
fishing ports as landing site for tuna. Five main landing sites for Indian Ocean tuna industrial fleet
are Benoa Fishing Port (Bali), Muara Baru Port (Jakarta) and Cilacap Port (Jawa Tengah),
Palabuhanratu (Jawa Barat) and Bungus (Sumatera Barat). There are also several non-industrial
fishing ports located in Sumatera, Jawa, Bali and NTT Island that known as tuna landing place
(Figure 2). Benoa Fishing Port is considered as main tuna landing port for Indonesian tuna catch.

IOTC–2016–SC19–NR10
Page 6 of 26
Figure 1b. Primary fishing port/landing sites the industrial (blue label) and artisanal (red label).
2. FLEET STRUCTURE
The number of registered fishing boats operated, as reported to IOTC as per 2 November 2016 in
the FMAs 572, 573 and high seas Indian Ocean was 1,376 fishing vessels which consisted of
longliner (1,311), purse seiner (43), gillnetter (2), and carrier boat (11). Those fishing boats were
vary in size from less than 50 GT to 1,025 GT.
Table 1. Registered Indonesian fishing vessels by size (GT) as reported to IOTC as per 1
November 2016 (Source: DGCF, 2016).
Size Longliner Purse
Seiner Gil Netter
Carrier/Cargo
Freezer Other Total
<50 289 0 1 1 0 291
51-100 471 9 1 2 2 485
101-200 530 29 0 8 6 573
201-300 3 2 0 0 0 5
301-500 6 0 0 0 1 7
501-800 12 0 0 0 0 12
>800 0 3 0 0 0 3
Total 1,311 43 2 11 9 1,376
3. CATCH AND EFFORT (BY SPECIES AND GEAR)
Indonesian national statistic regularly reported the annual catch including four (4) main species
such as bigeye tuna, yellowfin tuna, skipjack tuna and albacore. However, the annual catch for 2015
is still currently under step by step validation process assisted by RFMOs expert. Official release
expected to be issued before the end of the year. Total catch of main species of tunas in 2015 was
135,779 tons which composed of yellowfin tuna (35,060 t); bigeye tuna (22,433 t), skipjack tuna

IOTC–2016–SC19–NR10
Page 7 of 26
(70,206 t) and albacore (8,080 t). The average catch of tunas from 2011 to 2015 was estimated
133,092 t (ton). The proportion average catch was dominated by skipjack tuna (49.79%), yellowfin
tuna (26.53%), bigeye tuna (18.14%) and albacore (5.53%). All catches were reported to be lower
than the previous year, varied from 2.68% - 44.48%. Albacore has the slightest, while bigeye tuna
has the worst decline. However, longline is still the main fishing gear targeting tuna that contributes
a significant proportion among other gear types. Table 2 does not include data for Southern bluefin
tuna (SBF), tuna like species, sharks, billfishes, seerfish and others associated species. Therefore, the
actual total catch of all species might be higher (DGCF, 2016).
Table 2. Annual catch by gear and primary species of tuna (ALB, BET, SKJ and YFT) derived
from Indian Ocean from 2011-2015.
Gear Type Species Year Average
2011 2012 2013 2014 2015* (MT)
Longline Yellowfin 9,315 11,222 16,325 12,645 6,783 18,795
Bigeye 8,207 11,150 15,037 16,197 8,209 13,191
Skipjack 4,167 8,943 9,517 5,729 1,331 3,338
Albacore 8,775 7,631 6,021 8,539 4,573 8,352
Total 30,464 38,946 46,900 43,110 20,896 43,676
Purse seine Yellowfin 8,737 11,776 20,229 14,582 15,250 6,899
Bigeye 7,309 9,537 12,012 9,516 8,254 5,364
Skipjack 34,838 31,190 33,871 26,468 38,024 25,260
Albacore 1,027 98 70 199 8 171
Total 51,911 52,601 66,182 50,765 61,536 37,694
Pole and Yellowfin 1,535 394 3,860 2,782 - 913
Line Bigeye - - - - - 0
Skipjack 2,545 8,328 12,256 9,577 - 3,882
Albacore - - - - - 0
Total 4,080 8,722 16,116 12,359 - 4,795
Handline Yellowfin 1,997 3,634 9,524 6,865 3,350 3,194
Bigeye 237 218 745 590 1,279 294
Skipjack 2,653 5,002 8,167 6,382 6,813 3,353
Albacore 39 423 3 9 1,229 183
Total 4,926 9,277 18,439 13,846 12,671 7,023
Others Yellowfin 16,087 11,506 11,442 8,248 9,677 10,678
Bigeye 10,267 11,635 7,711 6,109 4,691 4,930
Skipjack 40,398 33,870 30,626 23,932 24,038 30,610
Albacore 1,642 2,875 1 3 2,270 1,301
Total 68,394 59,886 49,780 38,292 40,676 47,518
Grand Total Yellowfin 37,671 38,532 61,380 45,122 35,060 43,553
Bigeye 26,020 32,540 35,505 32,412 22,433 29,782
Skipjack 84,601 87,333 94,437 72,088 70,206 81,733
Albacore 11,483 11,027 6,095 8,750 8,080 9,087
Total 159,775 169,432 197,417 158,372 135,779 164,155

IOTC–2016–SC19–NR10
Page 8 of 26
The distribution of effort (hooks) from longline fleets in 2015 derived from scientific observer
data was concentrated above 15o
S and between 85o-120
o E. The range of effort used was between
768-1456 hooks/set with average 1165 hooks/set (Figure 2a). Overall the average number of
hooks/set used during 2011-2015 was between 881-2700 hooks/set (1191 hooks/set in average) with
remarks that higher number of hooks/set was distributed between 15o-35
o S and 70 (Figure 2b).
Figure 2a. Map of the distribution of Indonesian tuna longline efforts year 2015 (source: RITF
Observer Program data).
Figure 2b. Map of spatial distribution of observed longline effort (hooks) by 5-degree blocks,
aggregated from 2011 to 2015 (source: RITF Observer Program data).
IOTC–2016–SC19–NR10
Page 9 of 26
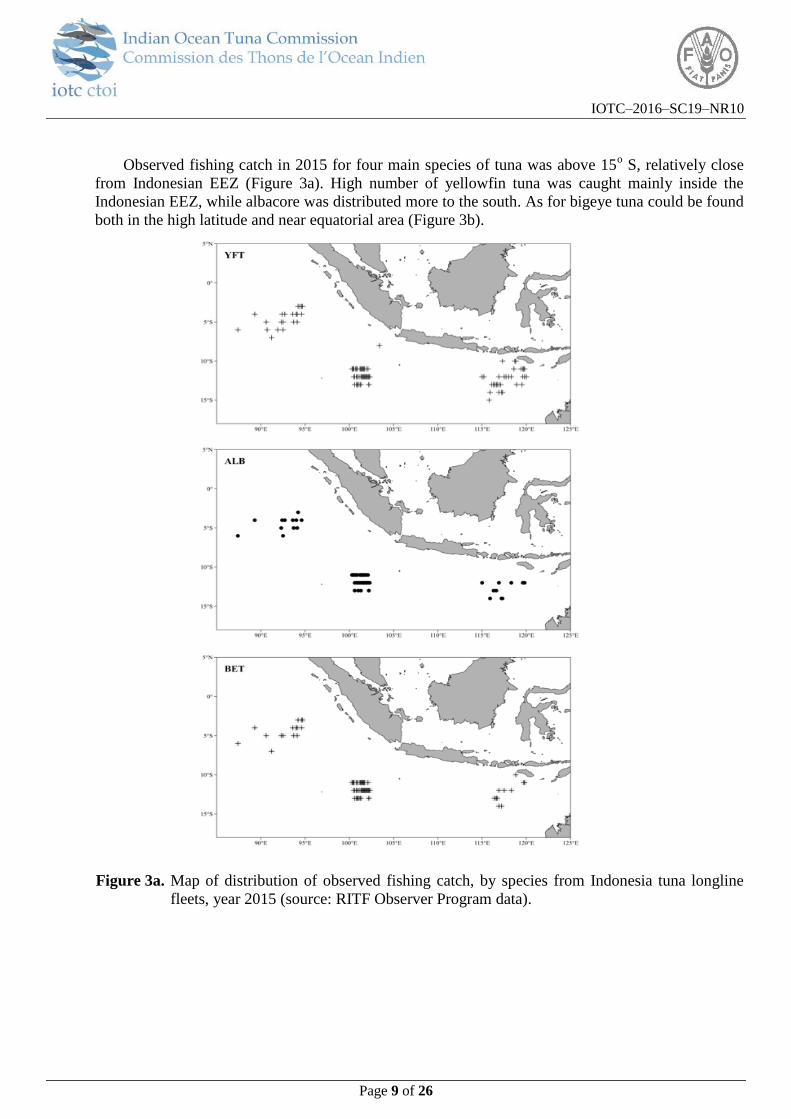
Observed fishing catch in 2015 for four main species of tuna was above 15o S, relatively close
from Indonesian EEZ (Figure 3a). High number of yellowfin tuna was caught mainly inside the
Indonesian EEZ, while albacore was distributed more to the south. As for bigeye tuna could be found
both in the high latitude and near equatorial area (Figure 3b).
Figure 3a. Map of distribution of observed fishing catch, by species from Indonesia tuna longline
fleets, year 2015 (source: RITF Observer Program data).

IOTC–2016–SC19–NR10
Page 10 of 26
Figure 3b. Map of distribution of observed fishing catch, by species, by 5-degree blocks, aggregated
from 2011 to 2015 (source: RITF Observer Program data).
3.1. Annual catch estimation at Benoa port Annual catch that estimate from port sampling program at Benoa port reported a decrease trend
of total tuna landed from 2011. Reached its lowest production in 2013 for 6,121 tons and then
bounced back afterward. The recent catch was slightly higher than the two previous years. The
number of effort (number of landing) also showed the same trend as it shown in table 3 and figure 4.

IOTC–2016–SC19–NR10
Page 11 of 26
Table 3. Annual catch estimation by gear and primary species of tuna (ALB, BET and YFT)
landed in Benoa Port from 2011-2015.
Year Annual Catch Estimation (ton)
YFT BET ALB TOTAL
2011 3,006 2,504 384 6,326
2012 2,049 2,719 1,221 6,602
2013 2,474 2,238 688 6,121
2014 2,654 2,312 687 6,669
2015 1,283 2,989 631 7,081
Figure 4. Total number of landing of Indonesian tuna longline vessels based in Benoa port during
2011-2015
Aside of daily monitoring on tuna landing activity in industrial scale, Research Institute of Tuna
Fisheries (RITF) also conducting in small-scale fisheries since 2013. The sampling coverage was
intended up to minimum 30% for each month (Table 4).
Table 4. Annual catch and by gear and primary species of tuna (BET, SKJ, YFT) from small-
scale ports in Indonesia from 2013-2015.
Location Gear 2013 2014 2015
Obs. Prod.
(kg)
Obs. Landing
(kg)
Obs. Prod.
(kg)
Obs. Landing
(kg)
Obs. Prod.
(kg)
Obs. Landing
(kg)
Labuhan Lombok Hand line 138,001 153 198,480 129 95,925 73
Pacitan Hand line 565,121 716 637,281 763 564,675 564
Pacitan Purse Seine 396,282 186 1,233,200 335 1,851,560 309
Sibolga Purse Seine 11,170,700 884 9,116,880 682 9,505,372 903
921
775 753
858
699
500
750
1,000
1,250
1,500
2010 2011 2012 2013 2014 2015 2016
Num
ber
of
Fis
hin
g V
esse
ls (
n)
Year of Sampling (n)

IOTC–2016–SC19–NR10
Page 12 of 26
3.2. Catch and Effort Data from Scientific Observer Program Scientific observer program in Benoa Bali was initially a collaboration program between
Indonesia’s Ministry of Marine Affairs through Center of fisheries Research and Development and
CSIRO Marine and Atmospheric Research (Australia), in 2005. Later, in 2011 a new research
institution namely Research Institute for Tuna Fisheries (RITF) with full funded by Indonesian
government is established that basically conduct continuation of port sampling and scientific
observer program for tuna fisheries in the Indian Ocean. Some data were collected by RITF scientific
observer including catch, composition by species, fishing ground, number of setting, number of
hooks etc. Following will be presented the calculated hook rate of tuna long liner recorded by
observer at fishing vessels during 2011-2015. Monthly average hook rate showed that higher hook
rate for SBF appeared in November and March, as for the other tuna it can be found during June to
September. Hook rate of tuna longline for yellowfin tuna and albacore tuna were lower compared to
two previous years and continuing the negative trend. As for bigeye, the hook rate was much lower
than previous year after showing a positive trend from 2011-2014.
Figure 5a. Fluctuation of monthly nominal hook rate (fish/1,000 hooks) for tuna (ALB, BET and
YFT) based on RITF scientific observer data in the Indian Ocean (2011- 2015).
4. RECREATIONAL FISHERIES
There is no official reported catch from Indonesia recreational fishing. An organization deal with
sport fishing has been established since 1997, namely “FORMASI” (Indonesia Fishing Sport
Federation) where this organization is a member of International game fish association (IGFA),
Currently, no update of FORMASI activities. Indonesia government is focusing on assessing and
managing commercial fishing, and would including recreational fishing in the near future.
5. ECOSYSTEM AND BYCATCH ISSUES
5.1 Sharks
Recent progress related to the management of shark in Indonesia after establishment of National
Plan of Action of the Shark (NPOA-Shark) on 10th October 2010 is the issuance of ministerial
decree no 12, 2012, chapter X which regulates a management and conservation of bycatch and
ecological related species on tuna fisheries. Several activities to raise the fishers’ awareness on the
important of sharks resource sustainability are through workshops, seminars and producing and
distribute posters which prohibit several keys species of sharks to catch. In the framework of
fisheries management of sharks and rays in Indonesia, the government through the minister of marine
0
1
2
3
4
5
6
7
3 4 5 6 7 8 9 101112 1 2 3 4 5 6 7 8 9 101112 1 2 3 4 5 6 7 8 9 101112 1 2 3 4 5 6 7 8 9 101112 1 2 3 4 5 6 7 8 9 101112
2012 2013 2014 2015
Ho
ok
rate
(fi
sh/1
,00
0 h
oo
ks)
Year
ALB
BET
YFT

IOTC–2016–SC19–NR10
Page 13 of 26
and fisheries has issued a ministerial regulation of marine and relevant fisheries management and use
of sharks and rays in Indonesia, the latest regulations contained in the Minister of Marine and
Fisheries No. 34/PERMEN-KP/2015 on the amendment of the Minister of Marine Affairs and
Fisheries No. 59/PERMEN-KP/2014 concerning prohibition on the issuance of Oceanic white tip
sharks (Carcharhinus longimanus) and hammerhead sharks (Sphyrna spp.) from the territory of
Republic of Indonesia out of Indonesian territory. Indonesia also established National Plan of Action
(NPOA) for sharks and rays 2015-2019.
Blue shark (Prionace glauca) is one of the dominant catch and most important bycatch shark
species for Indonesian tuna longline fishery in the Indian Ocean. During the the 12th
Session of the
IOTC Working Party on Ecosystems and Bycatch, held in Victoria, Seychelles for the first time
Indonesia produced a standardized CPUE of blue shark, a collaboration work between Indonesian
scientist and Portuguese Institute for the Ocean and Atmosphere (IPMA, I.P.). The working group
acknowledge the work and encourage to continue delivering the result with another variable and
further explore standardizing the CPUE in biomass as well as numbers as a comparison. The working
group acknowledge also to the work quantify shark bycatch from the gillnet fisheries and encourage
to continue monitoring drift gillnet fisheries with increasing number of scientific observer onboard
trip.
RITF also provides scientific observer data for blue shark in high resolution (1x1 degree based)
from 2005-2015 in response to the inquiry from Working Party of Ecosystem and By-catch (WPEB)
through IOTC Secretariat to conduct analysis regarding the CPUE trends of blue sharks. The data
also used for estimating total blue shark catch in the eastern Indian Ocean.
Blue shark and crocodile shark (Pseudocarcharias kamoharai) dominated the incidental catch
for sharks during 2011-2015. Most of the blue sharks were retained while crocodile sharks usually
discarded dead (Table 5.).
Table 5. Total number of sharks, by species, released/discarded by the Indonesian tuna longline
fleet in the IOTC area of competence (2011–2015).
5.2 Seabirds
RITF Scientific observer program also include seabirds on their data record and since 2005 to
2015, involved in total 2558 settings. There were 31 reports of incidental interaction with seagull, 3
white albatrosses and 22 black albatrosses, most of seabirds’ interaction occurred in temperate waters
(high latitude). In 2015, although there was no observer trip followed frozen tuna fleets which
operated at 15 – 35o
S, there were 8 black albatrosses was recorded (Table 6). Indonesia, through
Ministry of Marine Affairs and Fisheries has released Ministerial Decree (PERMEN KP) No.
12/2012 related to mitigation for ecologically related species mitigation, including seabirds which
stated that installment of tori line is obligatory for every vessel operated beyond 25 oS (high seas).
Indonesia also currently in a stage of arranging national plan of action for seabird mitigation.
Live dead Live dead Live dead Live dead Live dead
PTH Alopiaspelagicus 0 3 3 1 1
BTH Alopiassuperciliosus 0 2 2 1 1 1 1
CCB Carcharhinusbrevipinna 0 1 1 4 4 17 17 1 1
FAL Carcharhinusfalciformis 0 0 0 26 26
OCS carcharhinuslongimanus 0 0 2 2 9 8 1 4 4
CCL Carcharhinuslimbatus 0 0 0 1 1
SMA Isurusoxyrinchus 0 11 2 9 3 3 2 2 1 1
LMA Isuruspaucus 0 1 1 0 2 2
BSH Prionaceglauca 2 2 381 132 249 39 38 1 67 62 5 137 137
PSK Pseudocarchariaskamoharai 63 0 22 41 157 157 51 51 91 91 108 108
SPL sphyrnalewini 1 1 2 2 1 1 1 1
TIG Galeocerdocuvier 0 0 1 1
SPY Sphyrnidae 0 0 2 2 0
THR Threshersharksnei 1 1 2 2 1 1 2 2 6 6
SHK Sharknei 0 1 1 0
Total 67 563 104 191 285
DiscardCODE Species
RetainedN
Discard
2015
N Retained
Discard
2011 2012 2013 2014
N Retained
Discard
N Retained
Discard
N Retained

IOTC–2016–SC19–NR10
Page 14 of 26
Table 6. The number of observed incidental interaction with seabirds in tuna longline fishery from
2011-2015 (Source: RITF scientific observer data)
Code Species 2011 2012 2013 2014 2015
B1 Seagull 0 0 0 1 0
B2 White albatross 0 0 0 0 0
B3 Black albatross 0 9 0 0 7
5.3 Marine Turtles
The record results during 2011 - 2015 conducted by independent scientific observer on board on
tuna longline in the Indian Ocean with 881 times number of setting and over 1 million hooks
deployed. There were 28 interactions with marine turtles, which dominated by olive ridley turtles
(25), leatherback turtles (1) and unidentified turtles (2) (Table 7). WWF reported that during onboard
observer report from 2006-2014, the highest likelihood of accidental catch of marine turtle was olive
ridley turtle (LKV), while the other, like leatherback turtle (DKK), hawksbill turtle (TTH), green
turtle (TUG) and flatback turtle (FBT) were not too significant.
The olive ridley turtle, loggerhead and leatherback turtles are in a vulnerable status. While green
turtles are in a state endangered and even hawksbill in a state extremely endangered. Policy
management of turtles in tuna longline fishery needs to be taken in order to be implemented include
the socialization of the use of intensified circle hooks and if necessary the government issued
regulations regarding the use of circle hooks, the implementation of the placement of fishing
monitoring (observer) aboard the tuna longline in order to assist the skippers in monitoring the catch
of turtles and turtle handling training for the skippers and crew how to handle the turtles on board in
order to reduce the their mortality and could be released back into the sea alive (WWF, 2014). Areas
of critical habitats, such as migratory corridors, nesting beaches, and Inter-nesting and feeding areas
were identified. Map that shows migration corridors, nesting beaches, and critical habitats for marine
turtle in Indonesia are produced and available online http://kkji.kp3k.kkp.go.id/sig. Indonesia also
established National Plan of Action for marine turtles 2016-2020 through Directorate of
Conservation of Marine Biodiversity (KKHL), Ministry of Marine Affairs and Fisheries (MMAF).
Figure 6. The nominal hook rate of various recorded catch of marine turtle associated with tuna
longline fishery from 2006-2014 (Source: WWF Observer Data; Zainudin et al., 2014)
0
0.002
0.004
0.006
0.008
0.01
0.012
0.014
LKV TUG TTH TTL DKK FBT
Ho
ok
ra
te (
ind
/1,0
00
ho
ok
s)
Species

IOTC–2016–SC19–NR10
Page 15 of 26
Table 7. The number of observed incidental interaction with marine turtles in tuna longline fishery
from 2011-2015 (Source: RITF scientific observer data)
Code Species 2011 2012 2013 2014 2015
DKK Leatherback turtle 1 0 0 0 0
LKV Olive ridley turtle 1 5 6 12 1
TRT Turtle 0 2 0 0 0
TTH Hawksbill turtle 0 0 0 0 0
TTX Marine turtles nei 0 0 0 0 0
TUG Green turtle 0 0 0 0 0
5.4 Billfishes
Billfishes catch contributed up to 5.15% to total catch of tuna longline during 10 years of
observation (2011-2015). There were 6 species of billfishes caught by Indonesian tuna longline
fleets. Swordfish has the higher nominal CPUE, range from 0.133-0.553, followed by black marlin
(0.066-0.317) and blue marlin (0.007-0.287) and sailfish, striped marlin and shortbill spearfish were
not contribute significantly. The high catch occurred in November 2015 where swordfish and black
marlin reached their peak (22 and 5, respectively) (Figure 6). During the IOTC 14th
Working Party
on Billfish, held in Victoria, Seychelles for the first time Indonesia produced a standardized CPUE of
black marlin, a collaboration work between Indonesian scientist and IOTC invited expert, Dr.
Humber A. Andrade from Brazil. The working group acknowledge the work and encourage to
continue delivering the result with other species and in the upcoming years. The standardized CPUE
was submitted to the IOTC secretariat and was considered into the analysis for stock assessment.
Figure 7. The nominal CPUE of known billfish species caught by Indonesian tuna longline
fisheries from 2005-2015.
5.5. Neritic Tuna Research Institute for Tuna Fisheries informed about the length distribution and reproductive
aspects from two neritic tunas, namely: bullet tuna (Auxis rochei) and frigate tuna (Auxis thazard).
WPNT appreciated the paper and noticed that the size of first length maturity for bullet tuna based on
this research was smaller than the one which was noticed by IOTC before whereas the frigate was
still within the expected range. The study of Auxis spp regarding the fish distribution and
reproduction aspect were carried out based on the data landed catch by purse seiner and lift netter.
The size range of A. rochei and A. thazard were 15-39 cmFL and 19-65 cmFL. A. thazard has a
bigger first length maturity (34.89 cmFL) than A. rochei (27.16 cmFL). The fecundity of A. thazard
0.0
0.5
1.0
1.5
2.0
2.5
1 2 3 4 5 6 7 8 9 101112 1 2 3 4 5 6 7 8 9 101112 1 2 3 4 5 6 7 8 9 1012 1 2 3 4 5 6 7 8 9 101112 1 2 3 4 5 6 7 8 9 101112
2011 2012 2013 2014 2015
Ho
ok r
ate
(fis
h/1
,00
0 h
oo
ks)
Year
SWO
BLM
BUM
SFA
MLS

IOTC–2016–SC19–NR10
Page 16 of 26
was 27,534-720,800 eggs and A. rochei was 24,727-220,000 eggs. Both A. thazard and A. rochei
were partial spawner.
According to the lack of information about reproductive biology of neritic tunas, WPNT was
encouraged to extend the size range of samples and provide an estimate of maturity stage. IOTC also
requested that the result of "Research of Structure and Characteristic of Purse Seine Fisheries in
Indian Ocean", which was on 2016 budget will be presented in WPNT 2017 once the study is
complete.
5.6. Other ecologically related species (e.g. marine mammals, whale sharks)
Pomfret, sickle pomfret, escolar and lancet fish were the most common species caught during
longline operations from 2011-2015. No marine mammals or whale sharks recorded during that
periods (Table 8).
Tabel 8. The number of observed catch of others ecologically related species in longline fisheries
from 2011-2015 (source: RITF scientific observer data).
Code Species 2011 2012 2013 2014 2015
BAR Baracuda 2 11 0 4 5
BWL Pomfret 31 1 194 232 121
CDF Common dolphinfish 18 25 11 15 7
DOL Dolphin 1 0 0 0 0
EIL Brilliant pomfret 2 16 5 0 0
HAR Long nose chimaeras 22 80 22 3 14
LEC Escolar 4 1387 284 666 490
MON Moon fish 51 971 51 29 30
MOX Ocean Sunfish 2 9 11 3 2
NGA Lancet Fish 1184 1156 1738 921 739
OHR Other Hair tail fish 0 0 1 0 0
OIL Oilfish 135 65 7 58 16
TCR Pomfret 24 60 91 90 45
TRF Tapper tail ribbon
fish
2 35 3 1 0
TST Sickle pomfret 19 87 60 110 29
WAH Wahoo 26 41 60 96 63
6. NATIONAL DATA COLLECTION AND PROCESSING SYSTEMS
6.1. Logsheet data collection and verification Template of Indonesia fishing logbook was developed under the collaboration with IOTC,
WCPFC, CCSBT and OFCF Japan. There are three (3) types of logbook template such as
longline/handline; purse-seine/pole and line and other gear. For implementation of this logbook
program, Ministry of Marine Affairs and Fisheries has released Regulation Number 18 Year 2010 of
5 October 2010. It is stipulated that logbook report has to be submitted to port authority prior to
catch landing and mandatory to vessels above 5 GT. Up to December 2015, for three FMA’s (571-
573), there were discrepancy of logbook number for each of it. During 2015, total number of vessel
which filling logbook for FMA 571, 572 and 573 were 58, 1,202 and 1,031 respectively. Catch and
effort data have been collected through Logbook and national observer program. Issues on data entry
and validity as well as the need for verification and validation prior analysis is remained. For
effective implementation of this program, it is necessary to continuing introducing this program and
strengthen capacity both to fishers and port officers. The result indicated:

IOTC–2016–SC19–NR10
Page 17 of 26
Table 9. The number of vessel submitted logbook (source: DGCF).
No FMA 2011 2012 2013 2014 2015
1 571 0 18 92 53 58
2 572 0 83 315 720 1,202
3 573 0 463 1,600 1,210 1,031
Total 0 564 2,007 1,983 2,291
6.2. Vessel Monitoring System
Vessel Monitoring System (VMS) for fishing vessels has been started to be implemented in
Indonesia since 2003, Currently, trough Ministerial Regulation No. 42/2015 about fisheries vessel
monitoring system, all fishing vessel above 30 GT or operating in high seas are mandatory to be
equipped with VMS transmitter. Without VMS transmitter on board, the fishing vessel will not get
permission to leave the fishing port for their fishing operations, Fishing monitoring center (FMC) for
Indonesia’s VMS is base in Jakarta, In order to fight against illegal, unreported and unregulated
(IUU) Fishing, Indonesia has started to implement Database Sharing Systems for Fisheries
Management, The system is developed to integrate a number of databases, including the licensing,
logbook and VMS databases, The Launching of the system application has recently been made by
the Minister of Marine and Fisheries on 19 November 2013 in Jakarta that will be applied to 45
fishing ports of Indonesia, fisheries Information and services for Indonesia VMS is provided and
could be accessed at http://dkpvms,dkp,go,id. Figure 8 showed the spatial distribution of Indonesia
fleets based on VMS information.

IOTC–2016–SC19–NR10
Page 18 of 26
Figure 8. Map of spatial distribution of longline sets by 5-degree blocks, aggregated from 2011 to
2015 based on VMS data (Source: PSDKP).
6.3. Regional Observer Program
Indonesia fishing vessels have joined Regional Observer Program for Transshipment at Sea
since 2009 under resolution IOTC No, 08/02, which has been superseded by Resolution 11/05 and
Resolution 12/05 concerning on establishing a program for transshipment by large-scale fishing
vessels stated that “Each CPC shall ensure that all carrier vessels transshipping at sea have on
board an IOTC observer”. Scientific observer program in Benoa Bali was initially a collaboration
program between Indonesia’s Ministry of Marine Affairs through research center for capture
fisheries and CSIRO Marine and Atmospheric Research (Australia), in 2005 (see sadiyah et al 2011),
Later, in 2011 a new research institution namely Research Institute for Tuna Fisheries (RITF) with
full funded by Indonesian government is established that basically conduct continuation of port
sampling and scientific observer program for tuna fisheries in the Indian Ocean. The number of
scientific observer involved until 2014 was 15 observers. In 2013 and 2015 the observer was also
2011
2015
2014 2013
2012

IOTC–2016–SC19–NR10
Page 19 of 26
including small scale purse seine, gillnet and troll line/hand line to be observed onboard (Table 10a-
d). Recently ministerial regulation of MMAF No. 01/2013 formally regulates an observer onboard
for fishing and carrier vessel, a positive progress to secure government budget for observer program
in the future.
Table 10a. Activity summary of RITF’s scientific observers from 2011-2015 (gear= longline).
Year No. Of
Obs
No. Of
Trips
No. Of
Company
Total Day
at Sea
Days/Trip Avg
(d/trip)
2011 5 6 3 210 30 - 50 40
2012 6 7 5 496 33208 83
2013 5 3 3 170 52 - 60 57
2014 8 6 4 371 29-90 62
2015 4 5 5 241 31-61 48
Table 10b. Activity summary of RITF’s scientific observers from 2011-2015 (gear= purse seine).
Year No. Of
Obs
No. Of
Trips
No. Of
Company
Total Day
at Sea Days/Trip
Avg
(d/trip)
2011 - - - - - -
2012 - - - - - -
2013 1 2 2 21 9-12 10.5
2014 2 1 1 2 1-2 1.5
2015 2 1 1 10 8-15 10.5
Table 10c. Activity summary of RITF’s scientific observers from 2011-2015 (gear= hand line).
Year No. Of
Obs
No. Of
Trips
No. Of
Company
Total Day
at Sea Days/Trip
Avg
(d/trip)
2011 - - - - - -
2012 - - - - - -
2013 1 2 2 19 9-10 9.5
2014 10 70 10 70 1 1
2015 - - - - - -
Table 10d. Activity summary of RITF’s scientific observers from 2011-2015 (gear= gillnet).
Year No. Of
Obs
No. Of
Trips
No. Of
Company
Total Day
at Sea Days/Trip
Avg
(d/trip)
2011 - - - - - -
2012 - - - - - -
2013 - - - - - -
2014 - - - - - -
2015 6 3 3 41 12-15 13

IOTC–2016–SC19–NR10
Page 20 of 26
Figure 9a. Spatial distribution of the observed sets (gear=longline) from 2011 to 2015 (source: RITF
Observer Program data)

IOTC–2016–SC19–NR10
Page 21 of 26
Figure 9b. Spatial distribution of the observed sets (gear=hand line) from 2013 to 2014 (source:
RITF Observer Program data)
Figure 9c. Spatial distribution of the observed sets (gear=purse seine) from 2013 to 2015 (source:
RITF Observer Program data)

IOTC–2016–SC19–NR10
Page 22 of 26
Figure 9d. Spatial distribution of the observed sets (gear=gillnet) from 2011 to 2015 (source: RITF
Observer Program data)
The observed longline sets from 2005 to 2015 covered the Eastern Indian Ocean between
latitudes 0° and 34°S and longitudes 75° and 135°E (Figure 7). The observed sets mostly occurred
within the area between 10° - 20°S and 105° - 120°E. The furthest distance of these sets occurred in
2006, 2007 and 2012. Smaller area was covered by the observed longline sets in 2011. The observed
sets in 2005 and between 2009 - 2011 have never extended to south of 20°S. National observer
program also conducted by DGCF and has recruited and trained at least 150 observer candidates in
2014. The data collected and acquired by the DGCF observers are remaining unverified and
invalidated.
6.4. Port sampling program Port sampling program at three major Indonesian ports, Nizam Zahman Jakarta fishing port,
Benoa-Bali fishing port and Cilacap fishing port central of Java was initially commenced in the mid
2002. This was a collaborative research program between Indonesia’s Research Centre for Capture
Fisheries/Research Institute for Marine Fisheries (RCCF/RIMF) and Directorate General for Capture
Fisheries (DGCF), CSIRO Marine and Atmospheric Research, Australia’s Department of Agriculture
of Fisheries and Forestry (DAFF), Australian Centre for International Agricultural Research
(ACIAR), Indian Ocean Tuna Commission (IOTC) and Overseas Fisheries Cooperation Foundation
of Japan (OFCF) (see Sadiyah et al., 2011). The aim of this port sampling program was to monitor
the catches of all tuna species landed, and also to record the number of landings by Benoa-based
longline vessel (Proctor et al,, 2006). Port sampling program at two sampling sites (Nizam Zahman
and Cilacap fishing ports) have been undertook by DGCF since 2007, and Benoa sampling port also
covered by DGCF since 2010, In February 2010, the RIMF commenced to undertake the sampling,
collecting and monitoring activities (Noegroho et al,, 2013). RITF continue tuna catch monitoring
program at Benoa Fishing Port with a minimum 30% coverage of landings at each processing plants
a target coverage, as reported in previous year the coverage of port sampling in 2010-2015 was
above 50%, continuing in 2015 the monthly monitoring of ports sampling was range from 45 – 72%
coverage (Table 11).

IOTC–2016–SC19–NR10
Page 23 of 26
Table 11a. Number of individuals measured, by species and gear from daily tuna and tuna-like
species monitoring based in Benoa Port 2011-2015.
Code Species No. of fish measured
2011 2012 2013 2014 2015
ALB Albacore 7,276 5,179 5,049 27,740 21,648
BET Bigeye tuna 25,361 42,322 29,504 40,431 45,039
YFT Yellowfin tuna 28,253 34,010 32,253 41,720 17,909
BUM Blue marlin 850 1,011 726 716 780
BLM Black marlin 529 575 318 342 120
MLS Striped marlin 186 260 193 108 115
SSP Shortbill spearfish 78 218 113 68 192
SFA Indo-Pacific sailfish 307 462 262 383 546
SWO Swordfish 1,968 4,790 3,049 4,177 4,336
LEC Escolar 3,927 21,524 1,990 13,705 9,567
OIL Oilfish 391 441 240 1,120 1,842
WAH Wahoo 895 1,941 402 1,776 1,102
CDF Common dolphinfish 350 351 86 221 359
BSH Blue shark 981 2,151 87 2,058 4,732
MSO Shortfin mako shark 172 112 21 83 124
OCS Oceanic whitetip shark 94 194 69 99 153
TSS Bigeye thresher shark 54 14 3 2 32
MON Moonfish 100 3,359 724 6,795 9,709
BAR Barracuda 60 61 14 19 15
Table 11b. Coverage percentage of daily tuna and tuna-like species monitoring program based
in Benoa port 2011-2015.
Year No. Landed Vessel No. Sampled Vessel Sampling Coverage
2011 921 372 40.39%
2012 775 452 58.32%
2013 753 431 57.24%
2014 858 521 60.72%
2015 699 477 68.24%
6.4. Unloading/Transhipment
Since the implementation of Ministerial Decree No. 57/PERMEN/2014 concerning the banning
of any transhipment at sea. DGCF reported that no Indonesian flagged vessel involved in
transhipment activity in 2015.

IOTC–2016–SC19–NR10
Page 24 of 26
7. NATIONAL RESEARCH PROGRAMS
(1) Project title: Catch monitoring and biological observation for tuna species caught by small
scale fisheries in West Sumatera, Project Duration: 2014-2016
(2) Project title: Developing capacity for management of Indonesia’s pelagic fisheries resources,
Planned Project Duration: 2012-2016.
Objectives: To improve Indonesia’s capacity to assess and manage its tuna fisheries to improve
Indonesia’s pelagic fisheries research capacity. The project also addresses population structure
of Bigeye tuna and yellowfin tuna through genetic and parasites analysis.
Implementing Unit: Centre for Fisheries Research and Development (CFRD) (previously
known as RCFMC) –collaboration with ACIAR.
(3) Project title: Preliminary study of climate change impact on tuna fisheries (need collaboration
in a regional scale)
Recent progress: Field trip and survey to collect samples have been performed and still
continuing.
8. IMPLEMENTATION OF SCIENTIFIC COMMITTEE RECOMMENDATIONS AND RESOLUTIONS OF THE
IOTC RELEVANT TO THE SC.
Indonesia participates in several IOTC SC working parties. Scientific observer and port sampling
program are continued to monitor catch and effort of tuna and other ecologically related species in
order to implement scientific Committee Recommendation.

IOTC–2016–SC19–NR10
Page 25 of 26
Table 12. Scientific requirements contained in Resolutions of the Commission, adopted between
2005 and 2011.
9. L
I
T
E
R
A
T
U
R
E
C
I
T
E
D
D
G
C
F
,
2
0
1
1
.
S
t
a
t
i
s
t
i
c
s
o
f
M
arine Capture Fisheries by Fisheries Management Area, 2005-2011.
DGCF, 2012. Statistics of Marine Capture Fisheries by Fisheries Management Area, 2005-2012.
Res. No. Resolution Scientific requirement CPC progress
15/01 On the recording of catch and effort
by fishing vessels in the IOTC area
of competence
Paragraphs 1–10 Catch and effort data are recorded based on:
- Ministerial Decree No. 48/PERMENKP/2014
on logbook
- Ministerial Decree No. 1/PERMENKP/2013
on observer on board
- Implementation of scientific observer on board
15/02 Mandatory statistical reporting
requirements for IOTC Contracting
Parties and Cooperating Non-
Contracting Parties (CPCs)
Paragraphs 1–7 - Nominal catch data has been submitted
- Logbook program started
- Tuna size data of longline-fleet have been
submitted
15/05 On conservation measures for striped
marlin, black marlin and blue marlin
Paragraph 4
13/04 On the conservation of cetaceans Paragraphs 7– 9 - Indonesia has been implementing Resolution
13/04 through Government Regulation No
7/1999.
- Ministerial Regulation number
12/PERMENKP/2012 regarding captured
fisheries fishing bussiness on high-seas
13/05 On the conservation of whale sharks
(Rhincodon typus)
Paragraphs 7– 9 Indonesia has issued Ministerial Decree number
18/KEPMENKP /2013 regarding conservation
of whale shark in Indonesian water
13/06 On a scientific and management
framework on the conservation of
shark species caught in association
with IOTC managed fisheries
Paragraph 5–6 Indonesia has developed national plan of action
(NPOA) Shark on 10 October 2010 as well as
ministerial decree no 12-2012 chapter X which
regulate a management and conservation of by-
catch and ecological related tuna involved in
tuna fisheries.
12/09 On the conservation of thresher
sharks (family alopiidae) caught in
association with fisheries in the
IOTC area of competence
Paragraphs 4–8 Indonesia has been implementing Ministerial
Regulation number 12/PERMENKP/2012
regarding capture fisheries fishing business on
high-seas
12/06 On reducing the incidental bycatch
of seabirds in longline fisheries.
Paragraphs 3–7 Indonesia has been implementing Ministerial
Regulation number 12/PERMENKP/2012
regarding captured fisheries fishing business on
high-seas
12/04 On the conservation of marine turtles Paragraphs 3, 4, 6–10 Indonesia has been implementing Ministerial
Regulation number 12/PERMENKP/2012
regarding captured fisheries fishing business on
high-seas
11/04 On a regional observer scheme Paragraph 9 Indonesia has been implementing Ministerial
Regulation number 1/PERMENKP/2013
regarding observer onboard
05/05 Concerning the conservation of
sharks caught in association with
fisheries managed by IOTC
Paragraphs 1–12 - Indonesia has been implementing Ministerial
Regulation number 12/PERMENKP/2012
regarding capture fisheries fishing business on
high-seas
- NPOA shark and ray
16/06 On measures applicable in case of
non-fulfilment of reporting
obligations in the IOTC
Paragraph 1

IOTC–2016–SC19–NR10
Page 26 of 26
DGCF, 2013. Statistics of Marine Capture Fisheries by Fisheries Management Area, 2005-2013.
DGCF, 2014. Statistics of Marine Capture Fisheries by Fisheries Management Area, 2005-2014.
DGCF, 2015. Statistics of Marine Capture Fisheries by Fisheries Management Area, 2005-2015.
Irianto. H.E, Wudianto, B. Nugraha, A.A. Widodo, F. Satria, L. Sadiyah. 2015. INDONESIA
National Report to the Scientific Committee of the Indian Ocean Tuna Commission, 2015.
Irianto. H.E, Wudianto, A. Suman, K. Susanto, B. Nugraha, F. Satria, S.D. Retnowati. 2014.
INDONESIA National Report to the Scientific Committee of the Indian Ocean Tuna
Commission, 2014.
Novianto. D, A.F. Nugroho, R.R. Zedta. 2016. Composition and Abundance of Pelagic Shark Caught
by Drift Gillnet in Cilacap Oceanic Fishing Port, Indonesia. IOTC-2016-WPEB12-17.
Novianto. D, B. Setyaji, R. Coelho. 2016. Preliminary Standardized CPUE of Blue Shark in the
Indonesian Tuna Longline Fishery estimated from Scientific Observer Data, for the period
2005-2014. IOTC-2016-WPEB12-19.
Nugroho, D., Nugraha, B. and I. Jatmiko 2015. Indonesia National Report to the Scientific
Committee CCSBT 2015.
Rochman. F, D. Novianto, A. Bachtiar. 2016. The Potential Fishing Ground and Spatial Distribution
Pattern of Albacore (Thunnus alalunga) in Eastern Indian Ocean. IOTC-2016-WPTmT06-
12.
Satria. F, Mahiswara, A.A. Widodo, L. Sadiyah. S. Tampubolon. 2011. INDONESIA National
Report to the Scientific Committee of the Indian Ocean Tuna Commission, 2011.
Satria. F, A. Suman, A. Widodo, L. Sadiyah, B. Nugraha. 2012. INDONESIA National Report to the
Scientific Committee of the Indian Ocean Tuna Commission, 2012.
Satria. F, H.E. Irianto, B. Nugraha, L. Sadiyah. 2013. INDONESIA National Report to the Scientific
Committee of the Indian Ocean Tuna Commission, 2013.
Setyadji. B, H.A. Andrade. 2016. Standardization of Catch per Unit Effort (CPUE) of Black Marlin
(Makaira Indica) Caught by Indonesian Tuna Longline Fishery in the Eastern Indian Ocean.
IOTC-2016-WPB14-20.
Tampubolon, P.A.R.P, D. Novianto, R. Kurniawan, B. Setyadji, B. Nugraha. 2016. Size Distribution
and Reproductive Aspect of Auxis spp from West Coast Sumatera, Eastern Indian Ocean.
IOTC-2016-WPNT06-19.
Zainudin, I.M. 2016. Bycatch biota laut dilindungi dan terancam punah pada perikanan rawai tuna di
indonesia dan opsi mitigasinya (in Bahasa). Disertasi. Universitas Indonesia. 121 pp.


![IKATAN ILMUWAN INDONESIA INTERNASIONAL · [31-01-2016] Tips Mengikuti Konferensi Scientific: Pengumpulan Manuskrip, Funding, dan Presentasi. [12-03-2016] Indonesia Muda Bangkit. Kuliah](https://img.pdfslide.us/doc/110x75/5c7a9d9209d3f2f93e8c4d74/ikatan-ilmuwan-indonesia-internasional-31-01-2016-tips-mengikuti-konferensi.jpg)


![Indian Scientific Tradition [Medieval and Modern] [SLIDE ...eacharya.inflibnet.ac.in/data-server/eacharya... · Indian Scientific Tradition [Medieval and Modern] -Preeti Awasthi [SLIDE](https://img.pdfslide.us/doc/110x75/5e8426a52ee550698b04a347/indian-scientific-tradition-medieval-and-modern-slide-indian-scientific-tradition.jpg)