Embed Size (px)
Citation preview

INDONESIA:CURRENT ENERGY SITUATION
and IT’s 2050 VISION

CURRENT CONDITIONSAt present, energy conditions in Indonesia are as follows:• There are great potential energy sources • Society's access to energy is still limited • Oil fuel consumption is 63% of total energy consumption• Gas and coal prices are higher on the export market than on
the domestic market, Domestic consumers have low purchasing power.
• The energy industry is not optimal – Limited energy infrastructure (Appendixes G1 s/d G4,
pages 33-36)– Energy prices (such as for fuel, gas for fertilizer factories
and new/ renewable energies) that are not commensurate with their economic value (Appendix H, page 40)
– Inefficient energy utilization (Appendix I, page 41)

EXPECTED CONDITIONS
• Rational Energy prices• Society’s access to energy• Better economic conditions will increase
society’s purchasing power• Security of energy supply (Balanced
Energy Mix)

Listrik11%
BBM42%
LPG1%
Gas Kota19%
Batubara27%
Listrik0%
BBM100%
LPG0% Gas Kota
0%
Batubara0%
Industri41%
Rumah Tangga dan Komersial
24%
Transportasi35%
FINAL ENERGY CONSUMPTION 2005
Listrik12%
BBM67%
LPG2% Gas Kota
8%
Batubara11%
Listrik31%
BBM63%
LPG6%
Gas Kota0%
Batubara0%
Household&Comercial
Transport
Industry
26 Juta KL
12 Juta KL
By Fuel Type
by Sector
100 TWh
54 Juta KL
500 BSCF
13 Juta Ton
1,1 Juta Ton

Trend of Indonesia Primary Energy Mix
0%
20%
40%
60%
80%
100%
1990 1991 1992 1990 1991 1992 1993 1994 1995 1996 1997 1998 1999 2000 2001 2002 2003 2004 2005
Pers
en
PLTA Biofuel Batubara EBT Lainnya Gas Bumi Minyak Bumi Panas Bumi
Oil
Geothermal
Natural Gas
Coal
Hydropower
Renewable

CO2 Emission from Energy Utilization
0
50
100
150
200
250
300
1990
1991
1992
1993
1994
1995
1996
1997
1998
1999
2000
2001
2002
2003
2004
Mill
ion
Ton
Other SectorTransportHouseholdIndustryPowerPlant

2005 CO2 Emission by Sources
PowerPlant26%
Industry37%
Household10%
Other Sector4%
Transport23%

NATIONAL ENERGY POTENTIALS 2004
147130 million barrels
19.3 billion tons57 billion tonsCoal
613.0 TSCF182 TSCF384.7 TSCFGas
18500 million barrels
9 billion barrels86.9 billion barrels
Oil
CAD/PROD RATIO(without
exploration)Years
PRODUCTION(per annum)
RESERVES(Proven + Possible)RESOURCES
TYPES OF FOSSIL-BASED ENERGY
24.112 Tons* e.q. 3 GW for 11
yearsUranium (Nuclear)
8.00 MW4.80 kWh/m2/ daySolar energy
302.40 MW49.81 GWBiomass
4,200.00 MW6,851.00 GWh75.67 GW845.00 million BOE
Hydroelectric power
800.00 MW2,593.50 GWh27.00 GW219.00 million BOE
Geothermal power
84.00 MW458.75 MW458.75 MWMini/Micro hydro
INSTALLED CAPACITYUSAGE EQUAL TORESOURCESNON-FOSSIL
ENERGY
0.50 MW9.29 GWWind power
* Only in the Kalan region – West Kalimantan

Grissik Palembang
Semarang
RESERVES AND NETWORKS OF GAS PIPELINES
Pacific Ocean
AUSTRALIA
Indian Ocean
Bangkok
Phnom Penh
Ban Mabtapud
Ho Chi Minh City
CAMBODIA
VIETNAM
THAILAND LAOS
Khanon
Songkhla
Erawan
Bangkot
LawitJerneh
WESTMALAYSIA
Penang
Kerteh
Kuala Lumpur
Manila
Philipines
South
China
SeaS
inga
pore
G
as
Trun
klin
e
NatunaAlpha
Kota KinibaluBRUNEI
Bandara Seri Begawan
BintuluEAST
MALAYSIA
Kuching
Banda Aceh
Lhokseumawe
Medan
Duri
Padang
S U M A T R A Jambi
BintanSINGAPORE
Samarinda
Balikpapan
Bontang LNG Plant& Export Terminal Attaka
TunuBekapai
KALIMANTAN
Banjarmasin
Manado
SULAWESI
UjungPandang
BURU SERAM
Ternate HALMAHERA
Sorong
IRIAN JAYA
JakartaJ A V A Surabaya
Bangkalan
BALI SUMBAWA
Pagerungan
LOMBOK
Cirebon
FLORES
SUMBATIMOR
I N D O N E S I A
DuyongWest Natuna
Port Dickson
Port Klang
Mogpu
Dumai
Batam
Guntong
51,627
3,756
0,720
11,516
5,855
5,529
34,021
3,894
18,520
GAS RESERVE 2P (BSCF)
TOTAL RESERVES2P : 142.462 BSCF0,11
3,00Massela
ArdjunaFields
MADURA3,854
Existing Pipeline
Planned Pipeline
Jayapura
Merauke

Grissik Palembang
Semarang
Pacific Ocean
AUSTRALIA
Indian Ocean
Bangkok
Phnom Penh
Ban Mabtapud
Ho Chi Minh City
CAMBODIA
VIETNAM
THAILAND LAOS
Khanon
Songkhla
Erawan
Bangkot
LawitJerneh
WESTMALAYSIA
Penang
Kerteh
Kuala Lumpur
Manila
Philipines
South
China
Sea
NatunaAlpha
Kota KinibaluBRUNEI
Bandara Seri Begawan
BintuluEAST
MALAYSIA
Kuching
Banda Aceh
Lhokseumawe
Medan
Duri
S U M A T R A Jambi
BintanSINGAPORE
Samarinda
Balikpapan
Bontang
AttakaTunu
BekapaiKALIMANTAN
Banjarmasin
Manado
SULAWESI
BURU SERAM
Ternate
Sorong
IRIAN JAYA
JakartaJ A V A
SurabayaBangkalan
BALISUMBAWA
LOMBOK
FLORES
SUMBATIMOR
DuyongWest Natuna
Mogpu
Dumai
Batam
Guntong
MADURA
REFINERIES AND Fuel TRANSPORTATION MODE
Bandung
Yogyakarta
Transit Terminal
Pipeline Distribution
Tanker
Oil Refinery
P. Brandan: 5 MBOPD
Balongan : 125 MBOPD
Kasim : 10 MBOPD
Musi 135.20 MBOPD
Balikpapan : 260 MBOPD
UjungPandang
Pagerungan
HALMAHERA
TOTAL REFINERY CAPACITY1,057,000 BOPD
Jayapura
Merauke
Cepu : 3.80 MBOPD
S.Pakning : 50 MBOPD
Cilacap: 348 MBOPD
Dumai : 120 MBOPD
Padang
Port KlangPort Dickson
I N D O N E S I A
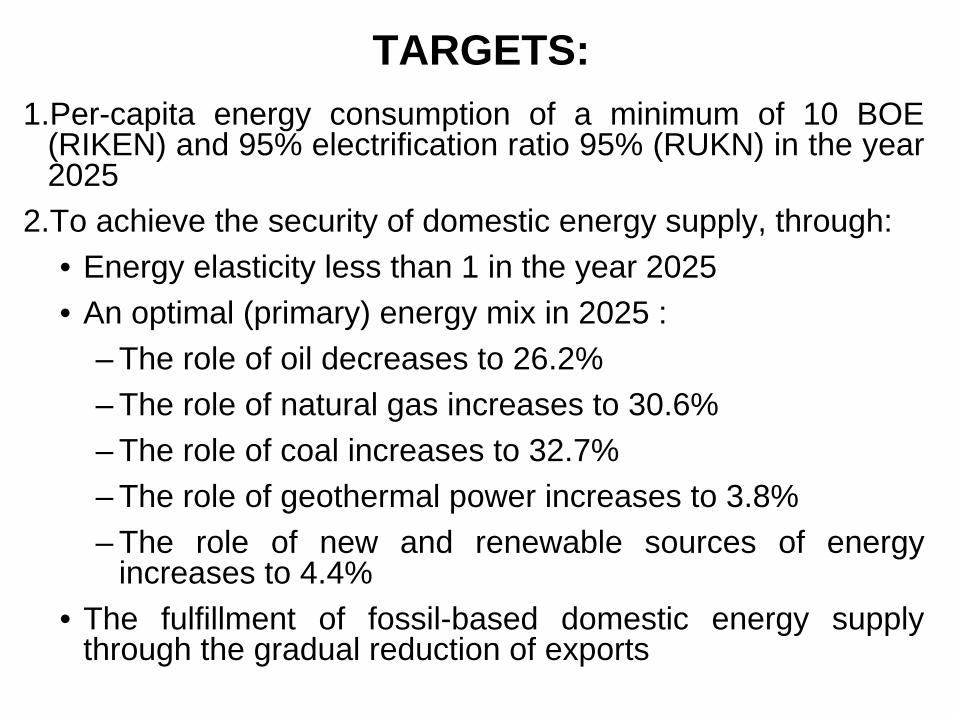
TARGETS:1.Per-capita energy consumption of a minimum of 10 BOE
(RIKEN) and 95% electrification ratio 95% (RUKN) in the year 2025
2.To achieve the security of domestic energy supply, through: • Energy elasticity less than 1 in the year 2025• An optimal (primary) energy mix in 2025 :
– The role of oil decreases to 26.2%– The role of natural gas increases to 30.6%– The role of coal increases to 32.7%– The role of geothermal power increases to 3.8%– The role of new and renewable sources of energy
increases to 4.4%• The fulfillment of fossil-based domestic energy supply
through the gradual reduction of exports

NATIONAL ENERGI MIX TARGET FOR THE YEAR 2025(GR No. 5 / 2006)
OIL 20 %
Gas 30 %
COAL 33 %
NRE 17 %
Bio-fuel 5 %
Geothermal 5 %
Biomass, Nuclear, Hydropower,Solar, Wind 5 %
Coal Liquefaction 2 %

Projected Trends of Indonesia Primary Energy Mix
0%
20%
40%
60%
80%
100%
199019911992199319941995199619971998199920002001200220032004200520062007200820092010201120122013201420152016201720182019202020212022202320242025
Perc
ent
Oil
Geothermal
Natural Gas
Coal
HydropowerBio Fuel
Renewable

Energy Snap-Shot

Energy Snap-Shot Industrial Sector- 50 100 150 200 250
2000
2050 A (CM)
2050 B (CM)
COL OIL GAS BMS S/W Heat H2 ELE
Energy consumption in industrial sector (Mtoe) CO2 emission in industrial sector with allocated emission from heat, H2, electricity (MtC)
Skenario A BEconomic (VA) increase 4% p.a increase 4% p.a.
Energy Mix Oil Reduction (50%) Oil Reduction (60%) + New Technology
Efficiency Increase Fuel 10%, Ele 25% Fuel 25%, Ele 50%
- 20 40 60 80 100 120 140 160
2000
2050 A (CM)
2050 B (CM)
COL OIL GAS BMS S/W Heat H2 ELE

Energy Snap-Shot Residential Sector- 10 20 30 40 50 60
2000
2050 A (CM)
2050 B (CM)
COL OIL GAS BMS S/W Heat H2 ELE
Energy consumption in Residential sector (Mtoe) CO2 emission in Residential sector with allocated emission from heat, H2, electricity (MtC)
Skenario A BGrowth Rate Cooling 1.5%, Cook(S) 1%, Hot Wtr 0.5%, Cook(E) 1.5%,
Lighting (2%), Appliance (2.5%)Energy Mix Oil Reduction; Changed of
Non Commersial FA + Advanced Tech. Hot Water, Cooking, etc
Efficiency Increase 20% 25%
- 5 10 15 20
2000
2050 A (CM)
2050 B (CM)
COL OIL GAS BMS S/W Heat H2 ELE

Energy Snap-Shot Transport Sector
- 50 100 150 200 250 300 350
2000
2050 A (CM)
2050 B (CM)
COL OIL GAS BMS S/W Heat H2 ELE
Energy consumption in Transport sector (Mtoe) CO2 emission in transport sector with allocated emission from heat, H2, electricity (MtC)
Skenario A BGrowth Rate Private car 1%, Commercial 5%, Bus 2.5%, Train 10%,
Ship 2.5%, Air 2.5%Energy Mix Introducing Bio Fuel Introducing BioFuel +
Hydrogen
Efficiency Increase Reguler 300%, Hydrogen 400%, Electric 500%
- 20 40 60 80 100
2000
2050 A (CM)
2050 B (CM)
COL OIL GAS BMS S/W Heat H2 ELE

Energy Snap-Shot Power Generation- 10 20 30 40 50 60 70
2000
2050 A (CM)
2050 B (CM)
COL OIL GAS NUC HYD HYD(P) GEO BMS S/W
Energy consumption in Transport sector (Mtoe) CO2 emission in transport sector with allocated emission from heat, H2, electricity (MtC)
Skenario A BGrowth Rate Private car 1%, Commercial 5%, Bus 2.5%, Train 10%,
Ship 2.5%, Air 2.5%Energy Mix Introducing Bio Fuel Introducing BioFuel +
Hydrogen
Efficiency Increase Reguler 300%, Hydrogen 400%, Electric 500%
0% 20% 40% 60% 80% 100%
2000
2050 A (CM)
2050 B (CM)
COL GAS OIL NUC HYD HYD(P) GEO BMS S/W

Energy Demand Projection- 100 200 300 400 500
2000
2050 A (CM)
2050 B (CM)
COL OIL GAS BMS NUC HYD S/W
Primary Energy (Mtoe) Final Energy (Mtoe)
- 100 200 300 400 500 600
2000
2050 A (CM)
2050 B (CM)
Industrial Residential Commercial Trans. Prv. Trans. Frg.

Factor Analysis Total
402%
-103%-139%
-22%
138%
365%
-86%
-166%
-34%
79%
-200%
-100%
0%
100%
200%
300%
400%
500%D E/
D
C/E
C'/C
Tota
l
vs 2
000'
s
2050 A 2050 B

AIM/End-use

Oil Subsidy Reduction for Residential Oil Used
Residential Energy Service RequirementCooking -> devices Kerosene Stove
Gas StoveBiomass StoveElectric Stove
Lighting -> devices Incandescent BulbCompact Fluorescent LampKerosene Lamp
Electric Appliances