Embed Size (px)
Citation preview

YE Revenue EBITDA EPS PE EV/EBITDA ROCE ROE
March (Rs mn) Margin (%) (Rs mn) Growth (%) (Rs) (x) (x) (%) (%)
FY13 6,308 14.7 428 (7.7) 4.6 63.9 30.8 9.8 10.3
FY14 7,326 16.4 581 35.7 6.3 47.1 23.5 13.0 12.7
FY15E 8,793 20.0 1,072 84.6 11.6 25.5 15.9 19.9 20.2
FY16E 11,126 20.8 1,519 41.7 16.5 18.0 12.1 24.8 23.8
FY17E 13,174 21.0 1,805 18.8 19.6 15.2 10.4 23.2 23.7
Adj PAT
‐
50
100
150
200
250
300
INDOCO REMEDIES SENSEX Index
IndiaNivesh Research IndiaNivesh Securities Private Limited601 & 602, Sukh Sagar, N. S. Patkar Marg, Girgaum Chowpatty, Mumbai 400 007. Tel: (022) 66188800
Initiating CoverageDecember 31, 2014 Indoco Remedies Ltd.
IndiaNivesh Research is also available on Bloomberg INNS, Thomson First Call, Reuters and Factiva INDNIV.
STOCK INFO
BSE 532612NSE INDOCOBloomberg INDR INReuters INRM.NSSector PharmaceuticalFace Value (Rs) 2Equity Capital (Rs mn) 184Mkt Cap (Rs mn) 27,30052w H/L(Rs) 325 / 96Avg Daily Vol (BSE+NSE) 245,098
SHAREHOLDING PATTERN %(as on Sep. 2014)
Promoters 59.3FIIs 7.7DIIs 10.8Public & Others 22.2
Source: BSE
STOCK PERFORMANCE (%) 1m 3m 12m
INDOCO REMEDIES (1.1) 5.2 135.2SENSEX (2.9) 2.8 30.4
INDOCO REMEDIES v/s SENSEX
Source: Capitaline, IndiaNivesh Research
Source: Capitaline, IndiaNivesh Research
CMP : Rs.297
Rating : BUY
Target : Rs.392
Current Previous
Superior execution to drive earnings....
Daljeet S. KohliHead of Research
Tel: +91 22 [email protected]
Tushar ManudhaneResearch Analyst
Tel: +91 22 [email protected]
Rating : NR
Target : NR(NR-Not Rated)
We initiate coverage on Indoco Remedies (INDR IN) with BUY rating as we believethat company is poised for superior growth going forward. Based on its agreementwith Watson Pharmaceuticals (Bloomberg code: ACT US Equity), own filing in USmarket, start of its own registration in European market and continuous effort to shiftfrom acute to chronic segment in domestic formulation (DF), we believe that INDRcould deliver 46% CAGR in earnings over FY14-17E. We value INDR at 20x (20% discountto large cap companies and in-line with midcap peers) FY17E EPS of Rs19.6 to arrive atprice target of Rs392, implying potential upside of 32% from current levels
Key Investment Rationale US market – key growth driver: We believe that INDR would be able to reap benefits
in medium term from the filing it has been doing for ACT US as well as for its own asthe INDR starts receiving approval for those products. INDR has recently receivedapproval for two products with market size of ~US$170mn under ACT US agreement,for which sales would begin shortly. There are only 4-5 competitors for the products,indicating healthy margins for INDR. The product pipeline is robust with total ANDAfiling of 23 (17 for ACT and 6 for its own), and only two approved as of now. Inaddition, ACT has received tentative approval for one para IV product filed from INDRsite. The approval history at its various units also highlights INDR’s capability to complywith regulations. This is one of the critical constraints which pharma companieshave to comply to maintain or generate new business in developed market like US.In the past, there have been instances, where, pharma companies lack of complianceled to stoppage of business to US market. We expect 80% CAGR in US sales overFY14-17E, led by new product launches and partly on low base.
Multiple levers to drive DF growth going forward: Though the proportion of domesticformulation (DF) sales has reduced from 68% in FY09 to 60% in FY14, the DF remainsthe focus area for INDR. INDR has shown CAGR of 12.8% over FY09-14 in DF sales, inline with industry average. With increase in exposure to chronic therapeuticcategories, expanding its presence in North and East and improved MR productivity,we expect INDR to deliver 13.5% CAGR over FY14-17E.
Own licensing to improve profitability of European markets: In addition to doublingof sales in past three years to Rs962mn by FY14, INDR has started doing its ownregistration to improve operating margin by 300-400Bps in UK market. INDR hadstarted filing in European market in 4QFY14. There could be gestation period of 12-14 months post filing to get regulatory approvals and start selling on its own. INDRhas filed six dossiers till 1HFY15 and plans to file five more in FY15. INDR has guidedfor 11-12 filing every year going forward. Higher profitability in this market wouldfurther enhance operating profit at consolidated level.
ValuationWe value INDR at 20x FY17E EPS of Rs19.6 to arrive at price target of Rs392. We valueINDR at 20% discount to valuation of 25x for large cap companies due to its size andrelatively late entry in highly profitable US market. The target price implies potentialupside of 32% from current levels. The stock has re-rated strongly in past one year fromFwd PE of 12x to 18x till date. The strong re-rating has been on the back of improvedbusiness outlook and higher return on equity. We expect further re-rating of the stockon the basis of stronger execution going forward.
Key RisksDelay in USFDA approvals, registration in UK market, new product launches in DF, non-compliance with regulatory authorities and slower than expected execution are the keyrisk to our estimates, price target and rating.
Source: Company, IndiaNivesh Research
Financial Summary
..

IndiaNivesh Research December 31, 2014 | 2 of 14
Initiating Coverage | Indoco Remedies Ltd. Superior execution to drive earnings....
Source: Bloomberg, IndiaNivesh Research
-
5,000
10,000
15,000
20,000
25,000
0
10
20
30
40
50
60
70
80
Jan-
05
Apr
-05
Jul-0
5
Oct
-05
Jan-
06
Apr
-06
Jul-0
6
Oct
-06
Jan-
07
Apr
-07
Jul-0
7
Oct
-07
Jan-
08
Apr
-08
Jul-0
8
Oct
-08
Jan-
09
Apr
-09
Jul-0
9
Oct
-09
Jan-
10
Apr
-10
Jul-1
0
Oct
-10
Jan-
11
Apr
-11
Jul-1
1
Oct
-11
Jan-
12
Apr
-12
Jul-1
2
Oct
-12
Jan-
13
Apr
-13
Jul-1
3
INDR (Rs/share) Sensex INDR acquires API plant (La Nova)
Start of sales to a German company under contract and entry into Australia with same partner
Start of Baddi manufacturing facility
INDR starts filing its own ANDA
Further consolidation of Aspen agreement
Brazillian agency approves INDR’s Goa plant I
INDR signs profit sharing agreement with Watson, wherein, INDR will develop, manufacture and supply sterile products to Watson for US market.
INDR signs agreement with Aspen for marketing its products in emerging market covering 30
-
5,000
10,000
15,000
20,000
25,000
30,000
35,000
0
50
100
150
200
250
300
350
Jan-
05
Apr
-05
Jul-0
5
Oct
-05
Jan-
06
Apr
-06
Jul-0
6
Oct
-06
Jan-
07
Apr
-07
Jul-0
7
Oct
-07
Jan-
08
Apr
-08
Jul-0
8
Oct
-08
Jan-
09
Apr
-09
Jul-0
9
Oct
-09
Jan-
10
Apr
-10
Jul-1
0
Oct
-10
Jan-
11
Apr
-11
Jul-1
1
Oct
-11
Jan-
12
Apr
-12
Jul-1
2
Oct
-12
Jan-
13
Apr
-13
Jul-1
3
Oct
-13
Jan-
14
Apr
-14
Jul-1
4
Oct
-14
INDR (Rs/share) Sensex
Patalganga API unit got USFDA approval in March 13
Goa I got USFDA approval in May 2013
INDR launched glimiperide - 1st ANDA filed and approved on its own
INDR started filing in European markets on its own to enhance profitability
Goa II (sterile) and Goa III (solid dosage) received USFDA approval in July 14
The fall was probably due to rumor about INDR receiving warning letter for its Goa II facility
Major events in the business of the company vs. stock price
The fall was probably due to INDR receiving warningletter for its Goa II facility
..

IndiaNivesh Research December 31, 2014 | 3 of 14
Initiating Coverage | Indoco Remedies Ltd. Superior execution to drive earnings....
3.2 3.1 3.3
7.6
12
32
45
5.1
20.423.5
-
5.0
10.0
15.0
20.0
25.0
30.0
35.0
40.0
45.0
50.0
-
5.0
10.0
15.0
20.0
25.0
30.0
35.0
40.0
45.0
50.0
FY11 FY12 FY13 FY14 FY15E FY16E FY17E
Total US ($mn)
We expect sales from recently approved products under ACT agreement to fetch US$20.4mn and US$23.5mn for FY16E and FY17E,
Investment RationaleUS market – key growth driver
We expect US sales to grow by 80% over FY14-17E
Source: Company, IndiaNivesh Research
INDR’s R&D effort towards building product pipeline for US market is expected todeliver better sales going forward. The sharp uptick in sales in FY15 and FY16 isgoing to be mainly due to start of supply of couple of products to WatsonPharmaceuticals (Bloomberg code: ACT US Equity) under supply agreement.
INDR entered into agreement with ACT in FY10, wherein, the ACT’s role is to compileand file ANDAs for USFDA approval and sale & distribution of the products in theUS market. ACT and INDR will share the development costs, including cost towardsbio-studies / clinical trials, legal fees and net profits as well. The initial number ofproducts under this agreement was only 7. However, over period of past five years,the relationship has been strengthened to 23 products under agreement highlightingR&D capabilities of INDR. INDR would be sole supplier for products under agreementto ACT. Out of 23 products signed, 17 are filed with USFDA out of which two areapproved.
811
17 17
7
17
17
21
23 23
0
5
10
15
20
25
30
35
40
45
FY10 FY11 FY12 FY13 FY14 2HFY15
Cum. no. of filing out of prod. Signed with Watson
Cum. no. of products signed with Watson
Number of products have tripled under Watson agreement since inception
Source: Company, IndiaNivesh Research
Relationship between INDR & ACT US havestrengthened over past 5 years
..

IndiaNivesh Research December 31, 2014 | 4 of 14
Initiating Coverage | Indoco Remedies Ltd. Superior execution to drive earnings....
Recently USFDA approved products under ACT agreement to drive US sales forFY15-17: INDR has guided for start of sale of recently approved products in 4QFY15. Both the products have combined market size of US$170mn with 4-5competitors in the market. With price erosion of 55-60%, we expect INDR to earnUS$20.4mn and US$23.5mn in FY16E and FY17E, respectively. These being sterileproducts, we expect INDR to have better profitability from these products.
In addition, ACT has received tentative approval for one para IV product filed fromINDR site.
INDR has been filing its own product to diversify its portfolio for US market. INDRtotal ANDA filing stands at 23, out of which 17 has been filed for ACT and remainingfor own. INDR has guided for 10 ANDA filings annually going forward. INDR has filedsix ANDAs in 1HFY15 and has guided for another 4-5 filing in 2HFY15.
3.0 2.6 2.9
6.3
8.3
17.3
20.5
-
5.0
10.0
15.0
20.0
25.0
FY11 FY12 FY13 FY14 FY15E FY16E FY17E
US sales as % of total sales
The share of US sales in total sales is expected to rise from 6% in FY14 to 21% in FY17.
Source: Company, IndiaNivesh Research
Past USFDA inspections and approval indicates INDR’s capability to tide over oneof the critical constraints for doing business in US: The table below highlights USFDAapproval history for INDR at its various units. Goa II and Goa III have been recentlyreceived USFDA approval in July 2014. Goa I and Patalganga API facility had receivedapproval in May 2013 and March 2013, respectively.
Facility TimelineSterile products - Goa IIUSFDA approval Oct-05USFDA re-inspection post expansion and approval Feb-11USFDA re-inspection Aug-13USFDA approval Jul-14
Goa I - FDFUSFDA inspection Aug-12USFDA approval May-13
Goa III - TabletsUSFDA inspection Aug-13USFDA approval Jul-14
Patalganga API facilityUSFDA inspection Aug-12USFDA approval Mar-13
Rabale Kilo Lab facilityUSFDA inspection Sep-12USFDA approval Apr-13
Source: Company, IndiaNivesh Research
INDR has been doing own filing also to reducedependence on ACT
..

IndiaNivesh Research December 31, 2014 | 5 of 14
Initiating Coverage | Indoco Remedies Ltd. Superior execution to drive earnings....
As indicated in the table, INDR has received approval for its facilities – Goa I, Goa III,Patalganga API facility and Rabale Kilo Lab facility, without any major observation.In fact, Goa II has been inspected twice in past ten years and was approved withoutany major observation. USFDA clearance implies INDR’s capability to comply withregulations. This is one of the critical constraints which pharma companies have tocomply to maintain or generate new business in developed market like US. In thepast, there have been instances, where, pharma companies lack of compliance ledto stoppage of business to US market, which adversely impacted their sales,profitability and hence return on investment.
Our sales assumption has upward bias as the current assumption in US sales is notfactoring any sales from products filed but yet to be approved. Out of 23 filings,50% were filed by FY13.
Current capacity is enough to drive sales for next two years: INDR has formulationfacility at Goa and API facility at Patalganga to cater to US market. Goa II, which isfor sterile products would be used to supply products to ACT. Goa I and II use byINDR for its own products in US market. Overall, Current capacity utilization is 70%,giving enough scope for INDR to scale up, once it received regulatory approvals.
Multiple levers to drive DF growth going forwardThough the proportion of DFsales has reduced from 68% in FY09 to 60% in FY14,the DF remains the focus area for INDR. INDR has shown CAGR of 12.8% over FY09-14 in DF sales, in line with industry average. Despite its higher exposure to acutetreatment, the in-line with industry average growth is commendable. INDR couldachieve such growth mainly due to volume growth than pricing growth. The volumegrowth was led by new product launches and increased traction in existing productsportfolio. INDR has launched about 123 products in past four years and 13 productsin 1H FY15. Management has guided for similar run-rate to continue for next twoyears. Segmentwise, respiratory, stomatologicals, anti-infectives and gastro-intestinal forms about 66% of net DF sales at the end of FY14. Pain analgesics is thenext promising segment for INDR. Though the contribution from this segment iscurrently low at 8%, the 16% y-y growth in FY14 and in 1HFY15, indicates that theproportion is expected to increase going forward. Brand-wise, Sensodent and Oxipodhave outperformed other brands in the portfolio by growing at CAGR of 16.3% and14.4% over past three years. Flamar, Lignox and Cal-Aid remains the promisingbrands under pain segment for INDR.
Though INDR has 11% of sales under NLEM, the impact of pricing policy has beenminimal as INDR had already priced its products below the price recommendedunder pricing policy.
INDR has 70% of its sales from southern and western part of India, while remainingfrom Northern and Eastern part of India. INDR intends to increase exposure to highergrowth region of East and North. In FY14, East, West, North and South grew by15%y-y, 16%y-y, 11%y-y and 8%y-y, respectively for FY14. We expect proportion ofNorth and East to improve gradually for INDR.
INDR has 70% of captive production, reducing its dependence on third party toavoid any supply issues and have complete backward integration.
INDR has consistently increased its Medical Respresentatives (MRs) from 1,440 to2310 till FY14. The number of MRs stands at 2340 at the end of 1HFY15. Also, theMR productivity has increased modestly from 18.8Lacs/MR in FY10 to 19.0Lacs/MR. There was a dip in MR productivity in FY13, despite sales growing by 15.4% y-y,mainly due to higher addition of MRs in that year. We expect the productivity togradually increase as the efficiency improves going forward.
We expect future growth rate to gradually improve and outperform industry growthrate as it increases its exposure to chronic therapeutic category, increase its presencein North and East Inda and improve productivity of its MRs. INDR intends to increasechronic therapeutic category exposure from 10% in FY14 to 20% by FY16-17E.
Insignificant impact of NLEM pricing policy onINDR
INDR intends to increase presence in North/East India
Large field-force of 2,310 MRs; focus onimproving productivity of MRs
DF growth led by volumes on the back of newlaunches and increased traction in existingproducts
..

IndiaNivesh Research December 31, 2014 | 6 of 14
Initiating Coverage | Indoco Remedies Ltd. Superior execution to drive earnings....
1440 1680 1900 2265 2310 2500
18.8
18.3
17.8
17.2
19.0
19.8
15.5
16.0
16.5
17.0
17.5
18.0
18.5
19.0
19.5
20.0
20.5
0
500
1000
1500
2000
2500
3000
FY10 FY11 FY12 FY13 FY14 FY15E
MRs (LHS) MR productivity (Rs lacs/MR) (RHS)
21
4038
24
13
0
5
10
15
20
25
30
35
40
45
FY11 FY12 FY13 FY14 1HFY15
New product launches
3.1 3.4 3.9 4.4 5.0 5.6 6.4
13.5
10.1
15.4
12.3 13.0
13.8 14.0
-
2.0
4.0
6.0
8.0
10.0
12.0
14.0
16.0
18.0
-
1.0
2.0
3.0
4.0
5.0
6.0
7.0
FY11 FY12 FY13 FY14 FY15E FY16E FY17E
Domestic sales (Rs bn) - LHS Y-y growth (%) - RHS
We expect DF sales to grow at 13.5% CAGR over FY14-17E
Source: Company, IndiaNivesh Research
We expect INDR to maintain run-rate of new product launches
Source: Company, IndiaNivesh Research
Top 9 brands contribute 50% to total sales
Febrex Plus 11.5 3.2
Cyclopam 10.3 6.2
Sensodent-K 5.5 16.3
Oxipod 4.1 14.4
Cital 4.2 9.3
Atm 4.2 3.8
Sensoform 3.3 6.6
Cloben G 3.3 6.2
Sensodent-Kf 2.9 18.1
3-yr CAGR (%)% contribution to
total DF salesBrands
Source: Company, IndiaNivesh Research
Respiratory18%
Stomatologicals18%
Anti - Infectives16%
Gastrointestinal14%
Pain / Analgesics8%
Ophthalmic / Otologicals
6%
Gynaecology5%
Others15%
MR productivity to pickup gradually
Source: Company, IndiaNivesh Research
Respiratory, Stomatology, AI and GI forms 66% of DF sales (FY14)
Source: Company, IndiaNivesh Research
INDR to improve profitability in UK market through ownlicensingUK sales have almost doubled from Rs522mn in FY11 to Rs962mn in FY14. INDRderives most of the business in UK market through contract manufacturing andout-licensing of dossiers. We expect INDR’s sales in UK market to grow at CAGR of29% over FY14-16, led by newer contracts and business from its own registration.Post successful learning of Europe market through contract manufacturing, INDRintends to register and have market authorization of its own in these markets. This
Management expects 3-4% improvement inmargins in UK business on the back of ownregistrations vs. current CRAMS business
..

IndiaNivesh Research December 31, 2014 | 7 of 14
Initiating Coverage | Indoco Remedies Ltd. Superior execution to drive earnings....
would not only maintain sales, but also improve profitability of INDR going forward.INDR has guided for margin enhancement to the extent of 3-4% in this region postcomplete business through its own marketing authorization. INDR had started filingin European market in 4QFY14. There could be gestation period of 12-14 monthspost filing to get regulatory approvals and start selling on its own. INDR has filed sixdossiers till 1HFY15 and plans to file five more in FY15. INDR has guided for 11-12filing every year going forward. On the basis of filing rate, we expect INDR to haveconsiderable EBITDA margin improvement on the basis of own registration fromFY17-18E, hence we have not yet built in margin rise in our estimates till FY17.
INDR received UK-MHRA re-approval in August 2014 with no critical and no majorobservations for its Goa I facility.
UKMHRA approval history TimelineGoa I - FDF Dec-09
Nov-11Aug-14
Baddi Apr-09Jan-11Feb-13
Source: Company, IndiaNivesh Research
UK sales as proportion of total sales are expected to drop to 14.1% in FY17, despitestrong growth in sales in this market, due to higher growth in other regions.
522 583 852 962 1,400 1,610 1,852
10.9
10.2
13.5 13.1
15.9
14.5 14.1
9.0
10.0
11.0
12.0
13.0
14.0
15.0
16.0
17.0
-
200
400
600
800
1,000
1,200
1,400
1,600
1,800
2,000
FY11 FY12 FY13 FY14 FY15E FY16E FY17E
UK Sales (Rs mn) - LHS UK sales as % of total sales (RHS)
Own licensing to drive UK sales and profitability going forward
Source: Company, IndiaNivesh Research
Business tie-up and promotional activities to drive sales inemerging marketsEmerging markets contributes 4-5% of total sales for INDR. The sales in this segmenthad dipped in FY13, mainly due to change in business model. INDR transformed itsbusiness model from distribution to promotion to enhance profitability. INDR alsotied up with ASPEN, South Africa in FY10 by licensing out intellectual property(dossiers) for marketing its products in emerging markets covering 30 countries,including SA, Brazil, Mexico, Venezuela, Russia & Australia. We expect 30% CAGRover next two years, led by increased business through Aspen and partly on lowbase.
Tie-up with Aspen to drive growth in Emergingmarkets
..

IndiaNivesh Research December 31, 2014 | 8 of 14
Initiating Coverage | Indoco Remedies Ltd. Superior execution to drive earnings....
296 355 344 460 506 557 612
59.4
20.0
(3.0)
33.6
10.0 10.0 10.0
(10.0)
-
10.0
20.0
30.0
40.0
50.0
60.0
70.0
-
100
200
300
400
500
600
700
FY11 FY12 FY13 FY14 FY15E FY16E FY17E
API (Rs mn) - LHS API (y-y growth,%) - RHS
305 360 195 307 399 518 674
59.7
18.1
(45.8)
57.2
30.0 32.0 33.0
(60.0)
(40.0)
(20.0)
-
20.0
40.0
60.0
80.0
-
100
200
300
400
500
600
700
800
FY11 FY12 FY13 FY14 FY15E FY16E FY17E
Emerging market sales (Rs mn) - LHS Emerging market (y-y growth,%) - RHS
Sales from emerging market to grow strongly, partly on low base
Source: Company, IndiaNivesh Research
Captive consumption would lead to lower growth in APIsalesAPI sales contribute 5-6% of total sales. INDR’s conscious efforts towards higherformulation sales and increased captive consumption have resulted in API sales toremain stable as % of total sales. We expect growth in this segment to remain mutedgoing forward.
In-house consumption to result in moderate growth in API segment
Source: Company, IndiaNivesh Research
Total sales is expected to grow at 21.6% CAGR over FY14-17EWe expect the y-y growth trajectory of overall sales of INDR to improve over next 2-3 years, led by US and DF. We expect INDR to show higher growth in emergingmarket segment as well; however, lower contribution in total sales would tone downits impact on total sales growth. We expect 21.6% CAGR in sales over next threeyears to Rs13bn in FY17. We also expect proportion of exports to regulated marketto improve considerably from 28% in FY14 to 41% in FY17E, due to relatively highergrowth of 37% in exports to regulated market.
..

IndiaNivesh Research December 31, 2014 | 9 of 14
Initiating Coverage | Indoco Remedies Ltd. Superior execution to drive earnings....
93 108 129 144 220 334 461
1.9 1.9 2.0 2.0
2.5
3.0
3.5
1.0
1.5
2.0
2.5
3.0
3.5
4.0
50
100
150
200
250
300
350
400
450
500
FY11 FY12 FY13 FY14 FY15E FY16E FY17E
R&D Cost (Rs mn) - LHS % of net sales - RHS
4.8 5.7 6.3 7.3 8.8 11.1 13.2
20.8
18.2
10.9
16.1
20.0
26.5
18.4
9.0
11.0
13.0
15.0
17.0
19.0
21.0
23.0
25.0
27.0
29.0
3.0
5.0
7.0
9.0
11.0
13.0
15.0
FY11 FY12 FY13 FY14 FY15E FY16E FY17E
Total sales (Rs bn) - LHS Y-y growth (%) in net sales - RHS
DF49%
Exports -Regulated mkt
41%
Exports - Emerging mkt5%
Domestic - API2%
Exports - API2%
Analytical and testing income
0%Other operating
income1%
DF60%
Exports -Regulated mkt
28%
Exports -Emerging mkt
4%Domestic - API
3%Exports - API
3%Analytical and testing income
0%Other operating
income2%
US and DF to drive growth of INDR
Source: Company, IndiaNivesh Research
Proportion of exports to regulated market expected to increase from 28% in FY14 to 41% of net sales in FY17E
Source: Company, IndiaNivesh Research Source: Company, IndiaNivesh Research
We expect 460bps improvement in EBITDA margin between FY14 & FY17E: Theimprovement is much sharper as compared to its EBITDA margin profile over pastfive years. We expect this change on account of superior product mix in regulatedmarket and DF segment, own registration in UK market and improved productivityin DF segment. Despite increased R&D effort, we expect EBITDA margin to remainon uptrend. INDR has already shown margin improvement of 384bps y-y in 1HFY15to 20%, led by improved gross margin, higher efficiency and better capacityutilization. INDR has also guided for margin increase to remain sustainable overnext two years.
14.1 14.9 14.7
16.4
20.0 20.8 21.0
10.0
12.0
14.0
16.0
18.0
20.0
22.0
FY11 FY12 FY13 FY14 FY15E FY16E FY17E
EBITDA Margin (%)
Superior product and higher efficiency to drive EBITDA margin
Source: Company, IndiaNivesh Research
R&D cost to inch up to cater future growth
Source: Company, IndiaNivesh Research
..
IndiaNivesh Research December 31, 2014 | 10 of 14
Initiating Coverage | Indoco Remedies Ltd. Superior execution to drive earnings....
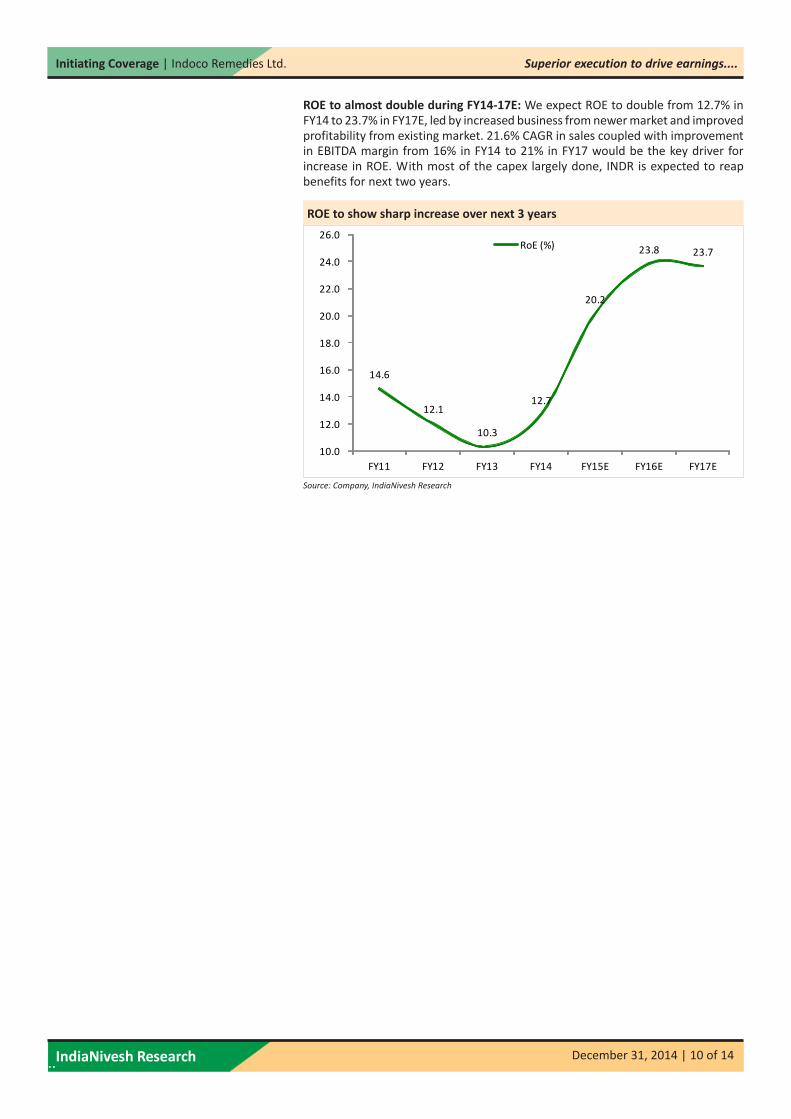
14.6
12.1
10.3
12.7
20.2
23.8 23.7
10.0
12.0
14.0
16.0
18.0
20.0
22.0
24.0
26.0
FY11 FY12 FY13 FY14 FY15E FY16E FY17E
RoE (%)
ROE to almost double during FY14-17E: We expect ROE to double from 12.7% inFY14 to 23.7% in FY17E, led by increased business from newer market and improvedprofitability from existing market. 21.6% CAGR in sales coupled with improvementin EBITDA margin from 16% in FY14 to 21% in FY17 would be the key driver forincrease in ROE. With most of the capex largely done, INDR is expected to reapbenefits for next two years.
ROE to show sharp increase over next 3 years
Source: Company, IndiaNivesh Research
..

IndiaNivesh Research December 31, 2014 | 11 of 14
Initiating Coverage | Indoco Remedies Ltd. Superior execution to drive earnings....
FY15E FY16E FY15E FY16E FY15E FY16E FY15E FY16E FY15E FY16E FY15E FY16E FY15E FY16EIndoco Remedies 8,793 11,126 20.0 20.8 1,072 1,519 11.6 16.5 20.2 23.8 25.5 18.0 15.8 12.0Ajanta Pharma 13,935 16,466 30.9 31.2 2,880 3,462 81.5 98.0 33.8 29.9 28.7 23.9 19.5 16.0Alembic Pharma 22,694 26,585 20.3 21.0 3,124 3,834 16.6 20.3 28.7 25.1 26.7 21.8 17.5 14.1Biocon 33,263 38,801 23.5 23.1 4,608 5,320 23.0 26.6 13.8 14.3 18.2 15.8 11.8 9.9Ipca Lab 33,272 39,987 20.4 22.1 4,266 5,890 33.8 46.7 26.2 29.3 21.7 15.7 14.2 10.7
EV/EBITDA (x)Companies
Sales (Rs mn) EBITDA margin (%) PAT (Rs mn) EPS (Rs) ROE (%) PE (x)
-
50.0
100.0
150.0
200.0
250.0
300.0
350.0
400.0
May
-08
Aug-
08
Dec
-08
Apr-
09
Aug-
09
Dec
-09
Apr-
10
Aug-
10
Dec
-10
Apr-
11
Aug-
11
Dec
-11
Apr-
12
Aug-
12
Dec
-12
Apr-
13
Aug-
13
Dec
-13
Apr-
14
Aug-
14
Dec
-14
12.0 x 14.0 x 16.0 x
18.0 x 20.0 x 22.0 x
Indoco (Rs/share)
ValuationThe stock has re-rated strongly in past one year with Fwd PE expanding from 12x to18x till date. The strong re-rating has been on the back of improved business outlookand higher return on equity. We expect further re-rating of the stock on the basis ofstronger execution going forward. We value INDR at 20x FY17E EPS of Rs19.6 toarrive at price target of Rs392. We value INDR at 20% discount to valuation of 25xfor large cap companies due to its size and relatively late entry in highly profitableUS market. The target price implies potential upside of 32% from current levels. Weinitiate coverage with BUY rating on the stock.
PE Band
Source: Bloomberg, IndiaNivesh Research
Peer Comparison
Source: Bloomberg, IndiaNivesh Research
Key RisksDelay in USFDA approvals, registration in UK market, new product launches in DF,non-compliance with regulatory authorities and slower than expected executionare the key risk to our estimates, price target and rating.
..

IndiaNivesh Research December 31, 2014 | 12 of 14
Initiating Coverage | Indoco Remedies Ltd. Superior execution to drive earnings....
Financials
Source: Company, IndiaNivesh Research
Income StatementY E March (Rs m) FY13 FY14 FY15E FY16E FY17ENet sales 6,308 7,326 8,793 11,126 13,174 Growth % 10.9 16.1 20.0 26.5 18.4 Expenditure 5,381 6,122 7,035 8,812 10,403 Raw Material 2,626 2,720 3,148 3,927 4,624 Employee cost 1,079 1,295 1,451 1,791 2,121 Other expenses 1,677 2,107 2,436 3,094 3,658 EBITDA 927 1,204 1,758 2,313 2,770 Growth % 9.5 30.0 46.0 31.6 19.8 EBITDA Margin % 14.7 16.4 20.0 20.8 21.0 Deprecaition 237 309 338 344 402 EBIT 690 895 1,420 1,969 2,368 EBIT Margin % 10.9 12.2 16.2 17.7 18.0 Other Income 15 18 23 26 30 Interest 92 103 103 96 142 PBT 612 810 1,340 1,899 2,257 Tax 58 143 268 380 451 Effective tax rate % 12 20 20 20 20 Extraordinary items (126) (86) - - - Less: Minority Interest - - - - - Adjusted PAT 428 581 1,072 1,519 1,805 Growth% (7.7) 35.7 84.6 41.7 18.8
PAT margin % 7 8 12 14 14
Reported PAT 428 581 1,072 1,519 1,805 Growth% (7.7) 35.7 84.6 41.7 18.8
Balance SheetY E March (Rs m) FY13 FY14 FY15E FY16E FY17EEquity capital 184 184 184 184 184 Reserves and surplus 3,957 4,387 5,132 6,187 7,441 Total equity 4,144 4,574 5,319 6,374 7,628 Total debt 1,300 1,014 1,014 1,014 1,614 Minority interest 2 2 2 2 2 Total Liabilities 5,443 5,588 6,333 7,388 9,242 Fixed assets 3,592 3,694 3,757 3,913 5,011 Investments 1 2 2 2 2 Current assets 3,324 3,597 4,573 5,738 6,727 Cash 140 134 411 370 227 Inventory 932 1,102 1,561 1,981 2,346 Debtors 1,271 1,381 1,635 2,012 2,346 Other current assets 0 3 3 3 3 Current liabi lities 1,127 1,400 1,694 1,960 2,193 Accounts payable 683 707 1,001 1,267 1,500 Provisions 217 359 359 359 359 Others 228 334 334 334 334 Deferred tax liabil ity (net) (348) (305) (305) (305) (305) Total Assets 5,443 5,588 6,333 7,388 9,242
Cash FlowY E March (Rs m) FY13 FY14 FY15E FY16E FY17EPBT 612 810 1,340 1,899 2,257 Depreciation 237 309 338 344 402 Interest 92 103 103 96 142 Other non cash chargesChanges in working capital (126) (6) (405) (940) (899) Tax (58) (143) (268) (380) (451) Cash flow fromoperations 758 1,073 1,108 1,020 1,450 Capital expenditure (488) (412) (400) (500) (1,500) Free Cash Flow 270 662 708 520 (50) Investments - (0) - - - Cash flow from investments (488) (412) (400) (500) (1,500) Equity capital raised 62 - - - - Loans availed or (repaid) 62 (285) - - 600 Interest paid (92) (103) (103) (96) (142) Dividend paid (incl tax) (119) (151) (328) (464) (552) Others (72) (129) - - - Cash flow from Financing (160) (668) (431) (561) (94) Net change in cash 110 (7) 277 (41) (143) Cash at the beginning of the year 105 140 134 411 370 Cash at the end of the year 215 133 411 370 227
Key ratiosY E March FY13 FY14 FY15E FY16E FY17EEPS (Rs) Core 4.6 6.3 11.6 16.5 19.6 EPS Reported 4.6 6.3 11.6 16.5 19.6 Cash EPS (Rs) 7.2 9.7 15.3 20.2 24.0 DPS (Rs) 1.1 1.4 3.0 4.3 5.1
BVPS (Rs) 45.0 49.6 57.7 69.2 82.8
ROCE 9.8 13.0 19.9 24.8 23.2 ROE 10.3 12.7 20.2 23.8 23.7
Inventories Days 62.3 64.8 64.8 65.0 65.0 Sundry Debtors Days 72.5 67.9 67.9 66.0 65.0 Loans & Advances Days 56.0 48.0 40.0 45.0 50.0 Trades Payable Days 45.7 41.6 41.6 41.6 41.6
PER (x) 63.9 47.1 25.5 18.0 15.2 P/BV (x) 6.6 6.0 5.1 4.3 3.6 EV/EBITDA (x) 30.8 23.5 15.9 12.1 10.4
m cap/sales (x) 4.3 3.7 3.1 2.5 2.1 net debt/equity (x) 0.3 0.2 0.1 0.1 0.2 net debt/ebitda (x) 1.3 0.7 0.3 0.3 0.5
..

IndiaNivesh Research December 31, 2014 | 13 of 14
Initiating Coverage | Indoco Remedies Ltd. Superior execution to drive earnings....
Disclosure:This report has been prepared by IndiaNivesh Securities Private Limited ("INSPL") and published in accordance with the provisions of Regulation 18 of the Securities and Exchange Board of India (ResearchAnalysts) Regulations, 2014, for use by the recipient as information only and is not for circulation or public distribution. INSPL includes subsidiaries, group and associate companies, promoters, directors,employees and affiliates. This report is not to be altered, transmitted, reproduced, copied, redistributed, uploaded, published or made available to others, in any form, in whole or in part, for any purpose withoutprior written permission from INSPL. The projections and the forecasts described in this report are based upon a number of estimates and assumptions and are inherently subject to significant uncertainties andcontingencies. Projections and forecasts are necessarily speculative in nature, and it can be expected that one or more of the estimates on which the projections are forecasts were based will not materialize orwill vary significantly from actual results and such variations will likely increase over the period of time. All the projections and forecasts described in this report have been prepared solely by authors of thisreport independently. None of the forecasts were prepared with a view towards compliance with published guidelines or generally accepted accounting principles.
This report should not be construed as an offer to sell or the solicitation of an offer to buy, purchase or subscribe to any securities, and neither this report nor anything contained therein shall form the basis ofor be relied upon in connection with any contract or commitment whatsoever. It does not constitute a personal recommendation or take into account the particular investment objective, financial situation orneeds of individual clients. The research analysts of INSPL have adhered to the code of conduct under Regulation 24 (2) of the Securities and Exchange Board of India (Research Analysts) Regulations, 2014. Therecipients of this report must make their own investment decisions, based on their own investment objectives, financial situation or needs and other factors. The recipients should consider and independentlyevaluate whether it is suitable for its/ his/ her/their particular circumstances and if necessary, seek professional / financial advice as there is substantial risk of loss. INSPL does not take any responsibility thereof.Any such recipient shall be responsible for conducting his/her/its/their own investigation and analysis of the information contained or referred to in this report and of evaluating the merits and risks involved insecurities forming the subject matter of this report. The price and value of the investment referred to in this report and income from them may go up as well as down, and investors may realize profit/loss on theirinvestments. Past performance is not a guide for future performance. Actual results may differ materially from those set forth in the projection.
Except for the historical information contained herein, statements in this report, which contain words such as 'will', 'would', etc., and similar expressions or variations of such words may constitute 'forward-looking statements'. These forward-looking statements involve a number of risks, uncertainties and other factors that could cause actual results to differ materially from those suggested by the forward-lookingstatements. Forward-looking statements are not predictions and may be subject to change without notice. INSPL undertakes no obligation to update forward-looking statements to reflect events or circumstancesafter the date thereof. INSPL accepts no liabilities for any loss or damage of any kind arising out of use of this report.
This report has been prepared by INSPL based upon the information available in the public domain and other public sources believed to be reliable. Though utmost care has been taken to ensure its accuracy andcompleteness, no representation or warranty, express or implied is made by INSPL that such information is accurate or complete and/or is independently verified. The contents of this report represent theassumptions and projections of INSPL and INSPL does not guarantee the accuracy or reliability of any projection, assurances or advice made herein. Nothing in this report constitutes investment, legal,accounting and/or tax advice or a representation that any investment or strategy is suitable or appropriate to recipients' specific circumstances. This report is based / focused on fundamentals of the Companyand forward-looking statements as such, may not match with a report on a company's technical analysis report. This report may not be followed by any specific event update/ follow-up.
Disclosure of Interest Statement
1. Details of business activity of IndiaNivesh Securities Private Limited (INSPL) INSPL is a Stock Broker registered with BSE, NSE and MCX - SX in all the major segments viz. Cash, F & Oand CDS segments. INSPL is also a Depository Participant and registered with both Depository viz. CDSLand NSDL. Further, INSPL is a Registered Portfolio Manager and is registered with SEBI.
2. Details of Disciplinary History of INSPL No disciplinary action is / was running / initiated against INSPL
3. Details of Associates of INSPL 1. IndiaNivesh Limited2. Siddhi Multi-Trade Private Limited3. IndiaNivesh Commodities Private Limited4. IndiaNivesh Insurance Brokers Private Limited5. IndiaNivesh Investment Advisors Private Limited6. IndiaNivesh Fund Managers Private Limited7. Sneh Shares & Securities Private Limited8. IndiaNivesh Financial Advisors Private Limited9. Balashri Commercial Limited10. IndiaNivesh Capitals Limited
4. Research analyst or INSPL or its relatives'/associates' shareholding in the company. No
5. Research analyst or INSPL or its relatives'/associates' actual/beneficial ownership of 1% ormore in securities of the subject company, at the end of the month immediately precedingthe date of publication of the document. No
6. Research analyst or INSPL or its relatives'/associates' any other material conflictof interest at the time of publication of the document No
7. Has research analyst or INSPL or its associates received any compensation fromthe subject company in the past 12 months No
8. Has research analyst or INSPL or its associates managed or co-managed public offeringof securities for the subject company in the past 12 months No
9. Has research analyst or INSPL or its associates received any compensation for investmentbanking or merchant banking or brokerage services from the subject companyin the past 12 months No
10. Has research analyst or INSPL or its associates received any compensation for productsor services other than investment banking or merchant banking or brokerage servicesfrom the subject company in the past 12 months No
11. Has research analyst or INSPL or its associates received any compensation or other benefitsfrom the subject company or third party in connection with the document. No
12. Has research analyst served as an officer, director or employee of the subject company No
13. Has research analyst or INSPL engaged in market making activity for the subject company No
14. Other disclosures No
Following table contains the disclosure of interest in order to adhere to utmost transparency in the matter;
INSPL, its affiliates, directors, its proprietary trading and investment businesses may, from time to time, make investment decisions that are inconsistent with or contradictory to the recommendations expressedherein. The views contained in this document are those of the analyst, and the company may or may not subscribe to all the views expressed within. This information is subject to change, as per applicable law,without any prior notice. INSPL reserves the right to make modifications and alternations to this statement, as may be required, from time to time.
Definitions of ratingsBUY. We expect this stock to deliver more than 15% returns over the next 12 months.HOLD. We expect this stock to deliver -15% to +15% returns over the next 12 months.SELL. We expect this stock to deliver <-15% returns over the next 12 months.Our target prices are on a 12-month horizon basis.
Other definitionsNR = Not Rated. The investment rating and target price, if any, have been arrived at due to certain circumstances not in control of INSPLCS = Coverage Suspended. INSPL has suspended coverage of this company.UR= Under Review. The investment review happens when any developments have already occurred or likely to occur in target company & INSPL analyst is waiting for some more information to drawconclusion on rating/target.NA = Not Available or Not Applicable. The information is not available for display or is not applicable.NM = Not Meaningful. The information is not meaningful and is therefore excluded.
Research Analyst has not served as an officer, director or employee of Subject CompanyOne year Price history of the daily closing price of the securities covered in this note is available at nseindia.com and economictimes.indiatimes.com/markets/stocks/stock-quotes. (Choose name of company inthe list browse companies and select 1 year in icon YTD in the price chart).
..

IndiaNivesh Research December 31, 2014 | 14 of 14
Initiating Coverage | Indoco Remedies Ltd. Superior execution to drive earnings....
IndiaNivesh Securities Private Limited601 & 602, Sukh Sagar, N. S. Patkar Marg, Girgaum Chowpatty, Mumbai 400 007.
Tel: (022) 66188800 / Fax: (022) 66188899e-mail: [email protected] | Website: www.indianivesh.in
Home
..