Embed Size (px)
Citation preview
113 December 2014
Wealth Creation Study 2009-2014 Thematic Study | December 2014
Raamdeo Agrawal ([email protected]) / Shrinath Mithanthaya ([email protected])
We thank Mr Dhruv Mehta ([email protected]), Investment Consultant, for his invaluable contribution to this report.
19th ANNUAL WEALTH CREATION STUDY (2009-2014)
HIGHLIGHTS
100x stocks are few. Finding them requires "vision to see, courage
to buy, and the patience to hold."
Value migration offers the most predictable 100x opportunities.
The 100x process is captured in SQGLP – Size, Quality, Growth,
Longevity and Price.
"In evaluating a common stock, the management is 90%, industry
is 9%, and all other factors 1%." (Phil Fisher)
Quality does not guarantee growth, and in turn, rapid long-
term Wealth Creation.
"To make money in stocks you must have the vision to see them,the courage to buy them and the patience to hold them. Patienceis the rarest of the three."
— Thomas Phelps in 100 to 1 In The Stock Market
THE BIGGEST THE FASTEST THE MOST CONSISTENT
Wealth 5-Year Appeared 2004-14
Rank Company Created Company Price Company in WC Price
(INR b) CAGR (%) Study (x) CAGR (%)
1 TCS 3,638 Eicher Motors 94 Kotak Mahindra 10 34
2 ITC 2,073 Bajaj Finance 93 Asian Paints 10 34
3 HDFC Bank 1,307 Supreme Inds 88 Sun Pharma 10 33
4 Infosys 1,123 Amara Raja Batteries 84 Hindustan Zinc 10 29
5 ICICI Bank 1,035 Page Industries 78 ITC 10 26
6 Wipro 993 IndusInd Bank 73 Axis Bank 10 26
7 Sun Pharma 958 HCL Technologies 69 HDFC Bank 10 26
8 Tata Motors 945 Aurobindo Pharma 68 M & M 10 24
9 H D F C 934 Havells India 67 Bosch 10 23
10 HCL Technologies 898 Ipca Labs 67 Nestle India 10 23
TOP 10 WEALTH CREATORS (2009-2014)
100xThe power of growth in Wealth Creation
19th Annual Wealth Creation Study (2009-2014)
Motilal Oswal 19th Annual Wealth Creation Study 100x: The power of growth in Wealth Creation
Page
Wealth Creation Study: Objective, Concept & Methodology ....................... 1
Wealth Creation 2009-14: Findings Summary ............................................ 2-3
Theme 2015: 100x – The power of growth in Wealth Creation .............. 4-23
Market Outlook ....................................................................................... 24-27
Wealth Creation 2009-14: Findings ........................................................ 28-38
Appendix I: MOSL 100 – Biggest Wealth Creators ................................. 39-40
Appendix I: MOSL 100 – Fastest Wealth Creators ................................. 41-42
Appendix III: MOSL 100 – Wealth Creators (alphabetical) ......................... 43
Abbreviations and Terms used in this report
Abbreviation / Term Description 2009, 2014, etc Reference to years for India are financial year ending March, unless otherwise stated
Avg Average
CAGR Compound Annual Growth Rate
L to P / P to L Loss to Profit / Profit to Loss. In such cases, calculation of PAT CAGR is not possible
INR b Indian Rupees in billion
Price CAGR In the case of aggregates, Price CAGR refers to Market Cap CAGR
WC Wealth Created
Wealth Created Increase in Market Capitalization over the last 5 years, duly adjusted for corporate events such as fresh equity issuance, mergers, demergers, share buybacks, etc.
Note: Capitaline database has been used for this study. Source of all exhibits is MOSL analysis, unless otherwise stated
12 December 2014 1
19th Annual Wealth Creation Study (2009-2014)
Wealth Creation Study Objective, Concept & Methodology
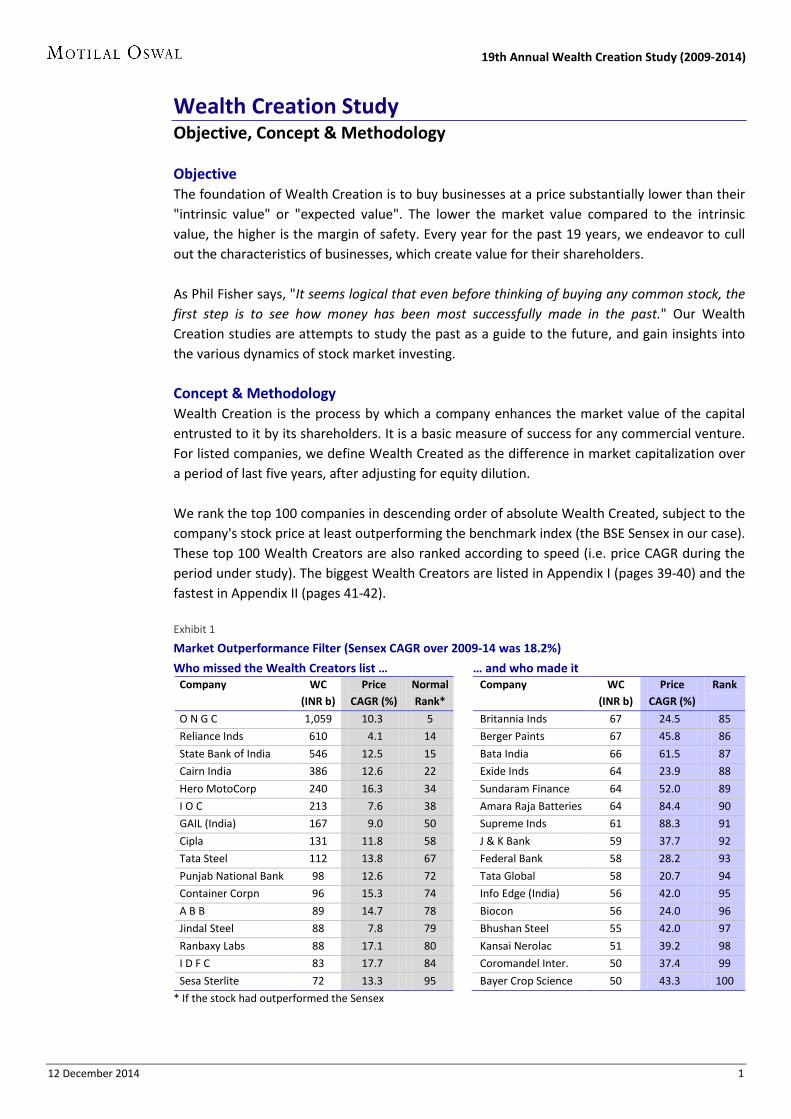
Objective The foundation of Wealth Creation is to buy businesses at a price substantially lower than their "intrinsic value" or "expected value". The lower the market value compared to the intrinsic value, the higher is the margin of safety. Every year for the past 19 years, we endeavor to cull out the characteristics of businesses, which create value for their shareholders. As Phil Fisher says, "It seems logical that even before thinking of buying any common stock, the first step is to see how money has been most successfully made in the past." Our Wealth Creation studies are attempts to study the past as a guide to the future, and gain insights into the various dynamics of stock market investing. Concept & Methodology Wealth Creation is the process by which a company enhances the market value of the capital entrusted to it by its shareholders. It is a basic measure of success for any commercial venture. For listed companies, we define Wealth Created as the difference in market capitalization over a period of last five years, after adjusting for equity dilution. We rank the top 100 companies in descending order of absolute Wealth Created, subject to the company's stock price at least outperforming the benchmark index (the BSE Sensex in our case). These top 100 Wealth Creators are also ranked according to speed (i.e. price CAGR during the period under study). The biggest Wealth Creators are listed in Appendix I (pages 39-40) and the fastest in Appendix II (pages 41-42). Exhibit 1
Market Outperformance Filter (Sensex CAGR over 2009-14 was 18.2%)
Who missed the Wealth Creators list … … and who made it Company WC
(INR b) Price
CAGR (%) Normal Rank*
Company WC (INR b)
Price CAGR (%)
Rank
O N G C 1,059 10.3 5 Britannia Inds 67 24.5 85
Reliance Inds 610 4.1 14 Berger Paints 67 45.8 86
State Bank of India 546 12.5 15 Bata India 66 61.5 87
Cairn India 386 12.6 22 Exide Inds 64 23.9 88
Hero MotoCorp 240 16.3 34 Sundaram Finance 64 52.0 89
I O C 213 7.6 38 Amara Raja Batteries 64 84.4 90
GAIL (India) 167 9.0 50 Supreme Inds 61 88.3 91
Cipla 131 11.8 58 J & K Bank 59 37.7 92
Tata Steel 112 13.8 67 Federal Bank 58 28.2 93
Punjab National Bank 98 12.6 72 Tata Global 58 20.7 94
Container Corpn 96 15.3 74 Info Edge (India) 56 42.0 95
A B B 89 14.7 78 Biocon 56 24.0 96
Jindal Steel 88 7.8 79 Bhushan Steel 55 42.0 97
Ranbaxy Labs 88 17.1 80 Kansai Nerolac 51 39.2 98
I D F C 83 17.7 84 Coromandel Inter. 50 37.4 99
Sesa Sterlite 72 13.3 95 Bayer Crop Science 50 43.3 100
* If the stock had outperformed the Sensex
12 December 2014 2
19th Annual Wealth Creation Study (2009-2014)
Wealth Creation 2009-2014 Findings Summary
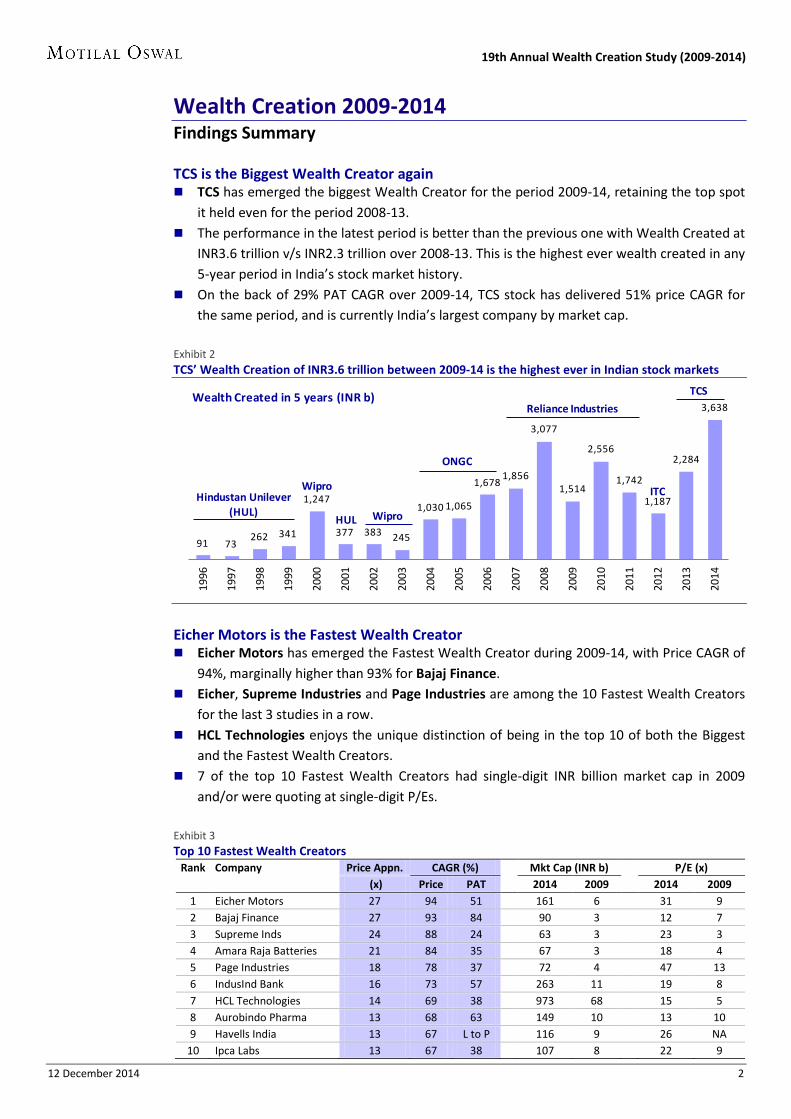
TCS is the Biggest Wealth Creator again TCS has emerged the biggest Wealth Creator for the period 2009-14, retaining the top spot
it held even for the period 2008-13. The performance in the latest period is better than the previous one with Wealth Created at
INR3.6 trillion v/s INR2.3 trillion over 2008-13. This is the highest ever wealth created in any 5-year period in India’s stock market history.
On the back of 29% PAT CAGR over 2009-14, TCS stock has delivered 51% price CAGR for the same period, and is currently India’s largest company by market cap.
Exhibit 2 TCS’ Wealth Creation of INR3.6 trillion between 2009-14 is the highest ever in Indian stock markets
Eicher Motors is the Fastest Wealth Creator Eicher Motors has emerged the Fastest Wealth Creator during 2009-14, with Price CAGR of
94%, marginally higher than 93% for Bajaj Finance. Eicher, Supreme Industries and Page Industries are among the 10 Fastest Wealth Creators
for the last 3 studies in a row. HCL Technologies enjoys the unique distinction of being in the top 10 of both the Biggest
and the Fastest Wealth Creators. 7 of the top 10 Fastest Wealth Creators had single-digit INR billion market cap in 2009
and/or were quoting at single-digit P/Es.
Exhibit 3 Top 10 Fastest Wealth Creators
Rank Company Price Appn. CAGR (%) Mkt Cap (INR b) P/E (x) (x) Price PAT 2014 2009 2014 2009 1 Eicher Motors 27 94 51
161 6
31 9
2 Bajaj Finance 27 93 84 90 3 12 7 3 Supreme Inds 24 88 24 63 3 23 3 4 Amara Raja Batteries 21 84 35 67 3 18 4 5 Page Industries 18 78 37 72 4 47 13 6 IndusInd Bank 16 73 57 263 11 19 8 7 HCL Technologies 14 69 38 973 68 15 5 8 Aurobindo Pharma 13 68 63 149 10 13 10 9 Havells India 13 67 L to P 116 9 26 NA
10 Ipca Labs 13 67 38 107 8 22 9
91 73262 341
1,247
377 383 245
1,030 1,065
1,6781,856
3,077
1,514
2,556
1,742
1,187
2,284
3,638
1996
1997
1998
1999
2000
2001
2002
2003
2004
2005
2006
2007
2008
2009
2010
2011
2012
2013
2014
Hindustan Unilever(HUL)
Wipro
HUL Wipro
ONGC
Reliance Industries
ITC
TCSWealth Created in 5 years (INR b)
12 December 2014 3
19th Annual Wealth Creation Study (2009-2014)
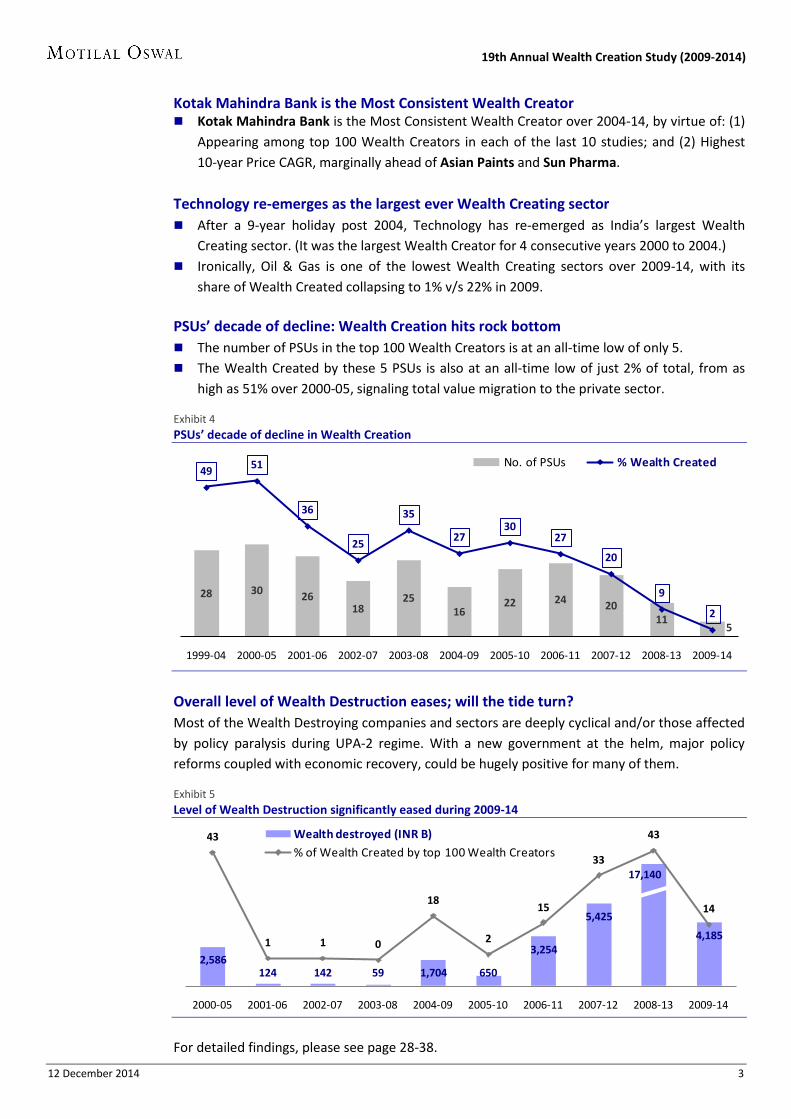
Kotak Mahindra Bank is the Most Consistent Wealth Creator Kotak Mahindra Bank is the Most Consistent Wealth Creator over 2004-14, by virtue of: (1)
Appearing among top 100 Wealth Creators in each of the last 10 studies; and (2) Highest 10-year Price CAGR, marginally ahead of Asian Paints and Sun Pharma.
Technology re-emerges as the largest ever Wealth Creating sector After a 9-year holiday post 2004, Technology has re-emerged as India’s largest Wealth
Creating sector. (It was the largest Wealth Creator for 4 consecutive years 2000 to 2004.) Ironically, Oil & Gas is one of the lowest Wealth Creating sectors over 2009-14, with its
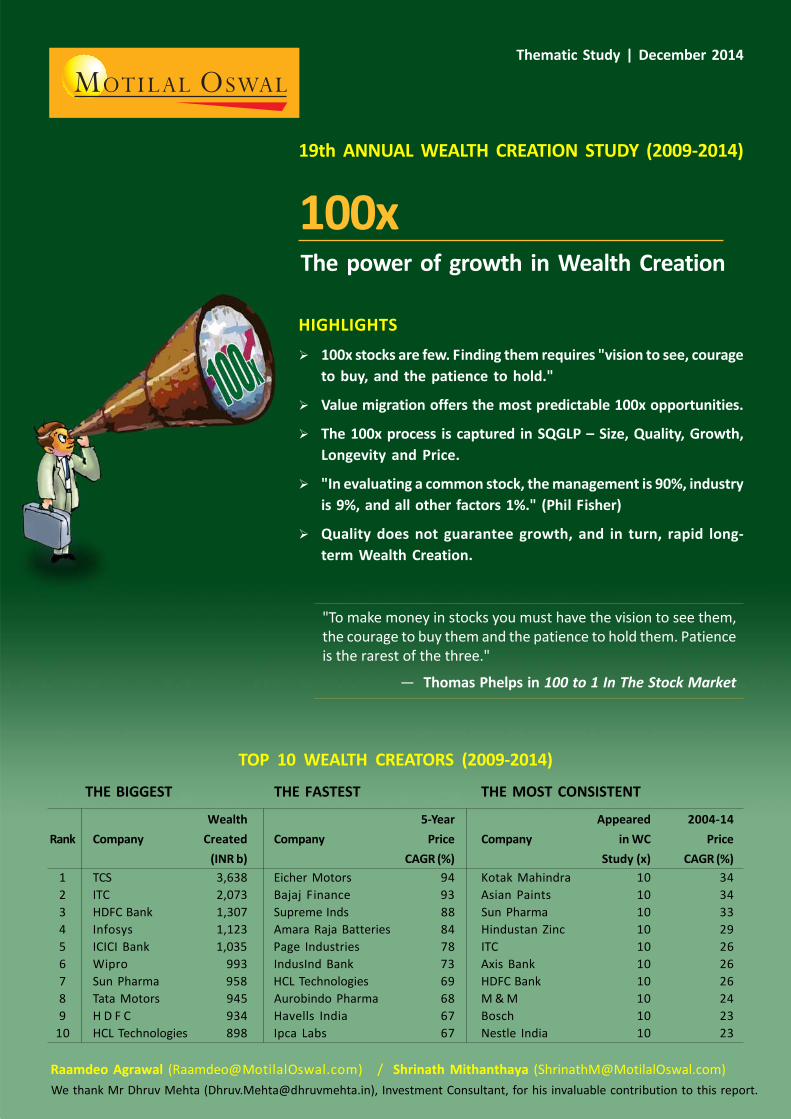
share of Wealth Created collapsing to 1% v/s 22% in 2009. PSUs’ decade of decline: Wealth Creation hits rock bottom The number of PSUs in the top 100 Wealth Creators is at an all-time low of only 5. The Wealth Created by these 5 PSUs is also at an all-time low of just 2% of total, from as
high as 51% over 2000-05, signaling total value migration to the private sector.
Exhibit 4 PSUs’ decade of decline in Wealth Creation
Overall level of Wealth Destruction eases; will the tide turn? Most of the Wealth Destroying companies and sectors are deeply cyclical and/or those affected by policy paralysis during UPA-2 regime. With a new government at the helm, major policy reforms coupled with economic recovery, could be hugely positive for many of them.
Exhibit 5 Level of Wealth Destruction significantly eased during 2009-14
For detailed findings, please see page 28-38.
28 30 2618
2516
22 24 2011
5
49 51
36
25
35
2730
27
20
9
2
1999-04 2000-05 2001-06 2002-07 2003-08 2004-09 2005-10 2006-11 2007-12 2008-13 2009-14
No. of PSUs % Wealth Created
2,586124 142 59 1,704 650
3,254
5,425
17,140
4,185
43
1 1 0
18
2
15
33
43
14
2000-05 2001-06 2002-07 2003-08 2004-09 2005-10 2006-11 2007-12 2008-13 2009-14
Wealth destroyed (INR B)% of Wealth Created by top 100 Wealth Creators
12 December 2014 4
19th Annual Wealth Creation Study (2009-2014)
Theme 2015
12 December 2014 5
19th Annual Wealth Creation Study (2009-2014)
100x The power of growth in Wealth Creation
Acknowledgment This report would most likely have been titled “Demystifying growth” … and then we came across this book “100 To 1 In The Stock Market” by Thomas W Phelps who is described as having been a private investor, columnist, analyst, author and financial advisor.
Written in 1972, the book makes a strong case for investors to “Buy right and hold on”. It offers examples of how in the US, over 365 stocks appreciated 100x or more over the 40 years ending 1971. We believe “100 to 1” is an excellent concept to apply our understanding of growth.
The “100 To 1” book is common sensical, conversational, and chucklesome (Sample this: “Unlike dogs, not every stock has its day. In fact, in Wall Street, a stock that does not have its day is called a dog!” And this: “Most deception is bad but self-deception is worse because it is done to such a nice guy!”)
We dedicate “100x” as a contemporary complement to this classic, and as our commemorative compliment to the late author (who passed away in November 1992 at the age of 90.)
1. What is 100x? Opening the mind to the magic of long-term growth investing To make money in stocks you must have the vision to see them, the courage to buy them and the patience to hold them. Patience is the rarest of the three. – Thomas Phelps in 100 to 1 In The Stock Market For the purposes of this report, “100x” refers to stock prices rising 100-fold over time i.e. “100-baggers” in stock market jargon. Both the short words here are important – “100-fold” and “over time”.
1.1 “100-fold”: Accumulating massive purchasing power The precise number of “100” is not as important as the fact that 100x opens the mind to the concept of long-term power of compounding in equity investing. Warren Buffett describes investing as the process of gaining higher purchasing power over time (i.e. net of inflation and taxes). In fixed income investing, the average annual post-tax return works out to about 7%. If the same is reinvested, over 20 years, the security would be worth about 4x its original value. Now, if inflation also turns out to be 7%, then at the end of 20 years, there is zero increase in purchasing power. Even if inflation is somewhat lower at 5%, it erodes 2.7x of the 4x final value, leaving a net purchasing power of only 1.5x (i.e. 50% higher over 20 years or 2% per annum).
12 December 2014 6
19th Annual Wealth Creation Study (2009-2014)
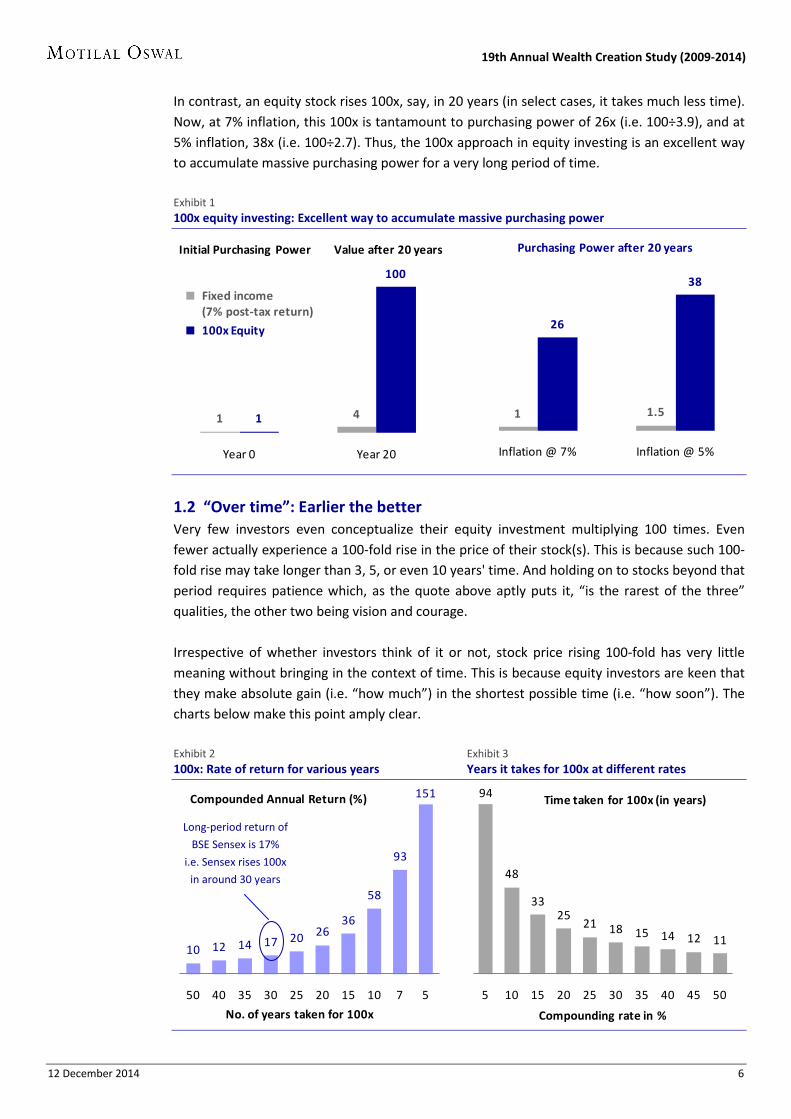
In contrast, an equity stock rises 100x, say, in 20 years (in select cases, it takes much less time). Now, at 7% inflation, this 100x is tantamount to purchasing power of 26x (i.e. 100÷3.9), and at 5% inflation, 38x (i.e. 100÷2.7). Thus, the 100x approach in equity investing is an excellent way to accumulate massive purchasing power for a very long period of time. Exhibit 1 100x equity investing: Excellent way to accumulate massive purchasing power
1.2 “Over time”: Earlier the better Very few investors even conceptualize their equity investment multiplying 100 times. Even fewer actually experience a 100-fold rise in the price of their stock(s). This is because such 100-fold rise may take longer than 3, 5, or even 10 years' time. And holding on to stocks beyond that period requires patience which, as the quote above aptly puts it, “is the rarest of the three” qualities, the other two being vision and courage. Irrespective of whether investors think of it or not, stock price rising 100-fold has very little meaning without bringing in the context of time. This is because equity investors are keen that they make absolute gain (i.e. “how much”) in the shortest possible time (i.e. “how soon”). The charts below make this point amply clear. Exhibit 2 Exhibit 3 100x: Rate of return for various years Years it takes for 100x at different rates
1 41
100
Year 0 Year 20
Fixed income(7% post-tax return)
100x Equity
Initial Purchasing Power Value after 20 years
1 1.5
26
38
Inflation @ 7% Inflation @ 5%
Purchasing Power after 20 years
151
93
58
36262017141210
571015202530354050
No. of years taken for 100x
Compounded Annual Return (%) 94
48
3325
21 18 15 14 12 11
5 10 15 20 25 30 35 40 45 50
Compounding rate in %
Time taken for 100x (in years)
Long-period return of
BSE Sensex is 17%
i.e. Sensex rises 100x
in around 30 years
12 December 2014 7
19th Annual Wealth Creation Study (2009-2014)
Going by Exhibit 1, if 100x takes 50 years, the effective annual return is only 10%, if 40 years 12%, and so on. In the Indian context, the long-period return of the benchmark indices is ~17%. Thus, if a stock takes more than 30 years to rise 100-fold, it would most likely end up underperforming the market. Given this, even those investors with long-term outlook and patience should reject such slow-growth 100x ideas. We postulate (and later even prove arithmetically) that the single-most important time determinant of stock market return is GROWTH in all its dimensions – sales, margin and valuation. And once having gained insightful understanding of growth, especially long-term growth, 100x is arguably its best application. As in the US, real-life experience in India also suggests that the task of finding 100x stocks is indeed difficult but not impossible. Once sensitized to such a possibility and armed with the right framework, investors may find the challenge of unearthing the next 100-bagger more joyous than arduous.
2. 100x: The Indian experience 47 enduring 100-baggers during the last 20 years
Transitory multi-baggers attract a lot of crowd and media attention, but they always give nasty end-results. Deep cyclicals and fad companies broadly fit into this category. The tragedy with this class of companies is that if you cannot sell in time, you are left with no gains, and most often, with a permanent capital loss.
Enduring multi-baggers are those companies, whose wealth creation is long-lasting. Great businesses run by good managements purchased at huge ‘margin of safety’ will create enduring multi-baggers.
– Motilal Oswal 8th Wealth Creation Study, January 2004 In effect, this 100x study in year 2014 may well be a decadal dusting, digitizing, and detailing of our own 8th Wealth Creation Study in 2004 which discussed multi-baggers! The digit is the number 100, while the detail is the S-QGLP framework discussed later.
2.1 Indian market benchmarks rise 100x in 30 years The BSE Sensex has a base of 100 for the year 1979. The Sensex first touched 10,000 in February 2006 i.e. 100x in 27 years (almost 19% CAGR). As of March 2014, the Sensex stood at 22,400 levels. It was at 224-levels in 1984 i.e. 100x in 30 years (CAGR of 17%). Given such strong performance of the benchmark indices itself, smart investors should target to beat the benchmark and achieve 100x in 20 years at most (i.e. CAGR of 26%). As shown later, data suggests that 100x stocks take on average 12 years to rise 100-fold.
2.2 Transitory and enduring 100x stocks in India Our analysis in this study spans a 20-year time window ending March 2014. During this period, the Indian stock markets have seen at least two distinct “fad” and “cyclical” phases – (1) The ICE Age (IT, Communication, Entertainment) in the early 2000s, and (2) The 2003-08 global
12 December 2014 8
19th Annual Wealth Creation Study (2009-2014)
liquidity-led boom in commodities and cyclicals. These two phases have created two kinds of 100x stories here: 1. Transitory 100x: These are stocks which did indeed rise 100-fold sometime during 1994-
2014, only to fizzle out, “most often, with a permanent capital loss”. The ones remembered to-date by many investors would include several IT companies (Satyam Computer, Pentafour Software, SSI, NIIT, etc), Unitech, Mercator, Jai Corp, and so on. Our calculations suggest just over a 100 such transitory 100-baggers.
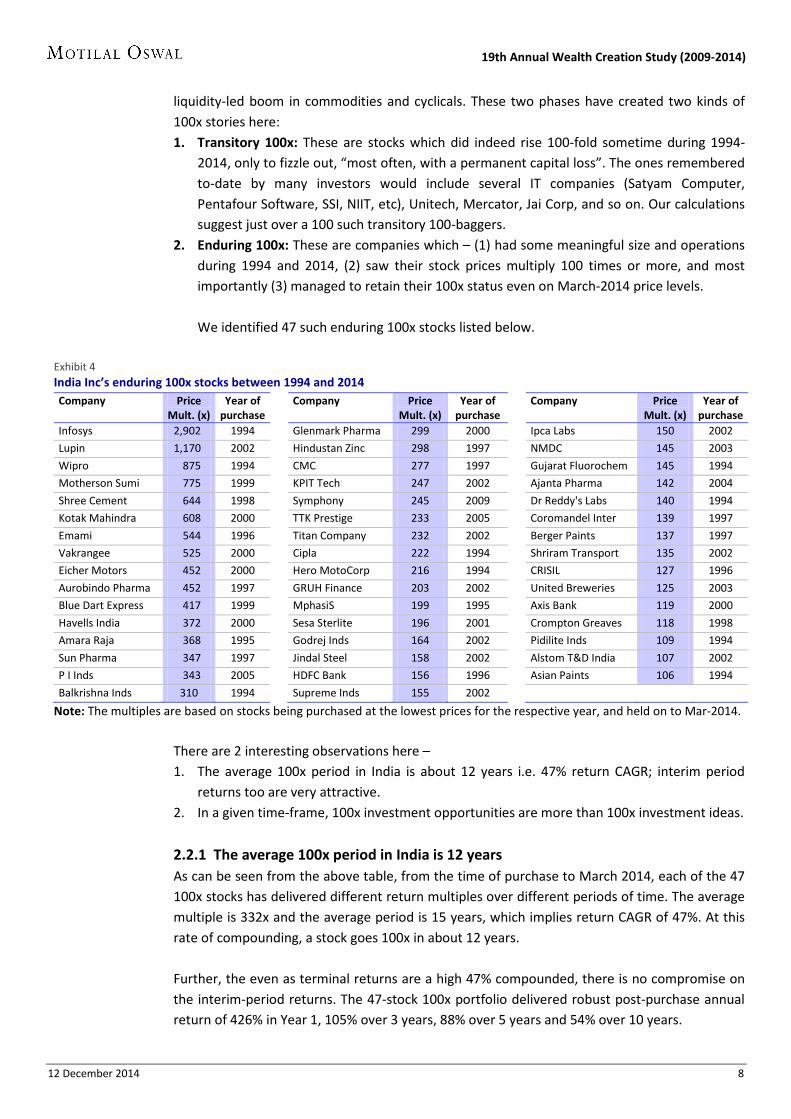
2. Enduring 100x: These are companies which – (1) had some meaningful size and operations during 1994 and 2014, (2) saw their stock prices multiply 100 times or more, and most importantly (3) managed to retain their 100x status even on March-2014 price levels. We identified 47 such enduring 100x stocks listed below.
Exhibit 4 India Inc’s enduring 100x stocks between 1994 and 2014 Company Price
Mult. (x) Year of
purchase
Company Price Mult. (x)
Year of purchase
Company Price Mult. (x)
Year of purchase
Infosys 2,902 1994
Glenmark Pharma 299 2000
Ipca Labs 150 2002
Lupin 1,170 2002
Hindustan Zinc 298 1997
NMDC 145 2003
Wipro 875 1994
CMC 277 1997
Gujarat Fluorochem 145 1994
Motherson Sumi 775 1999
KPIT Tech 247 2002
Ajanta Pharma 142 2004
Shree Cement 644 1998
Symphony 245 2009
Dr Reddy's Labs 140 1994
Kotak Mahindra 608 2000
TTK Prestige 233 2005
Coromandel Inter 139 1997
Emami 544 1996
Titan Company 232 2002
Berger Paints 137 1997
Vakrangee 525 2000
Cipla 222 1994
Shriram Transport 135 2002
Eicher Motors 452 2000
Hero MotoCorp 216 1994
CRISIL 127 1996
Aurobindo Pharma 452 1997
GRUH Finance 203 2002
United Breweries 125 2003
Blue Dart Express 417 1999
MphasiS 199 1995
Axis Bank 119 2000
Havells India 372 2000
Sesa Sterlite 196 2001
Crompton Greaves 118 1998
Amara Raja 368 1995
Godrej Inds 164 2002
Pidilite Inds 109 1994
Sun Pharma 347 1997
Jindal Steel 158 2002
Alstom T&D India 107 2002
P I Inds 343 2005
HDFC Bank 156 1996
Asian Paints 106 1994
Balkrishna Inds 310 1994
Supreme Inds 155 2002
Note: The multiples are based on stocks being purchased at the lowest prices for the respective year, and held on to Mar-2014.
There are 2 interesting observations here – 1. The average 100x period in India is about 12 years i.e. 47% return CAGR; interim period
returns too are very attractive. 2. In a given time-frame, 100x investment opportunities are more than 100x investment ideas.
2.2.1 The average 100x period in India is 12 years As can be seen from the above table, from the time of purchase to March 2014, each of the 47 100x stocks has delivered different return multiples over different periods of time. The average multiple is 332x and the average period is 15 years, which implies return CAGR of 47%. At this rate of compounding, a stock goes 100x in about 12 years. Further, the even as terminal returns are a high 47% compounded, there is no compromise on the interim-period returns. The 47-stock 100x portfolio delivered robust post-purchase annual return of 426% in Year 1, 105% over 3 years, 88% over 5 years and 54% over 10 years.
12 December 2014 9
19th Annual Wealth Creation Study (2009-2014)
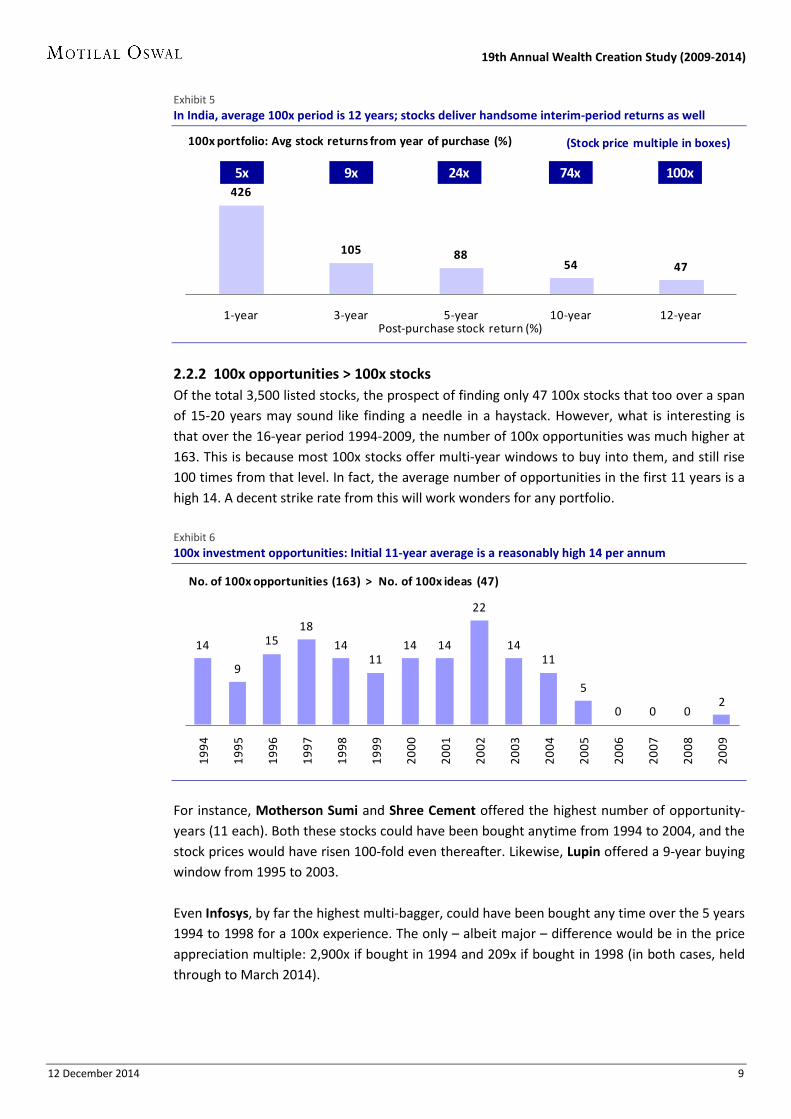
Exhibit 5 In India, average 100x period is 12 years; stocks deliver handsome interim-period returns as well
2.2.2 100x opportunities > 100x stocks Of the total 3,500 listed stocks, the prospect of finding only 47 100x stocks that too over a span of 15-20 years may sound like finding a needle in a haystack. However, what is interesting is that over the 16-year period 1994-2009, the number of 100x opportunities was much higher at 163. This is because most 100x stocks offer multi-year windows to buy into them, and still rise 100 times from that level. In fact, the average number of opportunities in the first 11 years is a high 14. A decent strike rate from this will work wonders for any portfolio. Exhibit 6 100x investment opportunities: Initial 11-year average is a reasonably high 14 per annum
For instance, Motherson Sumi and Shree Cement offered the highest number of opportunity-years (11 each). Both these stocks could have been bought anytime from 1994 to 2004, and the stock prices would have risen 100-fold even thereafter. Likewise, Lupin offered a 9-year buying window from 1995 to 2003. Even Infosys, by far the highest multi-bagger, could have been bought any time over the 5 years 1994 to 1998 for a 100x experience. The only – albeit major – difference would be in the price appreciation multiple: 2,900x if bought in 1994 and 209x if bought in 1998 (in both cases, held through to March 2014).
426
105 8854 47
1-year 3-year 5-year 10-year 12-yearPost-purchase stock return (%)
100x portfolio: Avg stock returns from year of purchase (%) (Stock price multiple in boxes)
5x 9x 24x 74x 100x
14
9
1518
1411
14 14
22
1411
5
0 0 02
1994
1995
1996
1997
1998
1999
2000
2001
2002
2003
2004
2005
2006
2007
2008
2009
No. of 100x opportunities (163) > No. of 100x ideas (47)

12 December 2014 10
19th Annual Wealth Creation Study (2009-2014)
Exhibit 7 100x stocks present multi-year window of opportunity to buy and own them Time window
(years) Stocks Time window
(years) Stocks
11 Motherson Sumi, Shree Cement
6 Sun Pharma, Amara Raja 9 Lupin
5 Infosys, Wipro, Sesa, Havells
8 Kotak Mahindra
4 Aurobindo, Hero MotoCorp, Eicher Motors 7 Godrej Inds, Hind Zinc, Titan 3 CRISIL, Gujarat Fluorochem, Balkrishna Inds,
Jindal Steel, United Breweries, GRUH, Ipca, Glenmark, Vakrangee
As investors, the key takeaway from this is that we need not worry even if we have missed a multi-fold price rise in a potential 100x by not buying into it 1, 2 or even 5 years ago. In other words, when it comes to 100x stocks “it is dawn when you wake up!” Or more accurately, “when the 100x idea dawns on you, simply wake up and buy the stock!” Unlike the worm which goes only to the early bird, the 100x stock is likely to feed handsome returns even to late risers! Only one check is needed before it is finally pecked (read picked!): Does the stock still carry the essence of 100x? The next section provides a SQGLP checklist to help answer this question.
3. The essence of 100x Alchemy of SQGLP (Size, Quality, Growth, Longevity, Price)
Alchemy — the medieval forerunner of chemistry, concerned with the transmutation of base metals like lead and copper into gold.
Our analysis of the 100x stocks suggests that their essence lies in the alchemy of 5 elements forming the acronym SQGLP – Size (of company), Quality (of business and management), Growth (in earnings), Longevity (of both quality & growth) and Price (favorable valuation). We discuss each of these 100x essential elements in the following sections.
Exhibit 8 SQGLP: At a glance
Element 100x Feature Checklist criteria
S – Size Company should be small and relatively unknown
• Small size, ideally both in terms of sales & market cap
• Low analyst coverage & institutional holding
• Low traded volumes
Q – Quality Quality of business • Large existing or potential profit pool • Favorable competitive landscape • Potential for above cost-of-capital returns
Quality of management • Unquestionable integrity
• Demonstrable competence • Growth mindset
G – Growth Growth in earnings • Multiplicative interplay of growth in (1) Sales volume and/or (2) Selling Price and/or (3) Margin.
L – Longevity Longevity of quality & growth • Assess the company’s CAP (competitive advantage period)
• Check whether growth is reverting to mean or not
P – Price Favorable valuation • Ideally, enough room for valuation re-rating
12 December 2014 11
19th Annual Wealth Creation Study (2009-2014)
4. 100x Element #1: S – Size
“The company should be small and relatively unknown”
A fast-growing company must be small. Sheer size militates against great growth. – Thomas Phelps in 100 to 1 In The Stock Market
You've got to think about big things while you're doing small things, so that all the small things go in the right direction. – Alvin Toffler, American writer and futurist
4.1 Size is a key driver of the low-base effect The focus on size is the first and foremost differentiator of the 100x investing approach over any other. In effect, this approach attempts to take full advantage of what is known in economics as the “low-base effect” i.e. the tendency of a small absolute change from a low initial amount to be translated into a large percentage change. As can be seen from the examples below, the low-base effect plays out both in investing and in business.
Low-base effect: Elementary examples In investing: Stock A priced at INR100 rising to INR140 (absolute gain INR40) is nowhere close to Stock B priced at INR20 rising to INR40 (absolute gain only INR20). The percentage gain in the former is 40%, which is much lower than the latter’s 100%. If indeed the objective is to earn INR40, all that investors need to do is buy TWO stocks of B. This would earn INR40 by investing only INR40 compared to the INR100 invested in Stock B. In business: If company SmallCo with INR1 million sales wants to grow 100-fold, it needs additional sales of INR99 million. But for even a high-growth company like Infosys to now grow 100-fold would require additional sales which is 99 times its FY14 sales of INR500 billion i.e. INR49,500 billion! Of course, this too may happen but is likely to take much longer time than for SmallCo to reach INR100m.
4.2 Two dimensions of size: Revenue and Market Cap In common parlance, size of a company is usually associated with the revenue it generates. However, from the perspective of equity investment, even market cap size is important as the same low-base effect works here too.
Also, at times, it is possible that a fast-growing company may be smaller than average in terms of revenue, but may have a bigger-than-average market cap due to widespread investor attention. This is where the characteristic of “relatively unknown” becomes relevant. The more unknown the stock the lower the chances of its prospects already being priced in by way of high market cap, hampering the full play of low-base effect. Size apart, the other key indicators to determine “relative unknown-ness” include – (1) Low institutional holding, (2) Low number of brokerage analysts covering the stock, and (3) Relatively low traded volumes.
4.3 “Small & unknown”: 100x stocks findings & takeaway therefrom • The average revenue of 100x companies in the year of purchase was about INR3 billion;
only 3 of the 47 companies (Crompton, Godrej Industries, NMDC) had revenue in double-digit billion.

12 December 2014 12
19th Annual Wealth Creation Study (2009-2014)
• Average market cap was INR2.5 billion; only one company (NMDC) had double-digit billion market cap.
• Average P/E was 6x, confirming no major investor fancy. KEY TAKEAWAY: Consider growth in the economy, inflation, stock market levels, etc, the
hunting ground for potential 100x stocks should be companies with market cap not significantly exceeding USD0.5 billion or INR30 billion.
The relatively small & unknown Infosys grows big in just 5 years! In 1994, Infosys’ revenue was INR290m, 0.1% of the then largest turnover company, IOC. Even five years later, Infosys was barely 0.5% the size of IOC. And yet, in the meanwhile, it clocked revenue CAGR of 73% whereas IOC could manage 25% CAGR. Likewise, in market cap terms, Infosys in 1994 was 11% of then largest company SAIL. In 5 years, its market cap had expanded to 74% of the then leader (ONGC). In effect, India’s highest market cap just about doubled in 5 years, while Infosys’ market cap rose 13-fold. Exhibit 9 For 100x investing, small is beautiful!
INR m 1994 1995 1996 1997 1998 1994-98 Mult. (x) CAGR (%) Sales
Largest company 214,616 353,923 428,960 554,826 523,508 2.4 25 Infosys 290 554 886 1,392 2,577 8.9 73
% to largest co. 0.1 0.2 0.2 0.3 0.5 Market Cap
Largest company 19,929 13,552 30,230 29,410 39,684 2.0 19 Infosys 2,178 3,449 3,594 7,309 29,281 13.4 91
% to largest co. 11 25 12 25 74
5. 100x Element #2: Q – Quality “Quality of business + Quality of management”
The quality of an organization can never exceed the quality of the minds that make it up. – Harold R McAlindon, American author, writer, management speaker Bet on men and organizations fired by zeal to meet human wants and needs, imbued with enthusiasm over solving mankind’s problems. Good intentions are not enough, but when combined with energy and intelligence the results make it unnecessary to seek profits. They come as a serendipity dividend on a well-managed quest for a better world.
– Thomas Phelps in 100 to 1 In The Stock Market There are two aspects to Q in SQGLP – (1) Quality of business and (2) Quality of management.
5.1 Quality of business Quality of business needs to be assessed for factors like existing or potential size of profit pool for the industry (and hence the company), competitive landscape, potential for sustained above cost-of-capital return on investment, etc.
12 December 2014 13
19th Annual Wealth Creation Study (2009-2014)
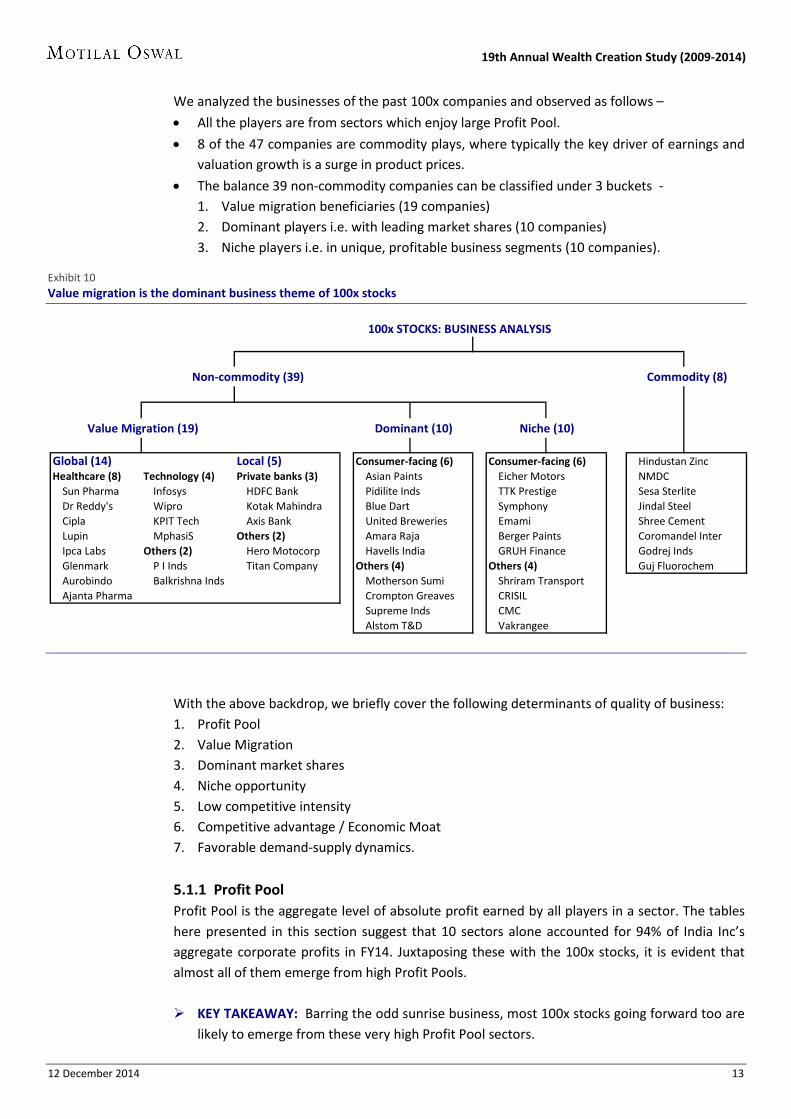
We analyzed the businesses of the past 100x companies and observed as follows –
• All the players are from sectors which enjoy large Profit Pool.
• 8 of the 47 companies are commodity plays, where typically the key driver of earnings and valuation growth is a surge in product prices.
• The balance 39 non-commodity companies can be classified under 3 buckets - 1. Value migration beneficiaries (19 companies) 2. Dominant players i.e. with leading market shares (10 companies) 3. Niche players i.e. in unique, profitable business segments (10 companies).
Exhibit 10 Value migration is the dominant business theme of 100x stocks
With the above backdrop, we briefly cover the following determinants of quality of business: 1. Profit Pool 2. Value Migration 3. Dominant market shares 4. Niche opportunity 5. Low competitive intensity 6. Competitive advantage / Economic Moat 7. Favorable demand-supply dynamics.
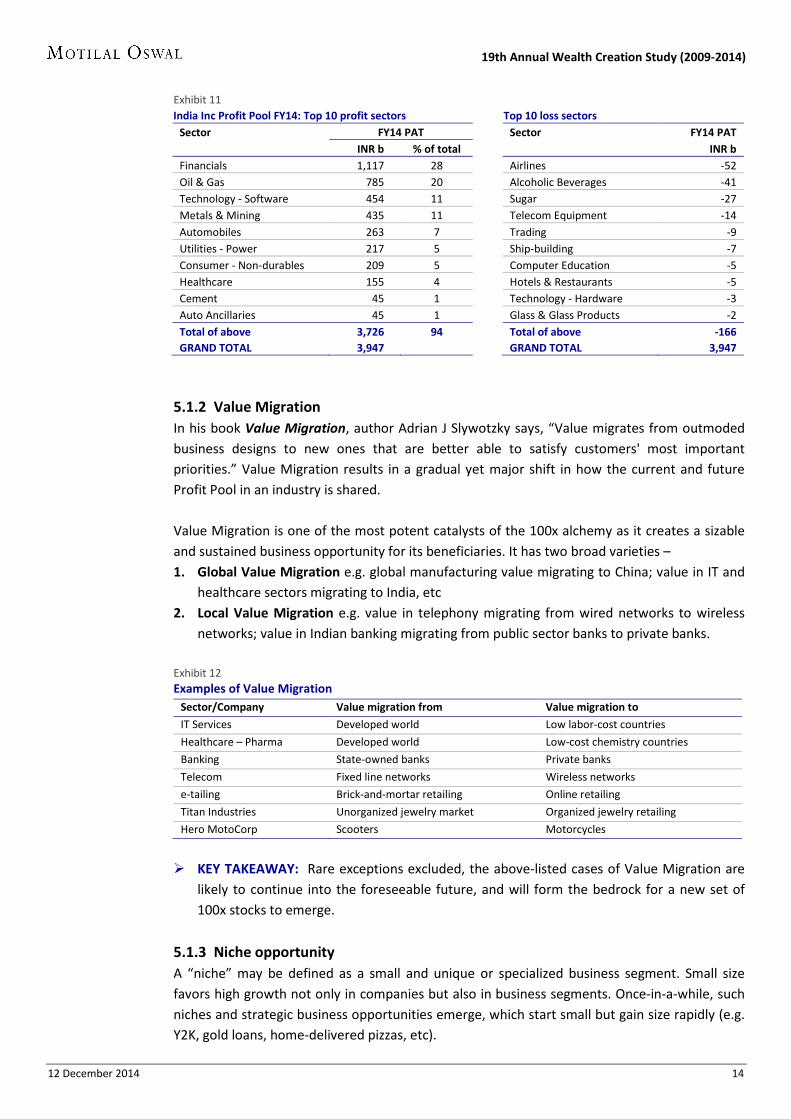
5.1.1 Profit Pool Profit Pool is the aggregate level of absolute profit earned by all players in a sector. The tables here presented in this section suggest that 10 sectors alone accounted for 94% of India Inc’s aggregate corporate profits in FY14. Juxtaposing these with the 100x stocks, it is evident that almost all of them emerge from high Profit Pools. KEY TAKEAWAY: Barring the odd sunrise business, most 100x stocks going forward too are
likely to emerge from these very high Profit Pool sectors.
100x STOCKS: BUSINESS ANALYSIS
Non-commodity (39) Commodity (8)
Value Migration (19) Dominant (10) Niche (10)
Global (14) Local (5) Consumer-facing (6) Consumer-facing (6) Hindustan ZincHealthcare (8) Technology (4) Private banks (3) Asian Paints Eicher Motors NMDC
Sun Pharma Infosys HDFC Bank Pidilite Inds TTK Prestige Sesa SterliteDr Reddy's Wipro Kotak Mahindra Blue Dart Symphony Jindal SteelCipla KPIT Tech Axis Bank United Breweries Emami Shree CementLupin MphasiS Others (2) Amara Raja Berger Paints Coromandel InterIpca Labs Others (2) Hero Motocorp Havells India GRUH Finance Godrej IndsGlenmark P I Inds Titan Company Others (4) Others (4) Guj FluorochemAurobindo Balkrishna Inds Motherson Sumi Shriram TransportAjanta Pharma Crompton Greaves CRISIL
Supreme Inds CMCAlstom T&D Vakrangee
12 December 2014 14
19th Annual Wealth Creation Study (2009-2014)
Exhibit 11 India Inc Profit Pool FY14: Top 10 profit sectors
Top 10 loss sectors
Sector FY14 PAT
Sector FY14 PAT INR b % of total
INR b
Financials 1,117 28
Airlines -52 Oil & Gas 785 20
Alcoholic Beverages -41
Technology - Software 454 11
Sugar -27 Metals & Mining 435 11
Telecom Equipment -14
Automobiles 263 7
Trading -9 Utilities - Power 217 5
Ship-building -7
Consumer - Non-durables 209 5
Computer Education -5 Healthcare 155 4
Hotels & Restaurants -5
Cement 45 1
Technology - Hardware -3 Auto Ancillaries 45 1
Glass & Glass Products -2
Total of above 3,726 94
Total of above -166 GRAND TOTAL 3,947
GRAND TOTAL 3,947
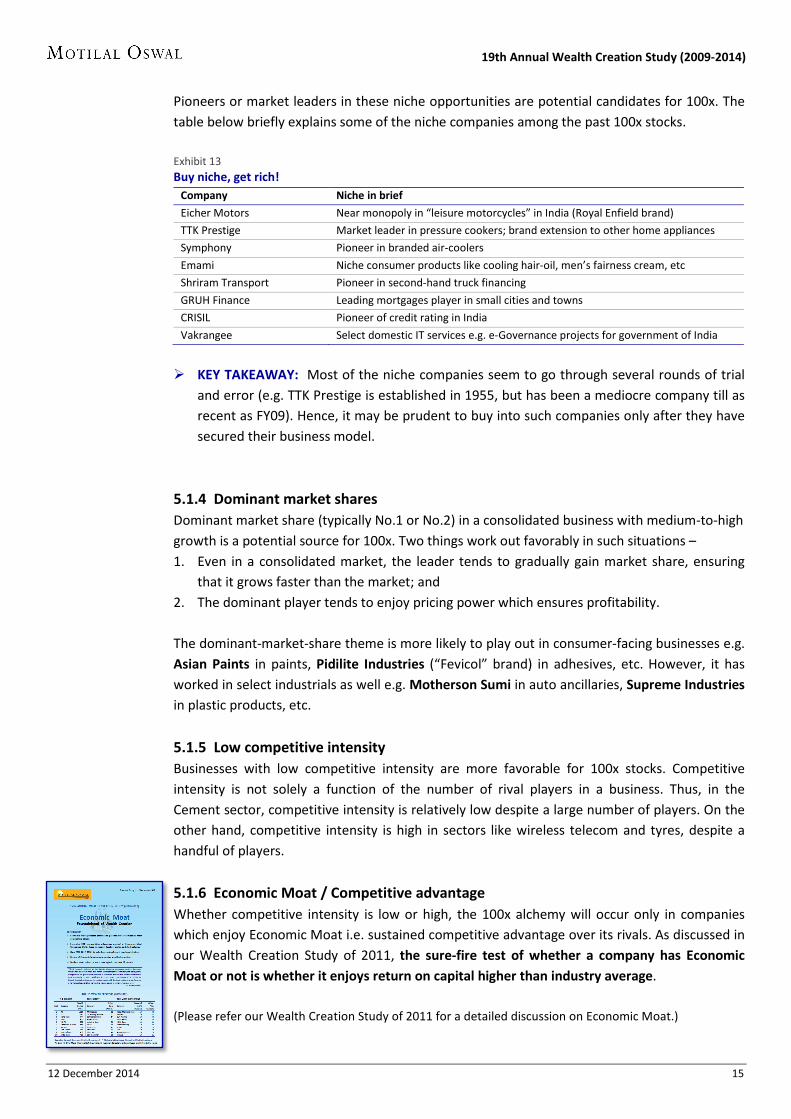
5.1.2 Value Migration In his book Value Migration, author Adrian J Slywotzky says, “Value migrates from outmoded business designs to new ones that are better able to satisfy customers' most important priorities.” Value Migration results in a gradual yet major shift in how the current and future Profit Pool in an industry is shared. Value Migration is one of the most potent catalysts of the 100x alchemy as it creates a sizable and sustained business opportunity for its beneficiaries. It has two broad varieties – 1. Global Value Migration e.g. global manufacturing value migrating to China; value in IT and
healthcare sectors migrating to India, etc 2. Local Value Migration e.g. value in telephony migrating from wired networks to wireless
networks; value in Indian banking migrating from public sector banks to private banks. Exhibit 12 Examples of Value Migration
Sector/Company Value migration from Value migration to
IT Services Developed world Low labor-cost countries
Healthcare – Pharma Developed world Low-cost chemistry countries
Banking State-owned banks Private banks
Telecom Fixed line networks Wireless networks
e-tailing Brick-and-mortar retailing Online retailing
Titan Industries Unorganized jewelry market Organized jewelry retailing
Hero MotoCorp Scooters Motorcycles
KEY TAKEAWAY: Rare exceptions excluded, the above-listed cases of Value Migration are
likely to continue into the foreseeable future, and will form the bedrock for a new set of 100x stocks to emerge.
5.1.3 Niche opportunity A “niche” may be defined as a small and unique or specialized business segment. Small size favors high growth not only in companies but also in business segments. Once-in-a-while, such niches and strategic business opportunities emerge, which start small but gain size rapidly (e.g. Y2K, gold loans, home-delivered pizzas, etc).
12 December 2014 15
19th Annual Wealth Creation Study (2009-2014)
Pioneers or market leaders in these niche opportunities are potential candidates for 100x. The table below briefly explains some of the niche companies among the past 100x stocks. Exhibit 13 Buy niche, get rich!
Company Niche in brief
Eicher Motors Near monopoly in “leisure motorcycles” in India (Royal Enfield brand)
TTK Prestige Market leader in pressure cookers; brand extension to other home appliances
Symphony Pioneer in branded air-coolers
Emami Niche consumer products like cooling hair-oil, men’s fairness cream, etc
Shriram Transport Pioneer in second-hand truck financing
GRUH Finance Leading mortgages player in small cities and towns
CRISIL Pioneer of credit rating in India
Vakrangee Select domestic IT services e.g. e-Governance projects for government of India
KEY TAKEAWAY: Most of the niche companies seem to go through several rounds of trial
and error (e.g. TTK Prestige is established in 1955, but has been a mediocre company till as recent as FY09). Hence, it may be prudent to buy into such companies only after they have secured their business model.
5.1.4 Dominant market shares Dominant market share (typically No.1 or No.2) in a consolidated business with medium-to-high growth is a potential source for 100x. Two things work out favorably in such situations – 1. Even in a consolidated market, the leader tends to gradually gain market share, ensuring
that it grows faster than the market; and 2. The dominant player tends to enjoy pricing power which ensures profitability. The dominant-market-share theme is more likely to play out in consumer-facing businesses e.g. Asian Paints in paints, Pidilite Industries (“Fevicol” brand) in adhesives, etc. However, it has worked in select industrials as well e.g. Motherson Sumi in auto ancillaries, Supreme Industries in plastic products, etc.
5.1.5 Low competitive intensity Businesses with low competitive intensity are more favorable for 100x stocks. Competitive intensity is not solely a function of the number of rival players in a business. Thus, in the Cement sector, competitive intensity is relatively low despite a large number of players. On the other hand, competitive intensity is high in sectors like wireless telecom and tyres, despite a handful of players.
5.1.6 Economic Moat / Competitive advantage Whether competitive intensity is low or high, the 100x alchemy will occur only in companies which enjoy Economic Moat i.e. sustained competitive advantage over its rivals. As discussed in our Wealth Creation Study of 2011, the sure-fire test of whether a company has Economic Moat or not is whether it enjoys return on capital higher than industry average. (Please refer our Wealth Creation Study of 2011 for a detailed discussion on Economic Moat.)
12 December 2014 16
19th Annual Wealth Creation Study (2009-2014)
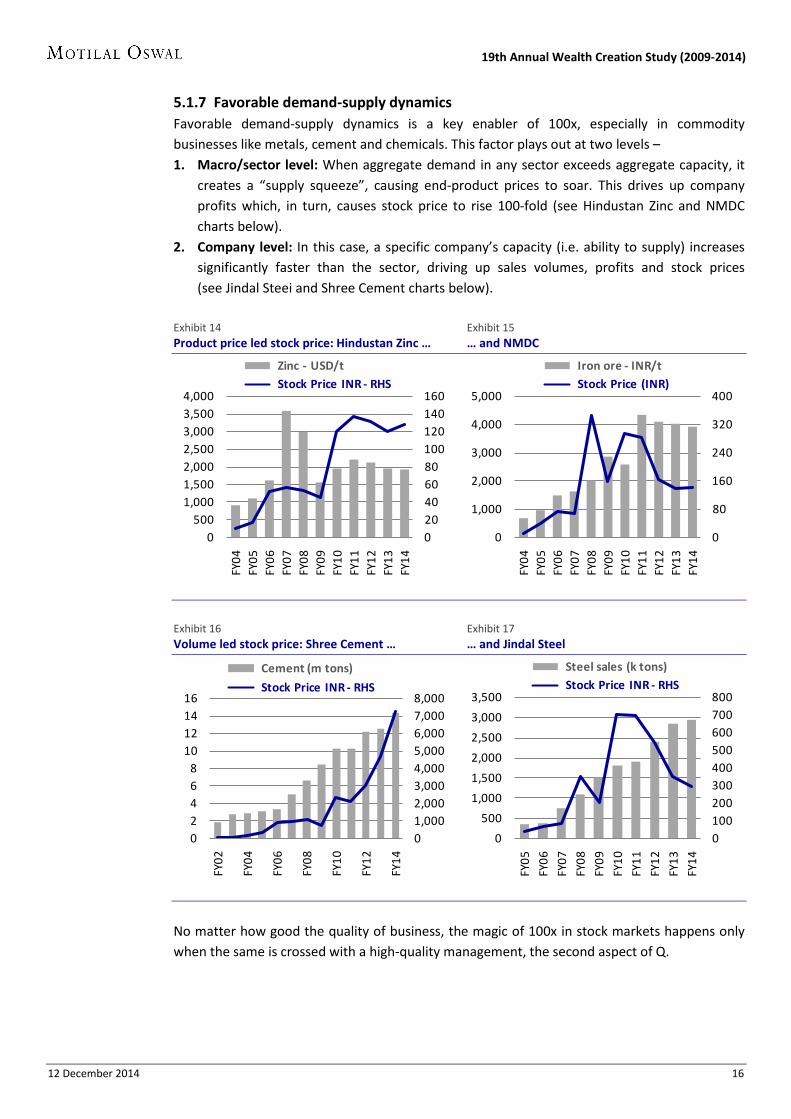
5.1.7 Favorable demand-supply dynamics Favorable demand-supply dynamics is a key enabler of 100x, especially in commodity businesses like metals, cement and chemicals. This factor plays out at two levels – 1. Macro/sector level: When aggregate demand in any sector exceeds aggregate capacity, it
creates a “supply squeeze”, causing end-product prices to soar. This drives up company profits which, in turn, causes stock price to rise 100-fold (see Hindustan Zinc and NMDC charts below).
2. Company level: In this case, a specific company’s capacity (i.e. ability to supply) increases significantly faster than the sector, driving up sales volumes, profits and stock prices (see Jindal Steei and Shree Cement charts below).
Exhibit 14 Exhibit 15 Product price led stock price: Hindustan Zinc … … and NMDC
Exhibit 16 Exhibit 17 Volume led stock price: Shree Cement … … and Jindal Steel
No matter how good the quality of business, the magic of 100x in stock markets happens only when the same is crossed with a high-quality management, the second aspect of Q.
020406080100120140160
0500
1,0001,5002,0002,5003,0003,5004,000
FY04
FY05
FY06
FY07
FY08
FY09
FY10
FY11
FY12
FY13
FY14
Zinc - USD/tStock Price INR - RHS
0
80
160
240
320
400
0
1,000
2,000
3,000
4,000
5,000
FY04
FY05
FY06
FY07
FY08
FY09
FY10
FY11
FY12
FY13
FY14
Iron ore - INR/tStock Price (INR)
01,0002,0003,0004,0005,0006,0007,0008,000
02468
10121416
FY02
FY04
FY06
FY08
FY10
FY12
FY14
Cement (m tons)
Stock Price INR - RHS
0100200300400500600700800
0
500
1,000
1,500
2,000
2,500
3,000
3,500
FY05
FY06
FY07
FY08
FY09
FY10
FY11
FY12
FY13
FY14
Steel sales (k tons)Stock Price INR - RHS
12 December 2014 17
19th Annual Wealth Creation Study (2009-2014)
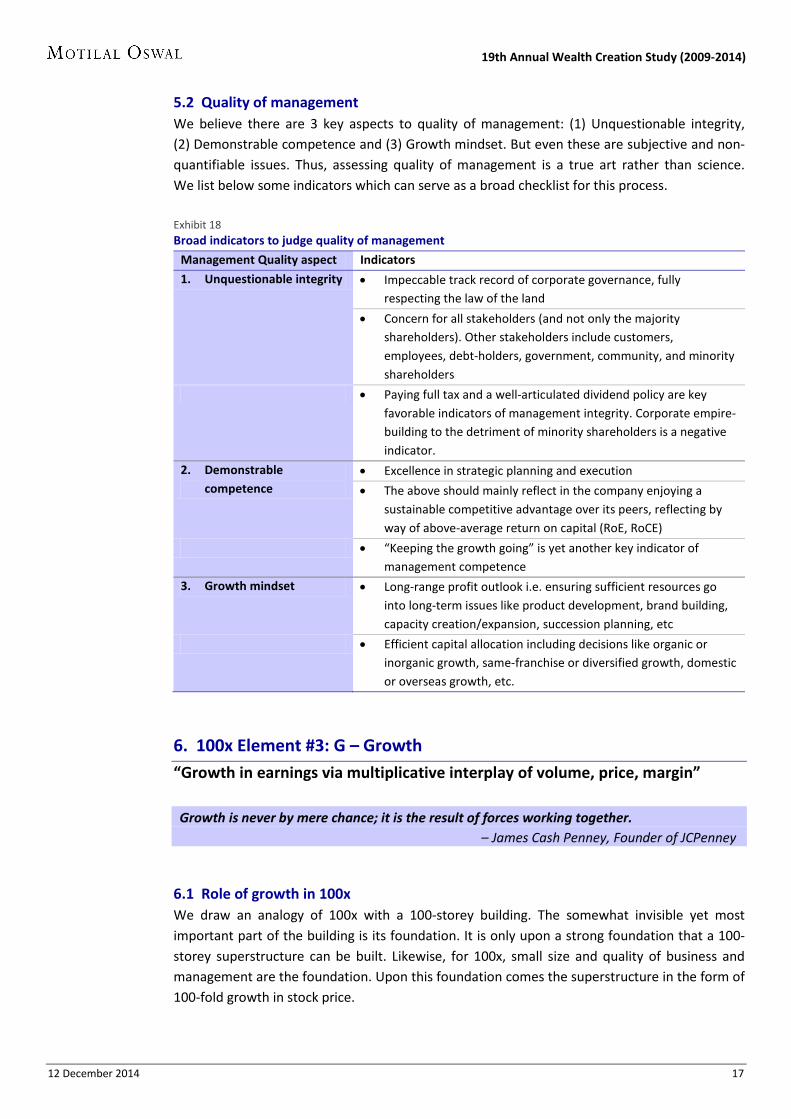
5.2 Quality of management We believe there are 3 key aspects to quality of management: (1) Unquestionable integrity, (2) Demonstrable competence and (3) Growth mindset. But even these are subjective and non-quantifiable issues. Thus, assessing quality of management is a true art rather than science. We list below some indicators which can serve as a broad checklist for this process. Exhibit 18 Broad indicators to judge quality of management
Management Quality aspect Indicators
1. Unquestionable integrity • Impeccable track record of corporate governance, fully respecting the law of the land
• Concern for all stakeholders (and not only the majority shareholders). Other stakeholders include customers, employees, debt-holders, government, community, and minority shareholders
• Paying full tax and a well-articulated dividend policy are key favorable indicators of management integrity. Corporate empire-building to the detriment of minority shareholders is a negative indicator.
2. Demonstrable competence
• Excellence in strategic planning and execution
• The above should mainly reflect in the company enjoying a sustainable competitive advantage over its peers, reflecting by way of above-average return on capital (RoE, RoCE)
• “Keeping the growth going” is yet another key indicator of management competence
3. Growth mindset • Long-range profit outlook i.e. ensuring sufficient resources go into long-term issues like product development, brand building, capacity creation/expansion, succession planning, etc
• Efficient capital allocation including decisions like organic or inorganic growth, same-franchise or diversified growth, domestic or overseas growth, etc.
6. 100x Element #3: G – Growth “Growth in earnings via multiplicative interplay of volume, price, margin”
Growth is never by mere chance; it is the result of forces working together. – James Cash Penney, Founder of JCPenney
6.1 Role of growth in 100x We draw an analogy of 100x with a 100-storey building. The somewhat invisible yet most important part of the building is its foundation. It is only upon a strong foundation that a 100-storey superstructure can be built. Likewise, for 100x, small size and quality of business and management are the foundation. Upon this foundation comes the superstructure in the form of 100-fold growth in stock price.
12 December 2014 18
19th Annual Wealth Creation Study (2009-2014)
6.2 Two dimensions of growth – Earnings and Valuation The end result of 100x is a 100-fold growth in stock price. The two primary dimensions of this growth are (1) Earnings growth and (2) Valuation growth. The G of SQGLP addresses earnings growth, whereas the P(rice) takes care of the Valuation growth (covered in Section 8).
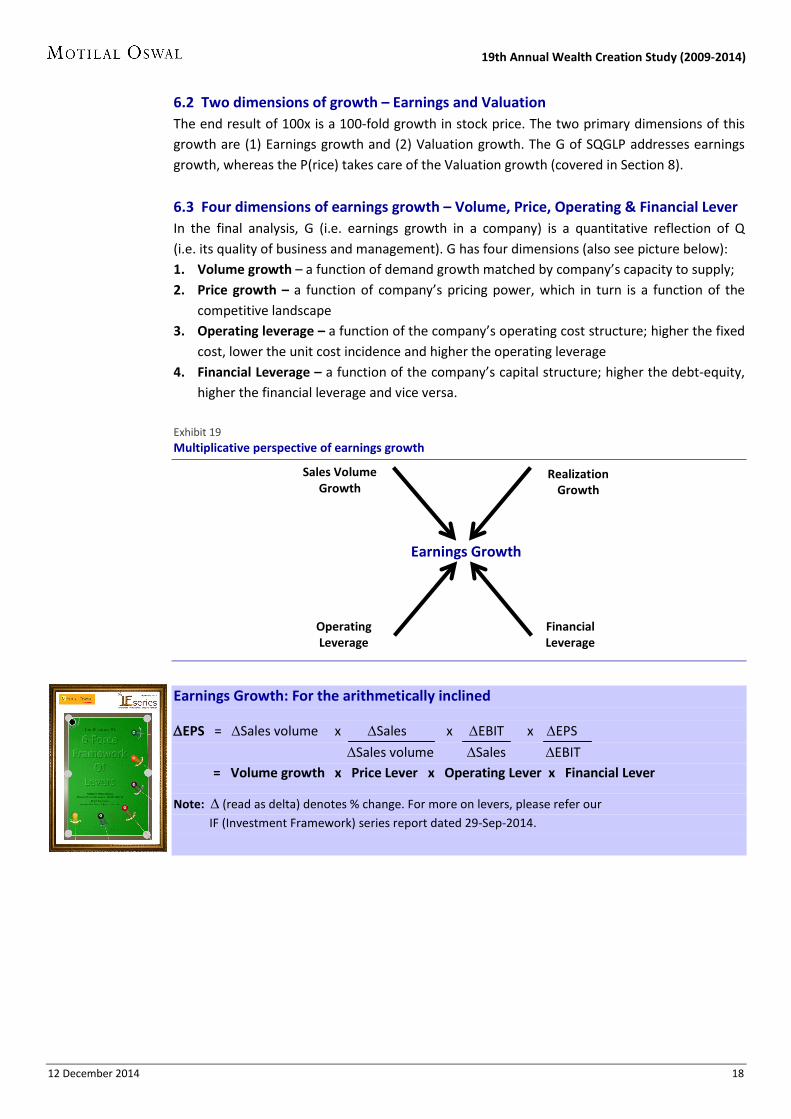
6.3 Four dimensions of earnings growth – Volume, Price, Operating & Financial Lever In the final analysis, G (i.e. earnings growth in a company) is a quantitative reflection of Q (i.e. its quality of business and management). G has four dimensions (also see picture below): 1. Volume growth – a function of demand growth matched by company’s capacity to supply; 2. Price growth – a function of company’s pricing power, which in turn is a function of the
competitive landscape 3. Operating leverage – a function of the company’s operating cost structure; higher the fixed
cost, lower the unit cost incidence and higher the operating leverage 4. Financial Leverage – a function of the company’s capital structure; higher the debt-equity,
higher the financial leverage and vice versa. Exhibit 19 Multiplicative perspective of earnings growth
Earnings Growth: For the arithmetically inclined
∆EPS = ∆Sales volume x ∆Sales x ∆EBIT x ∆EPS
∆Sales volume ∆Sales ∆EBIT = Volume growth x Price Lever x Operating Lever x Financial Lever
Note: ∆ (read as delta) denotes % change. For more on levers, please refer our IF (Investment Framework) series report dated 29-Sep-2014.
Sales Volume Growth
Realization Growth
Earnings Growth
Operating Leverage
Financial Leverage
12 December 2014 19
19th Annual Wealth Creation Study (2009-2014)
Quality v/s Growth We believe it is important to clearly distinguish between quality of a company and its growth prospects.
• Quality: As discussed in section 5, quality of a company is a function of (1) Quality of its management, and (2) Quality of business (mainly in terms of profitability measured in terms of return on capital i.e. RoCE and RoE).
• Growth: Growth is not a function of Quality alone, but several other factors discussed earlier – value migration, demand-supply dynamics, competitive landscape, etc.
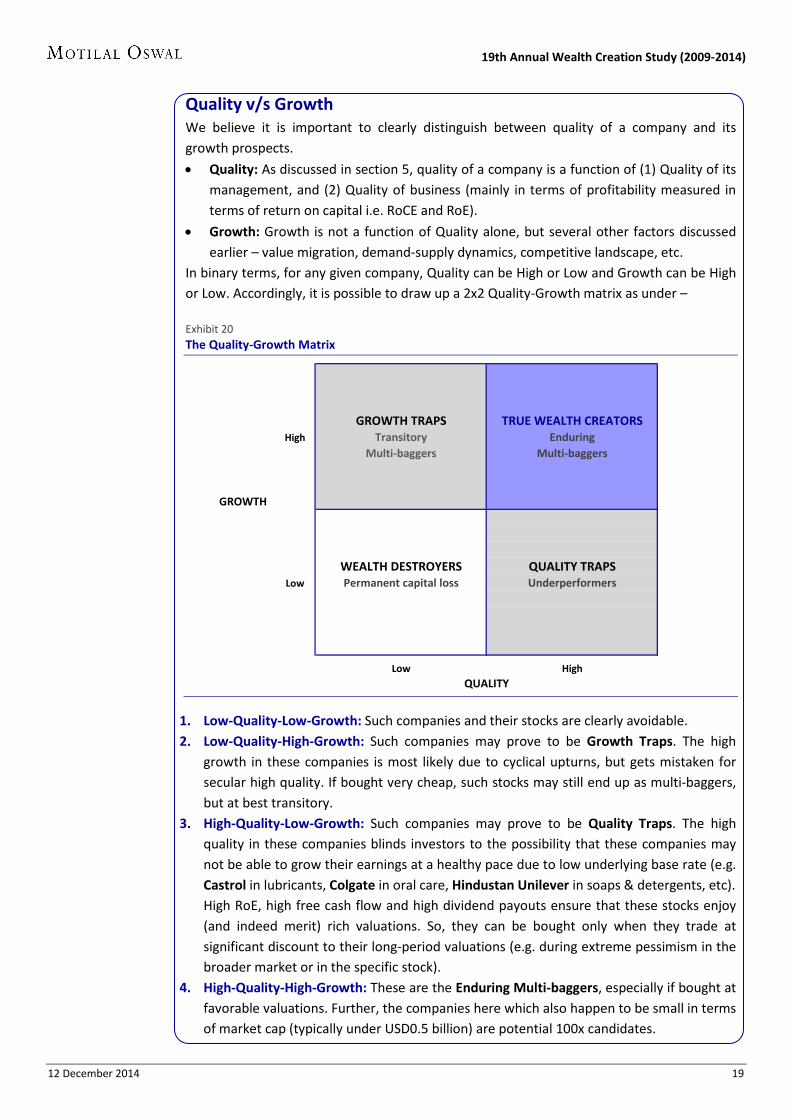
In binary terms, for any given company, Quality can be High or Low and Growth can be High or Low. Accordingly, it is possible to draw up a 2x2 Quality-Growth matrix as under –
Exhibit 20 The Quality-Growth Matrix
1. Low-Quality-Low-Growth: Such companies and their stocks are clearly avoidable. 2. Low-Quality-High-Growth: Such companies may prove to be Growth Traps. The high
growth in these companies is most likely due to cyclical upturns, but gets mistaken for secular high quality. If bought very cheap, such stocks may still end up as multi-baggers, but at best transitory.
3. High-Quality-Low-Growth: Such companies may prove to be Quality Traps. The high quality in these companies blinds investors to the possibility that these companies may not be able to grow their earnings at a healthy pace due to low underlying base rate (e.g. Castrol in lubricants, Colgate in oral care, Hindustan Unilever in soaps & detergents, etc). High RoE, high free cash flow and high dividend payouts ensure that these stocks enjoy (and indeed merit) rich valuations. So, they can be bought only when they trade at significant discount to their long-period valuations (e.g. during extreme pessimism in the broader market or in the specific stock).
4. High-Quality-High-Growth: These are the Enduring Multi-baggers, especially if bought at favorable valuations. Further, the companies here which also happen to be small in terms of market cap (typically under USD0.5 billion) are potential 100x candidates.
GROWTH TRAPS TRUE WEALTH CREATORSHigh Transitory Enduring
Multi-baggers Multi-baggers
GROWTH
WEALTH DESTROYERS QUALITY TRAPSLow Permanent capital loss Underperformers
Low HighQUALITY

12 December 2014 20
19th Annual Wealth Creation Study (2009-2014)
7. 100x Element #4: L – Longevity
“Sustaining quality and growth over long term”
There are no great limits to growth because there are no limits of human intelligence, imagination, and wonder. – Ronald Reagan, former US President
Having established the quality of the company and the rate of growth, the next challenge in identifying a 100x stock is assessing how long the company can keep the growing going. In the context of longevity, competence of management is tested at two levels – 1. Extending CAP (i.e. Competitive Advantage Period); and 2. Delaying mean reversion of growth rate.
7.1 Extending CAP Competitive advantage period (CAP) is the time during which a company generates returns on investment that significantly exceed its cost of capital. Economic laws suggest that if a company earns supernormal return on its invested capital, it will attract competitors who will accept lower returns, eventually driving down overall industry returns to economic cost of capital, and sometimes even below it. However, a company with a great business and great management sustains its superior rates of return and keeps extending its CAP. This creates incremental excess return both for the company and in turn for its equity investors. (The idea of CAP and its extension is depicted below.) Exhibit 21 Companies usually enjoy a certain CAP … … but 100x companies tend to extend it
7.2 Delaying mean reversion of growth rate The other aspect of longevity is about delaying the mean reversion of growth rates. After the initial hyper- and high growth phases, rates tend to taper off to the mean rate (which is usually the nominal GDP growth rate). This is due to both competition and also the company’s own high-base effect. This is when competent managements can delay the reversion to mean either by (1) new streams of organic growth, and/or (2) inorganic growth via judicious, earnings-accretive and value-enhancing acquisitions. Thus, longevity of quality and growth is the key difference between transitory multi-baggers and 100x stocks.
12 December 2014 21
19th Annual Wealth Creation Study (2009-2014)
8. 100x Element #5: P – Price
“Favorable valuation”
There is absolutely no substitute for paying right price. In the Bible, it says that love covers a multitude of sins. Well, in the investing field, price covers a multitude of mistakes. For human beings, there is no substitute for love. For investing there is no substitute for paying right price – absolutely none.
— Van Den Berg, Outstanding Investor Digest, April 2004
8.1 Favorable valuation must for valuation growth to kick in As stated earlier, growth in stock price is a multiplicative function of growth in earnings and growth in valuation. The 100x phenomenon ideally needs both the legs of growth to kick in. If valuation remains unchanged, earnings will need to grow 100-fold. On the other hand, if valuation were to actually halve, earnings would need to (1) double for the stock to stay at the same price, and (2) grow 200-fold for the stock price to grow 100-fold. The simplest way to improve the odds of valuation growth is by ensuring favorable valuation at the time of purchase. A further simple rule of favorable valuation is single-digit P/E. (Note: In certain situations, low P/E may not be the sole determinant of favorable valuation e.g. during bottom-of-cycle, earnings of cyclical stocks are depressed leading to high P/Es; likewise, where companies are expected to turn from loss to profit, current P/E cannot be calculated.)
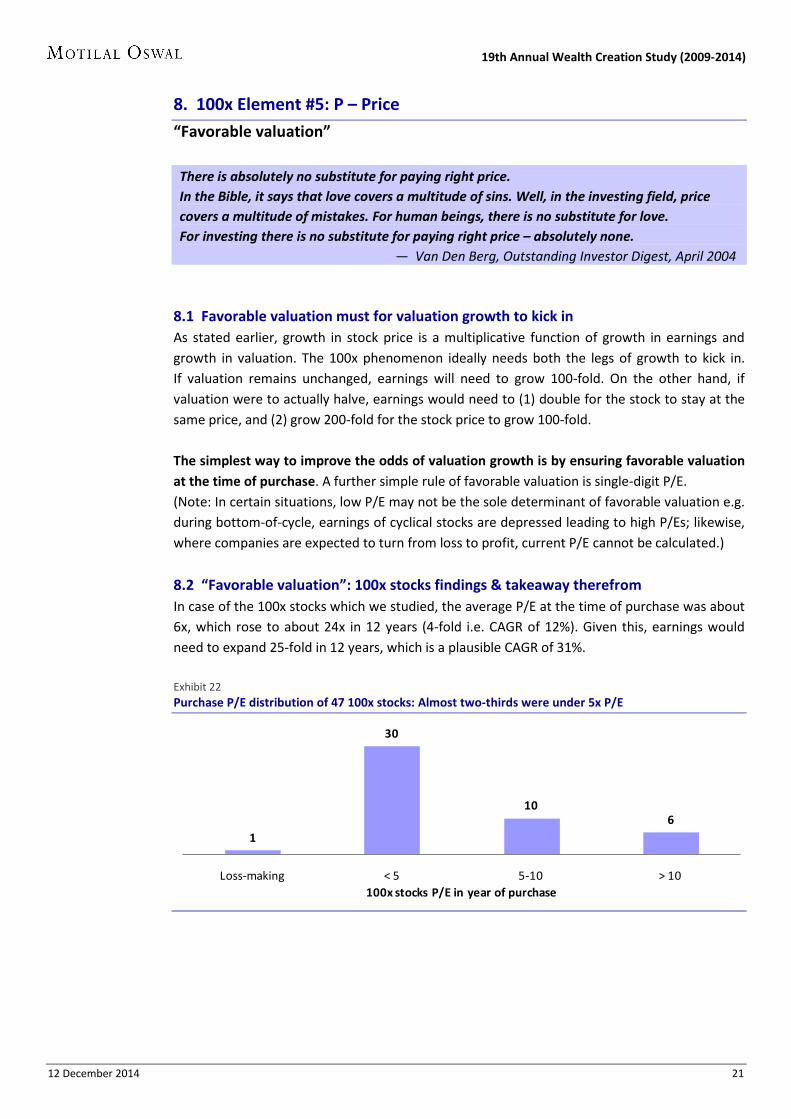
8.2 “Favorable valuation”: 100x stocks findings & takeaway therefrom In case of the 100x stocks which we studied, the average P/E at the time of purchase was about 6x, which rose to about 24x in 12 years (4-fold i.e. CAGR of 12%). Given this, earnings would need to expand 25-fold in 12 years, which is a plausible CAGR of 31%. Exhibit 22 Purchase P/E distribution of 47 100x stocks: Almost two-thirds were under 5x P/E
1
30
106
Loss-making < 5 5-10 > 10100x stocks P/E in year of purchase
12 December 2014 22
19th Annual Wealth Creation Study (2009-2014)
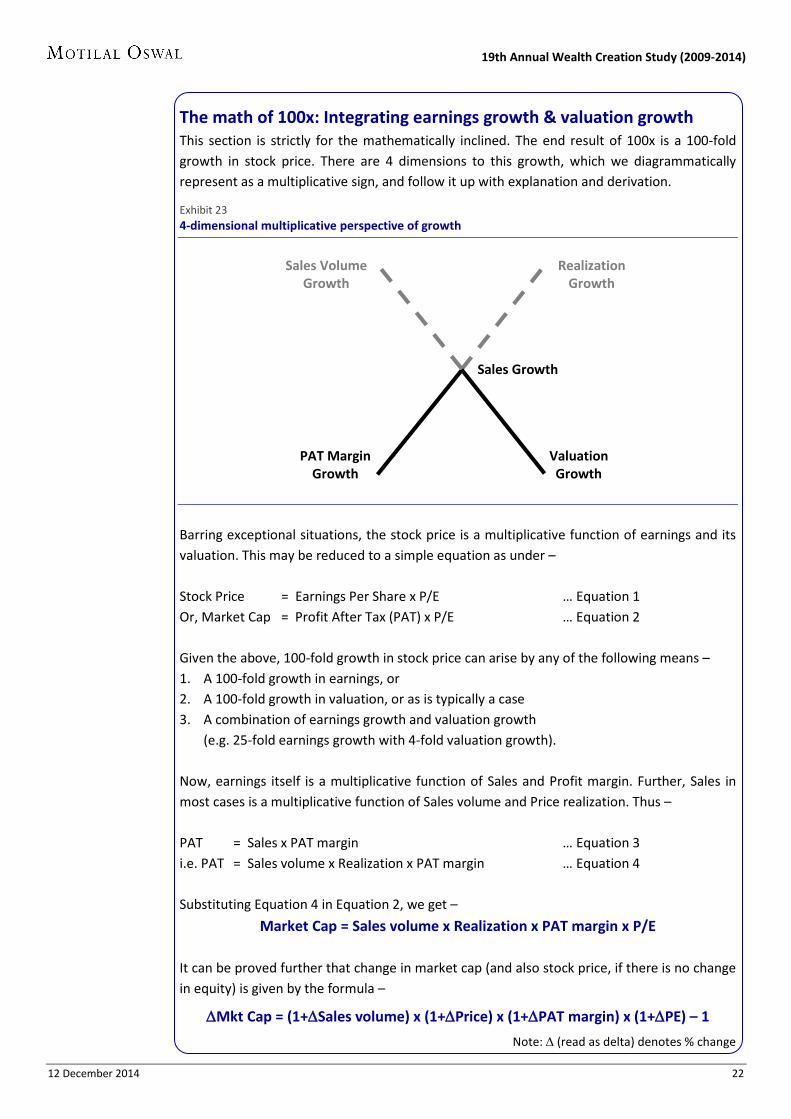
The math of 100x: Integrating earnings growth & valuation growth This section is strictly for the mathematically inclined. The end result of 100x is a 100-fold growth in stock price. There are 4 dimensions to this growth, which we diagrammatically represent as a multiplicative sign, and follow it up with explanation and derivation.
Exhibit 23 4-dimensional multiplicative perspective of growth
Barring exceptional situations, the stock price is a multiplicative function of earnings and its valuation. This may be reduced to a simple equation as under – Stock Price = Earnings Per Share x P/E … Equation 1 Or, Market Cap = Profit After Tax (PAT) x P/E … Equation 2 Given the above, 100-fold growth in stock price can arise by any of the following means – 1. A 100-fold growth in earnings, or 2. A 100-fold growth in valuation, or as is typically a case 3. A combination of earnings growth and valuation growth
(e.g. 25-fold earnings growth with 4-fold valuation growth). Now, earnings itself is a multiplicative function of Sales and Profit margin. Further, Sales in most cases is a multiplicative function of Sales volume and Price realization. Thus – PAT = Sales x PAT margin … Equation 3 i.e. PAT = Sales volume x Realization x PAT margin … Equation 4 Substituting Equation 4 in Equation 2, we get –
Market Cap = Sales volume x Realization x PAT margin x P/E It can be proved further that change in market cap (and also stock price, if there is no change in equity) is given by the formula –
∆Mkt Cap = (1+∆Sales volume) x (1+∆Price) x (1+∆PAT margin) x (1+∆PE) – 1
Note: ∆ (read as delta) denotes % change
Sales Volume Growth
Realization Growth
Sales Growth
PAT Margin Growth
Valuation Growth
12 December 2014 23
19th Annual Wealth Creation Study (2009-2014)
9. Shortlisting potential 100x ideas
Much of SQGLP covered except quality of management
I have but one lamp by which my feet are guided, and that is the lamp of experience. I know of no way of judging the future but by the past.
– Thomas Phelps in 100 to 1 In The Stock Market
Having understood how the 100x process has worked in the past, we proceed to apply the same to try and shortlist potential 100x ideas. Before that, we recap the SQGLP conditions favorable for 100x alchemy to occur – 1. S – Size: The company is small and relatively unknown 2. Q – Quality: The company has a high-quality business run by a high-quality management
(i.e. one with integrity, competence and growth mindset) 3. G – Growth: There is healthy growth in the company via a combination of sales volume
and/or price and/or margins 4. L – Longevity: The company is likely to sustain its quality and growth for a long time 5. P – Price: The stock is favorably valued. In our analysis thus far, we have made most of these elements fairly objective, except for quality of management. We table below companies which meet the following 100x criteria –
• Market cap less than INR30b
• Businesses which offer play on Value migration or Niche opportunity
• P/E not over 25x trailing 12-month earnings. IMPORTANT NOTE: The companies mentioned here should not be construed as our
investment recommendations. Assessing integrity, competence and growth mindset of the management in company is an exercise which is subjective, requires a high level of due diligence, and not included in the scope of this study.
Exhibit 24 Companies which meet key 100x criteria, subject to management assessment
Company Small & unknown (Mkt Cap, INR b)
Value Migration / Niche opportunity
Favorable valuation (TTM P/E, x)*
Aarti Drugs 10 Pharma exports 13
Suven Lifescience 22 Pharma exports 17
Granules India 16 Pharma exports 17
DCB Bank 29 Private banking 18
Tata Elxsi 19 Specialized software exports 21
Shilpa Medicare 20 Oncology drugs research 24
Atul Auto 10 Niche 3-wheeler player 25 * Valuation based on price of 25 November 2014
In his book Path To Wealth Through Common Stocks, Phil Fisher says, “in evaluating a common stock, the management is 90%, industry is 9% and all other factors are 1%.” In the ultimate analysis, it is the management alone which is the 100x alchemist. And it is to those who have mastered the art of evaluating the alchemist that the stock market rewards with gold … by way of 100x Wealth Creation!
12 December 2014 24
19th Annual Wealth Creation Study (2009-2014)
Market Outlook
12 December 2014 25
19th Annual Wealth Creation Study (2009-2014)
Market Outlook A macro perspective
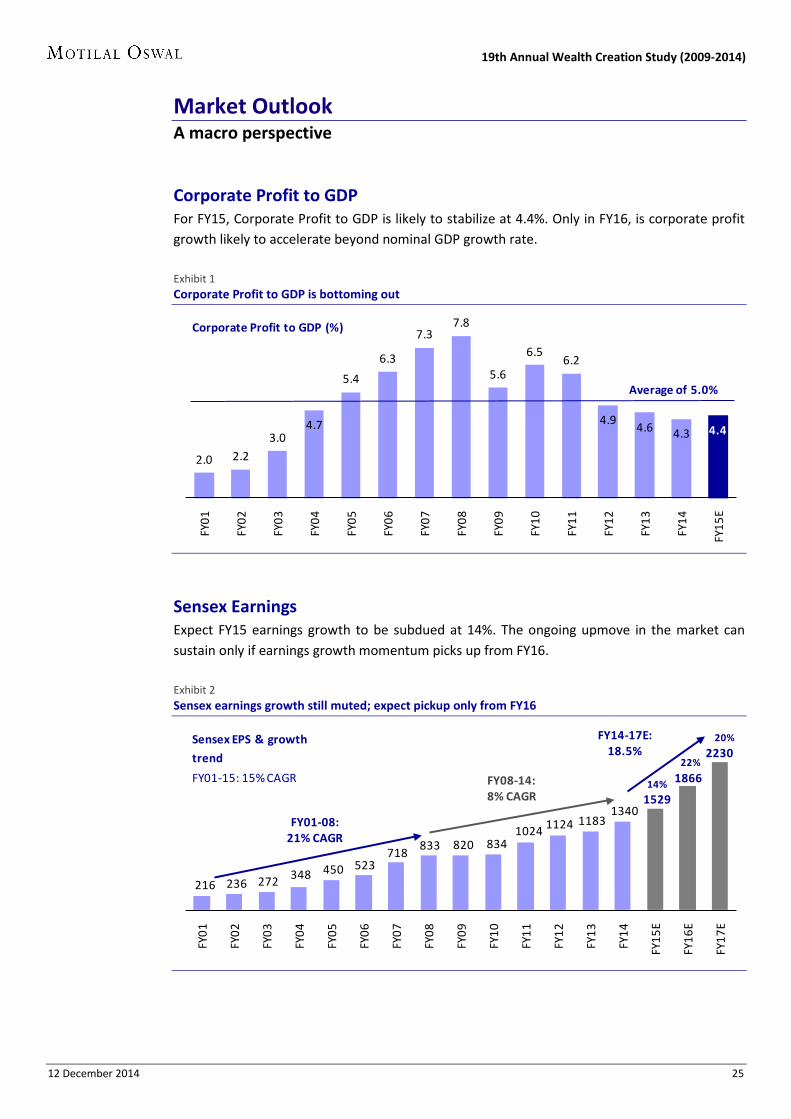
Corporate Profit to GDP For FY15, Corporate Profit to GDP is likely to stabilize at 4.4%. Only in FY16, is corporate profit growth likely to accelerate beyond nominal GDP growth rate. Exhibit 1 Corporate Profit to GDP is bottoming out
Sensex Earnings Expect FY15 earnings growth to be subdued at 14%. The ongoing upmove in the market can sustain only if earnings growth momentum picks up from FY16. Exhibit 2 Sensex earnings growth still muted; expect pickup only from FY16
2.0 2.23.0
4.7
5.4
6.3
7.37.8
5.6
6.56.2
4.94.6 4.3 4.4
FY01
FY02
FY03
FY04
FY05
FY06
FY07
FY08
FY09
FY10
FY11
FY12
FY13
FY14
FY15
E
Average of 5.0%
Corporate Profit to GDP (%)
216 236 272 348 450 523718
833 820 8341024 1124 1183
13401529
1866
2230
FY01
FY02
FY03
FY04
FY05
FY06
FY07
FY08
FY09
FY10
FY11
FY12
FY13
FY14
FY15
E
FY16
E
FY17
E
FY01-08:21% CAGR
FY08-14:8% CAGR
FY14-17E: 18.5%
Sensex EPS & growth
trend
FY01-15: 15% CAGR 14%
22%
20%
12 December 2014 26
19th Annual Wealth Creation Study (2009-2014)
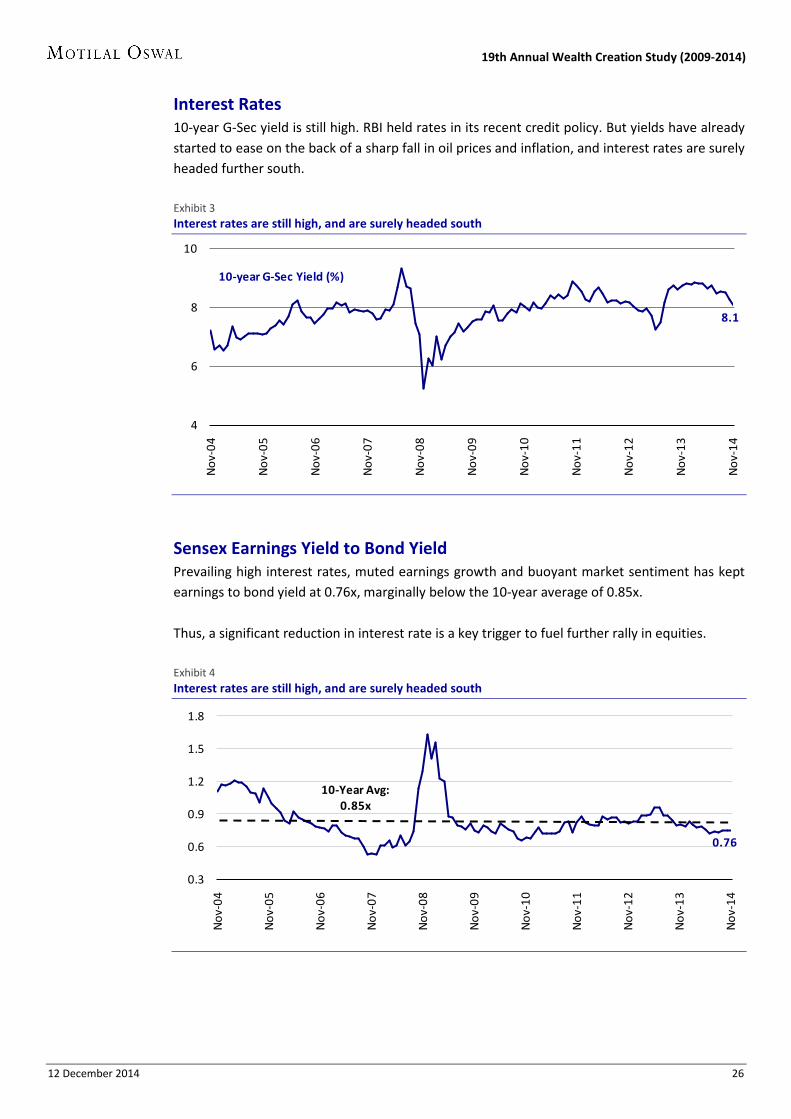
Interest Rates 10-year G-Sec yield is still high. RBI held rates in its recent credit policy. But yields have already started to ease on the back of a sharp fall in oil prices and inflation, and interest rates are surely headed further south. Exhibit 3 Interest rates are still high, and are surely headed south
Sensex Earnings Yield to Bond Yield Prevailing high interest rates, muted earnings growth and buoyant market sentiment has kept earnings to bond yield at 0.76x, marginally below the 10-year average of 0.85x. Thus, a significant reduction in interest rate is a key trigger to fuel further rally in equities. Exhibit 4 Interest rates are still high, and are surely headed south
8.1
4
6
8
10
Nov
-04
Nov
-05
Nov
-06
Nov
-07
Nov
-08
Nov
-09
Nov
-10
Nov
-11
Nov
-12
Nov
-13
Nov
-14
10-year G-Sec Yield (%)
0.76
0.3
0.6
0.9
1.2
1.5
1.8
Nov
-04
Nov
-05
Nov
-06
Nov
-07
Nov
-08
Nov
-09
Nov
-10
Nov
-11
Nov
-12
Nov
-13
Nov
-14
10-Year Avg:0.85x
12 December 2014 27
19th Annual Wealth Creation Study (2009-2014)
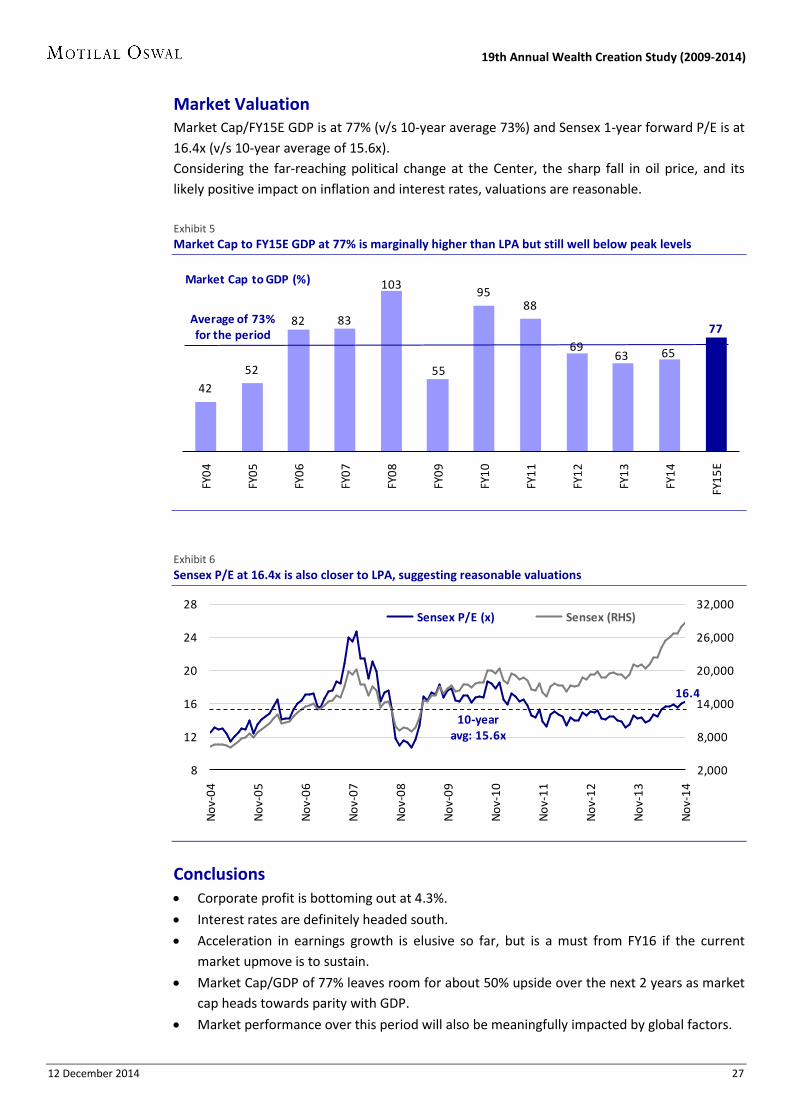
Market Valuation Market Cap/FY15E GDP is at 77% (v/s 10-year average 73%) and Sensex 1-year forward P/E is at 16.4x (v/s 10-year average of 15.6x). Considering the far-reaching political change at the Center, the sharp fall in oil price, and its likely positive impact on inflation and interest rates, valuations are reasonable. Exhibit 5 Market Cap to FY15E GDP at 77% is marginally higher than LPA but still well below peak levels
Exhibit 6 Sensex P/E at 16.4x is also closer to LPA, suggesting reasonable valuations
Conclusions • Corporate profit is bottoming out at 4.3%.
• Interest rates are definitely headed south.
• Acceleration in earnings growth is elusive so far, but is a must from FY16 if the current market upmove is to sustain.
• Market Cap/GDP of 77% leaves room for about 50% upside over the next 2 years as market cap heads towards parity with GDP.
• Market performance over this period will also be meaningfully impacted by global factors.
4252
82 83
103
55
9588
6963 65
77
FY04
FY05
FY06
FY07
FY08
FY09
FY10
FY11
FY12
FY13
FY14
FY15
E
Average of 73% for the period
Market Cap to GDP (%)
16.4
2,000
8,000
14,000
20,000
26,000
32,000
Nov
-14
Nov
-13
Nov
-12
Nov
-11
Nov
-10
Nov
-09
Nov
-08
Nov
-07
Nov
-06
Nov
-05
Nov
-04
8
12
16
20
24
28Sensex P/E (x) Sensex (RHS)
10-year avg: 15.6x
12 December 2014 28
19th Annual Wealth Creation Study (2009-2014)
2009-14 Wealth Creation Study:
Detailed findings

12 December 2014 29
19th Annual Wealth Creation Study (2009-2014)
The Biggest Wealth Creators
TCS is the Biggest Wealth Creator again TCS has emerged the biggest Wealth Creator for the period 2009-14, retaining the top spot
it held even for the period 2008-13. The performance in the latest period is better than the previous one with Wealth Created at
INR3.6 trillion v/s INR2.3 trillion over 2008-13. This is the highest ever wealth created in any 5-year period in India’s stock market history, topping the INR3.1 trillion created by Reliance during 2003-08.
On the back of 29% PAT CAGR over 2009-14, TCS stock has delivered 51% price CAGR for the same period, and is currently India’s largest company by market cap.
ITC, HDFC Bank and Infosys have retained their previous year ranks of 2-4. 8 of the top 10 are the same as last year; ONGC (6th last year) and Hindustan Unilever (9th last year) have made way for ICICI Bank and HCL Technologies.
Exhibit 1 Top 10 Biggest Wealth Creators
Rank Company Wealth Created
CAGR (%) P/E (x)
RoE (%)
INR B % Share
Price PAT 2014 2009
2014 2009
1 TCS 3,638 12
51 29
22 10
39 34 2 ITC 2,073 7
31 22 31 21
33 24
3 HDFC Bank 1,307 4
31 31 20 18
20 15 4 Infosys 1,123 4
20 12 18 13
24 33
5 ICICI Bank 1,035 4
30 28 12 11
15 7 6 Wipro 993 3
30 16 17 9
25 28
7 Sun Pharma 958 3
39 16 31 12
21 27 8 Tata Motors 945 3
62 L to P 8 NA
22 -42
9 H D F C 934 3
26 29 21 22
17 12 10 HCL Technologies 898 3
69 38 15 5
33 27
Total Top 10 13,905 47
36 30 18 15
24 17 Total of Top 100 29,381 100
34 24 19 13
19 17
Exhibit 2 TCS’ Wealth Creation of INR3.6 trillion between 2009-14 is the highest ever in India
91 73262 341
1,247
377 383 245
1,030 1,065
1,6781,856
3,077
1,514
2,556
1,742
1,187
2,284
3,638
1996
1997
1998
1999
2000
2001
2002
2003
2004
2005
2006
2007
2008
2009
2010
2011
2012
2013
2014
Hindustan Unilever(HUL)
Wipro
HUL Wipro
ONGC
Reliance Industries
ITC
TCSWealth Created in 5 years (INR b)
#1
Key Takeaway
Market folly is one of the biggest sources of multi-baggers In end-2008, global stock markets crashed given the US sub-prime crisis. In India, businesses like IT and Healthcare (where India enjoys competitive advantage) were also hammered – a great opportunity to pick up stocks like TCS, Wipro and HCL Tech at P/Es of 10x or less.
12 December 2014 30
19th Annual Wealth Creation Study (2009-2014)
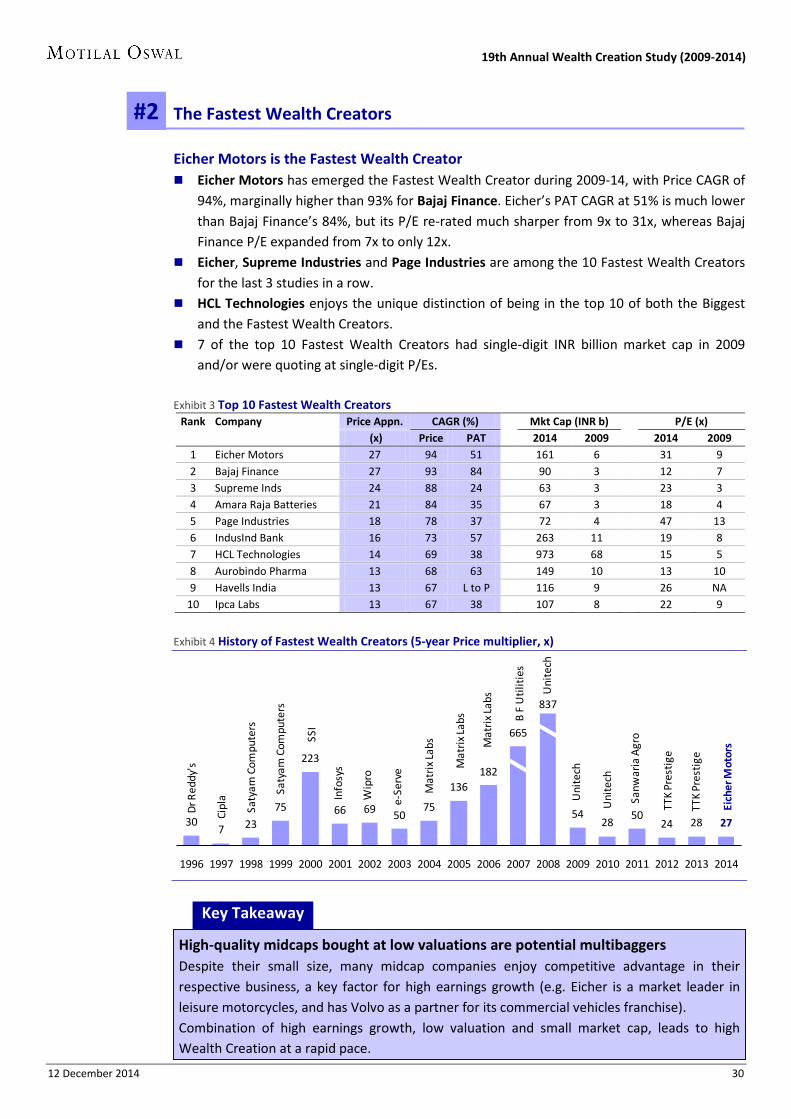
The Fastest Wealth Creators
Eicher Motors is the Fastest Wealth Creator Eicher Motors has emerged the Fastest Wealth Creator during 2009-14, with Price CAGR of
94%, marginally higher than 93% for Bajaj Finance. Eicher’s PAT CAGR at 51% is much lower than Bajaj Finance’s 84%, but its P/E re-rated much sharper from 9x to 31x, whereas Bajaj Finance P/E expanded from 7x to only 12x.
Eicher, Supreme Industries and Page Industries are among the 10 Fastest Wealth Creators for the last 3 studies in a row.
HCL Technologies enjoys the unique distinction of being in the top 10 of both the Biggest and the Fastest Wealth Creators.
7 of the top 10 Fastest Wealth Creators had single-digit INR billion market cap in 2009 and/or were quoting at single-digit P/Es.
Exhibit 3 Top 10 Fastest Wealth Creators
Rank Company Price Appn. CAGR (%) Mkt Cap (INR b) P/E (x) (x) Price PAT 2014 2009 2014 2009 1 Eicher Motors 27 94 51
161 6
31 9
2 Bajaj Finance 27 93 84 90 3 12 7 3 Supreme Inds 24 88 24 63 3 23 3 4 Amara Raja Batteries 21 84 35 67 3 18 4 5 Page Industries 18 78 37 72 4 47 13 6 IndusInd Bank 16 73 57 263 11 19 8 7 HCL Technologies 14 69 38 973 68 15 5 8 Aurobindo Pharma 13 68 63 149 10 13 10 9 Havells India 13 67 L to P 116 9 26 NA
10 Ipca Labs 13 67 38 107 8 22 9
Exhibit 4 History of Fastest Wealth Creators (5-year Price multiplier, x)
307 23
75
223
66 69 5075
136182
665
837
5428
5024 28 27
1996 1997 1998 1999 2000 2001 2002 2003 2004 2005 2006 2007 2008 2009 2010 2011 2012 2013 2014
Uni
tech
Mat
rix
Labs
e-Se
rve
Wip
ro
Info
sys
SSI
Saty
am C
ompu
ters
Cipl
a
Dr R
eddy
's
Sanw
aria
Agr
o
TTK
Pres
tige
Eich
er M
otor
s
Uni
tech
TTK
Pres
tige
Saty
am C
ompu
ters
Mat
rix
Labs
Mat
rix
Labs
Uni
tech
B F
Uti
litie
s
#2
Key Takeaway
High-quality midcaps bought at low valuations are potential multibaggers Despite their small size, many midcap companies enjoy competitive advantage in their respective business, a key factor for high earnings growth (e.g. Eicher is a market leader in leisure motorcycles, and has Volvo as a partner for its commercial vehicles franchise). Combination of high earnings growth, low valuation and small market cap, leads to high Wealth Creation at a rapid pace.
12 December 2014 31
19th Annual Wealth Creation Study (2009-2014)
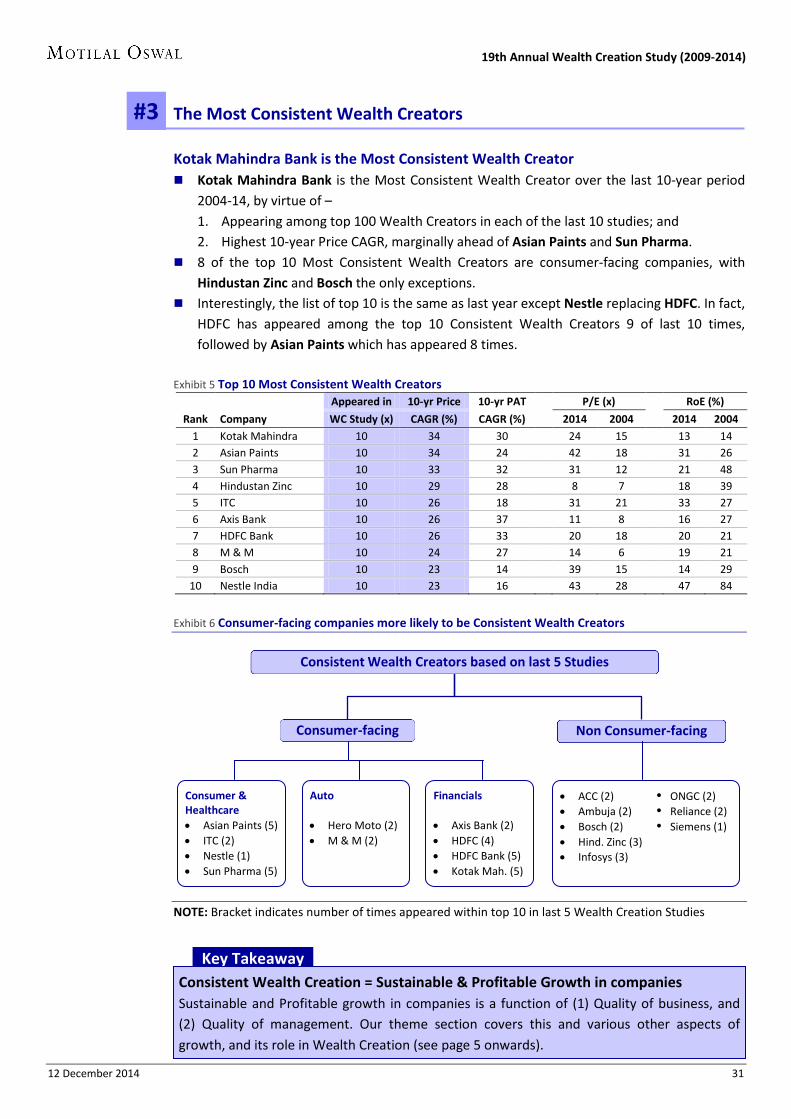
The Most Consistent Wealth Creators
Kotak Mahindra Bank is the Most Consistent Wealth Creator Kotak Mahindra Bank is the Most Consistent Wealth Creator over the last 10-year period
2004-14, by virtue of – 1. Appearing among top 100 Wealth Creators in each of the last 10 studies; and 2. Highest 10-year Price CAGR, marginally ahead of Asian Paints and Sun Pharma.
8 of the top 10 Most Consistent Wealth Creators are consumer-facing companies, with Hindustan Zinc and Bosch the only exceptions.
Interestingly, the list of top 10 is the same as last year except Nestle replacing HDFC. In fact, HDFC has appeared among the top 10 Consistent Wealth Creators 9 of last 10 times, followed by Asian Paints which has appeared 8 times.
Exhibit 5 Top 10 Most Consistent Wealth Creators
Appeared in 10-yr Price 10-yr PAT P/E (x) RoE (%)
Rank Company WC Study (x) CAGR (%) CAGR (%) 2014 2004 2014 2004 1 Kotak Mahindra 10 34 30
24 15
13 14
2 Asian Paints 10 34 24 42 18 31 26 3 Sun Pharma 10 33 32 31 12 21 48 4 Hindustan Zinc 10 29 28 8 7 18 39 5 ITC 10 26 18 31 21 33 27 6 Axis Bank 10 26 37 11 8 16 27 7 HDFC Bank 10 26 33 20 18 20 21 8 M & M 10 24 27 14 6 19 21 9 Bosch 10 23 14 39 15 14 29
10 Nestle India 10 23 16 43 28 47 84
Exhibit 6 Consumer-facing companies more likely to be Consistent Wealth Creators
NOTE: Bracket indicates number of times appeared within top 10 in last 5 Wealth Creation Studies
Consistent Wealth Creators based on last 5 Studies
Consumer-facing Non Consumer-facing
#3
Key Takeaway Consistent Wealth Creation = Sustainable & Profitable Growth in companies Sustainable and Profitable growth in companies is a function of (1) Quality of business, and (2) Quality of management. Our theme section covers this and various other aspects of growth, and its role in Wealth Creation (see page 5 onwards).
Consumer & Healthcare • Asian Paints (5) • ITC (2) • Nestle (1) • Sun Pharma (5)
Auto • Hero Moto (2) • M & M (2)
Financials • Axis Bank (2) • HDFC (4) • HDFC Bank (5) • Kotak Mah. (5)
• ACC (2) ONGC (2) • Ambuja (2) Reliance (2) • Bosch (2) Siemens (1) • Hind. Zinc (3) • Infosys (3)
12 December 2014 32
19th Annual Wealth Creation Study (2009-2014)
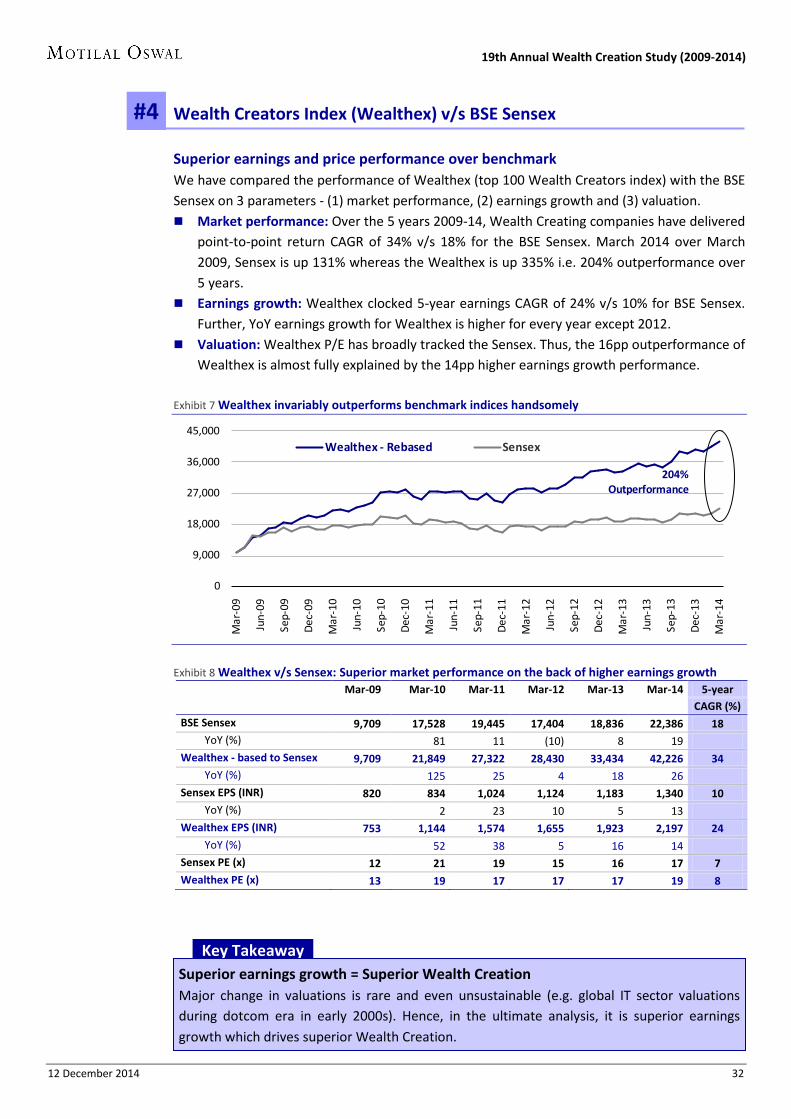
Wealth Creators Index (Wealthex) v/s BSE Sensex
Superior earnings and price performance over benchmark We have compared the performance of Wealthex (top 100 Wealth Creators index) with the BSE Sensex on 3 parameters - (1) market performance, (2) earnings growth and (3) valuation. Market performance: Over the 5 years 2009-14, Wealth Creating companies have delivered
point-to-point return CAGR of 34% v/s 18% for the BSE Sensex. March 2014 over March 2009, Sensex is up 131% whereas the Wealthex is up 335% i.e. 204% outperformance over 5 years.
Earnings growth: Wealthex clocked 5-year earnings CAGR of 24% v/s 10% for BSE Sensex. Further, YoY earnings growth for Wealthex is higher for every year except 2012.
Valuation: Wealthex P/E has broadly tracked the Sensex. Thus, the 16pp outperformance of Wealthex is almost fully explained by the 14pp higher earnings growth performance.
Exhibit 7 Wealthex invariably outperforms benchmark indices handsomely
Exhibit 8 Wealthex v/s Sensex: Superior market performance on the back of higher earnings growth
Mar-09 Mar-10 Mar-11 Mar-12 Mar-13 Mar-14 5-year CAGR (%) BSE Sensex 9,709 17,528 19,445 17,404 18,836 22,386 18
YoY (%)
81 11 (10) 8 19 Wealthex - based to Sensex 9,709 21,849 27,322 28,430 33,434 42,226 34
YoY (%)
125 25 4 18 26 Sensex EPS (INR) 820 834 1,024 1,124 1,183 1,340 10
YoY (%)
2 23 10 5 13 Wealthex EPS (INR) 753 1,144 1,574 1,655 1,923 2,197 24
YoY (%)
52 38 5 16 14 Sensex PE (x) 12 21 19 15 16 17 7 Wealthex PE (x) 13 19 17 17 17 19 8
0
9,000
18,000
27,000
36,000
45,000
Mar
-09
Jun-
09
Sep-
09
Dec
-09
Mar
-10
Jun-
10
Sep-
10
Dec
-10
Mar
-11
Jun-
11
Sep-
11
Dec
-11
Mar
- 12
Jun-
12
Sep-
12
Dec
-12
Mar
-13
Jun-
13
Sep-
13
Dec
-13
Mar
-14
Wealthex - Rebased Sensex
204% Outperformance
#4
Key Takeaway Superior earnings growth = Superior Wealth Creation Major change in valuations is rare and even unsustainable (e.g. global IT sector valuations during dotcom era in early 2000s). Hence, in the ultimate analysis, it is superior earnings growth which drives superior Wealth Creation.

12 December 2014 33
19th Annual Wealth Creation Study (2009-2014)
Wealth Creation: Sectoral analysis
Technology re-emerges as the largest ever Wealth Creating sector After a 9-year holiday post 2004, Technology has re-emerged as India’s largest Wealth
Creating sector. (It was the largest Wealth Creator for 4 consecutive years 2000 to 2004.) Technology sector created INR7.1 trillion Wealth between 2009 and 214, the highest ever
by any sector – 22% higher than INR5.8 trillion by Oil & Gas sector during the peak of global equity boom of 2003-08.
Ironically, Oil & Gas is one of the lowest Wealth Creating sectors over 2009-14, with its share of Wealth Created collapsing to 1% v/s 22% in 2009.
Auto, Technology and Healthcare were the only 3 sectors whose Price CAGR was higher than average of 34%.
Exhibit 9 Technology is the leading Wealth Creating sector by a wide margin
Industry WC Share of WC % CAGR 09-14 % PE (x) ROE (%)
(No. of companies) (INR b) 2014 2009
Price PAT
2014 2009
2014 2009
Technology (6) 7,103 24 5
38 22
18 10
30 32
Consumer & Retail (23) 5,961 20 11 32 17 41 23 24 23
Banking & Finance (20) 5,679 19 9 34 28 14 11 16 12
Auto (13) 3,364 11 4 41 60 14 26 21 8
Healthcare (13) 2,738 9 4 37 27 27 19 19 16
Capital Goods (5) 1,226 4 12 27 5 29 11 13 25
Cement (5) 1,183 4 2 29 4 20 7 14 25
Metals / Mining (4) 707 2 15 29 20 13 9 9 9
Telecom & Media (3) 608 2 11 27 16 24 15 16 9
Oil & Gas (2) 268 1 22 21 31 9 13 20 8
Others (6) 544 2 4
33 17
25 13
19 23
Total 29,381 100 100 34 24 19 13 19 17
Exhibit 10 Technology: All-time high in Wealth Creation
1,8392,723
3,891
5,826
2,126
4,949 5,194
3,6724,456
7,103
Oil & Gas Oil & Gas Oil & Gas Oil & Gas Oil & Gas Metals/Mining
Financials Financials Consumer& Retail
Technology
2005 2006 2007 2008 2009 2010 2011 2012 2013 2014
Top Wealth Creating Sector Trend (INR b)
#5
Key Takeaway
Auto – Highest Price CAGR on the back of highest PAT CAGR Over 2009-14, Auto sector clocked the highest Price CAGR of 41% on the back of robust PAT CAGR of 60%, led by major profit turnaround in Tata Motors’ overseas subsidiary, JLR. Thus, the phenomenon of earnings growth driving Wealth Creation holds true both at the individual company and at the aggregate sector level.
12 December 2014 34
19th Annual Wealth Creation Study (2009-2014)
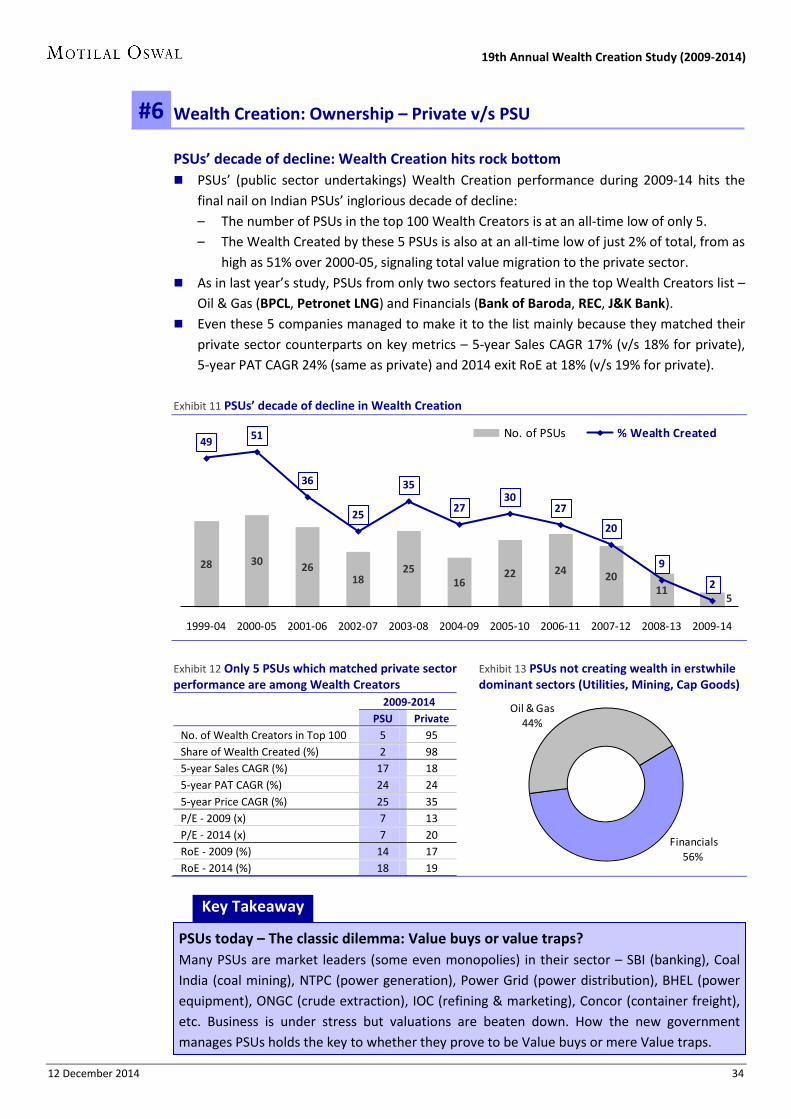
Wealth Creation: Ownership – Private v/s PSU
PSUs’ decade of decline: Wealth Creation hits rock bottom PSUs’ (public sector undertakings) Wealth Creation performance during 2009-14 hits the
final nail on Indian PSUs’ inglorious decade of decline: – The number of PSUs in the top 100 Wealth Creators is at an all-time low of only 5. – The Wealth Created by these 5 PSUs is also at an all-time low of just 2% of total, from as
high as 51% over 2000-05, signaling total value migration to the private sector. As in last year’s study, PSUs from only two sectors featured in the top Wealth Creators list –
Oil & Gas (BPCL, Petronet LNG) and Financials (Bank of Baroda, REC, J&K Bank). Even these 5 companies managed to make it to the list mainly because they matched their
private sector counterparts on key metrics – 5-year Sales CAGR 17% (v/s 18% for private), 5-year PAT CAGR 24% (same as private) and 2014 exit RoE at 18% (v/s 19% for private).
Exhibit 11 PSUs’ decade of decline in Wealth Creation
Exhibit 12 Only 5 PSUs which matched private sector Exhibit 13 PSUs not creating wealth in erstwhile performance are among Wealth Creators dominant sectors (Utilities, Mining, Cap Goods)
2009-2014 PSU Private No. of Wealth Creators in Top 100 5 95 Share of Wealth Created (%) 2 98 5-year Sales CAGR (%) 17 18 5-year PAT CAGR (%) 24 24 5-year Price CAGR (%) 25 35 P/E - 2009 (x) 7 13 P/E - 2014 (x) 7 20 RoE - 2009 (%) 14 17 RoE - 2014 (%) 18 19
28 30 2618
2516
22 24 2011
5
49 51
36
25
35
2730
27
20
9
2
1999-04 2000-05 2001-06 2002-07 2003-08 2004-09 2005-10 2006-11 2007-12 2008-13 2009-14
No. of PSUs % Wealth Created
Key Takeaway
PSUs today – The classic dilemma: Value buys or value traps? Many PSUs are market leaders (some even monopolies) in their sector – SBI (banking), Coal India (coal mining), NTPC (power generation), Power Grid (power distribution), BHEL (power equipment), ONGC (crude extraction), IOC (refining & marketing), Concor (container freight), etc. Business is under stress but valuations are beaten down. How the new government manages PSUs holds the key to whether they prove to be Value buys or mere Value traps.
#6
Financials56%
Oil & Gas44%
12 December 2014 35
19th Annual Wealth Creation Study (2009-2014)
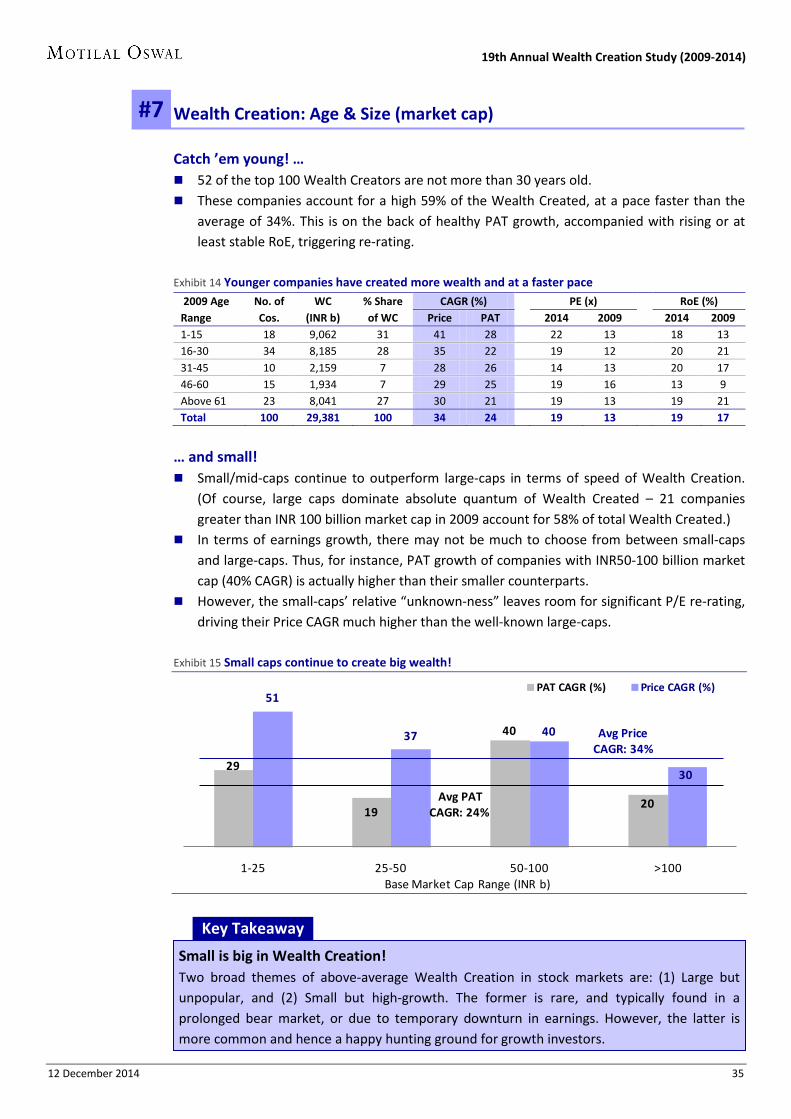
Wealth Creation: Age & Size (market cap)
Catch ’em young! … 52 of the top 100 Wealth Creators are not more than 30 years old. These companies account for a high 59% of the Wealth Created, at a pace faster than the
average of 34%. This is on the back of healthy PAT growth, accompanied with rising or at least stable RoE, triggering re-rating.
Exhibit 14 Younger companies have created more wealth and at a faster pace
2009 Age No. of WC % Share CAGR (%) PE (x) RoE (%) Range Cos. (INR b) of WC Price PAT 2014 2009 2014 2009 1-15 18 9,062 31 41 28 22 13 18 13 16-30 34 8,185 28 35 22 19 12 20 21 31-45 10 2,159 7 28 26 14 13 20 17 46-60 15 1,934 7 29 25 19 16 13 9 Above 61 23 8,041 27 30 21 19 13 19 21 Total 100 29,381 100 34 24 19 13 19 17
… and small! Small/mid-caps continue to outperform large-caps in terms of speed of Wealth Creation.
(Of course, large caps dominate absolute quantum of Wealth Created – 21 companies greater than INR 100 billion market cap in 2009 account for 58% of total Wealth Created.)
In terms of earnings growth, there may not be much to choose from between small-caps and large-caps. Thus, for instance, PAT growth of companies with INR50-100 billion market cap (40% CAGR) is actually higher than their smaller counterparts.
However, the small-caps’ relative “unknown-ness” leaves room for significant P/E re-rating, driving their Price CAGR much higher than the well-known large-caps.
Exhibit 15 Small caps continue to create big wealth!
29
19
40
20
51
37 40
30
1-25 25-50 50-100 >100
PAT CAGR (%) Price CAGR (%)
Avg PATCAGR: 24%
Base Market Cap Range (INR b)
Avg PriceCAGR: 34%
Key Takeaway
Small is big in Wealth Creation! Two broad themes of above-average Wealth Creation in stock markets are: (1) Large but unpopular, and (2) Small but high-growth. The former is rare, and typically found in a prolonged bear market, or due to temporary downturn in earnings. However, the latter is more common and hence a happy hunting ground for growth investors.
#7
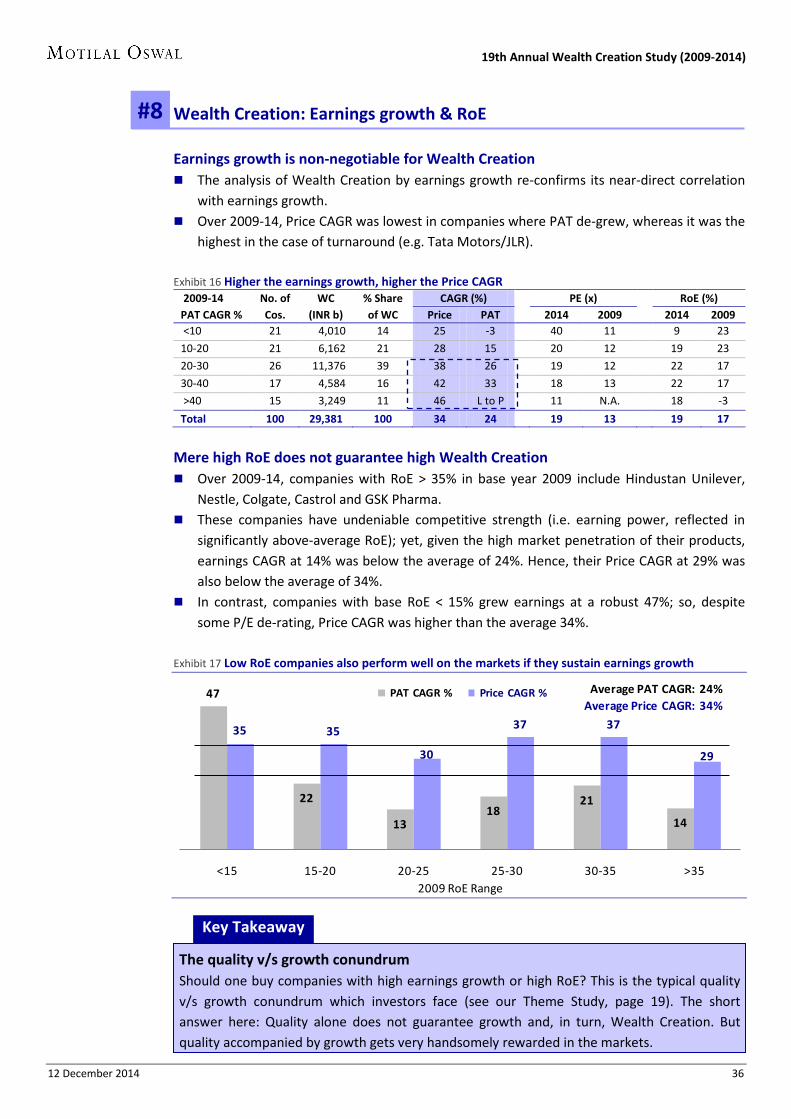
12 December 2014 36
19th Annual Wealth Creation Study (2009-2014)
Wealth Creation: Earnings growth & RoE
Earnings growth is non-negotiable for Wealth Creation The analysis of Wealth Creation by earnings growth re-confirms its near-direct correlation
with earnings growth. Over 2009-14, Price CAGR was lowest in companies where PAT de-grew, whereas it was the
highest in the case of turnaround (e.g. Tata Motors/JLR).
Exhibit 16 Higher the earnings growth, higher the Price CAGR
2009-14 No. of WC % Share CAGR (%) PE (x) RoE (%) PAT CAGR % Cos. (INR b) of WC Price PAT 2014 2009 2014 2009 <10 21 4,010 14 25 -3 40 11 9 23
10-20 21 6,162 21 28 15 20 12 19 23
20-30 26 11,376 39 38 26 19 12 22 17
30-40 17 4,584 16 42 33 18 13 22 17
>40 15 3,249 11 46 L to P 11 N.A. 18 -3
Total 100 29,381 100 34 24 19 13 19 17
Mere high RoE does not guarantee high Wealth Creation Over 2009-14, companies with RoE > 35% in base year 2009 include Hindustan Unilever,
Nestle, Colgate, Castrol and GSK Pharma. These companies have undeniable competitive strength (i.e. earning power, reflected in
significantly above-average RoE); yet, given the high market penetration of their products, earnings CAGR at 14% was below the average of 24%. Hence, their Price CAGR at 29% was also below the average of 34%.
In contrast, companies with base RoE < 15% grew earnings at a robust 47%; so, despite some P/E de-rating, Price CAGR was higher than the average 34%.
Exhibit 17 Low RoE companies also perform well on the markets if they sustain earnings growth
47
22
1318
21
14
35 35
30
37 37
29
<15 15-20 20-25 25-30 30-35 >35
PAT CAGR % Price CAGR % Average PAT CAGR: 24%Average Price CAGR: 34%
2009 RoE Range
Key Takeaway
The quality v/s growth conundrum Should one buy companies with high earnings growth or high RoE? This is the typical quality v/s growth conundrum which investors face (see our Theme Study, page 19). The short answer here: Quality alone does not guarantee growth and, in turn, Wealth Creation. But quality accompanied by growth gets very handsomely rewarded in the markets.
#8
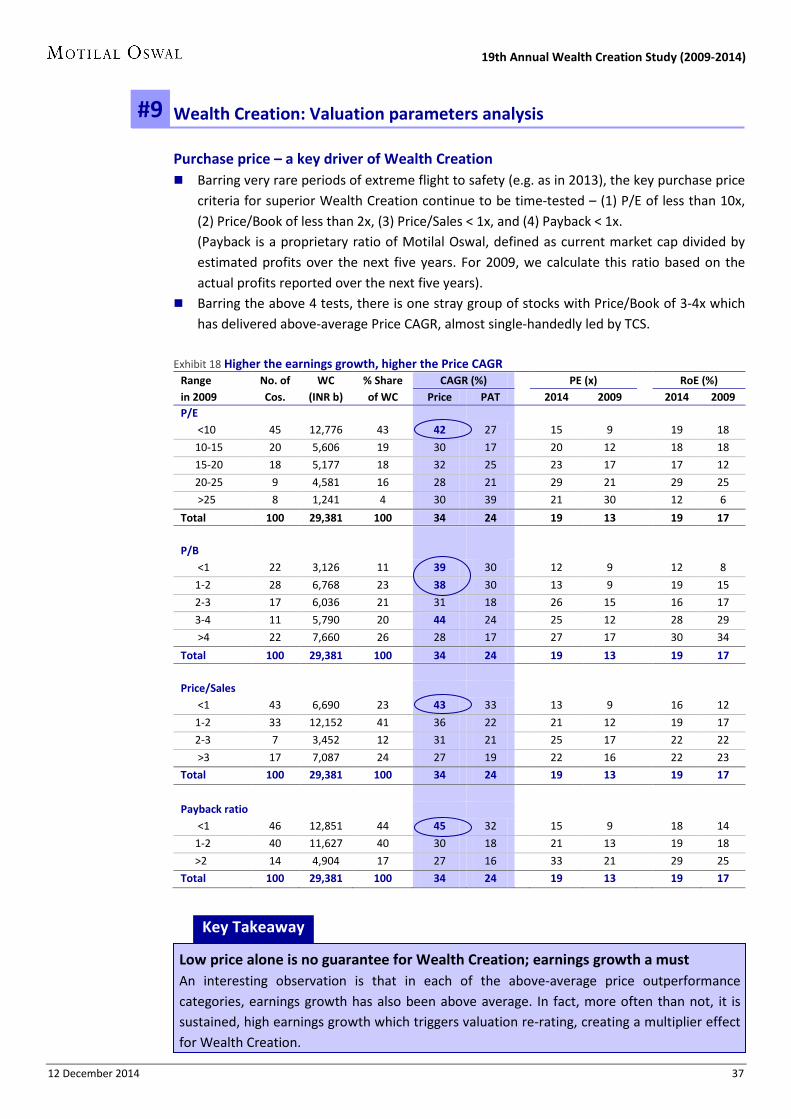
12 December 2014 37
19th Annual Wealth Creation Study (2009-2014)
Wealth Creation: Valuation parameters analysis
Purchase price – a key driver of Wealth Creation Barring very rare periods of extreme flight to safety (e.g. as in 2013), the key purchase price
criteria for superior Wealth Creation continue to be time-tested – (1) P/E of less than 10x, (2) Price/Book of less than 2x, (3) Price/Sales < 1x, and (4) Payback < 1x. (Payback is a proprietary ratio of Motilal Oswal, defined as current market cap divided by estimated profits over the next five years. For 2009, we calculate this ratio based on the actual profits reported over the next five years).
Barring the above 4 tests, there is one stray group of stocks with Price/Book of 3-4x which has delivered above-average Price CAGR, almost single-handedly led by TCS.
Exhibit 18 Higher the earnings growth, higher the Price CAGR
Range No. of WC % Share CAGR (%) PE (x) RoE (%) in 2009 Cos. (INR b) of WC Price PAT 2014 2009 2014 2009 P/E
<10 45 12,776 43 42 27 15 9 19 18
10-15 20 5,606 19 30 17 20 12 18 18
15-20 18 5,177 18 32 25 23 17 17 12
20-25 9 4,581 16 28 21 29 21 29 25
>25 8 1,241 4 30 39 21 30 12 6
Total 100 29,381 100 34 24 19 13 19 17
P/B
<1 22 3,126 11 39 30 12 9 12 8
1-2 28 6,768 23 38 30 13 9 19 15
2-3 17 6,036 21 31 18 26 15 16 17
3-4 11 5,790 20 44 24 25 12 28 29
>4 22 7,660 26 28 17 27 17 30 34
Total 100 29,381 100 34 24 19 13 19 17
Price/Sales
<1 43 6,690 23 43 33 13 9 16 12
1-2 33 12,152 41 36 22 21 12 19 17
2-3 7 3,452 12 31 21 25 17 22 22
>3 17 7,087 24 27 19 22 16 22 23
Total 100 29,381 100 34 24 19 13 19 17
Payback ratio
<1 46 12,851 44 45 32 15 9 18 14
1-2 40 11,627 40 30 18 21 13 19 18
>2 14 4,904 17 27 16 33 21 29 25
Total 100 29,381 100 34 24 19 13 19 17
Key Takeaway
Low price alone is no guarantee for Wealth Creation; earnings growth a must An interesting observation is that in each of the above-average price outperformance categories, earnings growth has also been above average. In fact, more often than not, it is sustained, high earnings growth which triggers valuation re-rating, creating a multiplier effect for Wealth Creation.
#9
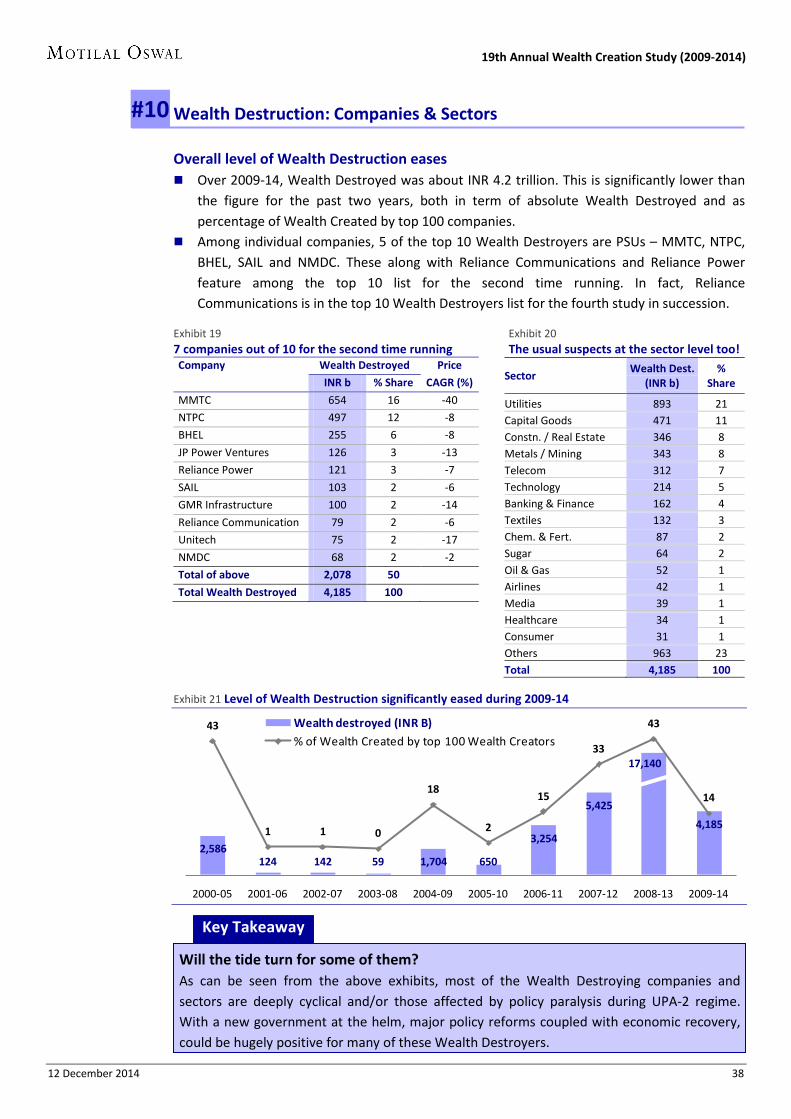
12 December 2014 38
19th Annual Wealth Creation Study (2009-2014)
Wealth Destruction: Companies & Sectors
Overall level of Wealth Destruction eases Over 2009-14, Wealth Destroyed was about INR 4.2 trillion. This is significantly lower than
the figure for the past two years, both in term of absolute Wealth Destroyed and as percentage of Wealth Created by top 100 companies.
Among individual companies, 5 of the top 10 Wealth Destroyers are PSUs – MMTC, NTPC, BHEL, SAIL and NMDC. These along with Reliance Communications and Reliance Power feature among the top 10 list for the second time running. In fact, Reliance Communications is in the top 10 Wealth Destroyers list for the fourth study in succession.
Exhibit 19 Exhibit 20 7 companies out of 10 for the second time running The usual suspects at the sector level too! Company Wealth Destroyed Price
INR b % Share CAGR (%)
MMTC 654 16 -40
NTPC 497 12 -8
BHEL 255 6 -8
JP Power Ventures 126 3 -13
Reliance Power 121 3 -7
SAIL 103 2 -6
GMR Infrastructure 100 2 -14
Reliance Communication 79 2 -6
Unitech 75 2 -17
NMDC 68 2 -2
Total of above 2,078 50
Total Wealth Destroyed 4,185 100
Exhibit 21 Level of Wealth Destruction significantly eased during 2009-14
2,586124 142 59 1,704 650
3,254
5,425
17,140
4,185
43
1 1 0
18
2
15
33
43
14
2000-05 2001-06 2002-07 2003-08 2004-09 2005-10 2006-11 2007-12 2008-13 2009-14
Wealth destroyed (INR B)% of Wealth Created by top 100 Wealth Creators
Sector Wealth Dest.
(INR b) %
Share
Utilities 893 21 Capital Goods 471 11 Constn. / Real Estate 346 8 Metals / Mining 343 8 Telecom 312 7 Technology 214 5 Banking & Finance 162 4 Textiles 132 3 Chem. & Fert. 87 2 Sugar 64 2 Oil & Gas 52 1 Airlines 42 1 Media 39 1 Healthcare 34 1 Consumer 31 1 Others 963 23 Total 4,185 100
Key Takeaway
.
#10
Key Takeaway
Will the tide turn for some of them? As can be seen from the above exhibits, most of the Wealth Destroying companies and sectors are deeply cyclical and/or those affected by policy paralysis during UPA-2 regime. With a new government at the helm, major policy reforms coupled with economic recovery, could be hugely positive for many of these Wealth Destroyers.
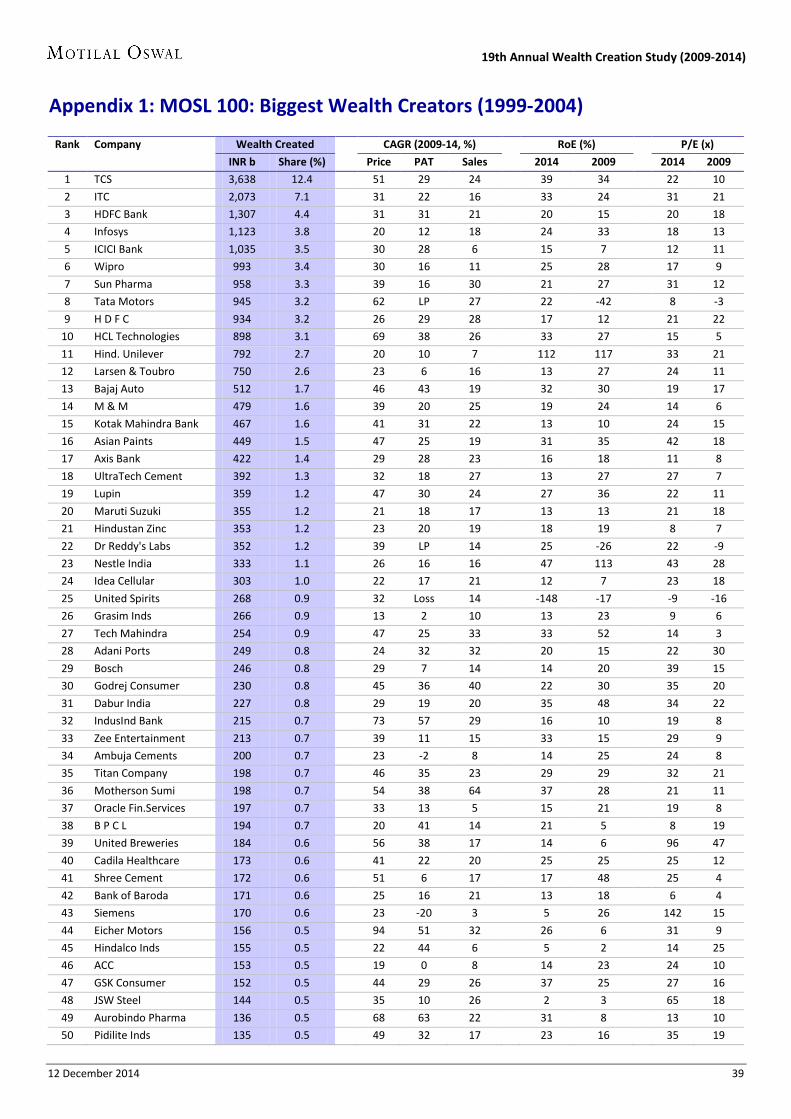
12 December 2014 39
19th Annual Wealth Creation Study (2009-2014)
Appendix 1: MOSL 100: Biggest Wealth Creators (1999-2004)
Rank Company Wealth Created CAGR (2009-14, %) RoE (%) P/E (x)
INR b Share (%) Price PAT Sales 2014 2009 2014 2009
1 TCS 3,638 12.4 51 29 24 39 34 22 10
2 ITC 2,073 7.1 31 22 16 33 24 31 21
3 HDFC Bank 1,307 4.4 31 31 21 20 15 20 18
4 Infosys 1,123 3.8 20 12 18 24 33 18 13
5 ICICI Bank 1,035 3.5 30 28 6 15 7 12 11
6 Wipro 993 3.4 30 16 11 25 28 17 9
7 Sun Pharma 958 3.3 39 16 30 21 27 31 12
8 Tata Motors 945 3.2 62 LP 27 22 -42 8 -3
9 H D F C 934 3.2 26 29 28 17 12 21 22
10 HCL Technologies 898 3.1 69 38 26 33 27 15 5
11 Hind. Unilever 792 2.7 20 10 7 112 117 33 21
12 Larsen & Toubro 750 2.6 23 6 16 13 27 24 11
13 Bajaj Auto 512 1.7 46 43 19 32 30 19 17
14 M & M 479 1.6 39 20 25 19 24 14 6
15 Kotak Mahindra Bank 467 1.6 41 31 22 13 10 24 15
16 Asian Paints 449 1.5 47 25 19 31 35 42 18
17 Axis Bank 422 1.4 29 28 23 16 18 11 8
18 UltraTech Cement 392 1.3 32 18 27 13 27 27 7
19 Lupin 359 1.2 47 30 24 27 36 22 11
20 Maruti Suzuki 355 1.2 21 18 17 13 13 21 18
21 Hindustan Zinc 353 1.2 23 20 19 18 19 8 7
22 Dr Reddy's Labs 352 1.2 39 LP 14 25 -26 22 -9
23 Nestle India 333 1.1 26 16 16 47 113 43 28
24 Idea Cellular 303 1.0 22 17 21 12 7 23 18
25 United Spirits 268 0.9 32 Loss 14 -148 -17 -9 -16
26 Grasim Inds 266 0.9 13 2 10 13 23 9 6
27 Tech Mahindra 254 0.9 47 25 33 33 52 14 3
28 Adani Ports 249 0.8 24 32 32 20 15 22 30
29 Bosch 246 0.8 29 7 14 14 20 39 15
30 Godrej Consumer 230 0.8 45 36 40 22 30 35 20
31 Dabur India 227 0.8 29 19 20 35 48 34 22
32 IndusInd Bank 215 0.7 73 57 29 16 10 19 8
33 Zee Entertainment 213 0.7 39 11 15 33 15 29 9
34 Ambuja Cements 200 0.7 23 -2 8 14 25 24 8
35 Titan Company 198 0.7 46 35 23 29 29 32 21
36 Motherson Sumi 198 0.7 54 38 64 37 28 21 11
37 Oracle Fin.Services 197 0.7 33 13 5 15 21 19 8
38 B P C L 194 0.7 20 41 14 21 5 8 19
39 United Breweries 184 0.6 56 38 17 14 6 96 47
40 Cadila Healthcare 173 0.6 41 22 20 25 25 25 12
41 Shree Cement 172 0.6 51 6 17 17 48 25 4
42 Bank of Baroda 171 0.6 25 16 21 13 18 6 4
43 Siemens 170 0.6 23 -20 3 5 26 142 15
44 Eicher Motors 156 0.5 94 51 32 26 6 31 9
45 Hindalco Inds 155 0.5 22 44 6 5 2 14 25
46 ACC 153 0.5 19 0 8 14 23 24 10
47 GSK Consumer 152 0.5 44 29 26 37 25 27 16
48 JSW Steel 144 0.5 35 10 26 2 3 65 18
49 Aurobindo Pharma 136 0.5 68 63 22 31 8 13 10
50 Pidilite Inds 135 0.5 49 32 17 23 16 35 19

12 December 2014 40
19th Annual Wealth Creation Study (2009-2014)
Appendix 1: MOSL 100: Biggest Wealth Creators (1999-2004) … continued
Rank Company Wealth Created CAGR (2009-14, %) RoE (%) P/E (x)
INR b Share (%) Price PAT Sales 2014 2009 2014 2009
51 Cummins India 128 0.4 35 6 2 23 30 28 8
52 Shriram Transport 127 0.4 33 17 18 16 26 13 6
53 GSK Pharma 126 0.4 19 -4 9 24 38 45 16
54 Colgate-Palmolive 123 0.4 24 13 16 90 134 35 22
55 Yes Bank 121 0.4 53 40 38 23 19 9 5
56 Divi's Labs 120 0.4 23 13 16 26 34 23 15
57 Rural Elec. Corpn. 117 0.4 19 30 29 23 21 5 6
58 Castrol India 113 0.4 31 14 7 68 55 30 15
59 M & M Financial 110 0.4 43 34 31 18 15 15 9
60 Havells India 110 0.4 67 LP 10 27 -26 26 -5
61 Glenmark Pharma 110 0.4 29 23 24 18 12 28 20
62 Ipca Labs 98 0.3 67 38 20 24 15 22 9
63 Marico 96 0.3 28 22 14 37 42 27 19
64 Apollo Hospitals 95 0.3 35 29 22 10 6 42 29
65 Sun TV Network 93 0.3 19 17 16 24 20 21 19
66 Bajaj Finserv 92 0.3 37 103 91 24 2 6 38
67 Godrej Industries 86 0.3 43 25 19 11 7 36 17
68 LIC Housing Finance 85 0.3 39 20 26 17 23 9 4
69 MRF 85 0.3 65 41 19 22 13 11 5
70 Emami 82 0.3 45 34 19 43 31 25 14
71 P & G Hygiene 79 0.3 34 11 22 30 41 34 14
72 Blue Dart Express 78 0.3 55 9 15 19 20 73 13
73 Bajaj Holdings 78 0.3 28 1 24 3 7 35 10
74 Piramal Enterprises 78 0.3 23 PL 7 -5 24 -19 13
75 Torrent Pharma 77 0.3 51 29 21 35 28 13 6
76 Bharat Forge 76 0.3 34 64 7 18 2 20 53
77 Bajaj Finance 76 0.3 93 84 47 18 3 12 7
78 Aditya Birla Nuvo 75 0.3 20 LP 14 11 -11 12 -7
79 Petronet LNG 74 0.3 29 7 35 14 26 14 6
80 Apollo Tyres 71 0.2 54 49 22 22 10 8 7
81 ING Vysya Bank 70 0.2 37 28 18 9 12 18 7
82 CRISIL 69 0.2 35 16 17 44 39 29 14
83 Page Industries 68 0.2 78 37 36 53 36 47 13
84 Thermax 68 0.2 33 -5 9 11 29 41 7
85 Britannia Inds 67 0.2 25 23 15 50 20 26 24
86 Berger Paints 67 0.2 46 25 19 22 21 32 13
87 Bata India 66 0.2 61 26 16 24 23 38 11
88 Exide Inds 64 0.2 24 13 17 16 31 19 11
89 Sundaram Finance 64 0.2 52 27 19 19 14 13 5
90 Amara Raja Batteries 64 0.2 84 35 21 27 20 18 4
91 Supreme Inds 61 0.2 88 24 19 26 31 23 3
92 J & K Bank 59 0.2 38 24 18 21 16 6 4
93 Federal Bank 58 0.2 28 12 16 12 11 10 5
94 Tata Global 58 0.2 21 -9 10 9 23 18 4
95 Info Edge (India) 56 0.2 42 1 18 9 18 111 20
96 Biocon 56 0.2 24 34 12 14 7 20 29
97 Bhushan Steel 55 0.2 42 -33 14 1 21 176 4
98 Kansai Nerolac 51 0.2 39 16 18 15 15 30 12
99 Coromandel Inter 50 0.2 37 -8 1 16 46 17 2
100 Bayer Crop Science 50 0.2 43 25 18 17 21 19 10
TOTAL 29,381 100 34 24 18 19 17 19 13

12 December 2014 41
19th Annual Wealth Creation Study (2009-2014)
Appendix 2: MOSL 100: Fastest Wealth Creators (1999-2004)
Rank Company 2009-14 Price CAGR 09-14 (%)
Wealth Created
RoE (%)
P/E (x)
CAGR (%) Times (x) PAT Sales INR b Share (%) 2014 2009 2014 2009
1 Eicher Motors 94 27 51 32 156 0.5 26 6 31 9
2 Bajaj Finance 93 27 84 47 76 0.3 18 3 12 7
3 Supreme Inds 88 24 24 19 61 0.2 26 31 23 3
4 Amara Raja Batt. 84 21 35 21 64 0.2 27 20 18 4
5 Page Industries 78 18 37 36 68 0.2 53 36 47 13
6 IndusInd Bank 73 16 57 29 215 0.7 16 10 19 8
7 HCL Technologies 69 14 38 26 898 3.1 33 27 15 5
8 Aurobindo Pharma 68 13 63 22 136 0.5 31 8 13 10
9 Havells India 67 13 LP 10 110 0.4 27 -26 26 -5
10 Ipca Labs 67 13 38 20 98 0.3 24 15 22 9
11 MRF 65 12 41 19 85 0.3 22 13 11 5
12 Tata Motors 62 11 LP 27 945 3.2 22 -42 8 -3
13 Bata India 61 11 26 16 66 0.2 24 23 38 11
14 United Breweries 56 9 38 17 184 0.6 14 6 96 47
15 Blue Dart Exp. 55 9 9 15 78 0.3 19 20 73 13
16 Apollo Tyres 54 9 49 22 71 0.2 22 10 8 7
17 Motherson Sumi 54 9 38 64 198 0.7 37 28 21 11
18 Yes Bank 53 8 40 38 121 0.4 23 19 9 5
19 Sundaram Finance 52 8 27 19 64 0.2 19 14 13 5
20 Shree Cement 51 8 6 17 172 0.6 17 48 25 4
21 TCS 51 8 29 24 3,638 12.4 39 34 22 10
22 Torrent Pharma 51 8 29 21 77 0.3 35 28 13 6
23 Pidilite Inds 49 7 32 17 135 0.5 23 16 35 19
24 Asian Paints 47 7 25 19 449 1.5 31 35 42 18
25 Lupin 47 7 30 24 359 1.2 27 36 22 11
26 Tech Mahindra 47 7 25 33 254 0.9 33 52 14 3
27 Titan Company 46 7 35 23 198 0.7 29 29 32 21
28 Bajaj Auto 46 7 43 19 512 1.7 32 30 19 17
29 Berger Paints 46 7 25 19 67 0.2 22 21 32 13
30 Godrej Consumer 45 6 36 40 230 0.8 22 30 35 20
31 Emami 45 6 34 19 82 0.3 43 31 25 14
32 GlaxoSmith C H L 44 6 29 26 152 0.5 37 25 27 16
33 Bayer Crop Science 43 6 25 18 50 0.2 17 21 19 10
34 M & M Financial 43 6 34 31 110 0.4 18 15 15 9
35 Godrej Industries 43 6 25 19 86 0.3 11 7 36 17
36 Bhushan Steel 42 6 -33 14 55 0.2 1 21 176 4
37 Info Edge (India) 42 6 1 18 56 0.2 9 18 111 20
38 Cadila Healthcare 41 6 22 20 173 0.6 25 25 25 12
39 Kotak Mahindra 41 5 31 22 467 1.6 13 10 24 15
40 LIC Housing Finance 39 5 20 26 85 0.3 17 23 9 4
41 Dr Reddy's Labs 39 5 LP 14 352 1.2 25 -26 22 -9
42 Kansai Nerolac 39 5 16 18 51 0.2 15 15 30 12
43 Sun Pharma 39 5 16 30 958 3.3 21 27 31 12
44 M & M 39 5 20 25 479 1.6 19 24 14 6
45 Zee Entertainment 39 5 11 15 213 0.7 33 15 29 9
46 J & K Bank 38 5 24 18 59 0.2 21 16 6 4
47 Coromandel Inter 37 5 -8 1 50 0.2 16 46 17 2
48 ING Vysya Bank 37 5 28 18 70 0.2 9 12 18 7
49 Bajaj Finserv 37 5 103 91 92 0.3 24 2 6 38
50 CRISIL 35 5 16 17 69 0.2 44 39 29 14
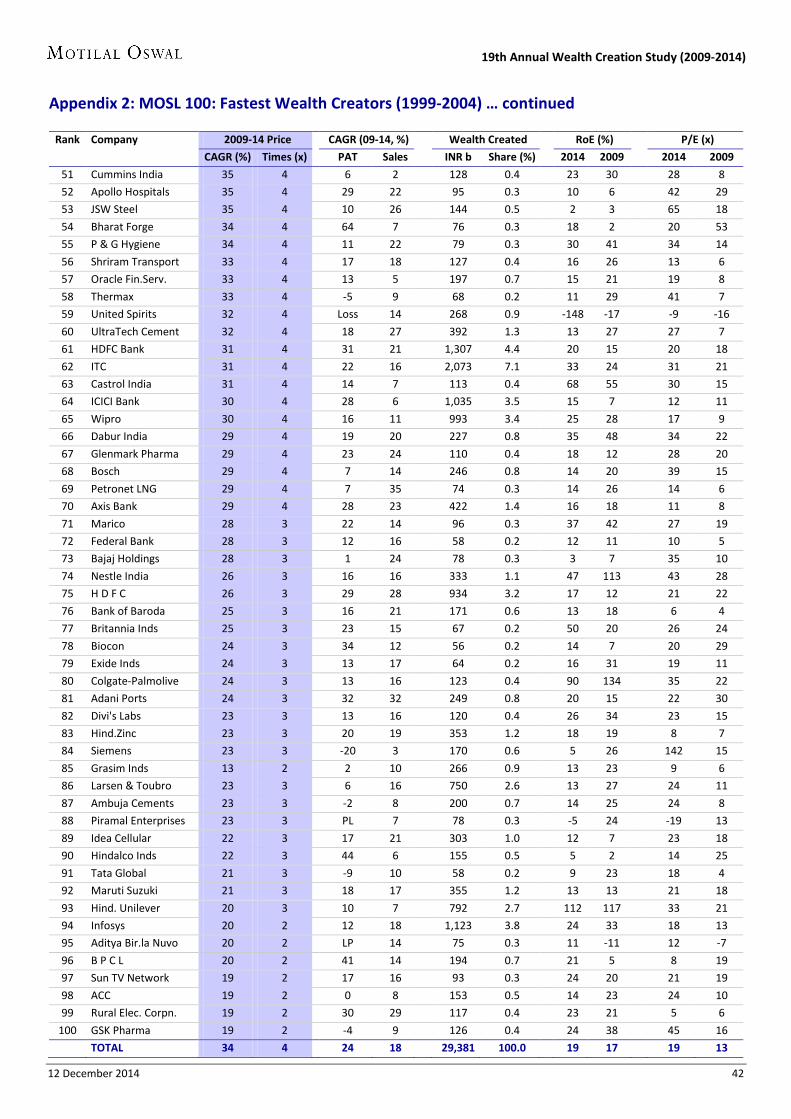
12 December 2014 42
19th Annual Wealth Creation Study (2009-2014)
Appendix 2: MOSL 100: Fastest Wealth Creators (1999-2004) … continued
Rank Company 2009-14 Price CAGR (09-14, %) Wealth Created RoE (%) P/E (x)
CAGR (%) Times (x) PAT Sales INR b Share (%) 2014 2009 2014 2009
51 Cummins India 35 4 6 2 128 0.4 23 30 28 8
52 Apollo Hospitals 35 4 29 22 95 0.3 10 6 42 29
53 JSW Steel 35 4 10 26 144 0.5 2 3 65 18
54 Bharat Forge 34 4 64 7 76 0.3 18 2 20 53
55 P & G Hygiene 34 4 11 22 79 0.3 30 41 34 14
56 Shriram Transport 33 4 17 18 127 0.4 16 26 13 6
57 Oracle Fin.Serv. 33 4 13 5 197 0.7 15 21 19 8
58 Thermax 33 4 -5 9 68 0.2 11 29 41 7
59 United Spirits 32 4 Loss 14 268 0.9 -148 -17 -9 -16
60 UltraTech Cement 32 4 18 27 392 1.3 13 27 27 7
61 HDFC Bank 31 4 31 21 1,307 4.4 20 15 20 18
62 ITC 31 4 22 16 2,073 7.1 33 24 31 21
63 Castrol India 31 4 14 7 113 0.4 68 55 30 15
64 ICICI Bank 30 4 28 6 1,035 3.5 15 7 12 11
65 Wipro 30 4 16 11 993 3.4 25 28 17 9
66 Dabur India 29 4 19 20 227 0.8 35 48 34 22
67 Glenmark Pharma 29 4 23 24 110 0.4 18 12 28 20
68 Bosch 29 4 7 14 246 0.8 14 20 39 15
69 Petronet LNG 29 4 7 35 74 0.3 14 26 14 6
70 Axis Bank 29 4 28 23 422 1.4 16 18 11 8
71 Marico 28 3 22 14 96 0.3 37 42 27 19
72 Federal Bank 28 3 12 16 58 0.2 12 11 10 5
73 Bajaj Holdings 28 3 1 24 78 0.3 3 7 35 10
74 Nestle India 26 3 16 16 333 1.1 47 113 43 28
75 H D F C 26 3 29 28 934 3.2 17 12 21 22
76 Bank of Baroda 25 3 16 21 171 0.6 13 18 6 4
77 Britannia Inds 25 3 23 15 67 0.2 50 20 26 24
78 Biocon 24 3 34 12 56 0.2 14 7 20 29
79 Exide Inds 24 3 13 17 64 0.2 16 31 19 11
80 Colgate-Palmolive 24 3 13 16 123 0.4 90 134 35 22
81 Adani Ports 24 3 32 32 249 0.8 20 15 22 30
82 Divi's Labs 23 3 13 16 120 0.4 26 34 23 15
83 Hind.Zinc 23 3 20 19 353 1.2 18 19 8 7
84 Siemens 23 3 -20 3 170 0.6 5 26 142 15
85 Grasim Inds 13 2 2 10 266 0.9 13 23 9 6
86 Larsen & Toubro 23 3 6 16 750 2.6 13 27 24 11
87 Ambuja Cements 23 3 -2 8 200 0.7 14 25 24 8
88 Piramal Enterprises 23 3 PL 7 78 0.3 -5 24 -19 13
89 Idea Cellular 22 3 17 21 303 1.0 12 7 23 18
90 Hindalco Inds 22 3 44 6 155 0.5 5 2 14 25
91 Tata Global 21 3 -9 10 58 0.2 9 23 18 4
92 Maruti Suzuki 21 3 18 17 355 1.2 13 13 21 18
93 Hind. Unilever 20 3 10 7 792 2.7 112 117 33 21
94 Infosys 20 2 12 18 1,123 3.8 24 33 18 13
95 Aditya Bir.la Nuvo 20 2 LP 14 75 0.3 11 -11 12 -7
96 B P C L 20 2 41 14 194 0.7 21 5 8 19
97 Sun TV Network 19 2 17 16 93 0.3 24 20 21 19
98 ACC 19 2 0 8 153 0.5 14 23 24 10
99 Rural Elec. Corpn. 19 2 30 29 117 0.4 23 21 5 6
100 GSK Pharma 19 2 -4 9 126 0.4 24 38 45 16
TOTAL 34 4 24 18 29,381 100.0 19 17 19 13
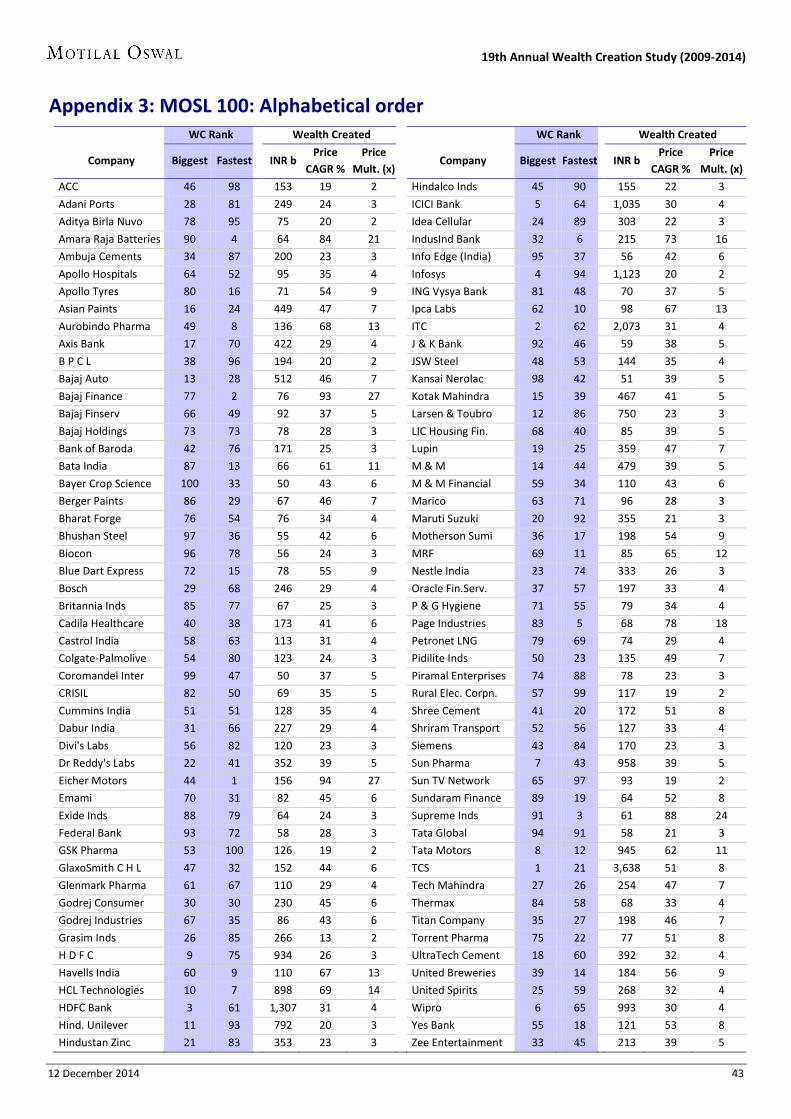
12 December 2014 43
19th Annual Wealth Creation Study (2009-2014)
Appendix 3: MOSL 100: Alphabetical order
WC Rank Wealth Created WC Rank Wealth Created
Company Biggest Fastest INR b Price
CAGR % Price
Mult. (x) Company Biggest Fastest INR b
Price CAGR %
Price Mult. (x)
ACC 46 98 153 19 2 Hindalco Inds 45 90 155 22 3
Adani Ports 28 81 249 24 3 ICICI Bank 5 64 1,035 30 4
Aditya Birla Nuvo 78 95 75 20 2 Idea Cellular 24 89 303 22 3
Amara Raja Batteries 90 4 64 84 21 IndusInd Bank 32 6 215 73 16
Ambuja Cements 34 87 200 23 3 Info Edge (India) 95 37 56 42 6
Apollo Hospitals 64 52 95 35 4 Infosys 4 94 1,123 20 2
Apollo Tyres 80 16 71 54 9 ING Vysya Bank 81 48 70 37 5
Asian Paints 16 24 449 47 7 Ipca Labs 62 10 98 67 13
Aurobindo Pharma 49 8 136 68 13 ITC 2 62 2,073 31 4
Axis Bank 17 70 422 29 4 J & K Bank 92 46 59 38 5
B P C L 38 96 194 20 2 JSW Steel 48 53 144 35 4
Bajaj Auto 13 28 512 46 7 Kansai Nerolac 98 42 51 39 5
Bajaj Finance 77 2 76 93 27 Kotak Mahindra 15 39 467 41 5
Bajaj Finserv 66 49 92 37 5 Larsen & Toubro 12 86 750 23 3
Bajaj Holdings 73 73 78 28 3 LIC Housing Fin. 68 40 85 39 5
Bank of Baroda 42 76 171 25 3 Lupin 19 25 359 47 7
Bata India 87 13 66 61 11 M & M 14 44 479 39 5
Bayer Crop Science 100 33 50 43 6 M & M Financial 59 34 110 43 6
Berger Paints 86 29 67 46 7 Marico 63 71 96 28 3
Bharat Forge 76 54 76 34 4 Maruti Suzuki 20 92 355 21 3
Bhushan Steel 97 36 55 42 6 Motherson Sumi 36 17 198 54 9
Biocon 96 78 56 24 3 MRF 69 11 85 65 12
Blue Dart Express 72 15 78 55 9 Nestle India 23 74 333 26 3
Bosch 29 68 246 29 4 Oracle Fin.Serv. 37 57 197 33 4
Britannia Inds 85 77 67 25 3 P & G Hygiene 71 55 79 34 4
Cadila Healthcare 40 38 173 41 6 Page Industries 83 5 68 78 18
Castrol India 58 63 113 31 4 Petronet LNG 79 69 74 29 4
Colgate-Palmolive 54 80 123 24 3 Pidilite Inds 50 23 135 49 7
Coromandel Inter 99 47 50 37 5 Piramal Enterprises 74 88 78 23 3
CRISIL 82 50 69 35 5 Rural Elec. Corpn. 57 99 117 19 2
Cummins India 51 51 128 35 4 Shree Cement 41 20 172 51 8
Dabur India 31 66 227 29 4 Shriram Transport 52 56 127 33 4
Divi's Labs 56 82 120 23 3 Siemens 43 84 170 23 3
Dr Reddy's Labs 22 41 352 39 5 Sun Pharma 7 43 958 39 5
Eicher Motors 44 1 156 94 27 Sun TV Network 65 97 93 19 2
Emami 70 31 82 45 6 Sundaram Finance 89 19 64 52 8
Exide Inds 88 79 64 24 3 Supreme Inds 91 3 61 88 24
Federal Bank 93 72 58 28 3 Tata Global 94 91 58 21 3
GSK Pharma 53 100 126 19 2 Tata Motors 8 12 945 62 11
GlaxoSmith C H L 47 32 152 44 6 TCS 1 21 3,638 51 8
Glenmark Pharma 61 67 110 29 4 Tech Mahindra 27 26 254 47 7
Godrej Consumer 30 30 230 45 6 Thermax 84 58 68 33 4
Godrej Industries 67 35 86 43 6 Titan Company 35 27 198 46 7
Grasim Inds 26 85 266 13 2 Torrent Pharma 75 22 77 51 8
H D F C 9 75 934 26 3 UltraTech Cement 18 60 392 32 4
Havells India 60 9 110 67 13 United Breweries 39 14 184 56 9
HCL Technologies 10 7 898 69 14 United Spirits 25 59 268 32 4
HDFC Bank 3 61 1,307 31 4 Wipro 6 65 993 30 4
Hind. Unilever 11 93 792 20 3 Yes Bank 55 18 121 53 8
Hindustan Zinc 21 83 353 23 3 Zee Entertainment 33 45 213 39 5

12 December 2014 44
19th Annual Wealth Creation Study (2009-2014)
N O T E S

October 2014 18
Disclosures This research report has been prepared by MOSt to provide information about the company(ies) and sector(s), if any, covered in the report and may be distributed by it and/or its affiliated company(ies). This report is for personal information of the select recipient and does not construe to be any investment, legal or taxation advice to you. This research report does not constitute an offer, invitation or inducement to invest in securities or other investments and Motilal Oswal Securities Limited (hereinafter referred as MOSt) is not soliciting any action based upon it. This report is not for public distribution and has been furnished to you solely for your general information and should not be reproduced or redistributed to any other person in any form. This report does not constitute a personal recommendation or take into account the particular investment objectives, financial situations, or needs of individual clients. Before acting on any advice or recommendation in this material, investors should consider whether it is suitable for their particular circumstances and, if necessary, seek professional advice. The price and value of the investments referred to in this material and the income from them may go down as well as up, and investors may realize losses on any investments. Past performance is not a guide for future performance, future returns are not guaranteed and a loss of original capital may occur.
MOSt and its affiliates are a full-service, integrated investment banking, investment management, brokerage and financing group. We and our affiliates have investment banking and other business relationships with a significant percentage of the companies covered by our Research Department Our research professionals provide important input into our investment banking and other business selection processes. Investors should assume that MOSt and/or its affiliates are seeking or will seek investment banking or other business from the company or companies that are the subject of this material and that the research professionals who were involved in preparing this material may participate in the solicitation of such business. The research professionals responsible for the preparation of this document may interact with trading desk personnel, sales personnel and other parties for the purpose of gathering, applying and interpreting market information. Our research professionals are paid in part based on the profitability of MOSt which include earnings from investment banking and other business. MOSt generally prohibits its analysts, persons reporting to analysts, and members of their households from maintaining a financial interest in the securities or derivatives of any companies that the analysts cover. Additionally, MOSt generally prohibits its analysts and persons reporting to analysts from serving as an officer, director, or advisory board member of any companies that the analysts cover. Our salespeople, traders, and other professionals or affiliates may provide oral or written market commentary or trading strategies to our clients that reflect opinions that are contrary to the opinions expressed herein, and our proprietary trading and investing businesses may make investment decisions that are inconsistent with the recommendations expressed herein. In reviewing these materials, you should be aware that any or all o the foregoing, among other things, may give rise to real or potential conflicts of interest . MOSt and its affiliated company(ies), their directors and employees may; (a) from time to time, have a long or short position in, and buy or sell the securities of the company(ies) mentioned herein or (b) be engaged in any other transaction involving such securities and earn brokerage or other compensation or act as a market maker in the financial instruments of the company(ies) discussed herein or act as an advisor or lender/borrower to such company(ies) or may have any other potential conflict of interests with respect to any recommendation and other related information and opinions.
Unauthorized disclosure, use, dissemination or copying (either whole or partial) of this information, is prohibited. The person accessing this information specifically agrees to exempt MOSt or any of its affiliates or employees from, any and all responsibility/liability arising from such misuse and agrees not to hold MOSt or any of its affiliates or employees responsible for any such misuse and further agrees to hold MOSt or any of its affiliates or employees free and harmless from all losses, costs, damages, expenses that may be suffered by the person accessing this information due to any errors and delays. The information contained herein is based on publicly available data or other sources believed to be reliable. Any statements contained in this report attributed to a third party represent MOSt’s interpretation of the data, information and/or opinions provided by that third party either publicly or through a subscription service, and such use and interpretation have not been reviewed by the third party. This Report is not intended to be a complete statement or summary of the securities, markets or developments referred to in the document. While we would endeavor to update the information herein on reasonable basis, MOSt and/or its affiliates are under no obligation to update the information. Also there may be regulatory, compliance, or other reasons that may prevent MOSt and/or its affiliates from doing so. MOSt or any of its affiliates or employees shall not be in any way responsible and liable for any loss or damage that may arise to any person from any inadvertent error in the information contained in this report. MOSt or any of its affiliates or employees do not provide, at any time, any express or implied warranty of any kind, regarding any matter pertaining to this report, including without limitation the implied warranties of merchantability, fitness for a particular purpose, and non-infringement. The recipients of this report should rely on their own investigations.
Recipients who are not institutional investors should seek advice of their independent financial advisor prior to taking any investment decision based on this report or for any necessary explanation of its contents.
MOSt and/or its affiliates and/or employees may have interests/positions, financial or otherwise in the securities mentioned in this report. To enhance transparency, MOSt has incorporated a Disclosure of Interest Statement in this document. This should, however, not be treated as endorsement of the views expressed in the report.
Disclosure of Interest Statement Companies where there is interest Analyst ownership of the stock None
Analyst Certification The views expressed in this research report accurately reflect the personal views of the analyst(s) about the subject securities or issues, and no part of the compensation of the research analyst(s) was, is, or will be directly or indirectly related to the specific recommendations and views expressed by research analyst(s) in this report. The research analysts, strategists, or research associates principally responsible for preparation of MOSt research receive compensation based upon various factors, including quality of research, investor client feedback, stock picking, competitive factors and firm revenues.
Regional Disclosures (outside India) This report is not directed or intended for distribution to or use by any person or entity resident in a state, country or any jurisdiction, where such distribution, publication, availability or use would be contrary to law, regulation or which would subject MOSt & its group companies to registration or licensing requirements within such jurisdictions.
For U.K. This report is intended for distribution only to persons having professional experience in matters relating to investments as described in Article 19 of the Financial Services and Markets Act 2000 (Financial Promotion) Order 2005 (referred to as "investment professionals"). This document must not be acted on or relied on by persons who are not investment professionals. Any investment or investment activity to which this document relates is only available to investment professionals and will be engaged in only with such persons.
For U.S. Motilal Oswal Securities Limited (MOSL) is not a registered broker - dealer under the U.S. Securities Exchange Act of 1934, as amended (the"1934 act") and under applicable state laws in the United States. In addition MOSL is not a registered investment adviser under the U.S. Investment Advisers Act of 1940, as amended (the "Advisers Act" and together with the 1934 Act, the "Acts), and under applicable state laws in the United States. Accordingly, in the absence of specific exemption under the Acts, any brokerage and investment services provided by MOSL, including the products and services described herein are not available to or intended for U.S. persons.
This report is intended for distribution only to "Major Institutional Investors" as defined by Rule 15a-6(b)(4) of the Exchange Act and interpretations thereof by SEC (henceforth referred to as "major institutional investors"). This document must not be acted on or relied on by persons who are not major institutional investors. Any investment or investment activity to which this document relates is only available to major institutional investors and will be engaged in only with major institutional investors. In reliance on the exemption from registration provided by Rule 15a-6 of the U.S. Securities Exchange Act of 1934, as amended (the "Exchange Act") and interpretations thereof by the U.S. Securities and Exchange Commission ("SEC") in order to conduct business with Institutional Investors based in the U.S., MOSL has entered into a chaperoning agreement with a U.S. registered broker-dealer, Motilal Oswal Securities International Private Limited. ("MOSIPL"). Any business interaction pursuant to this report will have to be executed within the provisions of this chaperoning agreement.
The Research Analysts contributing to the report may not be registered /qualified as research analyst with FINRA. Such research analyst may not be associated persons of the U.S. registered broker-dealer, MOSIPL, and therefore, may not be subject to NASD rule 2711 and NYSE Rule 472 restrictions on communication with a subject company, public appearances and trading securities held by a research analyst account.
For Singapore Motilal Oswal Capital Markets Singapore Pte Limited is acting as an exempt financial advisor under section 23(1)(f) of the Financial Advisers Act(FAA) read with regulation 17(1)(d) of the Financial Advisors Regulations and is a subsidiary of Motilal Oswal Securities Limited in India. This research is distributed in Singapore by Motilal Oswal Capital Markets Singapore Pte Limited and it is only directed in Singapore to accredited investors, as defined in the Financial Advisers Regulations and the Securities and Futures Act (Chapter 289), as amended from time to time. In respect of any matter arising from or in connection with the research you could contact the following representatives of Motilal Oswal Capital Markets Singapore Pte Limited:
Anosh Koppikar Kadambari Balachandran Email:[email protected] Email : [email protected] Contact(+65)68189232 Contact: (+65) 68189233 / 65249115 Office Address:21 (Suite 31),16 Collyer Quay,Singapore 04931
Motilal Oswal Securities Ltd
Motilal Oswal Tower, Level 9, Sayani Road, Prabhadevi, Mumbai 400 025 Phone: +91 22 3982 5500 E-mail: [email protected]
Motilal Oswal Wealth Creation Gallery