Embed Size (px)
Citation preview

Indo-Gangetic Basin Impact Pathways Workshop
30 June - 2 July, 2006
Himalaya Hotel, Kathmandu, Nepal
Boru Douthwaite and Cristina de Leon
CPWF-BFP Impact Assessment Project

CPWF-BFP Impact Assessment Project
• Goal– To contribute to the CPWF fulfilling its impact potential– To contribute to the CPWF being perceived as a “coherent,
problem-focused research program”
• Purpose– CPWF scientists and management are using IA products
and methods
• Intervention– Carry out “exemplary” impact analysis
• Impact pathways; impact narratives; impact pathway evaluation; scenario analysis; extrapolation domain analysis
– Develop methodology

Impact Pathways
1. A visual description of the causal chain of events and outcomes that link outputs to the goal (logic model); and
2. Network maps that show the evolving relationships necessary to achieve the goal
• Implementing organizations; boundary partners; beneficiaries
Shows the project rationale; its logicShows multiple pathways

Impact pathways – a more complete picture….
<-----the full picture---->
>---------------ACTORS----------------.
>--
----
----
----
TIM
E-L
INE
----
----
----
----
-->
Lo
gic
mod
els
Network models
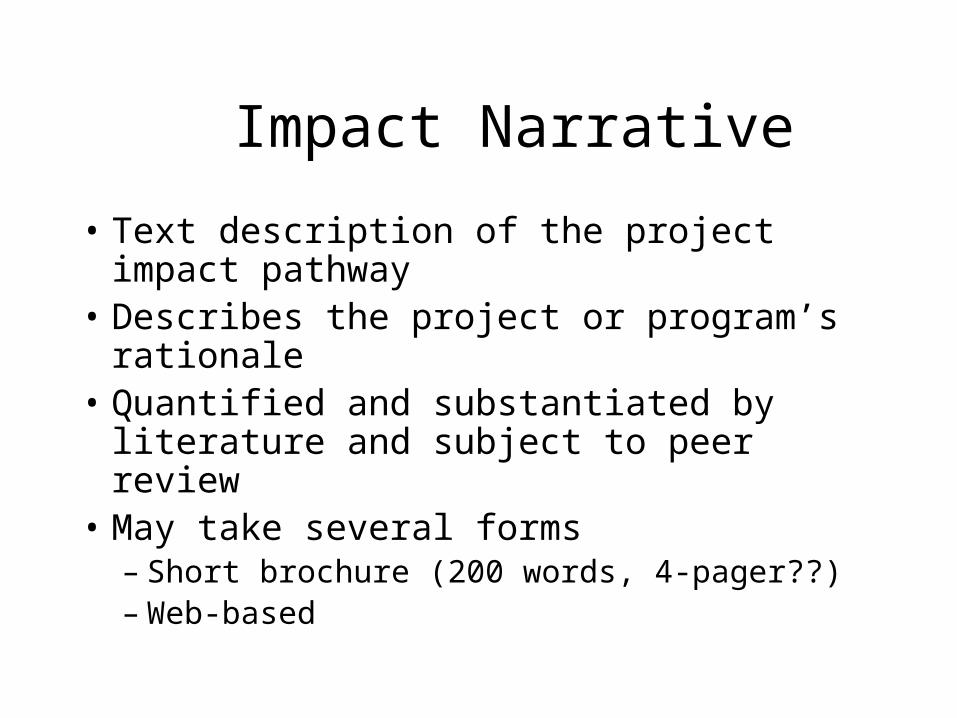
Impact Narrative
• Text description of the project impact pathway
• Describes the project or program’s rationale• Quantified and substantiated by literature
and subject to peer review• May take several forms
– Short brochure (200 words, 4-pager??)– Web-based

Why develop impact pathways and impact narratives?
• Show the project’s rationale– Help communicate what the project is doing
• More fundable
– Help with planning– Provide a basis for evaluation
• Starting point for evaluation is a good model of what you think will happen
• Help to write better project proposals

Foundations
• Impact Pathways; Impact Narratives– Adaptation of concepts from Program Evaluation
• Renger and Titcomb (2002) – problem trees
• Chen (2005) – program theory
• Mayne (2004) - performance stories
– Innovation histories • Douthwaite and Ashby, 2005
– Social network analysis• Cross and Parker, 2004

Project Problem Tree
Project Objective Tree
Outputs Vision
Project Tim eline
Network m aps
W hat needs to change
W hat thepro j ect w illproduce
W here pro j ect isgo ing- Goal
How pro j ectgoes fromoutputs to goals
Necessaryrelationshipsand how theyevolve
I m pact PathwaysModel ( = adoption
theory m odel in tegratedw ith netw ork m aps)
I m pact Narrative( = impact pathw ays model
+ text description)
Helps understandpro ject rationale
( Produced after w orkshop)
( Produced after w orkshop)
( Draft produced before w orkshop)
Workshop Road Map

Introductions and Expectations

Project Problem Tree
Project Objective Tree
Outputs Vision
Project Tim eline
Network m aps
W hat needs to change
W hat thepro j ect w illproduce
W here pro j ect isgo ing- Goal
How pro j ectgoes fromoutputs to goals
Necessaryrelationshipsand how theyevolve
I m pact PathwaysModel ( = adoption
theory m odel in tegratedw ith netw ork m aps)
I m pact Narrative( = impact pathw ays model
+ text description)
Helps understandpro ject rationale
( Produced after w orkshop)
( Produced after w orkshop)
( Draft produced before w orkshop)
Workshop Road Map

D epressedLivelihoods
LimitedReservoir
Productivity
UnderusedFisheries
ProductionC apacity
Bad HarvestingStrategies
Uncooperativeattitudes of fishers
w ith respect tomanagement of
fisheries resources
Lack of know ledgeof options ofenhancementtechnologies
Processinglimitations
Lack ofaquaculture
activities
S tart Here
D eterminants
Lack of financialresources capacity
to implementscenarios for
improved fisheriesproduction
1st LEVEL
2nd LEVEL3rd LEVEL4th LEVEL W hy is th is problem happening?
W hy?W hy?W hy?
Problem
PN 34 I m proved fisheries productivity Problem Tree

Exercise 1: Refining and presenting your Problem Trees
• Split into project groups• Reconstruct the problem tree, writing one problem
per card– Use one colour for problems the project will address
– Use another for other problems
• Modify, and add as you see fit – But don’t go into too much detail
• Present the problem tree to plenary

Example of a Problem Tree

Turning a problem tree into an objective tree

Fishers cooperatein fisheries
management
K nowledge o foptions in
enhancementtechno logiestrans ferred
Financial resourcesfo r improved
fisheriesproductivity and
managementobtained
Respons ib leharves t ings trategies
Improvedprocess ingmethods
A quacultureact ivit ies
implemented
Optimized use o ffisheries
productioncapacity
Increasedreservo ir
productivity andmanagement
Enhancedlivelihoods
PN 34 ( I m proved F isheries Production) Objectives Tree
Goal1st LEVEL2nd LEVEL
3rd LEVEL4th LEVEL
D epressedLivelihoods
LimitedReservoir
Productivity
UnderusedFisheries
ProductionC apacity
Bad HarvestingStrategies
Uncooperativeattitudes of fishers
w ith respect tomanagement of
fisheries resources
Lack of know ledgeof options ofenhancementtechnologies
Processinglimitations
Lack ofaquaculture
activities
S tart Here
D eterminants
Lack of financialresources capacity
to implementscenarios for
improved fisheriesproduction
1st LEVEL
2nd LEVEL3rd LEVEL4th LEVEL W hy is th is problem happening?
W hy?W hy?W hy?
Problem
PN 34 I m proved fisheries productivity Problem Tree

Project Problem Tree
Project Objective Tree
Outputs Vision
Project Tim eline
Network m aps
W hat needs to change
W hat thepro j ect w illproduce
W here pro j ect isgo ing- Goal
How pro j ectgoes fromoutputs to goals
Necessaryrelationshipsand how theyevolve
I m pact PathwaysModel ( = adoption
theory m odel in tegratedw ith netw ork m aps)
I m pact Narrative( = impact pathw ays model
+ text description)
Helps understandpro ject rationale
( Produced after w orkshop)
( Produced after w orkshop)
( Draft produced before w orkshop)
Workshop Road Map

Some definitions
• Activity – what we’re doing inside the project– Plan improvements to water supply
• Outputs – our activities that other people make use of – Improved availability of clean drinking water
• Outcome – the result of the use of the output by the target group– Reduced child mortality rates in families with access to
clean water

Level of influence of Project
High
CONTROL
Low
Research Output Output Outcome Impactactivity target

Scaling Out and Scaling Up
• Scaling up - an institutional expansion, from adopters and their grassroots organizations to policy makers, donors, development institutions
• Scaling out - spread of a project outputs (i.e., a new technology, a new strategy, etc.) from farmer to farmer, community to community, within the same stakeholder groups

Develop a vision of project success two years after the project ends
• Work in project groups
• Take 5 minutes to individually answer the question– You wake up 2 years after your project has ended. Your project
has been a success and is well on its way to achieving its goal. Describe what this success looks like to a journalist:
• What is happening differently now?
• Who is doing what differently?
• What have been the changes in the lives of the people using the project outputs, and who they interact with?
• How are project outputs disseminating?
• What political support is nurturing this spread? How did that happen?
• Discuss and develop a common vision
Keep it realistic

Example of a Vision

Develop a project timeline from when your
project started until 2 years after it will end
• Build a timeline of activities, outputs and outcomes that you from the beginning of the project to achieving the vision
• It is a story of adoption of project outputs (scaling-out) and the political support that helps it along (scaling-up)
• Write activities, outputs and outcomes on separate cards, using colour-coding – Activities = yellow– Outputs = blue– Outcomes = green or grey
• Write the names of the actors responsible on each card• Stick the cards on a timeline made from flip-chart paper stuck
together, or enter on your computer.

Example of a Timeline

Example of a Timeline II

Timeline example III – Companion Modeling PN25
Literature review on participatory catchment modelling
Design and implementation of models Synthesis on models
On-the-job training of local resource managers
Degree training
Lessons from past experiments at key sites
Data synthesis, institutional analysis and monitoring at study sites
Now 20102008
Participatory workshops at key sites
New methodologies for better communication and coordination mechanisms-Manuals, papers-PhD dissertations A knowledge base, based on indigenous and scientific knowledge, at each site
Setup of local institutions
Teaching modules
Less free-riders,Less conflicts
Some extentionists act more as facilitators rather than experts
Training coursesLocally organized

Project Problem Tree
Project Objective Tree
Outputs Vision
Project Tim eline
Network m aps
W hat needs to change
W hat thepro j ect w illproduce
W here pro j ect isgo ing- Goal
How pro j ectgoes fromoutputs to goals
Necessaryrelationshipsand how theyevolve
I m pact PathwaysModel ( = adoption
theory m odel in tegratedw ith netw ork m aps)
I m pact Narrative( = impact pathw ays model
+ text description)
Helps understandpro ject rationale
( Produced after w orkshop)
( Produced after w orkshop)
( Draft produced before w orkshop)
Workshop Road Map