Embed Size (px)
Citation preview

8
8
by David Campbell and Michael Parisi
Individual Income Tax Rates and Shares, 2001
David Campbell and Michael Parisi are economists withthe Individual Statistics Branch Returns Analysis Section.This article was written under the direction of JeffHartzok, Chief.
T axpayers filed 130.3 million returns for TaxYear 2001, of which almost 94.8 million (or72.8 percent) were classified as taxable
returns. Adjusted gross income (AGI) on taxablereturns fell 4.0 percent to $5,847 billion for 2001.Total income tax fell 10.4 percent for 2001, a ratemore than twice that of AGI. This decrease in totalincome tax was attributable to a decline in incomebeing reported and to tax cuts implemented in theEconomic Growth and Tax Relief Reconciliation Actof 2001 (EGTRRA). The average tax rate fortaxable returns fell 0.9 percentage points to 15.2percent. The last decline in average tax rates wasin 1991 when the economy declined, and the last timethe average tax rate fell by a similar magnitude wasfor 1987, the first year under the Tax Reform Actof 1986.
Using the 1979 Income Concept (see AppendixD for an explanation of the 1979 Income Concept),the income share for the top 1 percent of taxpayersfell from 21.6 percent from 2000 to 18.2 percent for2001, while the share of income for the bottom 50percent of taxpayers increased from 12.8 percent to13.7 percent (Table 7). The resulting 4.5-percentagepoint gap for 2001 between the income shares of thetop 1 percent and the bottom 50 percent of taxpayerscontrasted with the 28.8-percentage point gap be-tween the shares of income tax from the same twogroups. The income tax share for the top 1 percentof taxpayers was 32.9 percent for 2001, while thecorresponding share for the bottom 50 percent was4.1 percent.
This article discusses the individual income taxrates and tax shares and the computation of “taxgenerated” for 2001. To put this discussion intoperspective, the appendices to the article provideexplanations of selected terms used in the articleand describe the income tax structure, certain taxlaw changes, income and tax concepts (the “1979Income Tax Concept,” “modified” taxable income,and marginal tax rates), the computation of “alterna-tive minimum taxable income,” and the data sourcesand limitations.
Income Tax RatesDiscussions of income tax rates generally center onmeasuring two distinct tax rates: average tax ratesand marginal tax rates. Average tax rates arecalculated by dividing some measure of tax by somemeasure of income. For the statistics in this article,the average tax rate is “tax generated” (see Appen-dix A: Explanation of Selected Terms) divided byAGI reported on returns showing some income taxliability. Measures of marginal tax rates, on the otherhand, focus on determining the tax rate imposed onthe last (or next) dollar of income received by ataxpayer. For this article, the marginal tax rate is thestatutory rate at which the last dollar of taxableincome is taxed. (See Appendix D for a moredetailed explanation of marginal tax rates.) Thefollowing sections describe the measurement of theaverage and marginal tax rates in more detail, anddiscuss the statistics based on these rates for 2001.
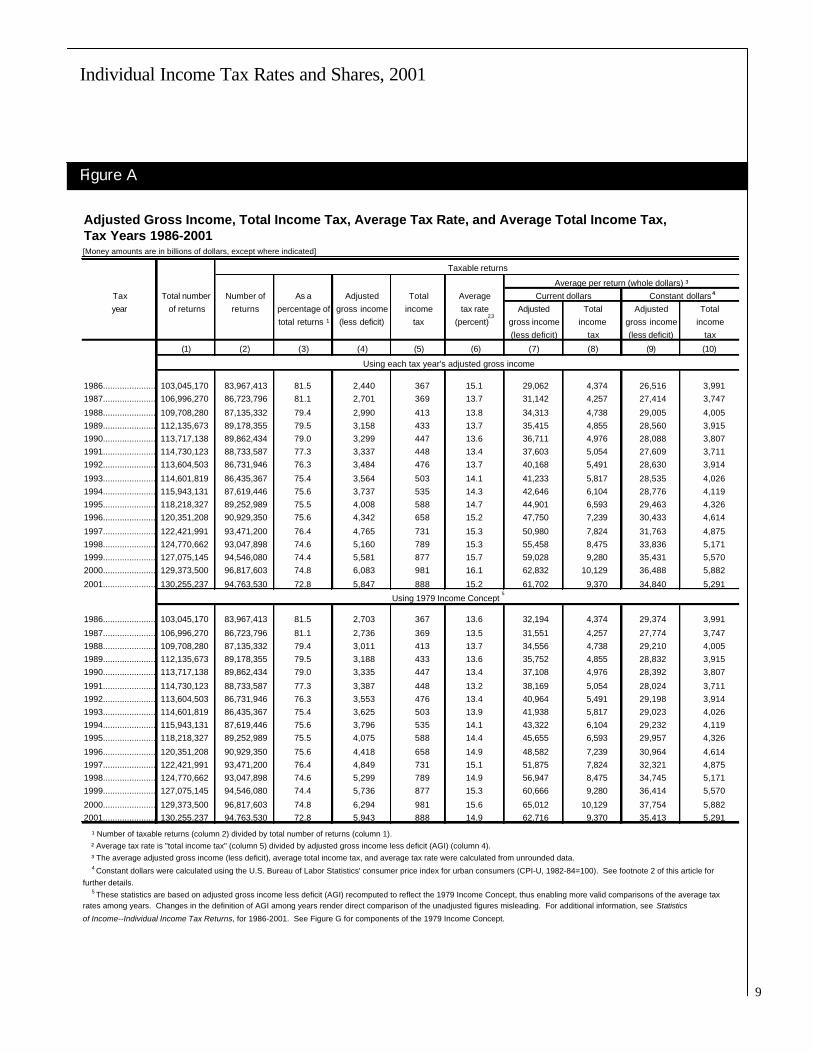
Average Tax RatesFigure A presents statistics for 1986 through 2001 onincome (based on each year’s definition of AGI andon the common 1979 Income Concept) and taxesreported. (See Appendix D for an explanation of the1979 Income Concept.) These tax years can bepartitioned into seven distinct subperiods:
(1) Tax Year 1986 was the last year under theEconomic Recovery Tax Act of 1981(ERTA81). The tax bracket boundaries,personal exemptions, and standard deductionswere indexed for inflation, and the maximum taxrate was 50 percent.
(2) Tax Year 1987 was the first year under the TaxReform Act of 1986 (TRA86). For 1987, a 1-year, transitional, five-rate tax bracket structurewas established with a partial phase-in of newprovisions that broadened the definition of AGI.The maximum tax rate was 38.5 percent.
(3) During Tax Years 1988 through 1990, there waseffectively a three-rate tax bracket structure [1].The phase-in of the provisions of TRA86 con-tinued with a maximum tax rate of 33 percent.
(4) Tax Years 1991 and 1992 brought a three-ratetax bracket structure (with a maximum tax rate
9
Individual Income Tax Rates and Shares, 2001
Figure A
Adjusted Gross Income, Total Income Tax, Average Tax Rate, and Average Total Income Tax, Tax Years 1986-2001[Money amounts are in billions of dollars, except where indicated]
Taxable returns
Average per return (whole dollars) ³Tax Total number Number of As a Adjusted Total Average Current dollars Constant dollarsyear of returns returns percentage of gross income income tax rate Adjusted Total Adjusted Total
total returns ¹ (less deficit) tax (percent) gross income income gross income income(less deficit) tax (less deficit) tax
(1) (2) (3) (4) (5) (6) (7) (8) (9) (10)
Using each tax year's adjusted gross income
1986....................................................103,045,170 83,967,413 81.5 2,440 367 15.1 29,062 4,374 26,516 3,991 1987....................................................106,996,270 86,723,796 81.1 2,701 369 13.7 31,142 4,257 27,414 3,747
1988....................................................109,708,280 87,135,332 79.4 2,990 413 13.8 34,313 4,738 29,005 4,005 1989....................................................112,135,673 89,178,355 79.5 3,158 433 13.7 35,415 4,855 28,560 3,915 1990....................................................113,717,138 89,862,434 79.0 3,299 447 13.6 36,711 4,976 28,088 3,807 1991....................................................114,730,123 88,733,587 77.3 3,337 448 13.4 37,603 5,054 27,609 3,711 1992....................................................113,604,503 86,731,946 76.3 3,484 476 13.7 40,168 5,491 28,630 3,914
1993....................................................114,601,819 86,435,367 75.4 3,564 503 14.1 41,233 5,817 28,535 4,026 1994....................................................115,943,131 87,619,446 75.6 3,737 535 14.3 42,646 6,104 28,776 4,119 1995....................................................118,218,327 89,252,989 75.5 4,008 588 14.7 44,901 6,593 29,463 4,326 1996....................................................120,351,208 90,929,350 75.6 4,342 658 15.2 47,750 7,239 30,433 4,614
1997....................................................122,421,991 93,471,200 76.4 4,765 731 15.3 50,980 7,824 31,763 4,875 1998....................................................124,770,662 93,047,898 74.6 5,160 789 15.3 55,458 8,475 33,836 5,171 1999....................................................127,075,145 94,546,080 74.4 5,581 877 15.7 59,028 9,280 35,431 5,570 2000....................................................129,373,500 96,817,603 74.8 6,083 981 16.1 62,832 10,129 36,488 5,882
2001....................................................130,255,237 94,763,530 72.8 5,847 888 15.2 61,702 9,370 34,840 5,291
Using 1979 Income Concept 5
1986....................................................103,045,170 83,967,413 81.5 2,703 367 13.6 32,194 4,374 29,374 3,991
1987....................................................106,996,270 86,723,796 81.1 2,736 369 13.5 31,551 4,257 27,774 3,747 1988....................................................109,708,280 87,135,332 79.4 3,011 413 13.7 34,556 4,738 29,210 4,005 1989....................................................112,135,673 89,178,355 79.5 3,188 433 13.6 35,752 4,855 28,832 3,915 1990....................................................113,717,138 89,862,434 79.0 3,335 447 13.4 37,108 4,976 28,392 3,807
1991....................................................114,730,123 88,733,587 77.3 3,387 448 13.2 38,169 5,054 28,024 3,711 1992....................................................113,604,503 86,731,946 76.3 3,553 476 13.4 40,964 5,491 29,198 3,914 1993....................................................114,601,819 86,435,367 75.4 3,625 503 13.9 41,938 5,817 29,023 4,026 1994....................................................115,943,131 87,619,446 75.6 3,796 535 14.1 43,322 6,104 29,232 4,119 1995....................................................118,218,327 89,252,989 75.5 4,075 588 14.4 45,655 6,593 29,957 4,326
1996....................................................120,351,208 90,929,350 75.6 4,418 658 14.9 48,582 7,239 30,964 4,614 1997....................................................122,421,991 93,471,200 76.4 4,849 731 15.1 51,875 7,824 32,321 4,875 1998....................................................124,770,662 93,047,898 74.6 5,299 789 14.9 56,947 8,475 34,745 5,171 1999....................................................127,075,145 94,546,080 74.4 5,736 877 15.3 60,666 9,280 36,414 5,570
2000....................................................129,373,500 96,817,603 74.8 6,294 981 15.6 65,012 10,129 37,754 5,882 2001....................................................130,255,237 94,763,530 72.8 5,943 888 14.9 62,716 9,370 35,413 5,291
¹ Number of taxable returns (column 2) divided by total number of returns (column 1). ² Average tax rate is "total income tax" (column 5) divided by adjusted gross income less deficit (AGI) (column 4). ³ The average adjusted gross income (less deficit), average total income tax, and average tax rate were calculated from unrounded data.
Constant dollars were calculated using the U.S. Bureau of Labor Statistics' consumer price index for urban consumers (CPI-U, 1982-84=100). See footnote 2 of this article for further details. These statistics are based on adjusted gross income less deficit (AGI) recomputed to reflect the 1979 Income Concept, thus enabling more valid comparisons of the average tax rates among years. Changes in the definition of AGI among years render direct comparison of the unadjusted figures misleading. For additional information, see Statistics
of Income--Individual Income Tax Returns, for 1986-2001. See Figure G for components of the 1979 Income Concept.
4
5
4
2,3
10
Individual Income Tax Rates and Shares, 2001
10
of 31 percent), a limitation on some itemized de-ductions, and a phaseout of personal exemptions.
(5) Tax Years 1993 through 1996 had a five-rate taxbracket structure (with a maximum statutory taxrate of 39.6 percent), a limitation on some itemizeddeductions, and a phaseout of personal exemptions.
(6) Tax Years 1997 through 2000 were subject tothe Taxpayer Relief Act of 1997 which addedthree new capital gain tax rates to the previousrate structure to form a new eight-rate tax bracketstructure (with maximum statutory tax rate of39.6 percent). See Appendix C for a moredetailed description of the capital gain rates.
(7) Tax Year 2001 was the first year affected bythe Economic Growth and Tax Relief Reconcili-ation Act of 2001 (EGTRRA). This law in-cluded a new 10-percent tax rate bracket, halfpercentage point reductions in marginal tax rateshigher than the 15-percent rate, increases in thechild tax credit, and an increase in alternativeminimum tax exemptions. See the Changes inLaw section for more details.
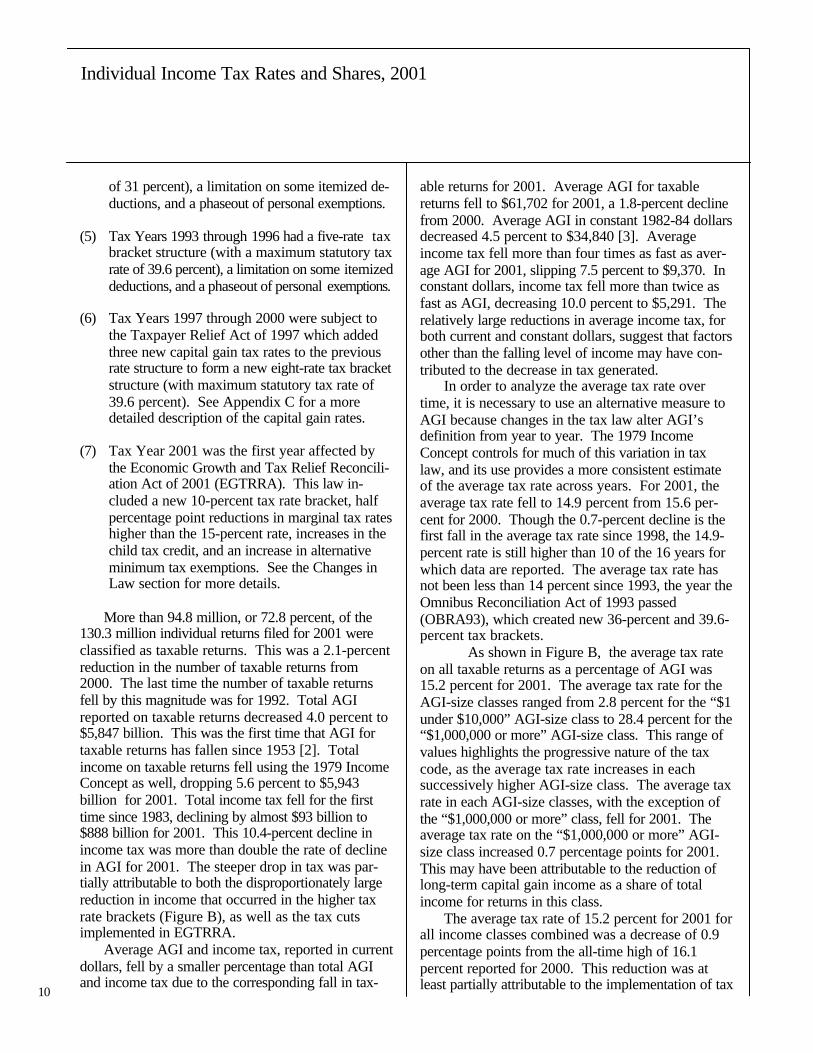
More than 94.8 million, or 72.8 percent, of the130.3 million individual returns filed for 2001 wereclassified as taxable returns. This was a 2.1-percentreduction in the number of taxable returns from2000. The last time the number of taxable returnsfell by this magnitude was for 1992. Total AGIreported on taxable returns decreased 4.0 percent to$5,847 billion. This was the first time that AGI fortaxable returns has fallen since 1953 [2]. Totalincome on taxable returns fell using the 1979 IncomeConcept as well, dropping 5.6 percent to $5,943billion for 2001. Total income tax fell for the firsttime since 1983, declining by almost $93 billion to$888 billion for 2001. This 10.4-percent decline inincome tax was more than double the rate of declinein AGI for 2001. The steeper drop in tax was par-tially attributable to both the disproportionately largereduction in income that occurred in the higher taxrate brackets (Figure B), as well as the tax cutsimplemented in EGTRRA.
Average AGI and income tax, reported in currentdollars, fell by a smaller percentage than total AGIand income tax due to the corresponding fall in tax-
able returns for 2001. Average AGI for taxablereturns fell to $61,702 for 2001, a 1.8-percent declinefrom 2000. Average AGI in constant 1982-84 dollarsdecreased 4.5 percent to $34,840 [3]. Averageincome tax fell more than four times as fast as aver-age AGI for 2001, slipping 7.5 percent to $9,370. Inconstant dollars, income tax fell more than twice asfast as AGI, decreasing 10.0 percent to $5,291. Therelatively large reductions in average income tax, forboth current and constant dollars, suggest that factorsother than the falling level of income may have con-tributed to the decrease in tax generated.
In order to analyze the average tax rate overtime, it is necessary to use an alternative measure toAGI because changes in the tax law alter AGI’sdefinition from year to year. The 1979 IncomeConcept controls for much of this variation in taxlaw, and its use provides a more consistent estimateof the average tax rate across years. For 2001, theaverage tax rate fell to 14.9 percent from 15.6 per-cent for 2000. Though the 0.7-percent decline is thefirst fall in the average tax rate since 1998, the 14.9-percent rate is still higher than 10 of the 16 years forwhich data are reported. The average tax rate hasnot been less than 14 percent since 1993, the year theOmnibus Reconciliation Act of 1993 passed(OBRA93), which created new 36-percent and 39.6-percent tax brackets.
As shown in Figure B, the average tax rateon all taxable returns as a percentage of AGI was15.2 percent for 2001. The average tax rate for theAGI-size classes ranged from 2.8 percent for the “$1under $10,000” AGI-size class to 28.4 percent for the“$1,000,000 or more” AGI-size class. This range ofvalues highlights the progressive nature of the taxcode, as the average tax rate increases in eachsuccessively higher AGI-size class. The average taxrate in each AGI-size classes, with the exception ofthe “$1,000,000 or more” class, fell for 2001. Theaverage tax rate on the “$1,000,000 or more” AGI-size class increased 0.7 percentage points for 2001.This may have been attributable to the reduction oflong-term capital gain income as a share of totalincome for returns in this class.
The average tax rate of 15.2 percent for 2001 forall income classes combined was a decrease of 0.9percentage points from the all-time high of 16.1percent reported for 2000. This reduction was atleast partially attributable to the implementation of tax
11
Individual Income Tax Rates and Shares, 2001
rate reductions under EGTRRA. Also, many of thehigher income tax returns of previous years shifted tolower income brackets for 2001 partially due to thevery large reductions in realized capital gain (lessloss). Specifically, the number of taxpayers in the topthree AGI-size classes declined by: 19.5 percent forthe “$1 million or more” AGI-class; 10.3 percent forthe “$500,000 under $1,000,000” AGI-class; and 5.5percent for the “$200,000 under $500,000” AGI-class. The last decline in average tax rates was in1991 when the economy was in a recession. The lasttime the average tax rate fell by a similar magnitudewas for 1987, the first year under TRA86.
Marginal Tax Rate ClassificationsA return’s marginal tax rate is the highest statutorytax rate bracket applicable to that tax return. Mar-ginal tax rate statistics are presented in Figure C andTable 1. These statistics are based on individualincome tax returns showing a positive taxable incomeamount based on “tax generated” and items ofincome that were subject to the regular income tax,generally those included in AGI [4]. Tables 2 and 3contain additional data based on marginal tax rates.These tables present statistics on the income and taxgenerated at each marginal tax rate by size of AGI(Table 2) and by filing status (Table 3). Appendix D
Figure B
Taxable Returns: Number of Returns, Adjusted Gross Income, and Total Income Tax, by Size of Adjusted Gross Income, Tax Years 2000 and 2001[Number of returns is in thousands--money amounts are in millions of dollars]
Size of adjusted gross income
Tax year, $1 $10,000 $20,000 $30,000 $50,000 $100,000 $200,000 $500,000 $1,000,000
items Under under under under under under under under under or
$1 ¹ $10,000 $20,000 $30,000 $50,000 $100,000 $200,000 $500,000 $1,000,000 more
(1) (2) (3) (4) (5) (6) (7) (8) (9) (10) (11)
Tax Year 2001:
Number of taxable returns...........................................................................94,764 5 6,460 13,791 14,060 23,153 26,269 8,461 2,016 355 193
Adjusted gross income
(less deficit)...........................................................................5,847,060 -1,817 42,914 209,345 351,885 908,461 1,826,558 1,113,189 577,874 240,493 578,159
Total income tax...........................................................................887,974 92 1,219 11,999 27,184 82,926 212,798 185,264 134,591 67,781 164,120
Average tax rate (percent) ²...........................................................................15.2 ( ³ ) 2.8 5.7 7.7 9.1 11.7 16.6 23.3 28.2 28.4
Tax Year 2000:
Number of taxable returns...........................................................................96,818 6 7,831 14,476 14,863 23,253 25,542 8,078 2,134 396 239
Adjusted gross income
(less deficit)...........................................................................6,083,263 -5,646 49,981 219,038 370,902 910,893 1,774,029 1,065,629 613,255 268,765 816,418
Total income tax...........................................................................980,645 124 2,231 14,408 29,533 85,969 215,549 184,035 146,454 76,022 226,320
Average tax rate (percent) ²...........................................................................16.1 ( ³ ) 4.5 6.6 8.0 9.4 12.2 17.3 23.9 28.3 27.7
Change in:
Number of taxable returns...........................................................................-2,054 ( Z ) -1,372 -685 -803 -99 728 383 -118 -41 -47
Percent...........................................................................-2.1 -7.8 -17.5 -4.7 -5.4 -0.4 2.8 4.7 -5.5 -10.3 -19.5
Adjusted gross income (less deficit)...........................................................................-236,203 3,830 -7,067 -9,693 -19,017 -2,432 52,529 47,560 -35,381 -28,272 -238,259
Percent...........................................................................-3.9 -67.8 -14.1 -4.4 -5.1 -0.3 3.0 4.5 -5.8 -10.5 -29.2
Total income tax...........................................................................-92,671 -32 -1,012 -2,409 -2,349 -3,043 -2,751 1,229 -11,864 -8,240 -62,201
Percent...........................................................................-9.5 -25.6 -45.3 -16.7 -8.0 -3.5 -1.3 0.7 -8.1 -10.8 -27.5
Average tax rate
Percentage point change...........................................................................-0.9 ( ) -1.6 -0.8 -0.2 -0.3 -0.5 -0.6 -0.6 -0.1 0.7
¹ Includes returns with adjusted gross deficit. Tax in these returns represents some combination of alternative minimum tax, Form 4972 tax on lump-sum distributions from qualified retirement plans, and Form 8814 tax on a child's interest and dividends not reflected in adjusted gross income or taxable income.
² Average tax rate is "total income tax" as a percentage of adjusted gross income less deficit (AGI). The average tax rate was calculated from unrounded data. ³ Percentage not computed. Increase not computed. Z--Less than 1,000.
NOTE: Detail may not add to totals because of rounding.
Total
4
4
12
Individual Income Tax Rates and Shares, 2001
12
explains the details of the determination of themarginal tax rate bracket into which a return isassumed to fall.
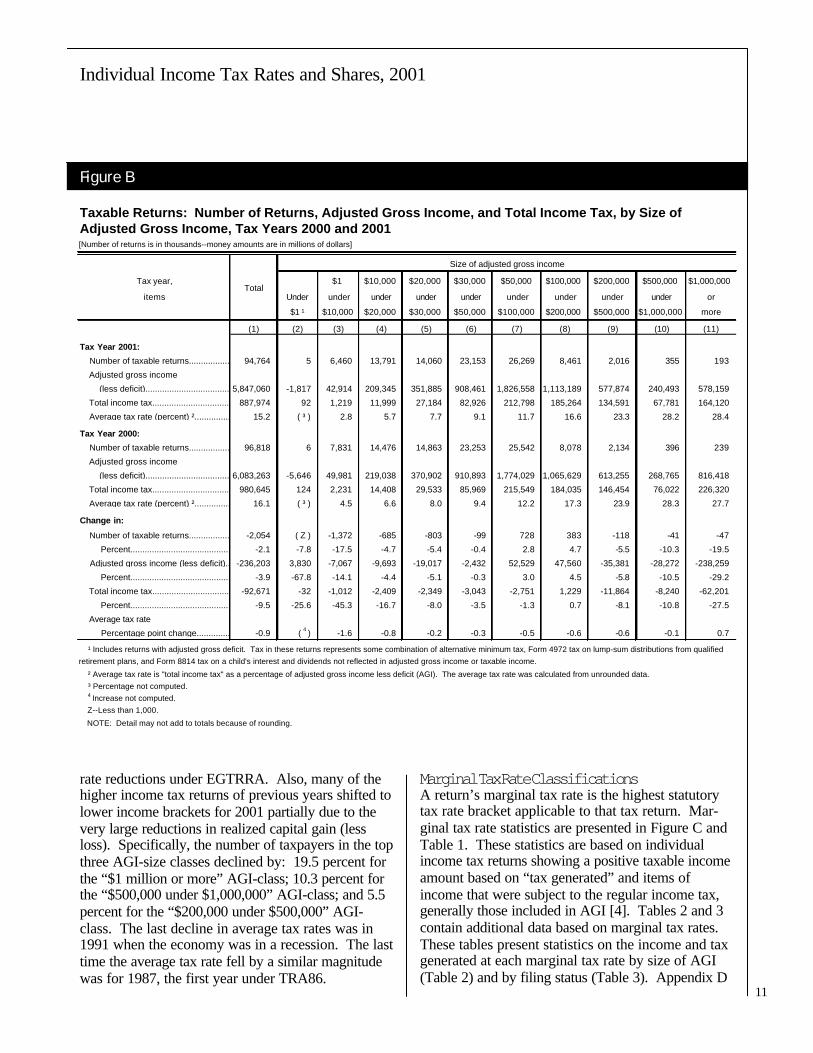
For 2001, the number of individual returns withmodified taxable income fell 1.0 percent to 104.2million. The amount of modified taxable incomereported on these returns fell 6.1 percent to $4,269.3billion [5]. As a result of both the falling level oftaxable income and the tax cuts implemented underEGTRRA, these returns generated $926.6 billion inincome taxes before credits for 2001, an 8.1-percentdrop from the previous year. Figure C presents theamounts and percentages of modified taxable incomeand income tax generated (before reduction by taxcredits, including the earned income credit) by themarginal tax rate categories (defined in Appendix D).The 2001 marginal tax rate categories for 2001 aredifferent than those for 2000 due to changes in statu-tory tax rates resulting from EGTRRA. The taxrates for the four highest income brackets were eachreduced by half a percentage point, and 8-percentand 10-percent rate brackets were created for in-
come from capital gains. A 10-percent tax bracketfor ordinary income was introduced for dependentsfor 2001 (all others for 2002, see Changes in Lawsection for more detail).
The “15 percent” marginal tax rate bracketcontained the largest share of returns for 2001, at62.6 percent. These returns reported 24.7 percent ofmodified taxable income for 2001 and 17.0 percent ofincome tax before credits. Conversely, the 0.8 per-cent of returns in the “39.1 percent” marginal ratebracket reported 17.8 percent of the modified taxableincome and 27.6 percent of the tax. The 26.1 per-cent of returns in the “27.5 percent” marginal ratebracket reported 36.4 percent of the modified taxableincome and 32.0 percent of income tax before cred-its. Returns in the “30.5 percent” rate bracket re-ported 10.5 percent of the modified taxable incomeand 11.5 percent of the income tax. Returns in the“35.5 percent” rate bracket reported showed 7.7percent of the modified taxable income and 9.6percent of the income tax. The two new marginaltax rate brackets, “8 percent” and “10 percent (capi-
Figure C
Returns with Modified Taxable Income: Tax Generated at All Rates on Returns with the Indicated Marginal Tax Rate, Tax Year 2001[Money amounts are in thousands of dollars]
Marginal tax Number of returns Modified taxable income Tax generated
rate classes Number Percent of total Amount Percent of total Amount Percent of total
(1) (2) (3) (4) (5) (6)
All rates............................................................................104,163,693 100.0 4,269,339,932 100.0 926,646,417 100.0
8 percent.........................................................................................187,240 0.2 1,410,668 ( ² ) 112,850 ( ² )
10 percent (capital gains).........................................................................................554,064 0.5 2,645,170 0.1 257,111 ( ² ) 10 percent.........................................................................................3,877,821 3.7 7,834,252 0.2 783,586 0.1 10 percent (Form 8814) ¹.........................................................................................8,324 ( ² ) 10,580 ( ² ) 1,058 ( ² ) 15 percent.........................................................................................65,207,298 62.6 1,056,357,480 24.7 157,672,420 17.0
20 percent.........................................................................................685,760 0.7 95,447,222 2.2 17,160,764 1.9 25 percent.........................................................................................47,801 ( ² ) 6,781,981 0.2 1,338,779 0.1 27.5 percent.........................................................................................27,219,888 26.1 1,554,572,661 36.4 296,370,247 32.0 28 percent (capital gains).........................................................................................49,296 ( ² ) 3,897,093 0.1 793,800 0.1
30.5 percent.........................................................................................3,824,132 3.7 450,404,363 10.5 106,868,479 11.5 35.5 percent.........................................................................................1,453,822 1.4 328,972,332 7.7 89,323,624 9.6 39.1 percent.........................................................................................846,345 0.8 759,379,672 17.8 255,544,943 27.6 Form 8615 ³.........................................................................................201,902 0.2 1,626,456 ( ² ) 418,758 ( ² )
¹ Form 8814 was filed for a dependent child under age 14 for whom the parents made an election to report the child's investment income (if it was from interest or dividends totaling between $700 and $7,500) on the parents' income tax return. This rate classification is comprised of those returns with a tax liability only from the dependents' incomes. ² Less than 0.05 percent. ³ Form 8615 was filed for a child under age 14 to report the child's investment income in excess of $1,500. The returns in this rate classification are not distributed by tax rate.
NOTE: Detail may not add to totals because of rounding.

13
Individual Income Tax Rates and Shares, 2001
tal gains and ordinary income),” combined to accountfor approximately 0.9 percent of the modified taxableincome and 0.4 percent of the tax generated for 2001.
As shown in Table 2, more tax was generatedfor 2001 at the 15-percent rate than at any other rate.The 54.4 percent of income taxed at this rate wasreported by 95.3 percent of returns with taxableincome, generating 37.6 percent of tax generated.The 27.5-percent rate generated the next largestamount of income tax liability. Tax in that bracketwas reported on 32.1 percent of returns, and 19.4percent of modified taxable income was taxed at thisrate, to generate 24.6 percent of tax generated. Only0.8 percent of returns with taxable income weretaxed at the 39.1-percent rate. However, 9.7 percentof all income was taxed at this rate, generating 17.5percent of the tax generated.
Components of Total Income Tax
Regular TaxRegular tax is generally tax determined from ataxpayer’s taxable income based on statutory taxrates less any applicable tax credits. It does notinclude the “alternative minimum tax” (AMT).Figure D illustrates the derivation of aggregate taxgenerated for 2001 returns with modified taxableincome. Table 1 includes two tax amounts: “taxgenerated” and “income tax after credits.” Tables 5through 8 and Figures A and B include an additionalmeasure of tax, “total income tax.”
As shown (Figure D and column 5 of Table 1),the tax generated by applying statutory income taxrates to modified taxable income was $926.6 billion,an 8.1-percent decrease from 2000 [6]. For mosttaxpayers, tax generated was equal to income taxbefore credits. However, for some taxpayers, in-come tax before credits included the alternativeminimum tax (AMT) and/or special taxes on lump-sum distributions from qualified retirement plans(when a 10-year averaging method was used) [7].The AMT fell 29.6 percent to $6.8 billion for 2001,partially as a result of the decline in income andpartially the result of an expansion in AMT exemp-tions implemented under EGTRRA. The earnedincome credit (EIC) is included in this computation tothe extent that its application did not reduce incometax before credits below zero. Any portion of theEIC that is refundable to the taxpayer because it
exceeds the taxpayer’s liability and any portion of theEIC used to reduce taxes other than income taxesare excluded from the computation of income taxafter credits [8]. Income tax after credits (Figure D)totaled $887.9 billion, a 9.4-percent decline from2000. Total income tax, the sum of income tax aftercredits and tax on trusts accumulation distributions,totaled $888.0 billion for 2001. This represented a9.4-percent fall in total income tax, which was alarger percentage decline than for tax generated dueto the 29.2-percent fall in AMT, as well as the 21.0-percent increase in tax credits.
Table 4 provides estimates by the type of taxcomputation for returns with modified taxable in-come. For 2001, the number of children under age14 who filed Form 8615 for reporting investment
Figure D
Derivation of 2001 Total Income Tax as Shownin Statistics of Income[Money amounts are in billions of dollars]
Tax generated from tax rate schedules or tax table.......................................................................................................926.6
PLUS: Tax on lump-sum distributions from qualified retirement plans.......................................................................................................0.2 Alternative minimum tax.......................................................................................................6.8
EQUALS:
Income tax before credits.......................................................................................................933.6
LESS: Tax credits, total ¹.......................................................................................................45.6
Child-care credit.......................................................................................................2.7
Child tax credit ¹.......................................................................................................22.4
Education credit.......................................................................................................5.2 Foreign tax credit.......................................................................................................6.3 General business credit.......................................................................................................0.7
Earned income credit (limited to the amount needed to reduce total income tax to zero).......................................................................................................1.5 Credit for prior-year minimum tax.......................................................................................................1.4
Rate reduction credit.......................................................................................................5.1 Other credits ².......................................................................................................0.4
EQUALS:
Income tax after credits.......................................................................................................887.9
PLUS: Trusts accumulation distribution.......................................................................................................0.04
EQUALS:
Total income tax.......................................................................................................888.0
¹ Does not include the additional child tax credit that for 2001 was $4,994.7 million,
which were refunded to taxpayers and not included in total income tax. ² Includes the elderly or disabled credit, empowerment zone employment credit, mortgage interest credit, adoption credit, nonconventional source fuel credit, and other credits.
NOTE: Detail may not add to totals because of rounding.

14
Individual Income Tax Rates and Shares, 2001
14
income over $1,500 decreased 63.0 percent to201,902. Using Form 8615 to compute their tax (as iftheir incomes were treated as the marginal incomesof their parents or guardians), these children gener-ated almost $418.8 million (column 7) of tax revenuewhich is $98.6 million (column 8) more than the$320.2 million (column 6) of tax that would havebeen generated using ordinary tax computation.
For 2001, the 10.2 million returns which includedthe Schedule D capital gain tax computation gener-ated $245.4 billion in tax (column 7). If long-termcapital gains had been taxed the same as ordinaryincome, the amount of income tax before credits(regular tax computation) for these same taxpayerswould have been $281.5 billion (column 6). Thus, useof the Schedule D tax computation resulted in $36.1billion (column 8) less tax for 2001, a fall by more thanhalf from the $72.6-billion reduction for 2000 (column4) when 17.1 million taxpayers received some benefitfrom lower capital gain taxes (column 1). The aver-age tax savings fell from $4,248 per return for 2000to $3,537 for 2001. This reduction was attributableboth to the reduction in capital gains realized and tothe tax cuts implemented in EGTRRA which reducedthe level of taxation that would have applied in theabsence of the special capital gain tax rates.
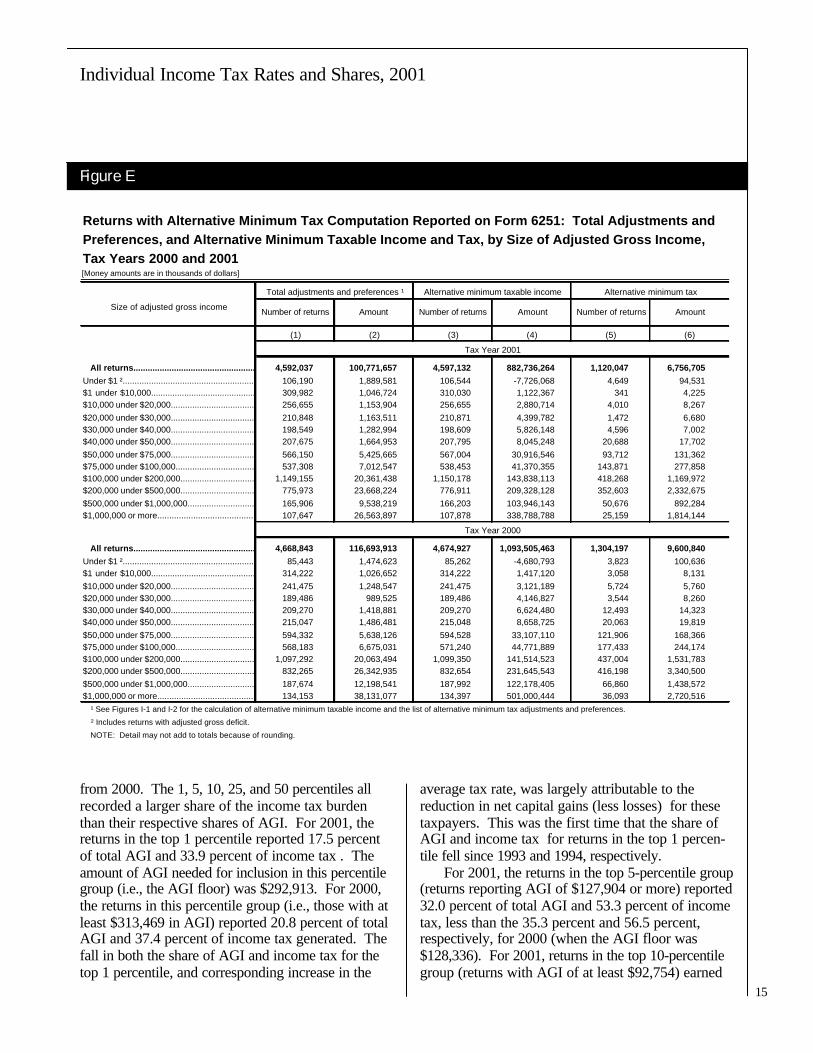
Alternative Minimum TaxThe Revenue Act of 1978 established the alternativeminimum tax to ensure that a minimum amount ofincome tax was paid by taxpayers who might other-wise be able to legally reduce, or totally eliminate,their tax burden. The AMT provisions may recap-ture some of the tax reductions under the ordinaryincome tax. Form 6251, Alternative Minimum Tax--Individuals, is used to calculate AMT. (SeeAppendix E for an explanation of the computation ofincome for AMT purposes.)
Figure E presents statistics, by size of AGI, onthe AMT reported by taxpayers filing Form 6251with their returns. For 2001, AMT liability fell 29.6percent from its 2000 high to $6.8 billion. The fall inAMT coincided with a 19.3-percent decrease inAlternative Minimum Taxable Income (AMTI) for2001. The AMT fell more than AMTI because ofincreases in the AMT exemption amounts for 2001.
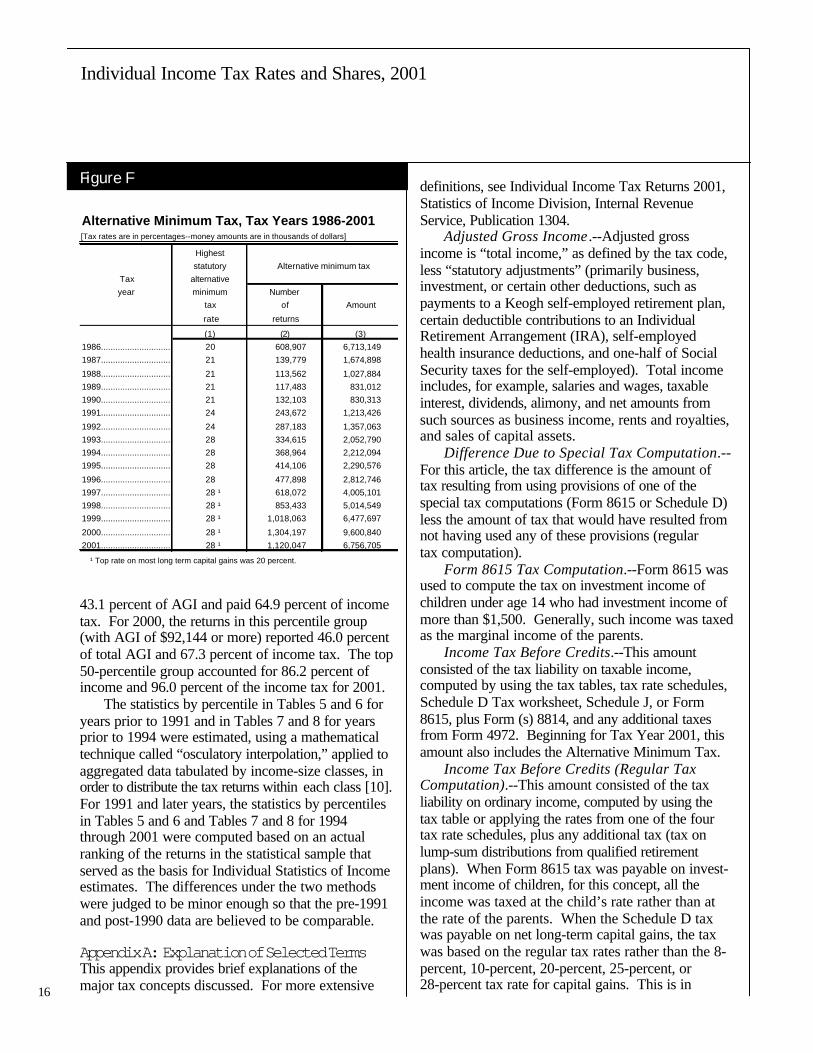
Figure F shows the number of taxpayers withAMT liability and the amount of that liability for eachof the years 1986 through 2001. Much of the varia-
tion in the number of taxpayers affected by the AMTand in the amount of AMT liability during the mid-to-late 1980’s and early 1990’s was attributable to taxlaw changes such as TRA86, RRA90 (RevenueReconciliation Act of 1990), and OBRA93, which werethe source of regular and AMT tax rate changes.Since then, the impact of the AMT has increasedpartially because the AMT exemptions have not beenindexed annually for the effects of inflation, whereasvarious parameters of the ordinary income tax (suchas tax brackets, exemptions, etc.) have been indexedannually for inflation. In June 2001, the impact of theAMT declined as AMT exemption amounts wereincreased statutorily by EGTRRA.
Income and Tax SharesHistorical statistics on income and tax by cumulativepercentiles (based on numbers of returns) arepresented in Tables 5 through 8. Distributions ofAGI, as defined for each year and tax or incomeitem, by descending and ascending cumulativepercentiles of returns, are presented in Tables 5 and6. These tables can be used to make comparisonsacross cumulative percentile classes within eachyear, among years within the ERTA81 period (i.e.,Tax Years 1982 through 1986), and among yearswithin the post-TRA86 period (i.e., Tax Years 1987through 2001). Since TRA86 redefined AGI, Tables5 and 6 are not as useful for comparisons betweenpre- and post-TRA86 years. Thus, Tables 7 and 8,which are based on a consistent definition of income(i.e., the 1979 Income Concept), are included tofacilitate such comparisons.
Tables 5 and 7, are based on percentiles of returnscumulated downward from the highest income re-turns. The data in Tables 5 and 7 are shown for thetop 1, 5, 10, 25, and 50 percent of returns. Tables 6and 8 are based on returns cumulated upward for thelowest income returns. Data are shown for thebottom 50, 75, 90, 95, and 99 percent of all returns.
Consider, for example, the data in Table 5 for the128.8 million returns filed for 2001 with positive AGI[9]. The average tax rate for these returns was 14.2percent, a 1.0-percentage point decrease from 2000.This was only the second time in the last 10 yearsthat the average tax rate has fallen, the other being in1998. The average tax rate on the top 1 percentileincreased slightly for 2001, while the average taxrate on the 5, 10, 25 and 50 percentiles decreased
15
Individual Income Tax Rates and Shares, 2001
from 2000. The 1, 5, 10, 25, and 50 percentiles allrecorded a larger share of the income tax burdenthan their respective shares of AGI. For 2001, thereturns in the top 1 percentile reported 17.5 percentof total AGI and 33.9 percent of income tax . Theamount of AGI needed for inclusion in this percentilegroup (i.e., the AGI floor) was $292,913. For 2000,the returns in this percentile group (i.e., those with atleast $313,469 in AGI) reported 20.8 percent of totalAGI and 37.4 percent of income tax generated. Thefall in both the share of AGI and income tax for thetop 1 percentile, and corresponding increase in the
average tax rate, was largely attributable to thereduction in net capital gains (less losses) for thesetaxpayers. This was the first time that the share ofAGI and income tax for returns in the top 1 percen-tile fell since 1993 and 1994, respectively.
For 2001, the returns in the top 5-percentile group(returns reporting AGI of $127,904 or more) reported32.0 percent of total AGI and 53.3 percent of incometax, less than the 35.3 percent and 56.5 percent,respectively, for 2000 (when the AGI floor was$128,336). For 2001, returns in the top 10-percentilegroup (returns with AGI of at least $92,754) earned
Figure E
Returns with Alternative Minimum Tax Computation Reported on Form 6251: Total Adjustments andPreferences, and Alternative Minimum Taxable Income and Tax, by Size of Adjusted Gross Income,Tax Years 2000 and 2001[Money amounts are in thousands of dollars]
Total adjustments and preferences ¹ Alternative minimum taxable income Alternative minimum tax
Size of adjusted gross income Number of returns Amount Number of returns Amount Number of returns Amount
(1) (2) (3) (4) (5) (6)
Tax Year 2001
All returns.............................................................................4,592,037 100,771,657 4,597,132 882,736,264 1,120,047 6,756,705 Under $1 ².............................................................................106,190 1,889,581 106,544 -7,726,068 4,649 94,531 $1 under $10,000.............................................................................309,982 1,046,724 310,030 1,122,367 341 4,225 $10,000 under $20,000.............................................................................256,655 1,153,904 256,655 2,880,714 4,010 8,267 $20,000 under $30,000.............................................................................210,848 1,163,511 210,871 4,399,782 1,472 6,680 $30,000 under $40,000.............................................................................198,549 1,282,994 198,609 5,826,148 4,596 7,002 $40,000 under $50,000.............................................................................207,675 1,664,953 207,795 8,045,248 20,688 17,702 $50,000 under $75,000.............................................................................566,150 5,425,665 567,004 30,916,546 93,712 131,362 $75,000 under $100,000.............................................................................537,308 7,012,547 538,453 41,370,355 143,871 277,858 $100,000 under $200,000.............................................................................1,149,155 20,361,438 1,150,178 143,838,113 418,268 1,169,972 $200,000 under $500,000.............................................................................775,973 23,668,224 776,911 209,328,128 352,603 2,332,675 $500,000 under $1,000,000.............................................................................165,906 9,538,219 166,203 103,946,143 50,676 892,284 $1,000,000 or more.............................................................................107,647 26,563,897 107,878 338,788,788 25,159 1,814,144
Tax Year 2000
All returns.............................................................................4,668,843 116,693,913 4,674,927 1,093,505,463 1,304,197 9,600,840 Under $1 ².............................................................................85,443 1,474,623 85,262 -4,680,793 3,823 100,636 $1 under $10,000.............................................................................314,222 1,026,652 314,222 1,417,120 3,058 8,131 $10,000 under $20,000.............................................................................241,475 1,248,547 241,475 3,121,189 5,724 5,760 $20,000 under $30,000.............................................................................189,486 989,525 189,486 4,146,827 3,544 8,260 $30,000 under $40,000.............................................................................209,270 1,418,881 209,270 6,624,480 12,493 14,323 $40,000 under $50,000.............................................................................215,047 1,486,481 215,048 8,658,725 20,063 19,819 $50,000 under $75,000.............................................................................594,332 5,638,126 594,528 33,107,110 121,906 168,366 $75,000 under $100,000.............................................................................568,183 6,675,031 571,240 44,771,889 177,433 244,174 $100,000 under $200,000.............................................................................1,097,292 20,063,494 1,099,350 141,514,523 437,004 1,531,783 $200,000 under $500,000.............................................................................832,265 26,342,935 832,654 231,645,543 416,198 3,340,500 $500,000 under $1,000,000.............................................................................187,674 12,198,541 187,992 122,178,405 66,860 1,438,572 $1,000,000 or more.............................................................................134,153 38,131,077 134,397 501,000,444 36,093 2,720,516 ¹ See Figures I-1 and I-2 for the calculation of alternative minimum taxable income and the list of alternative minimum tax adjustments and preferences.
² Includes returns with adjusted gross deficit.
NOTE: Detail may not add to totals because of rounding.
16
Individual Income Tax Rates and Shares, 2001
16
43.1 percent of AGI and paid 64.9 percent of incometax. For 2000, the returns in this percentile group(with AGI of $92,144 or more) reported 46.0 percentof total AGI and 67.3 percent of income tax. The top50-percentile group accounted for 86.2 percent ofincome and 96.0 percent of the income tax for 2001.
The statistics by percentile in Tables 5 and 6 foryears prior to 1991 and in Tables 7 and 8 for yearsprior to 1994 were estimated, using a mathematicaltechnique called “osculatory interpolation,” applied toaggregated data tabulated by income-size classes, inorder to distribute the tax returns within each class [10].For 1991 and later years, the statistics by percentilesin Tables 5 and 6 and Tables 7 and 8 for 1994through 2001 were computed based on an actualranking of the returns in the statistical sample thatserved as the basis for Individual Statistics of Incomeestimates. The differences under the two methodswere judged to be minor enough so that the pre-1991and post-1990 data are believed to be comparable.
Appendix A: Explanation of Selected TermsThis appendix provides brief explanations of themajor tax concepts discussed. For more extensive
definitions, see Individual Income Tax Returns 2001,Statistics of Income Division, Internal RevenueService, Publication 1304.
Adjusted Gross Income .--Adjusted grossincome is “total income,” as defined by the tax code,less “statutory adjustments” (primarily business,investment, or certain other deductions, such aspayments to a Keogh self-employed retirement plan,certain deductible contributions to an IndividualRetirement Arrangement (IRA), self-employedhealth insurance deductions, and one-half of SocialSecurity taxes for the self-employed). Total incomeincludes, for example, salaries and wages, taxableinterest, dividends, alimony, and net amounts fromsuch sources as business income, rents and royalties,and sales of capital assets.
Difference Due to Special Tax Computation.--For this article, the tax difference is the amount oftax resulting from using provisions of one of thespecial tax computations (Form 8615 or Schedule D)less the amount of tax that would have resulted fromnot having used any of these provisions (regulartax computation).
Form 8615 Tax Computation.--Form 8615 wasused to compute the tax on investment income ofchildren under age 14 who had investment income ofmore than $1,500. Generally, such income was taxedas the marginal income of the parents.
Income Tax Before Credits.--This amountconsisted of the tax liability on taxable income,computed by using the tax tables, tax rate schedules,Schedule D Tax worksheet, Schedule J, or Form8615, plus Form (s) 8814, and any additional taxesfrom Form 4972. Beginning for Tax Year 2001, thisamount also includes the Alternative Minimum Tax.
Income Tax Before Credits (Regular TaxComputation).--This amount consisted of the taxliability on ordinary income, computed by using thetax table or applying the rates from one of the fourtax rate schedules, plus any additional tax (tax onlump-sum distributions from qualified retirementplans). When Form 8615 tax was payable on invest-ment income of children, for this concept, all theincome was taxed at the child’s rate rather than atthe rate of the parents. When the Schedule D taxwas payable on net long-term capital gains, the taxwas based on the regular tax rates rather than the 8-percent, 10-percent, 20-percent, 25-percent, or28-percent tax rate for capital gains. This is in
Figure F
Alternative Minimum Tax, Tax Years 1986-2001[Tax rates are in percentages--money amounts are in thousands of dollars]
Higheststatutory Alternative minimum tax
Tax alternativeyear minimum Number
tax of Amount
rate returns
(1) (2) (3)1986...................................................................20 608,907 6,713,149 1987...................................................................21 139,779 1,674,898
1988...................................................................21 113,562 1,027,884 1989...................................................................21 117,483 831,012 1990...................................................................21 132,103 830,313 1991...................................................................24 243,672 1,213,426
1992...................................................................24 287,183 1,357,063 1993...................................................................28 334,615 2,052,790 1994...................................................................28 368,964 2,212,094 1995...................................................................28 414,106 2,290,576
1996...................................................................28 477,898 2,812,746 1997................................................................... 28 ¹ 618,072 4,005,101 1998................................................................... 28 ¹ 853,433 5,014,549 1999................................................................... 28 ¹ 1,018,063 6,477,697
2000................................................................... 28 ¹ 1,304,197 9,600,840 2001................................................................... 28 ¹ 1,120,047 6,756,705
¹ Top rate on most long term capital gains was 20 percent.

17
Individual Income Tax Rates and Shares, 2001
contrast to the computation of Income Tax BeforeCredits (see above) in which special tax computa-tions such as those involved on the Form 8615 andSchedule D are taken into account (see Table 4).
Marginal Tax Rate .--See Appendix D.Modified Taxable Income .--See Appendix D.Regular Tax Computation.--Depending on
marital status and size of taxable income, the tax-payer used one of the four tax rate schedules (or anapproximation from the tax table) to determine tax.Returns of taxpayers who had taxes computed by theInternal Revenue Service were classified under theregular tax computation method.
Schedule D Tax Computation.--Schedule Dwas used to compute the 8-percent, 10-percent, 20-percent, 25-percent, and 28-percent taxes on netlong-term capital gains (in excess of net short-termcapital losses), if such computations were beneficialto the taxpayer. Any investment interest allocated tolong-term capital gains (on Form 4952) was excludedfrom this computation.
Taxable Income.--Taxable income is AGI lessthe sum of personal exemptions amounts and eitherthe standard deduction for nonitemizers or totalitemized deductions. The amounts for personalexemptions and total itemized deductions are net ofany reductions because of taxpayers’ income ex-ceeding certain income thresholds.
Taxable Returns.--A return is classified as“taxable” based on the presence of “tax generated.”The following additional taxes were not taken intoaccount for this purpose: self-employment, householdemployment, Social Security, Railroad RetirementTax Act (RRTA) taxes, tax from recomputing prior-year investment or low-income housing credits,penalty taxes on Individual Retirement Arrange-ments, section 72 penalty taxes, advance earnedincome credit payments, or “golden parachute”payments (made to key employees as compensationunder certain circumstances).
Tax Generated.--This is the amount of taxcomputed on modified taxable income either from thetax rate schedules or the tax table. Tax generateddoes not take into account the alternative minimumtax or the effect of tax credits. For most returns(those without the special tax on lump-sum distribu-tions from qualified retirement plans or alternativeminimum tax), tax generated equals “income taxbefore credits.”
Total Income Tax.--This is the sum of incometax after credits and tax on accumulated trustsdistribution from Form 4970, less the portion of theEIC used to offset other taxes as well as the refund-able portion of the EIC.
Appendix B: Income Tax StructureTaxpayers must file an income tax return if theymeet certain minimum filing requirements. The filingrequirements for 2001 were generally based on theamount of “gross income,” filing status, age, and, to alesser extent, dependency and blindness [11]. Gener-ally, the minimum level of income for which a returnwas required to be filed equaled the sum of thestandard deduction for the particular filing status andthe amount of the personal exemption deductionallowed for the taxpayer or taxpayers (but not forany dependents). In addition to the general filingrequirements, individuals were required to file areturn for Tax Year 2001 if they had net earningsfrom self-employment of at least $400; liability forSocial Security or Medicare tax on unreported tipincome; Social Security, Medicare, or RailroadRetirement tax on reported tip income or group-termlife insurance; “alternative minimum tax”; tax onqualified retirement plan distributions, including anIndividual Retirement Arrangement (IRA) or aMedical Savings Account (MSA); tax on the recap-ture of investment credit or low-income housingcredit; recapture tax on the disposition of a homepurchased with a Federally-subsidized mortgage; anyadvance earned income credit payments; or wages of$108.28 or more from a church or qualified church-controlled organization that was exempt from SocialSecurity taxes.
Gross income includes all income received asmoney, goods, property, or services that was notexpressly exempt from tax [12]. Adjusted grossincome (AGI) is equal to gross income less deduc-tions for certain expenses [13]. “Taxable income,”the base on which income tax before credits iscomputed, equals AGI less the amount for personalexemptions and less either total allowable itemizeddeductions for taxpayers who itemize deductions, orthe standard deduction (including the additionalamounts for age and blindness) for all other taxpayers.
Income tax before credits is calculated fromtaxable income using: tax table or tax rate schedules,both of which vary with taxpayer filing status (single,
18
Individual Income Tax Rates and Shares, 2001
18
married filing jointly, surviving spouse, married filingseparately, and head of household); Form 8615 orForm 8814 for children’s investment income; Sched-ule D worksheet for net long-term capital gains; orsome combination of the above [14]. For 2001, thetax rates for each filing status were 8 percent, 10percent, 15 percent, 20 percent, 25 percent, 26 per-cent, 27.5 percent, 28 percent, 30.5 percent, 35.5percent, and 39.1 percent [15]. The tax rates of 8percent, 20 percent, 25 percent, and 28 percent wereonly for net long-term capital gains (in excess of netshort-term capital losses). Income tax before creditsincludes any alternative minimum tax. (See Appen-dix C for further details on these rates.)
To calculate their Federal income tax liability for2001, taxpayers used either the tax table or the taxrate schedules. Taxpayers with taxable income lessthan $100,000 were required to use the tax table,while those with taxable income of $100,000 or morewere required to use the tax rate schedules. The taxtable was based on income tax “brackets” up to $50wide [16]. The tax within each bracket was basedon the tax calculated at the midpoint of the bracketand then rounded to the nearest whole dollar. As aresult, the tax table and the tax rate schedules couldproduce different amounts of tax for the sameamount of taxable income. Use of the tax table couldhave produced either a slightly higher or loweramount of tax than that produced by the tax rateschedules. For taxpayers using the tax table withtaxable income that was subject to the 35.5-percentmarginal rate, the maximum difference in tax be-tween the tax rate schedules and the tax table was$9.25 [17]. However, for most taxpayers the actualdifference in tax was smaller.
Appendix C: Changes in Law for 2001Alternative Minimum Tax.--For Tax Year 2001,
The Economic Growth and Tax Relief ReconciliationAct of 2001 (EGTRRA) increased the AMT exemp-tion amounts as follows:
Filing Status 2000 2001Married filing jointly and surviving spouses $45,000 $49,000Married filing separately $22,500 $24,500Single $33,750 $35,750
Capital Gain Tax Rate.--The rate at which netcapital gain (less loss) that was held for at least 5years was lowered to 8 percent for 2001 for thoseindividuals who would otherwise have paid a 10-percent tax rate on these gains.
Child Tax Credit.--The amount of the child taxcredit was increased from $500 to $600 for 2001.The refundable portion of the child tax credit wasalso extended to families with fewer than threechildren. It was refundable up to 10 percent of theamount by which a taxpayer’s earned income ex-ceeded $10,000. Families with more than threechildren could choose the greater of this value, or theamount by which the taxpayer’s Social Security taxesexceeded his or her earned income credit.
Earned Income Credit.--The maximum amountof the earned income credit (EIC) increased, as didthe amounts of earned income and investment in-come an individual could have and still claim thecredit. The maximum amount of investment income(interest, dividends and capital gain income) a tax-payer could have and still claim the credit increasedto $2,450 from $2,400. The maximum credit fortaxpayers with no qualifying children increased to$364. For these taxpayers, earned income and modi-fied AGI had to be less than $10,710 (up from$10,380 for 2000). For taxpayers with one qualifyingchild, the maximum credit increased to $2,428, and,for taxpayers with two or more qualifying children,the maximum credit increased to $4,008. To beeligible for the credit, a taxpayers’ earned incomeand modified AGI had to be less than $28,281 for onequalifying child, or less than $32,121 for two or morequalifying children.
Foreign Earned Income Exclusion.--For TaxYear 2001, the amount of foreign earned income thatcould have been excluded from income per taxpayerincreased from $76,000 to $78,000.
Indexing.--The following items increased due toindexing for inflation: personal exemption amounts;the basic standard deduction amounts; and the taxbracket boundaries, the beginning income amountsfor limiting certain itemized deductions and for phas-ing out personal exemptions. The maximum amountof earnings subject to self-employment tax increasedbased on the percentage change in average coveredearnings.

19
Individual Income Tax Rates and Shares, 2001
Individual Income Tax Rate Reductions.--Fortax years beginning after December 31, 2000, a new10-percent regular income tax rate schedule will beused for the first portion of taxable income that hadbeen taxed at a 15-percent rate. However, for TaxYear 2001, the 10 percent applies to the first $6,000only for dependent individuals. Other taxpayersreceived benefits equivalent to the 10-percent ratebracket via an advanced payment based on their TaxYear 2000 returns or the rate reduction credit (seebelow). Also for 2001, there was a reduction of themarginal tax rates that are higher than the 15-percentbracket according to the following table:
2000 2001— 10%
15% 15%28% 27.5%31% 30.5%36% 35.5%
39.6% 39.1%
Rate Reduction Credit.--Individual taxpayerswere eligible for a rate reduction credit equal to 5percent of the first $6,000 of taxable income forsingle or married filing separately taxpayers, $10,000for head of household taxpayers, and $12,000 formarried taxpayers filing jointly or qualified widowers.The rate reduction credit was, however, reduced bythe amount of the advance rate reduction creditissued in the form of a check in the summer of 2001,which was based on information on the taxpayer’s2000 tax return.
Student Loan Interest Deduction.--For TaxYear 2001, eligible taxpayers were allowed to deductup to $2,500 of interest paid on qualified higher edu-cational loans, up from $2,000 for 2000. These loansmust have been used for qualified educational ex-penses of either the taxpayer, taxpayer’s spouse, orany dependent of the taxpayer at the time the debtwas incurred. The taxpayer’s modified AGI musthave been less than: $55,000 if single, head of house-hold, or qualifying widow(er); or $75,000 if marriedfiling jointly.
Appendix D: Income and Tax ConceptsAs discussed in Appendix B, gross income is allincome received that is not specifically excluded.Total income is the net amount of gross income after
certain expenses (i.e., business or rent and royaltyexpenses) have been deducted. Adjusted grossincome (AGI) is total income less statutory adjust-ments to income (i.e., deductible contributions to anIRA or Keogh plan).
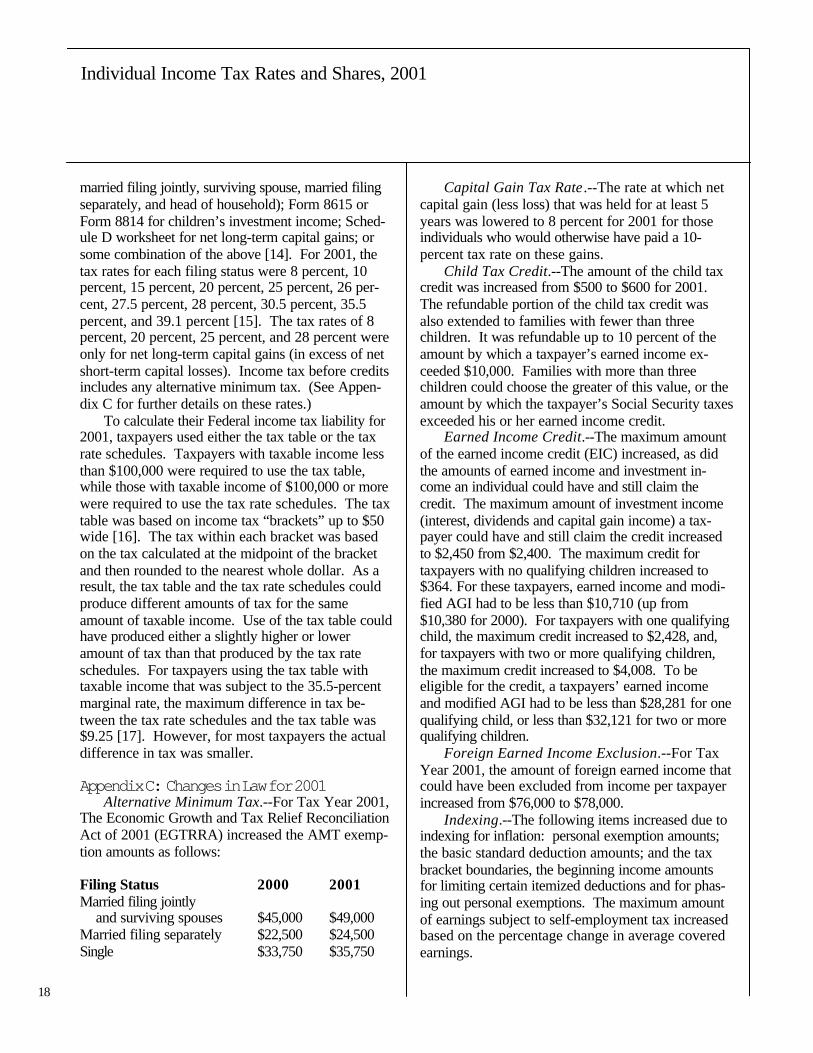
1979 Income ConceptTo analyze changes in income and taxes over aperiod of years, a consistent definition of incomeshould be used. Because the components of AGImay vary from year to year as the law changes, the“1979 Income Concept” was developed to provide amore uniform measure of income across tax years.By including the same income and deduction items ineach year’s income calculation and using only itemsavailable on Federal individual income tax returns, thedefinition of the 1979 Income Concept is consistentthroughout the base years and can be used for futureyears to compare income by including only incomecomponents common to all years. Tax Years 1979through 1986 were used as base years in identifyingthe income and deduction items included in thisconcept. The 1979 Income Concept applied to 2001includes many income and deduction items that arealso components of AGI (Figure G). However,unlike AGI, the 1979 Income Concept also includessome nontaxable (i.e., tax-exempt) amounts ofincome reported on individual income tax returns anddisallowed passive loss deductions. In addition, onlystraight-line deductions for depreciation are includedin the 1979 Income Concept [18].
Modified Taxable IncomeThis concept is relevant only for “prior-year returns.”For current-year returns, modified taxable income isidentical to taxable income.
This is the term used for the statistics to describe“income subject to tax,” the actual base on which taxis computed. Each year, a small number of returnsfor prior tax years are filed during the same calendaryear in which the tax returns for the current tax yearare being selected for the Statistics of Incomesample. Some of these returns are selected for thesample and act as proxies for returns for the currenttax year that will be filed during a later calendar year.The tax on these returns is based on a previousyear’s tax law (which may reflect different tax ratesand income concepts). For the statistics in thisarticle, the taxable income reported on these prior-
20
Individual Income Tax Rates and Shares, 2001
20
year returns is modified to equal an amount neces-sary to generate the tax actually shown on thesereturns using current-year rates.
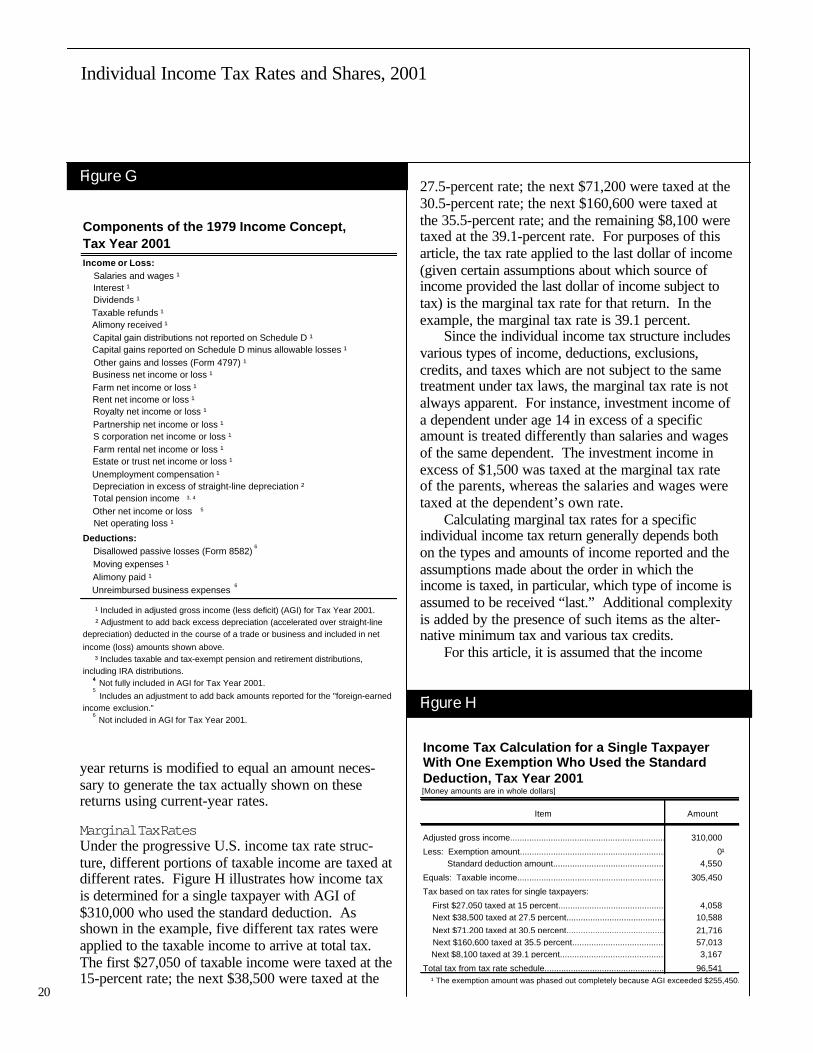
Marginal Tax RatesUnder the progressive U.S. income tax rate struc-ture, different portions of taxable income are taxed atdifferent rates. Figure H illustrates how income taxis determined for a single taxpayer with AGI of$310,000 who used the standard deduction. Asshown in the example, five different tax rates wereapplied to the taxable income to arrive at total tax.The first $27,050 of taxable income were taxed at the15-percent rate; the next $38,500 were taxed at the
27.5-percent rate; the next $71,200 were taxed at the30.5-percent rate; the next $160,600 were taxed atthe 35.5-percent rate; and the remaining $8,100 weretaxed at the 39.1-percent rate. For purposes of thisarticle, the tax rate applied to the last dollar of income(given certain assumptions about which source ofincome provided the last dollar of income subject totax) is the marginal tax rate for that return. In theexample, the marginal tax rate is 39.1 percent.
Since the individual income tax structure includesvarious types of income, deductions, exclusions,credits, and taxes which are not subject to the sametreatment under tax laws, the marginal tax rate is notalways apparent. For instance, investment income ofa dependent under age 14 in excess of a specificamount is treated differently than salaries and wagesof the same dependent. The investment income inexcess of $1,500 was taxed at the marginal tax rateof the parents, whereas the salaries and wages weretaxed at the dependent’s own rate.
Calculating marginal tax rates for a specificindividual income tax return generally depends bothon the types and amounts of income reported and theassumptions made about the order in which theincome is taxed, in particular, which type of income isassumed to be received “last.” Additional complexityis added by the presence of such items as the alter-native minimum tax and various tax credits.
For this article, it is assumed that the income
Components of the 1979 Income Concept,Tax Year 2001Income or Loss: Salaries and wages ¹ Interest ¹ Dividends ¹ Taxable refunds ¹ Alimony received ¹ Capital gain distributions not reported on Schedule D ¹ Capital gains reported on Schedule D minus allowable losses ¹ Other gains and losses (Form 4797) ¹ Business net income or loss ¹ Farm net income or loss ¹ Rent net income or loss ¹ Royalty net income or loss ¹ Partnership net income or loss ¹ S corporation net income or loss ¹ Farm rental net income or loss ¹ Estate or trust net income or loss ¹ Unemployment compensation ¹ Depreciation in excess of straight-line depreciation ² Total pension income Other net income or loss Net operating loss ¹
Deductions: Disallowed passive losses (Form 8582) Moving expenses ¹ Alimony paid ¹ Unreimbursed business expenses
¹ Included in adjusted gross income (less deficit) (AGI) for Tax Year 2001. ² Adjustment to add back excess depreciation (accelerated over straight-line depreciation) deducted in the course of a trade or business and included in net income (loss) amounts shown above. ³ Includes taxable and tax-exempt pension and retirement distributions, including IRA distributions. Not fully included in AGI for Tax Year 2001. Includes an adjustment to add back amounts reported for the "foreign-earned income exclusion." Not included in AGI for Tax Year 2001.
44
5
6
6
5
3, 4
6
Income Tax Calculation for a Single Taxpayer With One Exemption Who Used the Standard Deduction, Tax Year 2001[Money amounts are in whole dollars]
Item Amount
Adjusted gross income.......................................................................................................................310,000
Less: Exemption amount.......................................................................................................................0¹ Standard deduction amount.......................................................................................................................4,550
Equals: Taxable income.......................................................................................................................305,450
Tax based on tax rates for single taxpayers:
First $27,050 taxed at 15 percent.......................................................................................................................4,058 Next $38,500 taxed at 27.5 percent.......................................................................................................................10,588 Next $71,200 taxed at 30.5 percent.......................................................................................................................21,716 Next $160,600 taxed at 35.5 percent.......................................................................................................................57,013 Next $8,100 taxed at 39.1 percent.......................................................................................................................3,167
Total tax from tax rate schedule.......................................................................................................................96,541 ¹ The exemption amount was phased out completely because AGI exceeded $255,450.
Figure G
Figure H
21
Individual Income Tax Rates and Shares, 2001
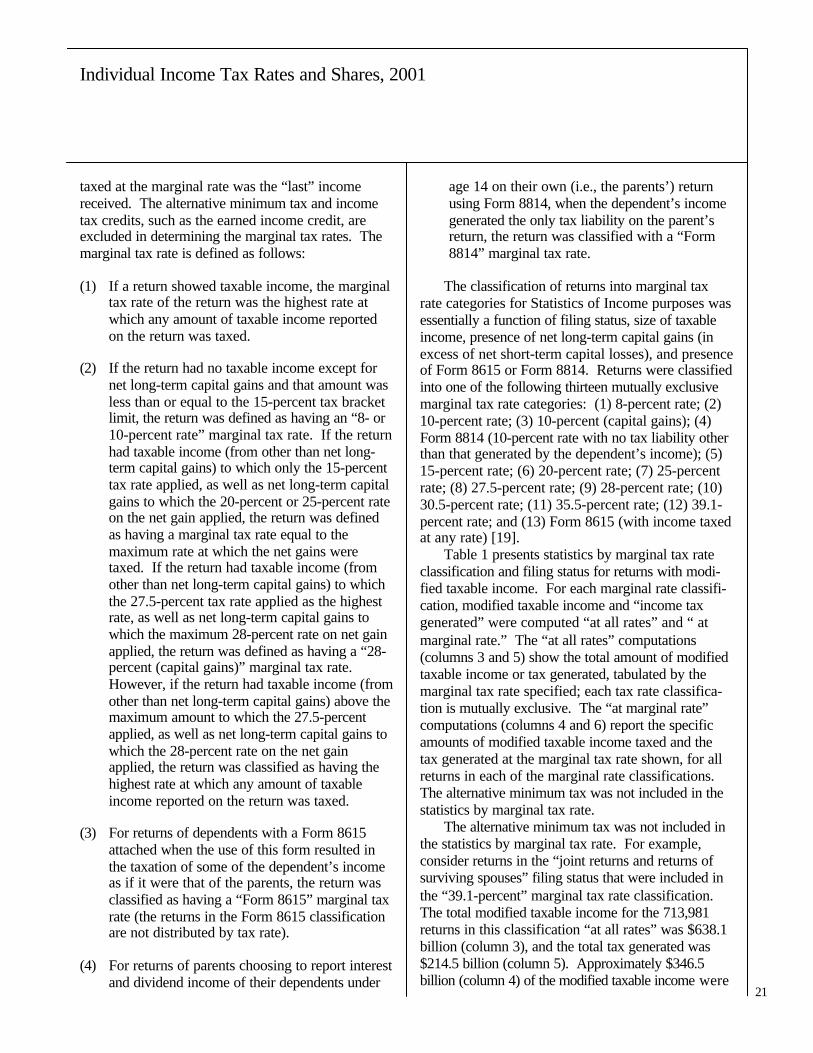
taxed at the marginal rate was the “last” incomereceived. The alternative minimum tax and incometax credits, such as the earned income credit, areexcluded in determining the marginal tax rates. Themarginal tax rate is defined as follows:
(1) If a return showed taxable income, the marginaltax rate of the return was the highest rate atwhich any amount of taxable income reportedon the return was taxed.
(2) If the return had no taxable income except fornet long-term capital gains and that amount wasless than or equal to the 15-percent tax bracketlimit, the return was defined as having an “8- or10-percent rate” marginal tax rate. If the returnhad taxable income (from other than net long-term capital gains) to which only the 15-percenttax rate applied, as well as net long-term capitalgains to which the 20-percent or 25-percent rateon the net gain applied, the return was definedas having a marginal tax rate equal to themaximum rate at which the net gains weretaxed. If the return had taxable income (fromother than net long-term capital gains) to whichthe 27.5-percent tax rate applied as the highestrate, as well as net long-term capital gains towhich the maximum 28-percent rate on net gainapplied, the return was defined as having a “28-percent (capital gains)” marginal tax rate.However, if the return had taxable income (fromother than net long-term capital gains) above themaximum amount to which the 27.5-percentapplied, as well as net long-term capital gains towhich the 28-percent rate on the net gainapplied, the return was classified as having thehighest rate at which any amount of taxableincome reported on the return was taxed.
(3) For returns of dependents with a Form 8615attached when the use of this form resulted inthe taxation of some of the dependent’s incomeas if it were that of the parents, the return wasclassified as having a “Form 8615” marginal taxrate (the returns in the Form 8615 classificationare not distributed by tax rate).
(4) For returns of parents choosing to report interestand dividend income of their dependents under
age 14 on their own (i.e., the parents’) returnusing Form 8814, when the dependent’s incomegenerated the only tax liability on the parent’sreturn, the return was classified with a “Form8814” marginal tax rate.
The classification of returns into marginal taxrate categories for Statistics of Income purposes wasessentially a function of filing status, size of taxableincome, presence of net long-term capital gains (inexcess of net short-term capital losses), and presenceof Form 8615 or Form 8814. Returns were classifiedinto one of the following thirteen mutually exclusivemarginal tax rate categories: (1) 8-percent rate; (2)10-percent rate; (3) 10-percent (capital gains); (4)Form 8814 (10-percent rate with no tax liability otherthan that generated by the dependent’s income); (5)15-percent rate; (6) 20-percent rate; (7) 25-percentrate; (8) 27.5-percent rate; (9) 28-percent rate; (10)30.5-percent rate; (11) 35.5-percent rate; (12) 39.1-percent rate; and (13) Form 8615 (with income taxedat any rate) [19].
Table 1 presents statistics by marginal tax rateclassification and filing status for returns with modi-fied taxable income. For each marginal rate classifi-cation, modified taxable income and “income taxgenerated” were computed “at all rates” and “ atmarginal rate.” The “at all rates” computations(columns 3 and 5) show the total amount of modifiedtaxable income or tax generated, tabulated by themarginal tax rate specified; each tax rate classifica-tion is mutually exclusive. The “at marginal rate”computations (columns 4 and 6) report the specificamounts of modified taxable income taxed and thetax generated at the marginal tax rate shown, for allreturns in each of the marginal rate classifications.The alternative minimum tax was not included in thestatistics by marginal tax rate.
The alternative minimum tax was not included inthe statistics by marginal tax rate. For example,consider returns in the “joint returns and returns ofsurviving spouses” filing status that were included inthe “39.1-percent” marginal tax rate classification.The total modified taxable income for the 713,981returns in this classification “at all rates” was $638.1billion (column 3), and the total tax generated was$214.5 billion (column 5). Approximately $346.5billion (column 4) of the modified taxable income were

22
Individual Income Tax Rates and Shares, 2001
22
subject to tax at the marginal tax rate of 39.1 per-cent. This modified taxable income generated $135.5billion (column 6) in tax at the 39.1-percent tax rate,with the remainder generated at some or all of thelower nine tax rates.
Table 2 provides statistics on the tax generated,in total and at each marginal tax rate bracket, forreturns with modified taxable income. Returns in thistable are classified by size of AGI rather than by themarginal tax rate classifications used in Table 1. Thetax generated at each marginal tax rate was com-puted based on the modified taxable income for eachindividual return.
For example, the 2.0 million returns included inthe “$200,000 under $500,000” income-size classifi-cation showed total modified taxable income of$482.8 billion and generated total tax of $134.0 billion.Of the $482.8 billion of modified taxable income, $0.6billion were taxed at 8 percent, $0.7 billion weretaxed at 10 percent, $84.8 billion were taxed at 15percent, $36.5 billion were taxed at 20 percent, $2.1billion were taxed at 25 percent, $116.8 billion weretaxed at 27.5 percent (ordinary income), $103.8billion were taxed at 30.5 percent, $114.7 billion weretaxed at 35.5 percent, and $22.5 billion were taxed at39.1 percent, with the remainder consisting of incomerelated to special capital gain tax rates and the Forms8814 and 8615. Approximately $0.05 billion of thetotal tax generated were from the 8-percent rate,$0.07 billion of the total tax generated were from the10-percent rate, $12.7 billion were from the 15-percent rate, $7.3 billion were from the 20-percentrate, $0.5 billion were from the 25-percent rate, $32.1billion were from the 27.5-percent rate, $31.7 billionwere from the 30.5-percent rate, $40.7 billion werefrom the 35.5-percent rate, and $8.8 billion weregenerated at the 39.1-percent rate, with the remainderfrom tax related to special capital gain tax rates andForms 8814 and 8615.
Table 3 presents statistics on the income and taxgenerated at each marginal tax rate (as in Table 2,columns 5 through 43) by filing status, instead of sizeof AGI, for returns with modified taxable income.More than 0.7 million of the 45.2 million returns withmodified taxable income filed jointly had some in-come taxed at the 39.1-percent tax rate. For thesereturns, the taxable income subject to this rate was$346.5 billion, and the tax generated was $135.5 billion.
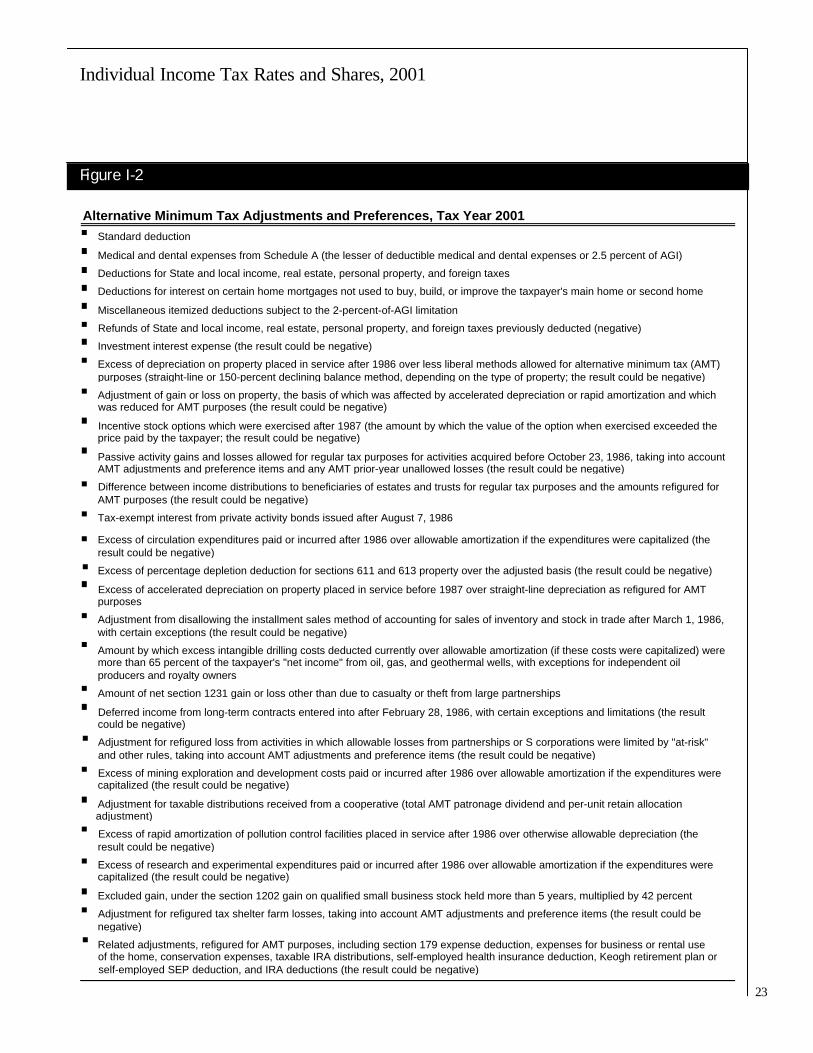
Appendix E: Computation of AlternativeMinimum Taxable Income (AMTI)AMTI was computed by adding certain “tax prefer-ences” (i.e., deduction or exclusion amountsidentified as potential sources of tax savings disal-lowed for AMT purposes) and “adjustments” (i.e.,regular tax deduction amounts recomputed or ex-cluded for AMT purposes) to taxable income beforeany deductions were taken for personal exemptions(Figures I-1 and I-2). Although itemized deductionsfor some taxpayers were limited for regular taxpurposes, the full amounts of such itemized deduc-tions were included as adjustments. (To compensatefor this, the overall limitation on itemized deductionswas then subtracted from taxable income for AMTpurposes.) The “net operating loss deduction” wasrecomputed to allow for the exclusion of the “taxpreference items” and “adjustments” used to reduceregular tax liability. The recomputed net operatingloss deduction, termed the “alternative net operatingloss deduction,” was limited to 90 percent of AMTI(with certain minor exceptions for 2000).
AMTI was reduced by an exemption amountwhich depended on the filing status of the individualand which was subject to phaseout at higher AMTIlevels. The AMTI exemption for single filers (andheads of households) was $35,750; for joint filers andsurviving spouses, $49,000; and for married personsfiling separately, $24,500. The exemption was re-duced (but not below zero) by 25 percent of theamount by which the AMTI exceeded thresholdlevels of $112,500 for single filers and heads of
Calculation of Alternative Minimum TaxableIncome (AMTI), Tax Year 2001
Taxable income before deduction for personalexemptions
PLUS: Adjustments and preferences
PLUS: Net operating loss deduction
MINUS: Overall itemized deductions limitation
MINUS: Alternative tax net operating loss deduction¹
EQUALS: Alternative minimum taxable income
¹ Limited to 90 percent of AMTI, except when depletion is present on Form6251. In this case, AMTI is recalculated, and the alternative tax net operating loss deduction is limited to 90 percent of the recomputed amount.
Figure I-1
23
Individual Income Tax Rates and Shares, 2001
Alternative Minimum Tax Adjustments and Preferences, Tax Year 2001 Standard deduction
Medical and dental expenses from Schedule A (the lesser of deductible medical and dental expenses or 2.5 percent of AGI)
Deductions for State and local income, real estate, personal property, and foreign taxes
Deductions for interest on certain home mortgages not used to buy, build, or improve the taxpayer's main home or second home
Miscellaneous itemized deductions subject to the 2-percent-of-AGI limitation
Refunds of State and local income, real estate, personal property, and foreign taxes previously deducted (negative)
Investment interest expense (the result could be negative)
Excess of depreciation on property placed in service after 1986 over less liberal methods allowed for alternative minimum tax (AMT) purposes (straight-line or 150-percent declining balance method, depending on the type of property; the result could be negative)
Adjustment of gain or loss on property, the basis of which was affected by accelerated depreciation or rapid amortization and which was reduced for AMT purposes (the result could be negative)
Incentive stock options which were exercised after 1987 (the amount by which the value of the option when exercised exceeded the price paid by the taxpayer; the result could be negative)
Passive activity gains and losses allowed for regular tax purposes for activities acquired before October 23, 1986, taking into account AMT adjustments and preference items and any AMT prior-year unallowed losses (the result could be negative)
Difference between income distributions to beneficiaries of estates and trusts for regular tax purposes and the amounts refigured for AMT purposes (the result could be negative)
Tax-exempt interest from private activity bonds issued after August 7, 1986
Excess of circulation expenditures paid or incurred after 1986 over allowable amortization if the expenditures were capitalized (the result could be negative)
Excess of percentage depletion deduction for sections 611 and 613 property over the adjusted basis (the result could be negative)
Excess of accelerated depreciation on property placed in service before 1987 over straight-line depreciation as refigured for AMT purposes
Adjustment from disallowing the installment sales method of accounting for sales of inventory and stock in trade after March 1, 1986, with certain exceptions (the result could be negative)
Amount by which excess intangible drilling costs deducted currently over allowable amortization (if these costs were capitalized) were more than 65 percent of the taxpayer's "net income" from oil, gas, and geothermal wells, with exceptions for independent oil producers and royalty owners
Amount of net section 1231 gain or loss other than due to casualty or theft from large partnerships
Deferred income from long-term contracts entered into after February 28, 1986, with certain exceptions and limitations (the result could be negative)
Adjustment for refigured loss from activities in which allowable losses from partnerships or S corporations were limited by "at-risk" and other rules, taking into account AMT adjustments and preference items (the result could be negative)
Excess of mining exploration and development costs paid or incurred after 1986 over allowable amortization if the expenditures were capitalized (the result could be negative)
Adjustment for taxable distributions received from a cooperative (total AMT patronage dividend and per-unit retain allocation adjustment)
Excess of rapid amortization of pollution control facilities placed in service after 1986 over otherwise allowable depreciation (the result could be negative)
Excess of research and experimental expenditures paid or incurred after 1986 over allowable amortization if the expenditures were capitalized (the result could be negative)
Excluded gain, under the section 1202 gain on qualified small business stock held more than 5 years, multiplied by 42 percent
Adjustment for refigured tax shelter farm losses, taking into account AMT adjustments and preference items (the result could be negative)
Related adjustments, refigured for AMT purposes, including section 179 expense deduction, expenses for business or rental use of the home, conservation expenses, taxable IRA distributions, self-employed health insurance deduction, Keogh retirement plan or self-employed SEP deduction, and IRA deductions (the result could be negative)
Figure I-2
24
Individual Income Tax Rates and Shares, 2001
24
households, $150,000 for joint filers, and $75,000 formarried persons filing separately. The exemptionwas phased out completely for individuals whosefiling status was single or head of household, marriedfiling jointly, and married filing separately, at $247,500,$330,000, and $165,000, of AMTI, respectively.
After reduction by the exemption, the first$175,000 ($87,500 if married filing separately) of theremaining AMTI were subject to tax at a 26-percentrate, with any excess taxed at a 28-percent rate.However, capital gains (recalculated for AMT pur-poses) that were taxed at lower rates (8 percent, 10percent, 20 percent, and 25 percent) were tax atthese same rates for the AMT, with the rest ofAMTI being taxed at the rates mentioned above (26percent or 28 percent). The resulting tax was re-duced by the “alternative minimum tax foreign taxcredit,” which produced a “tentative minimum tax.”Tentative minimum tax was further reduced by theindividual’s regular tax before credits (excluding taxon lump-sum distributions from qualified retirementplans) less the foreign tax credit (for regular taxpurposes) to yield the alternative minimum tax.
Dependents under the age of 14 with investmentincome over a certain amount who filed their ownreturns were subject to special rules for AMT pur-poses. These rules required that the dependents paythe same amount of AMT as their parents wouldhave paid if the parents included the dependents’incomes on their own tax returns. (Dependents filingtheir own returns were limited to an AMT exemptionof $5,200 plus their “earned income.” Thedependent’s AMT could be reduced if the parentshad regular tax greater than the child’s own tentativeminimum tax, or if any other dependent under age 14of the same parents had regular tax greater than thisdependent’s own tentative minimum tax.)
Appendix F: Data Sources and LimitationsThese statistics are based on a sample of individualincome tax returns (Forms 1040, 1040A, and 1040EZ,including electronically-filed returns) filed duringCalendar Year 2002. Returns in the sample werestratified based on: (1) the larger of positive incomeor negative income; (2) the size of business and farmreceipts; (3) the presence or absence of specificforms or schedules; and (4) the usefulness of returnsfor tax policy modeling purposes [20]. Returns werethen selected at rates ranging from 0.05 percent to
100 percent. The 2001 data are based on a sampleof 191,975 returns and an estimated final populationof 130,571,421 returns. The corresponding sampleand population for the 2000 data were 196,150 and129,644,980 returns, respectively.
Since the data presented here are estimatesbased on a sample of returns filed, they are subject tosampling error. To properly use the statistical dataprovided, the magnitude of the potential samplingerror must be known; coefficients of variation (CV’s)are used to measure that magnitude. Figure J showsestimated CV’s for the numbers of returns andmoney amounts for selected income items. Thereliability of estimates based on samples, and the useof coefficients of variation for evaluating the preci-sion of estimates based on samples, are discussed inthe appendix to this issue of the Bulletin.
Notes and References[1] For Tax Years 1988 through 1990, the tax rate
schedules provided only two basic rates: 15percent and 28 percent. However, taxableincome over certain levels was subject to a 33-percent tax rate to phase out the benefit of the15-percent tax bracket (as compared to the 28-percent rate) and the deduction for personalexemptions. At the taxable income level wherethese benefits were completely phased out, thetax rate returned to 28 percent.
[2] Individual Income Tax Returns, Statistics ofIncome Division, Internal Revenue Service,Publication 1304, Years 1953 through 2001.
[3] U.S. Department of Labor, Bureau of LaborStatistics, Monthly Labor Review. The con-sumer price index (CPI-U) represents annualaverages of monthly figures and reflects thebuying of typical urban consumers (1982-84=100):
Year CPI-U2001 177.12000 172.2
[4] Nontaxable (i.e., tax-exempt) forms of income,such as interest on State and local governmentobligations, were not included in AGI andgenerally did not affect the marginal tax rate.However, in some situations the receipt of someforms of tax-exempt income, such as tax-

25
Individual Income Tax Rates and Shares, 2001
exempt interest, could have influenced thetaxability of other income, in particular SocialSecurity benefits. When this situation occurred,the income made taxable by the receipt of otherforms of nontaxable income was included in AGI.
[5] Campbell, David and Parisi, Michael, “Indi-vidual Income Tax Rates and Shares,” Statis-tics of Income Bulletin, Winter 2002-2003,Volume 22, Number 3, pp. 6-46.
[6] Tax generated does not include certain othertaxes reported on the individual income taxreturn, such as self-employment tax (the SocialSecurity tax on income from self-employment),the Social Security tax on certain tip income,tax from the recapture of prior-year investmentor low-income housing credits, tax applicable toearly withdrawals from an Individual Retire-ment Arrangement (IRA) or other qualified
retirement plans, tax on trusts, accumulationand distributions, and household employmenttaxes. The statistics for “total tax liability,”shown in Campbell and Parisi, “IndividualIncome Tax Returns: 2001,” Statistics ofIncome Bulletin, Fall 2003, Volume 23, Num-ber 2, include these taxes. For Tax Year 2001,total tax liability reported on 97.6 million returnswas $925.4 billion.
[7] The income amounts on which these specialcomputations for lump-sum distributions werebased were not reflected in current-year AGIor current-year taxable income.
[8] For 2001, the total earned income credit was$33.4 billion. This amount includes the amountused to reduce the income tax ($1.5 billion), theamount used to reduce other taxes reported onindividual income tax returns ($2.9 billion), and
Figure J
Coefficients of Variation for Selected Items, by Size of Adjusted Gross Income, Tax Year 2001[Coefficients of variation are percentages]
Modified taxable income Total
Size of adjusted gross income Number of Tax generated income
returns Amount tax
(1) (2) (3) (4) (5)
Total................................................................................... 0.17 0.15 0.17 0.19 0.19
Under $2,000 ¹................................................................................... 5.53 6.64 6.93 6.74 6.74 $2,000 under $4,000...................................................................................5.65 6.65 7.27 7.29 7.29 $4,000 under $6,000...................................................................................3.63 4.78 5.70 5.72 5.72 $6,000 under $8,000...................................................................................3.23 3.84 3.94 4.05 4.05 $8,000 under $10,000...................................................................................2.49 3.07 2.95 3.38 3.38 $10,000 under $12,000...................................................................................2.54 2.77 2.71 2.91 2.91 $12,000 under $14,000...................................................................................2.37 2.63 2.61 2.81 2.81
$14,000 under $16,000...................................................................................2.15 2.43 2.44 2.71 2.71 $16,000 under $18,000...................................................................................2.05 2.35 2.36 2.73 2.73 $18,000 under $20,000...................................................................................2.07 2.33 2.33 2.72 2.72 $20,000 under $25,000...................................................................................1.29 1.43 1.43 1.70 1.70 $25,000 under $30,000...................................................................................1.39 1.49 1.49 1.67 1.67 $30,000 under $40,000...................................................................................1.05 1.11 1.12 1.20 1.20 $40,000 under $50,000...................................................................................1.07 1.12 1.16 1.23 1.23
$50,000 under $75,000...................................................................................0.79 0.83 0.87 0.91 0.91 $75,000 under $100,000...................................................................................1.01 1.05 1.09 1.12 1.12 $100,000 under $200,000...................................................................................1.00 0.93 0.93 0.93 0.93 $200,000 under $500,000...................................................................................1.10 0.96 0.95 0.96 0.96 $500,000 under $1,000,000...................................................................................1.08 0.97 0.98 0.98 0.98
$1,000,000 under $1,500,000........................................ 1.31 1.24 1.27 1.28 1.28 $1,500,000 under $2,000,000........................................ 1.18 1.20 1.22 1.23 1.23 $2,000,000 under $5,000,000........................................ 0.56 0.50 0.52 0.52 0.52 $5,000,000 under $10,000,000...................................... 0.61 0.50 0.52 0.53 0.53 $10,000,000 or more...................................................................................0.04 0.02 0.03 0.03 0.03
¹ Includes returns with adjusted gross deficit.
Income tax after credits
26
Individual Income Tax Rates and Shares, 2001
26
the amount refunded to taxpayers ($29.0billion). Table 4 in Campbell and Parisi, “Indi-vidual Income Tax Returns: 2001,” Statisticsof Income Bulletin, Fall 2003, Volume 23,Number 2, shows these amounts.
[9] The percentile groupings of tax filers excludereturns with zero or negative AGI.
[10] For an explanation of the osculatory interpola-tion technique, see Oh, H. Lock, “OsculatoryInterpolation with a Monotonicity Constraint,”1977 Proceedings of the American Statisti-cal Association, Section on StatisticalComputing, 1978.
[11] Taxpayers fall into one of five filing statuses:single; married filing jointly; married filingseparately; head of household; or survivingspouse. Being age 65 or older or being legallyblind affects the amount of the standard deduc-tion and, hence, the filing requirements. Tax-payers who are (or could be) dependents ofother taxpayers have different filing require-ments. For more information on the generalfiling requirements, see Campbell and Parisi,“Individual Income Tax Returns: 2001,”Statistics of Income Bulletin, Fall 2003,Volume 23, Number 2.
[12] As defined under section 61 of the InternalRevenue Code, gross income includes amountsfrom wages and salaries, interest and dividends,alimony, bartering income, canceled debtincome, gambling winnings, rents and royalties,and gains from property sales or exchanges, aswell as gross income from sole proprietorshipsand farming, income from partnerships and Scorporations, and distributions from estates andtrusts. This definition of gross income is slightlydifferent from the Form 1040, U.S. IndividualIncome Tax Return, concept of “total income,”which is a component of the adjusted grossincome (AGI) calculation on Form 1040. Totalincome includes net amounts rather than grossamounts (income prior to deductions) from suchitems as business income and rents and royalties.
[13] As defined under Internal Revenue Codesection 62, deductible expenses are thoseincurred in the course of a trade or business or
in connection with rents and royalties; lossesfrom property sales or exchanges; and certainstatutory adjustments, such as deductiblecontributions to an IRA or Keogh plan, movingexpenses, or the health insurance deduction forcertain self-employed taxpayers.
[14] Income tax before credits includes tax onlump-sum distributions from qualified retire-ment plans.
[15] The 26-percent tax rate is for AMT purposes only.
[16] For taxable income between $0 and $5 andbetween $5 and $25, the tax brackets were $5and $10 wide, respectively. For taxable incomebetween $25 and $3,000, the brackets were $25wide. Brackets for taxable income above$3,000 were $50 wide.
[17] For example, assume a taxpayer filing as “marriedfiling separately” reported taxable income of$85,000. Using the tax table, the tax would be$21,558, but, using the tax rate schedules, thetax would be $21,548.75, a difference of $9.25.
[18] For more details on the income computationunder the 1979 Income Concept for 2001, seeIndividual Income Tax Returns, 2001,Statistics of Income Division, Internal RevenueService, Publication 1304.
[19] For some taxpayers, the statutory marginal taxrate may differ from the effective marginal taxrate. For example, extra income received bycertain taxpayers may result in the phaseout oftheir personal exemptions as well as some oftheir itemized deductions. Therefore, an extra$1 of income could add more than $1 of taxableincome. While this taxpayer could face astatutory marginal tax rate of 30.5 percent, theeffective marginal rate faced by the taxpayerwould be somewhat higher.
[20] Returns in the sample were stratified based onthe presence or absence of one or more of thefollowing forms or schedules: Form 2555,Foreign Earned Income; Form 1116, ForeignTax Credit (Individual, Fiduciary, or Non-resident Alien Individual); Schedule C, Profitor Loss from Business (Sole Proprietorship);and Schedule F, Profit or Loss From Farming.

27
Individual Income Tax Rates and Shares, 2001
Table 1.--Returns with Modified Taxable Income: Tax Classified by Marginal Tax Rate, Tax Year 2001[All figures are estimates based on samples--money amounts are in thousands of dollars]
Modified taxable income Tax generated Income tax after credits
Adjusted As a percentage of--Highest marginal rate Number of gross Taxed at Taxed at At Adjusted Modified
at which tax was computed returns income all rates marginal At all rates marginal Total gross taxable(less deficit) rate rate income income
(less deficit)(1) (2) (3) (4) (5) (6) (7) (8) (9)
All returns
Total..................................................................................................................104,163,693 6,050,309,334 4,269,339,932 2,181,469,158 926,646,417 518,687,805 887,249,293 14.7 20.8
8 percent..................................................................................................................187,240 4,242,416 1,410,668 1,410,668 112,850 112,853 95,422 2.2 6.8 10 percent (capital gains)..................................................................................................................554,064 7,967,239 2,645,170 1,927,058 257,111 192,706 233,479 2.9 8.8 10 percent..................................................................................................................3,877,821 22,928,193 7,834,252 7,834,252 783,586 783,425 782,761 3.4 10.0 10 percent (Form 8814) ¹..................................................................................................................8,324 -157,822 10,580 10,580 1,058 1,058 6,666 (X) 63.0 15 percent..................................................................................................................65,207,298 1,987,679,803 1,056,357,480 1,041,994,466 157,672,420 156,299,170 129,730,098 6.5 12.3
20 percent..................................................................................................................685,760 123,534,163 95,447,222 69,299,574 17,160,764 13,859,915 17,884,958 14.5 18.7 25 percent..................................................................................................................47,801 8,127,008 6,781,981 1,544,944 1,338,779 386,236 1,368,743 16.8 20.2 27.5 percent..................................................................................................................27,219,888 2,094,075,310 1,554,572,661 487,535,342 296,370,247 134,072,219 288,472,945 13.8 18.6 28 percent (capital gains)..................................................................................................................49,296 4,928,994 3,897,093 160,845 793,800 45,037 787,259 16.0 20.2
30.5 percent..................................................................................................................3,824,132 558,275,261 450,404,363 82,442,760 106,868,479 25,145,042 106,992,059 19.2 23.8 35.5 percent..................................................................................................................1,453,822 388,065,125 328,972,332 71,430,390 89,323,624 25,357,788 89,304,233 23.0 27.1 39.1 percent..................................................................................................................846,345 848,700,501 759,379,672 414,393,069 255,544,943 162,027,690 251,167,102 29.6 33.1 Form 8615 ²..................................................................................................................201,902 1,943,144 1,626,456 1,485,208 418,758 404,666 423,566 21.8 26.0
Joint returns and returns
of surviving spouses
Total..................................................................................................................45,184,133 4,041,688,868 2,908,857,140 1,403,696,034 657,562,444 357,451,989 631,890,993 15.6 21.7 8 percent..................................................................................................................76,687 2,736,644 791,910 791,910 63,351 63,353 55,886 2.0 7.1
10 percent (capital gains)..................................................................................................................118,133 4,204,364 1,208,567 1,075,427 118,202 107,543 103,010 2.5 8.5 10 percent..................................................................................................................-- -- -- -- -- -- -- (X) (X) 10 percent (Form 8814) ¹..................................................................................................................6,103 -151,339 8,332 8,332 833 833 6,390 4.2 76.7 15 percent..................................................................................................................25,159,629 1,082,075,392 570,064,365 564,140,756 85,169,521 84,621,113 69,197,081 6.4 12.1
20 percent..................................................................................................................405,045 88,103,648 68,101,887 49,738,438 12,286,316 9,947,688 12,770,750 14.5 18.8 25 percent..................................................................................................................31,977 6,051,399 4,987,565 1,145,230 982,819 286,308 1,006,306 16.6 20.2 27.5 percent..................................................................................................................15,380,292 1,457,259,036 1,064,064,336 337,218,938 203,429,641 92,735,208 196,457,231 13.5 18.5 28 percent (capital gains)..................................................................................................................33,692 3,829,249 3,024,938 125,475 615,454 35,133 610,791 16.0 20.2 30.5 percent..................................................................................................................2,136,205 372,302,732 295,511,087 47,499,020 69,568,072 14,487,201 69,647,514 18.7 23.6
35.5 percent..................................................................................................................1,122,391 312,221,095 263,028,560 55,439,490 70,851,803 19,681,019 70,860,233 22.7 26.9 39.1 percent..................................................................................................................713,981 713,056,648 638,065,592 346,513,019 214,476,432 135,486,590 211,175,801 29.6 33.1 Form 8615 ²..................................................................................................................-- -- -- -- -- -- -- (X) (X)
Returns of married
persons filing separately
Total..................................................................................................................2,181,354 104,906,702 77,060,005 41,093,721 18,117,232 10,984,489 17,582,905 16.8 22.8 8 percent..................................................................................................................962 16,736 9,355 9,355 749 748 748 4.5 8.0 10 percent (capital gains)..................................................................................................................3,490 52,457 27,053 27,049 2,706 2,705 2,040 3.9 7.5
10 percent..................................................................................................................9,975 55,745 20,774 20,774 2,079 2,077 2,080 3.7 10.0 10 percent (Form 8814) ¹..................................................................................................................4 -23,041 3 3 -- -- 226 1.0 7,533.3 15 percent..................................................................................................................1,284,957 28,086,102 15,442,947 15,401,255 2,314,293 2,310,188 2,058,351 7.3 13.3 20 percent..................................................................................................................12,649 2,729,679 1,986,809 1,701,247 377,282 340,249 411,885 15.1 20.7
25 percent..................................................................................................................954 75,694 60,624 13,264 11,717 3,316 11,536 15.2 19.0 27.5 percent..................................................................................................................700,348 32,454,704 23,999,901 7,625,704 4,581,538 2,097,069 4,497,329 13.9 18.7 28 percent (capital gains)..................................................................................................................940 48,750 34,596 3,173 6,796 888 4,696 9.6 13.6 30.5 percent..................................................................................................................97,385 8,560,077 6,907,627 1,279,764 1,640,618 390,328 1,635,195 19.1 23.7 35.5 percent..................................................................................................................37,328 5,461,892 4,617,998 911,737 1,225,420 323,667 1,235,085 22.6 26.7
39.1 percent..................................................................................................................32,362 27,387,905 23,952,319 14,100,395 7,954,034 5,513,254 7,723,733 28.2 32.2 Form 8615 ²..................................................................................................................-- -- -- -- -- -- -- (X) (X)
Footnotes at end of table.
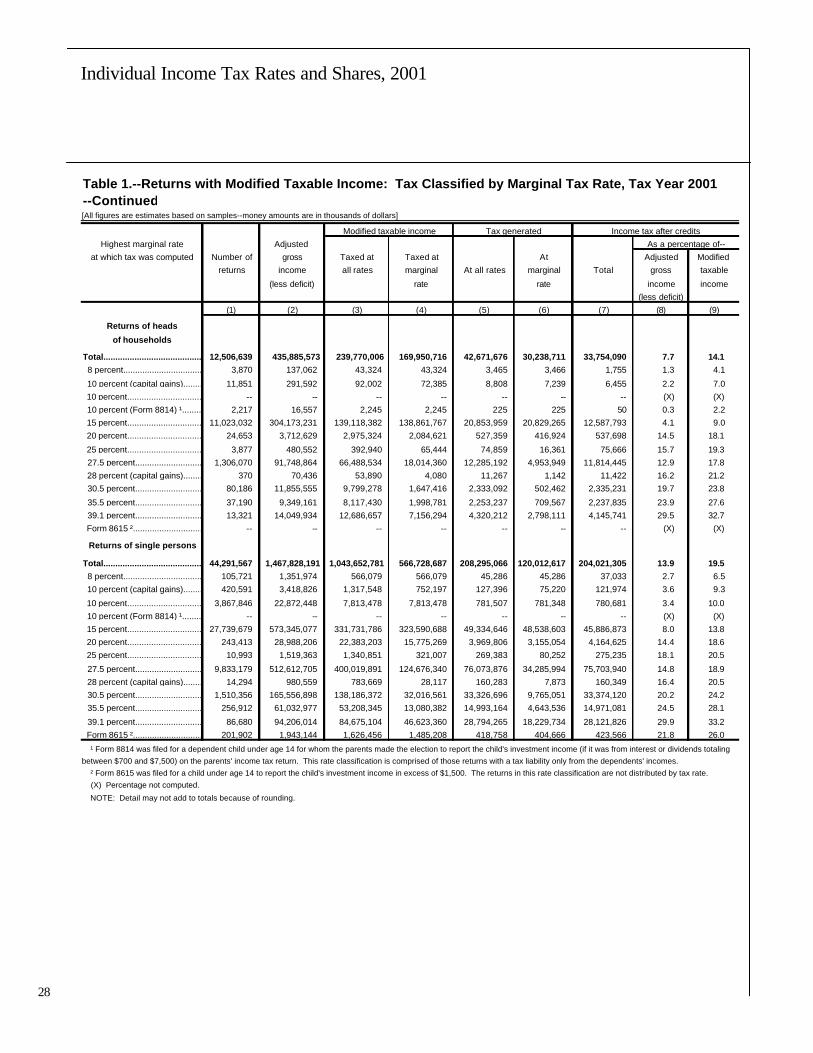
28
Individual Income Tax Rates and Shares, 2001
28
Table 1.--Returns with Modified Taxable Income: Tax Classified by Marginal Tax Rate, Tax Year 2001--Continued[All figures are estimates based on samples--money amounts are in thousands of dollars]
Modified taxable income Tax generated Income tax after creditsHighest marginal rate Adjusted As a percentage of--
at which tax was computed Number of gross Taxed at Taxed at At Adjusted Modifiedreturns income all rates marginal At all rates marginal Total gross taxable
(less deficit) rate rate income income(less deficit)
(1) (2) (3) (4) (5) (6) (7) (8) (9)
Returns of heads
of households
Total..................................................................................................................12,506,639 435,885,573 239,770,006 169,950,716 42,671,676 30,238,711 33,754,090 7.7 14.1 8 percent..................................................................................................................3,870 137,062 43,324 43,324 3,465 3,466 1,755 1.3 4.1
10 percent (capital gains)..................................................................................................................11,851 291,592 92,002 72,385 8,808 7,239 6,455 2.2 7.0 10 percent..................................................................................................................-- -- -- -- -- -- -- (X) (X) 10 percent (Form 8814) ¹..................................................................................................................2,217 16,557 2,245 2,245 225 225 50 0.3 2.2 15 percent..................................................................................................................11,023,032 304,173,231 139,118,382 138,861,767 20,853,959 20,829,265 12,587,793 4.1 9.0 20 percent..................................................................................................................24,653 3,712,629 2,975,324 2,084,621 527,359 416,924 537,698 14.5 18.1
25 percent..................................................................................................................3,877 480,552 392,940 65,444 74,859 16,361 75,666 15.7 19.3 27.5 percent..................................................................................................................1,306,070 91,748,864 66,488,534 18,014,360 12,285,192 4,953,949 11,814,445 12.9 17.8 28 percent (capital gains)..................................................................................................................370 70,436 53,890 4,080 11,267 1,142 11,422 16.2 21.2 30.5 percent..................................................................................................................80,186 11,855,555 9,799,278 1,647,416 2,333,092 502,462 2,335,231 19.7 23.8
35.5 percent..................................................................................................................37,190 9,349,161 8,117,430 1,998,781 2,253,237 709,567 2,237,835 23.9 27.6 39.1 percent..................................................................................................................13,321 14,049,934 12,686,657 7,156,294 4,320,212 2,798,111 4,145,741 29.5 32.7 Form 8615 ²..................................................................................................................-- -- -- -- -- -- -- (X) (X)
Returns of single persons
Total..................................................................................................................44,291,567 1,467,828,191 1,043,652,781 566,728,687 208,295,066 120,012,617 204,021,305 13.9 19.5 8 percent..................................................................................................................105,721 1,351,974 566,079 566,079 45,286 45,286 37,033 2.7 6.5 10 percent (capital gains)..................................................................................................................420,591 3,418,826 1,317,548 752,197 127,396 75,220 121,974 3.6 9.3
10 percent..................................................................................................................3,867,846 22,872,448 7,813,478 7,813,478 781,507 781,348 780,681 3.4 10.0 10 percent (Form 8814) ¹..................................................................................................................-- -- -- -- -- -- -- (X) (X) 15 percent..................................................................................................................27,739,679 573,345,077 331,731,786 323,590,688 49,334,646 48,538,603 45,886,873 8.0 13.8 20 percent..................................................................................................................243,413 28,988,206 22,383,203 15,775,269 3,969,806 3,155,054 4,164,625 14.4 18.6 25 percent..................................................................................................................10,993 1,519,363 1,340,851 321,007 269,383 80,252 275,235 18.1 20.5
27.5 percent..................................................................................................................9,833,179 512,612,705 400,019,891 124,676,340 76,073,876 34,285,994 75,703,940 14.8 18.9 28 percent (capital gains)..................................................................................................................14,294 980,559 783,669 28,117 160,283 7,873 160,349 16.4 20.5 30.5 percent..................................................................................................................1,510,356 165,556,898 138,186,372 32,016,561 33,326,696 9,765,051 33,374,120 20.2 24.2 35.5 percent..................................................................................................................256,912 61,032,977 53,208,345 13,080,382 14,993,164 4,643,536 14,971,081 24.5 28.1
39.1 percent..................................................................................................................86,680 94,206,014 84,675,104 46,623,360 28,794,265 18,229,734 28,121,826 29.9 33.2 Form 8615 ²..................................................................................................................201,902 1,943,144 1,626,456 1,485,208 418,758 404,666 423,566 21.8 26.0
¹ Form 8814 was filed for a dependent child under age 14 for whom the parents made the election to report the child's investment income (if it was from interest or dividends totaling between $700 and $7,500) on the parents' income tax return. This rate classification is comprised of those returns with a tax liability only from the dependents' incomes. ² Form 8615 was filed for a child under age 14 to report the child's investment income in excess of $1,500. The returns in this rate classification are not distributed by tax rate. (X) Percentage not computed.
NOTE: Detail may not add to totals because of rounding.

29
Individual Income Tax Rates and Shares, 2001
Table 2.--Returns with Modified Taxable Income: Tax Generated by Rate and by Size of Adjusted GrossIncome, Tax Year 2001[All figures are estimates based on samples--money amounts are in thousands of dollars]
Tax generated at specified rate
Size of Number Modified Tax 8 percent 10 percent (capital gains)
adjusted gross income of Taxable taxable generated Number Income Tax Number Income Tax
returns income income at all rates of taxed generated of taxed generated
returns at rate at rate returns at rate at rate
(1) (2) (3) (4) (5) (6) (7) (8) (9) (10)
Total...........................................................104,163,693 4,268,506,370 4,269,339,932 926,646,417 2,735,436 10,786,662 862,919 4,175,781 12,315,868 1,231,798
Under $2,000 ¹......................................................519,666 251,530 251,796 26,789 73,611 13,711 1,099 78,300 22,398 2,240 $2,000 under $4,000......................................................490,858 592,284 596,301 70,292 74,148 37,922 3,032 74,329 38,741 3,874 $4,000 under $6,000......................................................1,398,125 1,349,691 1,353,132 151,023 46,080 31,057 2,484 65,105 54,374 5,434 $6,000 under $8,000......................................................1,740,573 3,334,294 3,340,330 355,450 41,033 37,279 2,979 47,139 36,042 3,605
$8,000 under $10,000......................................................2,865,446 6,111,479 6,113,013 777,835 55,672 35,112 2,806 87,611 68,950 6,898
$10,000 under $12,000......................................................2,713,224 9,843,580 9,845,243 1,365,943 50,504 40,835 3,266 104,081 101,715 10,173 $12,000 under $14,000......................................................3,144,800 14,747,878 14,748,241 2,131,858 69,614 101,515 8,123 116,046 138,075 13,809
$14,000 under $16,000......................................................3,728,289 21,249,078 21,252,182 3,130,308 93,750 110,808 8,862 153,553 218,115 21,824 $16,000 under $18,000......................................................4,089,586 26,657,834 26,665,422 3,950,516 110,684 206,888 16,549 176,317 230,694 23,082 $18,000 under $20,000......................................................3,975,869 31,986,776 31,989,868 4,769,242 95,601 179,503 14,360 168,862 248,403 24,848
$20,000 under $25,000......................................................9,489,758 102,334,332 102,353,587 15,269,866 226,730 496,969 39,753 379,660 614,502 61,469 $25,000 under $30,000......................................................8,390,626 126,824,811 126,823,364 18,946,371 219,658 510,300 40,823 403,126 712,785 71,296 $30,000 under $40,000......................................................13,662,459 288,448,815 288,490,074 43,882,869 403,143 1,229,246 98,339 696,932 1,527,174 152,767 $40,000 under $50,000......................................................10,543,289 305,197,261 305,251,843 49,309,375 323,088 901,186 72,100 508,681 1,165,712 116,599
$50,000 under $75,000......................................................17,507,070 731,935,622 732,054,569 123,298,530 575,962 2,914,111 233,125 835,591 3,146,511 314,688
$75,000 under $100,000......................................................8,885,612 546,501,714 546,597,643 103,648,825 118,783 1,112,036 88,963 159,010 1,389,289 138,944 $100,000 under $200,000......................................................8,457,558 843,411,444 843,597,907 187,160,993 114,645 1,891,805 151,346 82,141 1,533,902 153,396
$200,000 under $500,000......................................................2,013,756 482,712,954 482,808,347 134,043,009 29,848 607,712 48,616 27,527 670,968 67,097 $500,000 under $1,000,000......................................................354,618 211,318,031 211,341,365 68,194,292 7,177 174,307 13,945 6,126 190,120 19,012 $1,000,000 under $1,500,000......................................................85,195 91,492,389 91,524,394 30,676,646 2,039 54,476 4,358 1,850 66,587 6,659
$1,500,000 under $2,000,000......................................................36,329 55,760,182 55,770,061 18,741,216 1,050 27,650 2,212 979 34,366 3,437 $2,000,000 under $5,000,000......................................................51,968 138,523,230 138,577,023 46,491,534 1,569 43,005 3,440 1,738 64,196 6,420 $5,000,000 under $10,000,000......................................................12,206 74,551,405 74,572,534 24,484,509 537 15,020 1,202 547 21,199 2,120 $10,000,000 or more......................................................6,812 153,369,759 153,421,694 45,769,129 511 14,210 1,137 533 21,052 2,105
Footnotes at end of table.
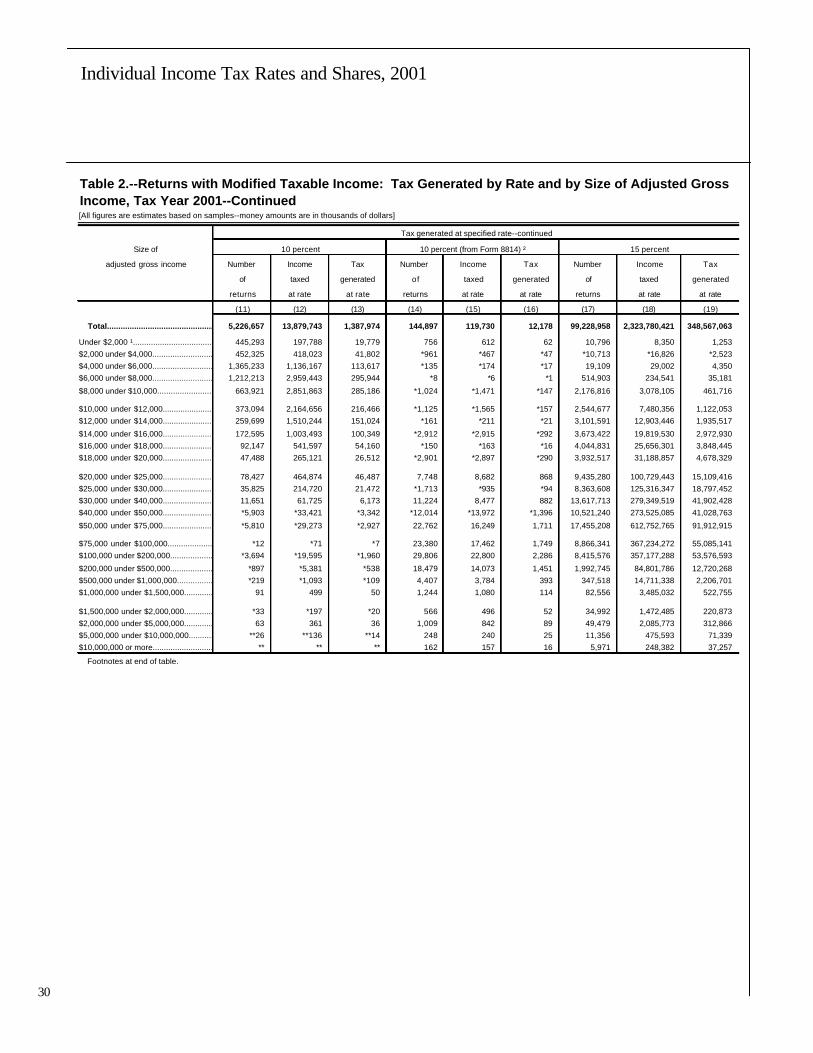
30
Individual Income Tax Rates and Shares, 2001
30
Table 2.--Returns with Modified Taxable Income: Tax Generated by Rate and by Size of Adjusted GrossIncome, Tax Year 2001--Continued[All figures are estimates based on samples--money amounts are in thousands of dollars]
Tax generated at specified rate--continued
Size of 10 percent 10 percent (from Form 8814) ² 15 percent
adjusted gross income Number Income Tax Number Income Tax Number Income Tax
of taxed generated of taxed generated of taxed generated
returns at rate at rate returns at rate at rate returns at rate at rate
(11) (12) (13) (14) (15) (16) (17) (18) (19)
Total...........................................................5,226,657 13,879,743 1,387,974 144,897 119,730 12,178 99,228,958 2,323,780,421 348,567,063
Under $2,000 ¹......................................................445,293 197,788 19,779 756 612 62 10,796 8,350 1,253 $2,000 under $4,000......................................................452,325 418,023 41,802 *961 *467 *47 *10,713 *16,826 *2,523 $4,000 under $6,000......................................................1,365,233 1,136,167 113,617 *135 *174 *17 19,109 29,002 4,350 $6,000 under $8,000......................................................1,212,213 2,959,443 295,944 *8 *6 *1 514,903 234,541 35,181
$8,000 under $10,000......................................................663,921 2,851,863 285,186 *1,024 *1,471 *147 2,176,816 3,078,105 461,716
$10,000 under $12,000......................................................373,094 2,164,656 216,466 *1,125 *1,565 *157 2,544,677 7,480,356 1,122,053 $12,000 under $14,000......................................................259,699 1,510,244 151,024 *161 *211 *21 3,101,591 12,903,446 1,935,517
$14,000 under $16,000......................................................172,595 1,003,493 100,349 *2,912 *2,915 *292 3,673,422 19,819,530 2,972,930 $16,000 under $18,000......................................................92,147 541,597 54,160 *150 *163 *16 4,044,831 25,656,301 3,848,445 $18,000 under $20,000......................................................47,488 265,121 26,512 *2,901 *2,897 *290 3,932,517 31,188,857 4,678,329
$20,000 under $25,000......................................................78,427 464,874 46,487 7,748 8,682 868 9,435,280 100,729,443 15,109,416 $25,000 under $30,000......................................................35,825 214,720 21,472 *1,713 *935 *94 8,363,608 125,316,347 18,797,452 $30,000 under $40,000......................................................11,651 61,725 6,173 11,224 8,477 882 13,617,713 279,349,519 41,902,428 $40,000 under $50,000......................................................*5,903 *33,421 *3,342 *12,014 *13,972 *1,396 10,521,240 273,525,085 41,028,763
$50,000 under $75,000......................................................*5,810 *29,273 *2,927 22,762 16,249 1,711 17,455,208 612,752,765 91,912,915
$75,000 under $100,000......................................................*12 *71 *7 23,380 17,462 1,749 8,866,341 367,234,272 55,085,141 $100,000 under $200,000......................................................*3,694 *19,595 *1,960 29,806 22,800 2,286 8,415,576 357,177,288 53,576,593
$200,000 under $500,000......................................................*897 *5,381 *538 18,479 14,073 1,451 1,992,745 84,801,786 12,720,268 $500,000 under $1,000,000......................................................*219 *1,093 *109 4,407 3,784 393 347,518 14,711,338 2,206,701 $1,000,000 under $1,500,000......................................................91 499 50 1,244 1,080 114 82,556 3,485,032 522,755
$1,500,000 under $2,000,000......................................................*33 *197 *20 566 496 52 34,992 1,472,485 220,873 $2,000,000 under $5,000,000......................................................63 361 36 1,009 842 89 49,479 2,085,773 312,866 $5,000,000 under $10,000,000......................................................**26 **136 **14 248 240 25 11,356 475,593 71,339 $10,000,000 or more......................................................** ** ** 162 157 16 5,971 248,382 37,257
Footnotes at end of table.

31
Individual Income Tax Rates and Shares, 2001
Table 2.--Returns with Modified Taxable Income: Tax Generated by Rate and by Size of Adjusted GrossIncome, Tax Year 2001--Continued[All figures are estimates based on samples--money amounts are in thousands of dollars]
Tax generated at specified rate--continued
Size of 20 percent 25 percent 27.5 percent
adjusted gross income Number Income Tax Number Income Tax Number Income Tax
of taxed generated of taxed generated of taxed generated
returns at rate at rate returns at rate at rate returns at rate at rate
(20) (21) (22) (23) (24) (25) (26) (27) (28)
Total...........................................................6,113,219 256,974,356 51,394,849 359,461 7,290,505 1,822,673 33,393,442 827,472,040 227,554,811
Under $2,000 ¹...................................................... -- -- -- -- -- -- -- -- -- $2,000 under $4,000......................................................-- -- -- -- -- -- -- -- -- $4,000 under $6,000......................................................-- -- -- -- -- -- -- -- -- $6,000 under $8,000......................................................-- -- -- -- -- -- -- -- --
$8,000 under $10,000......................................................-- -- -- -- -- -- -- -- --
$10,000 under $12,000......................................................-- -- -- -- -- -- -- -- -- $12,000 under $14,000......................................................-- -- -- -- -- -- -- -- --
$14,000 under $16,000......................................................-- -- -- -- -- -- -- -- -- $16,000 under $18,000......................................................-- -- -- -- -- -- -- -- -- $18,000 under $20,000......................................................-- -- -- -- -- -- -- -- --
$20,000 under $25,000......................................................-- -- -- -- -- -- *1,856 *2,470 *679 $25,000 under $30,000......................................................*2,989 *4,236 *847 -- -- -- 22,754 14,137 3,888 $30,000 under $40,000......................................................196,143 191,025 38,203 *2,958 *1,683 *422 2,340,349 6,103,791 1,678,543 $40,000 under $50,000......................................................377,259 772,159 154,434 *6,558 *15,375 *3,846 3,514,439 28,786,634 7,916,324
$50,000 under $75,000......................................................1,194,496 4,049,840 809,943 37,092 66,887 16,729 8,671,690 108,924,313 29,954,186
$75,000 under $100,000......................................................1,333,283 6,879,598 1,375,926 61,650 302,436 75,614 8,154,050 162,176,424 44,598,517 $100,000 under $200,000......................................................2,017,223 27,648,470 5,529,691 145,417 1,933,291 483,342 8,211,349 373,402,668 102,685,734
$200,000 under $500,000......................................................736,898 36,523,385 7,304,675 75,418 2,114,113 528,537 1,953,806 116,804,573 32,121,258 $500,000 under $1,000,000......................................................153,570 26,721,685 5,344,338 17,987 1,074,723 268,683 341,115 20,403,792 5,611,043 $1,000,000 under $1,500,000......................................................41,087 14,812,937 2,962,588 5,048 406,173 101,544 81,535 4,868,314 1,338,786
$1,500,000 under $2,000,000......................................................19,100 10,906,486 2,181,297 2,248 275,437 68,860 34,470 2,054,283 564,928 $2,000,000 under $5,000,000......................................................29,042 32,629,212 6,525,842 3,478 600,152 150,038 48,863 2,914,233 801,414 $5,000,000 under $10,000,000......................................................7,410 22,569,237 4,513,847 947 231,169 57,792 11,241 666,585 183,311 $10,000,000 or more......................................................4,719 73,266,084 14,653,217 662 269,066 67,267 5,924 349,822 96,201
Footnotes at end of table.

32
Individual Income Tax Rates and Shares, 2001
32
Table 2.--Returns with Modified Taxable Income: Tax Generated by Rate and by Size of Adjusted GrossIncome, Tax Year 2001--Continued[All figures are estimates based on samples--money amounts are in thousands of dollars]
Tax generated at specified rate--continued
Size of 28 percent (capital gains) 30.5 percent 35.5 percent
adjusted gross income Number Income Tax Number Income Tax Number Income Tax
of taxed generated of taxed generated of taxed generated
returns at rate at rate returns at rate at rate returns at rate at rate
(29) (30) (31) (32) (33) (34) (35) (36) (37)
Total........................................................... 70,219 1,045,084 292,627 6,124,298 216,963,397 66,173,836 2,300,166 182,833,847 64,906,016
Under $2,000 ¹...................................................... -- -- -- -- -- -- -- -- -- $2,000 under $4,000......................................................-- -- -- -- -- -- -- -- -- $4,000 under $6,000......................................................-- -- -- -- -- -- -- -- -- $6,000 under $8,000......................................................-- -- -- -- -- -- -- -- --
$8,000 under $10,000......................................................-- -- -- -- -- -- -- -- --
$10,000 under $12,000......................................................-- -- -- -- -- -- -- -- -- $12,000 under $14,000......................................................-- -- -- -- -- -- -- -- --
$14,000 under $16,000......................................................-- -- -- -- -- -- -- -- -- $16,000 under $18,000......................................................-- -- -- -- -- -- -- -- -- $18,000 under $20,000......................................................-- -- -- -- -- -- -- -- --
$20,000 under $25,000......................................................-- -- -- -- -- -- -- -- -- $25,000 under $30,000......................................................-- -- -- -- -- -- -- -- -- $30,000 under $40,000......................................................-- -- -- -- -- -- -- -- -- $40,000 under $50,000......................................................*5,914 *969 *272 -- -- -- -- -- --
$50,000 under $75,000......................................................*11,617 *3,997 *1,120 41,574 98,631 30,082 -- -- --
$75,000 under $100,000......................................................15,567 13,927 3,901 800,289 7,453,272 2,273,248 6,184 18,254 6,480 $100,000 under $200,000......................................................27,746 74,692 20,915 2,896,349 76,175,712 23,233,592 211,564 3,516,237 1,248,264
$200,000 under $500,000......................................................6,584 71,143 19,920 1,875,493 103,824,987 31,666,621 1,584,109 114,716,505 40,724,359 $500,000 under $1,000,000......................................................958 44,960 12,589 331,900 19,104,164 5,826,770 323,068 41,771,919 14,829,031 $1,000,000 under $1,500,000......................................................690 123,837 34,674 79,889 4,608,118 1,405,476 78,092 10,144,734 3,601,381
$1,500,000 under $2,000,000......................................................293 53,963 15,110 33,774 1,946,389 593,649 33,106 4,323,581 1,534,871 $2,000,000 under $5,000,000......................................................555 297,122 83,194 48,031 2,773,029 845,774 47,214 6,151,168 2,183,665 $5,000,000 under $10,000,000......................................................161 184,911 51,775 11,117 641,290 195,593 10,982 1,429,944 507,630 $10,000,000 or more......................................................135 175,564 49,158 5,881 337,806 103,031 5,847 761,507 270,335
Footnotes at end of table.
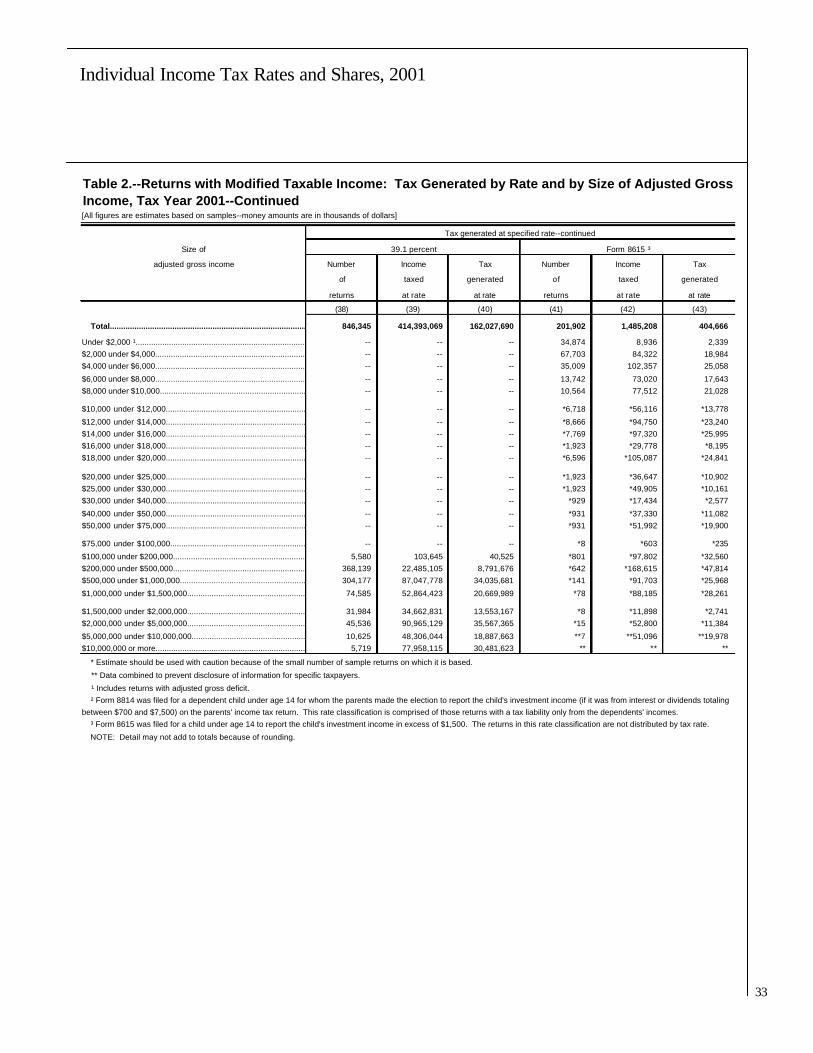
33
Individual Income Tax Rates and Shares, 2001
Table 2.--Returns with Modified Taxable Income: Tax Generated by Rate and by Size of Adjusted GrossIncome, Tax Year 2001--Continued[All figures are estimates based on samples--money amounts are in thousands of dollars]
Tax generated at specified rate--continued
Size of 39.1 percent Form 8615 ³
adjusted gross income Number Income Tax Number Income Tax
of taxed generated of taxed generated
returns at rate at rate returns at rate at rate
(38) (39) (40) (41) (42) (43)
Total..................................................................................................................846,345 414,393,069 162,027,690 201,902 1,485,208 404,666
Under $2,000 ¹..................................................................................................................-- -- -- 34,874 8,936 2,339 $2,000 under $4,000..................................................................................................................-- -- -- 67,703 84,322 18,984 $4,000 under $6,000..................................................................................................................-- -- -- 35,009 102,357 25,058
$6,000 under $8,000..................................................................................................................-- -- -- 13,742 73,020 17,643 $8,000 under $10,000..................................................................................................................-- -- -- 10,564 77,512 21,028
$10,000 under $12,000..................................................................................................................-- -- -- *6,718 *56,116 *13,778
$12,000 under $14,000..................................................................................................................-- -- -- *8,666 *94,750 *23,240 $14,000 under $16,000..................................................................................................................-- -- -- *7,769 *97,320 *25,995 $16,000 under $18,000..................................................................................................................-- -- -- *1,923 *29,778 *8,195 $18,000 under $20,000..................................................................................................................-- -- -- *6,596 *105,087 *24,841
$20,000 under $25,000..................................................................................................................-- -- -- *1,923 *36,647 *10,902 $25,000 under $30,000..................................................................................................................-- -- -- *1,923 *49,905 *10,161 $30,000 under $40,000..................................................................................................................-- -- -- *929 *17,434 *2,577
$40,000 under $50,000..................................................................................................................-- -- -- *931 *37,330 *11,082 $50,000 under $75,000..................................................................................................................-- -- -- *931 *51,992 *19,900
$75,000 under $100,000..................................................................................................................-- -- -- *8 *603 *235
$100,000 under $200,000..................................................................................................................5,580 103,645 40,525 *801 *97,802 *32,560 $200,000 under $500,000..................................................................................................................368,139 22,485,105 8,791,676 *642 *168,615 *47,814 $500,000 under $1,000,000..................................................................................................................304,177 87,047,778 34,035,681 *141 *91,703 *25,968
$1,000,000 under $1,500,000..................................................................................................................74,585 52,864,423 20,669,989 *78 *88,185 *28,261
$1,500,000 under $2,000,000..................................................................................................................31,984 34,662,831 13,553,167 *8 *11,898 *2,741 $2,000,000 under $5,000,000..................................................................................................................45,536 90,965,129 35,567,365 *15 *52,800 *11,384
$5,000,000 under $10,000,000..................................................................................................................10,625 48,306,044 18,887,663 **7 **51,096 **19,978 $10,000,000 or more..................................................................................................................5,719 77,958,115 30,481,623 ** ** **
* Estimate should be used with caution because of the small number of sample returns on which it is based.
** Data combined to prevent disclosure of information for specific taxpayers.
¹ Includes returns with adjusted gross deficit. ² Form 8814 was filed for a dependent child under age 14 for whom the parents made the election to report the child's investment income (if it was from interest or dividends totalingbetween $700 and $7,500) on the parents' income tax return. This rate classification is comprised of those returns with a tax liability only from the dependents' incomes. ³ Form 8615 was filed for a child under age 14 to report the child's investment income in excess of $1,500. The returns in this rate classification are not distributed by tax rate.
NOTE: Detail may not add to totals because of rounding.
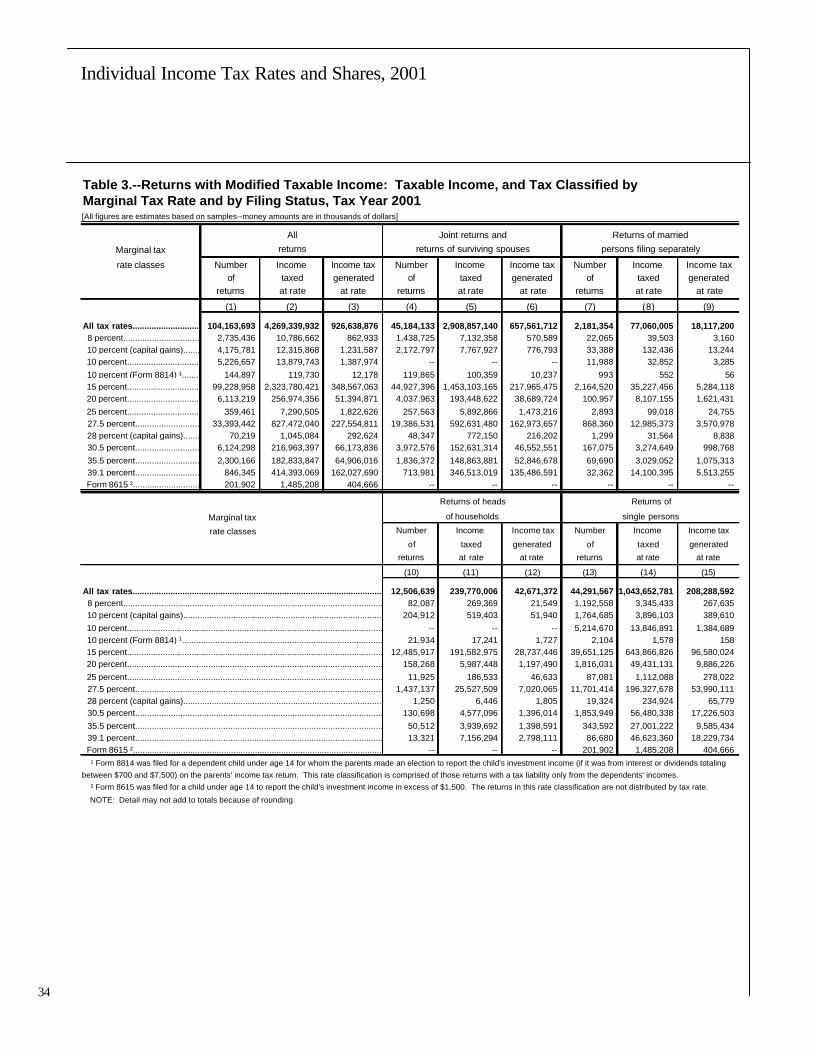
34
Individual Income Tax Rates and Shares, 2001
34
Table 3.--Returns with Modified Taxable Income: Taxable Income, and Tax Classified by Marginal Tax Rate and by Filing Status, Tax Year 2001[All figures are estimates based on samples--money amounts are in thousands of dollars]
All Joint returns and Returns of married
Marginal tax returns returns of surviving spouses persons filing separately
rate classes Number Income Income tax Number Income Income tax Number Income Income taxof taxed generated of taxed generated of taxed generated
returns at rate at rate returns at rate at rate returns at rate at rate
(1) (2) (3) (4) (5) (6) (7) (8) (9)
All tax rates.............................................................................................................................104,163,693 4,269,339,932 926,638,876 45,184,133 2,908,857,140 657,561,712 2,181,354 77,060,005 18,117,200 8 percent.............................................................................................................................2,735,436 10,786,662 862,933 1,438,725 7,132,358 570,589 22,065 39,503 3,160 10 percent (capital gains).............................................................................................................................4,175,781 12,315,868 1,231,587 2,172,797 7,767,927 776,793 33,388 132,436 13,244 10 percent.............................................................................................................................5,226,657 13,879,743 1,387,974 -- -- -- 11,988 32,852 3,285 10 percent (Form 8814) ¹.............................................................................................................................144,897 119,730 12,178 119,865 100,359 10,237 993 552 56 15 percent.............................................................................................................................99,228,958 2,323,780,421 348,567,063 44,927,396 1,453,103,165 217,965,475 2,164,520 35,227,456 5,284,118 20 percent.............................................................................................................................6,113,219 256,974,356 51,394,871 4,037,963 193,448,622 38,689,724 100,957 8,107,155 1,621,431 25 percent.............................................................................................................................359,461 7,290,505 1,822,626 257,563 5,892,866 1,473,216 2,893 99,018 24,755 27.5 percent.............................................................................................................................33,393,442 827,472,040 227,554,811 19,386,531 592,631,480 162,973,657 868,360 12,985,373 3,570,978 28 percent (capital gains).............................................................................................................................70,219 1,045,084 292,624 48,347 772,150 216,202 1,299 31,564 8,838 30.5 percent.............................................................................................................................6,124,298 216,963,397 66,173,836 3,972,576 152,631,314 46,552,551 167,075 3,274,649 998,768 35.5 percent.............................................................................................................................2,300,166 182,833,847 64,906,016 1,836,372 148,863,881 52,846,678 69,690 3,029,052 1,075,313 39.1 percent.............................................................................................................................846,345 414,393,069 162,027,690 713,981 346,513,019 135,486,591 32,362 14,100,395 5,513,255 Form 8615 ².............................................................................................................................201,902 1,485,208 404,666 -- -- -- -- -- --
Returns of heads Returns of
Marginal tax of households single persons
rate classes Number Income Income tax Number Income Income tax
of taxed generated of taxed generatedreturns at rate at rate returns at rate at rate
(10) (11) (12) (13) (14) (15)
All tax rates.............................................................................................................................12,506,639 239,770,006 42,671,372 44,291,567 1,043,652,781 208,288,592 8 percent.............................................................................................................................82,087 269,369 21,549 1,192,558 3,345,433 267,635 10 percent (capital gains).............................................................................................................................204,912 519,403 51,940 1,764,685 3,896,103 389,610 10 percent............................................................................................................................. -- -- -- 5,214,670 13,846,891 1,384,689 10 percent (Form 8814) ¹.............................................................................................................................21,934 17,241 1,727 2,104 1,578 158 15 percent.............................................................................................................................12,485,917 191,582,975 28,737,446 39,651,125 643,866,826 96,580,024 20 percent.............................................................................................................................158,268 5,987,448 1,197,490 1,816,031 49,431,131 9,886,226 25 percent.............................................................................................................................11,925 186,533 46,633 87,081 1,112,088 278,022 27.5 percent.............................................................................................................................1,437,137 25,527,509 7,020,065 11,701,414 196,327,678 53,990,111 28 percent (capital gains).............................................................................................................................1,250 6,446 1,805 19,324 234,924 65,779 30.5 percent.............................................................................................................................130,698 4,577,096 1,396,014 1,853,949 56,480,338 17,226,503 35.5 percent.............................................................................................................................50,512 3,939,692 1,398,591 343,592 27,001,222 9,585,434 39.1 percent.............................................................................................................................13,321 7,156,294 2,798,111 86,680 46,623,360 18,229,734 Form 8615 ².............................................................................................................................-- -- -- 201,902 1,485,208 404,666 ¹ Form 8814 was filed for a dependent child under age 14 for whom the parents made an election to report the child's investment income (if it was from interest or dividends totaling between $700 and $7,500) on the parents' income tax return. This rate classification is comprised of those returns with a tax liability only from the dependents' incomes. ² Form 8615 was filed for a child under age 14 to report the child's investment income in excess of $1,500. The returns in this rate classification are not distributed by tax rate.
NOTE: Detail may not add to totals because of rounding.

35
Individual Income Tax Rates and Shares, 2001
Table 4.--Returns with Modified Taxable Income: Tax Classified by Type of Tax Computation and by Size of Adjusted Gross Income, Tax Years 2000 and 2001[All figures are estimates based on samples--money amounts are in thousands of dollars]
Tax Year 2000 Tax Year 2001
Type of tax computation Income tax before credits Tax Difference Income tax before credits Tax Difference
by size of (regular tax computation) ¹ generated due to (regular tax computation)¹ generated due toadjusted gross income Number of special tax Number of special tax
returns computation ² returns computation ²
(1) (2) (3) (4) (5) (6) (7) (8)
Returns with regular taxcomputation only
Total..............................................................................86,253,365 551,085,194 550,958,257 -- 93,152,594 671,189,255 671,077,406 -- Under $5,000 ³..............................................................................1,078,806 95,867 95,867 -- 1,215,336 76,202 76,690 -- $5,000 under $10,000..............................................................................5,376,121 1,572,648 1,572,648 -- 5,189,271 1,131,398 1,132,780 -- $10,000 under $15,000..............................................................................7,575,796 5,221,615 5,221,108 -- 7,236,117 4,683,435 4,683,439 -- $15,000 under $20,000..............................................................................9,835,992 10,481,502 10,481,502 -- 9,522,535 9,914,889 9,915,938 -- $20,000 under $25,000..............................................................................8,836,069 14,929,470 14,928,791 -- 9,011,201 14,571,046 14,572,908 -- $25,000 under $30,000..............................................................................7,503,322 17,441,990 17,441,823 -- 7,898,393 17,957,705 17,957,002 -- $30,000 under $40,000..............................................................................11,885,936 39,381,033 39,380,171 -- 12,676,957 40,804,023 40,804,153 -- $40,000 under $50,000..............................................................................8,838,458 42,319,879 42,314,453 -- 9,575,407 44,816,573 44,817,422 -- $50,000 under $75,000..............................................................................13,469,310 96,554,724 96,536,715 -- 15,430,947 108,348,416 108,336,649 -- $75,000 under $100,000..............................................................................6,080,232 72,951,937 72,929,417 -- 7,440,554 86,777,825 86,766,038 -- $100,000 under $200,000..............................................................................4,703,933 105,422,834 105,393,439 -- 6,400,614 139,588,296 139,560,574 -- $200,000 under $500,000..............................................................................877,224 61,161,992 61,139,844 -- 1,265,642 85,780,631 85,744,602 -- $500,000 under $1,000,000..............................................................................131,522 27,443,320 27,433,567 -- 199,530 40,757,089 40,737,622 -- $1,000,000 under $1,500,000..............................................................................27,993 11,336,138 11,332,472 -- 43,536 17,074,614 17,072,667 -- $1,500,000 under $2,000,000..............................................................................11,685 6,889,909 6,888,105 -- 17,072 9,774,976 9,770,655 -- $2,000,000 under $5,000,000..............................................................................15,735 16,419,725 16,412,973 -- 22,648 22,802,314 22,799,337 -- $5,000,000 under $10,000,000..............................................................................3,526 8,550,170 8,548,971 -- 4,755 11,140,719 11,139,824 -- $10,000,000 or more..............................................................................1,704 12,910,441 12,906,392 -- 2,079 15,189,105 15,189,105 --
Returns with Form 8615tax computation
Total..............................................................................545,600 1,037,678 1,138,311 100,633 201,902 320,206 418,758 98,551 Under $5,000 ³..............................................................................315,664 97,763 130,992 33,229 127,771 25,420 46,783 21,362 $5,000 under $10,000..............................................................................132,892 122,066 187,459 65,392 34,121 22,383 50,143 27,760 $10,000 under $15,000..............................................................................36,860 65,912 100,217 34,305 20,214 27,024 52,428 25,405 $15,000 under $20,000..............................................................................20,219 48,411 72,102 23,691 11,458 23,866 45,513 21,648 $20,000 under $25,000..............................................................................9,517 30,035 54,409 24,374 *1,923 *5,025 *10,974 *5,949 $25,000 under $30,000..............................................................................*9,602 *36,409 *55,511 *19,102 *1,923 *7,325 *10,291 *2,966 $30,000 under $40,000..............................................................................*8,501 *47,765 *63,699 *15,935 *929 *2,338 *2,577 *240 $40,000 under $50,000..............................................................................*1,850 *16,747 *22,133 *5,385 *931 *7,025 *11,138 *4,113 $50,000 under $75,000..............................................................................*5,485 *59,777 *61,873 *2,096 *931 *10,967 *19,934 *8,967 $75,000 under $100,000..............................................................................*1,341 *22,214 *22,027 *-187 *8 *138 *235 *98 $100,000 under $200,000..............................................................................*2,330 *68,628 *73,398 *4,770 *801 *25,824 *32,563 *6,739 $200,000 under $500,000..............................................................................*722 *67,214 *50,822 *-16,392 *642 *52,943 *47,814 *-5,130 $500,000 under $1,000,000..............................................................................*358 *75,510 *65,694 *-9,815 *141 *32,600 *25,971 *-6,629 $1,000,000 under $1,500,000..............................................................................122 52,312 33,308 -19,004 *78 *32,765 *28,290 *-4,475 $1,500,000 under $2,000,000..............................................................................*49 *29,600 *20,083 *-9,518 *8 *4,463 *2,741 *-1,722 $2,000,000 under $5,000,000..............................................................................64 67,628 45,092 -22,536 *15 *20,286 *11,384 *-8,901 $5,000,000 under $10,000,000..............................................................................*13 *35,260 *30,116 *-5,143 **7 **19,816 **19,978 **163 $10,000,000 or more..............................................................................*9 *94,426 *49,376 *-45,051 ** ** ** **
Footnotes at end of table.
Amount Amount Amount Amount
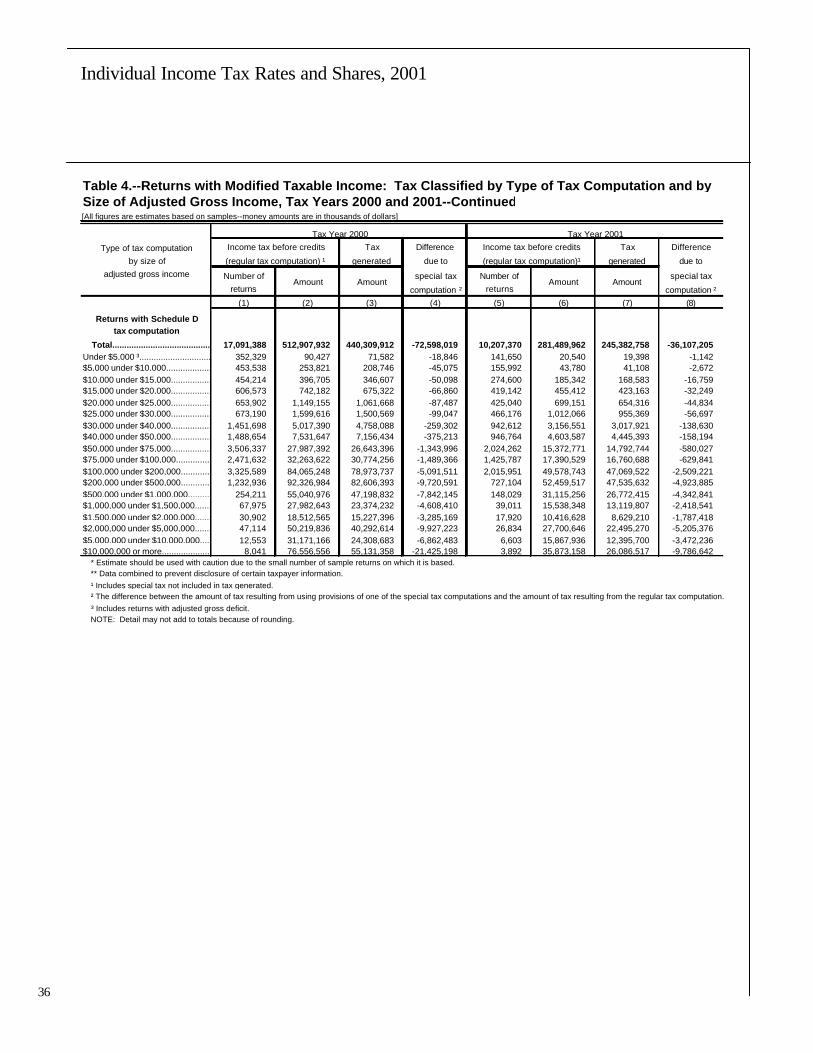
36
Individual Income Tax Rates and Shares, 2001
36
Table 4.--Returns with Modified Taxable Income: Tax Classified by Type of Tax Computation and by Size of Adjusted Gross Income, Tax Years 2000 and 2001--Continued[All figures are estimates based on samples--money amounts are in thousands of dollars]
Tax Year 2000 Tax Year 2001
Type of tax computation Income tax before credits Tax Difference Income tax before credits Tax Difference
by size of (regular tax computation) ¹ generated due to (regular tax computation)¹ generated due toadjusted gross income Number of special tax Number of special tax
returns computation ² returns computation ²(1) (2) (3) (4) (5) (6) (7) (8)
Returns with Schedule Dtax computation
Total..............................................................................17,091,388 512,907,932 440,309,912 -72,598,019 10,207,370 281,489,962 245,382,758 -36,107,205 Under $5,000 ³..............................................................................352,329 90,427 71,582 -18,846 141,650 20,540 19,398 -1,142 $5,000 under $10,000..............................................................................453,538 253,821 208,746 -45,075 155,992 43,780 41,108 -2,672 $10,000 under $15,000..............................................................................454,214 396,705 346,607 -50,098 274,600 185,342 168,583 -16,759 $15,000 under $20,000..............................................................................606,573 742,182 675,322 -66,860 419,142 455,412 423,163 -32,249 $20,000 under $25,000..............................................................................653,902 1,149,155 1,061,668 -87,487 425,040 699,151 654,316 -44,834 $25,000 under $30,000..............................................................................673,190 1,599,616 1,500,569 -99,047 466,176 1,012,066 955,369 -56,697 $30,000 under $40,000..............................................................................1,451,698 5,017,390 4,758,088 -259,302 942,612 3,156,551 3,017,921 -138,630 $40,000 under $50,000..............................................................................1,488,654 7,531,647 7,156,434 -375,213 946,764 4,603,587 4,445,393 -158,194 $50,000 under $75,000..............................................................................3,506,337 27,987,392 26,643,396 -1,343,996 2,024,262 15,372,771 14,792,744 -580,027 $75,000 under $100,000..............................................................................2,471,632 32,263,622 30,774,256 -1,489,366 1,425,787 17,390,529 16,760,688 -629,841 $100,000 under $200,000..............................................................................3,325,589 84,065,248 78,973,737 -5,091,511 2,015,951 49,578,743 47,069,522 -2,509,221 $200,000 under $500,000..............................................................................1,232,936 92,326,984 82,606,393 -9,720,591 727,104 52,459,517 47,535,632 -4,923,885 $500,000 under $1,000,000..............................................................................254,211 55,040,976 47,198,832 -7,842,145 148,029 31,115,256 26,772,415 -4,342,841 $1,000,000 under $1,500,000..............................................................................67,975 27,982,643 23,374,232 -4,608,410 39,011 15,538,348 13,119,807 -2,418,541 $1,500,000 under $2,000,000..............................................................................30,902 18,512,565 15,227,396 -3,285,169 17,920 10,416,628 8,629,210 -1,787,418 $2,000,000 under $5,000,000..............................................................................47,114 50,219,836 40,292,614 -9,927,223 26,834 27,700,646 22,495,270 -5,205,376 $5,000,000 under $10,000,000..............................................................................12,553 31,171,166 24,308,683 -6,862,483 6,603 15,867,936 12,395,700 -3,472,236 $10,000,000 or more..............................................................................8,041 76,556,556 55,131,358 -21,425,198 3,892 35,873,158 26,086,517 -9,786,642 * Estimate should be used with caution due to the small number of sample returns on which it is based. ** Data combined to prevent disclosure of certain taxpayer information. ¹ Includes special tax not included in tax generated. ² The difference between the amount of tax resulting from using provisions of one of the special tax computations and the amount of tax resulting from the regular tax computation. ³ Includes returns with adjusted gross deficit. NOTE: Detail may not add to totals because of rounding.
Amount Amount Amount Amount

37
Individual Income Tax Rates and Shares, 2001
Table 5.--Returns with Positive Adjusted Gross Income (AGI): Number of Returns, Shares of AGI andTotal Income Tax, AGI Floor on Percentiles in Current and Constant Dollars, and Average Tax Rates, bySelected Descending Cumulative Percentiles of Returns Based on Income Size Using the Definition ofAGI for Each Year, Tax Years 1986-2001[All figures are estimates based on samples]
Descending cumulative percentiles
Item, tax year Total Top Top Top Top Top
1 percent 5 percent 10 percent 25 percent 50 percent
(1) (2) (3) (4) (5) (6)Number of returns: ¹
1986...........................................................................................102,087,623 1,020,876 5,104,381 10,208,762 25,521,906 51,043,811
1987...........................................................................................106,154,761 1,061,548 5,307,738 10,615,476 26,538,690 53,077,380 1988...........................................................................................108,872,859 1,088,729 5,443,643 10,887,286 27,218,214 54,436,429
1989...........................................................................................111,312,721 1,113,127 5,565,636 11,131,272 27,828,181 55,656,361
1990...........................................................................................112,812,262 1,128,123 5,640,613 11,281,226 28,203,066 56,406,132
1991...........................................................................................113,804,104 1,138,041 5,690,205 11,380,410 28,451,026 56,902,052
1992...........................................................................................112,652,759 1,126,528 5,632,638 11,265,276 28,163,190 56,326,380 1993...........................................................................................113,681,387 1,136,814 5,684,069 11,368,139 28,420,347 56,840,694
1994...........................................................................................114,989,920 1,149,899 5,749,496 11,498,992 28,747,480 57,494,960
1995...........................................................................................117,274,186 1,172,742 5,863,709 11,727,419 29,318,546 58,637,093
1996...........................................................................................119,441,767 1,194,418 5,972,088 11,944,177 29,860,442 59,720,884
1997...........................................................................................121,503,284 1,215,033 6,075,164 12,150,328 30,375,821 60,751,642
1998...........................................................................................123,775,831 1,237,758 6,188,792 12,377,583 30,943,958 61,887,915
1999...........................................................................................126,008,974 1,260,090 6,300,449 12,600,897 31,502,244 63,004,487
2000...........................................................................................128,227,143 1,282,271 6,411,357 12,822,714 32,056,786 64,113,572
2001...........................................................................................128,817,051 1,288,171 6,440,853 12,881,705 32,204,263 64,408,526 Adjusted gross income floor on percentiles (current dollars):
1986........................................................................................... N/A 118,818 62,377 48,656 32,242 17,302
1987........................................................................................... N/A 139,289 68,414 52,921 33,983 17,768
1988........................................................................................... N/A 157,136 72,735 55,437 35,398 18,367
1989........................................................................................... N/A 163,869 76,933 58,263 36,839 18,993
1990........................................................................................... N/A 167,421 79,064 60,287 38,080 19,767
1991........................................................................................... N/A 170,139 81,720 61,944 38,929 20,097
1992........................................................................................... N/A 181,904 85,103 64,457 40,378 20,803
1993........................................................................................... N/A 185,715 87,386 66,077 41,210 21,179
1994........................................................................................... N/A 195,726 91,226 68,753 42,742 21,802
1995........................................................................................... N/A 209,406 96,221 72,094 44,207 22,344
1996........................................................................................... N/A 227,546 101,141 74,986 45,757 23,174 1997........................................................................................... N/A 250,736 108,048 79,212 48,173 24,393
1998........................................................................................... N/A 269,496 114,729 83,220 50,607 25,491
1999........................................................................................... N/A 293,415 120,846 87,682 52,965 26,415
2000........................................................................................... N/A 313,469 128,336 92,144 55,225 27,682
2001........................................................................................... N/A 292,913 127,904 92,754 56,085 28,528 Adjusted gross income floor on percentiles (constant dollars):
1986........................................................................................... N/A 108,411 56,913 44,394 29,418 15,786
1987........................................................................................... N/A 122,614 60,224 46,585 29,915 15,641
1988........................................................................................... N/A 132,828 61,484 46,861 29,922 15,526
1989........................................................................................... N/A 132,152 62,043 46,986 29,709 15,317
1990........................................................................................... N/A 128,096 60,493 46,126 29,135 15,124
1991........................................................................................... N/A 124,919 60,000 45,480 28,582 14,756
1992........................................................................................... N/A 129,654 60,658 45,942 28,780 14,828
1993........................................................................................... N/A 128,522 60,475 45,728 28,519 14,657
1994........................................................................................... N/A 132,069 61,556 46,392 28,841 14,711
1995........................................................................................... N/A 137,406 63,137 47,306 29,007 14,661
1996........................................................................................... N/A 145,026 64,462 47,792 29,163 14,769
1997........................................................................................... N/A 156,222 67,320 49,353 30,014 15,198
1998........................................................................................... N/A 164,427 69,999 50,775 30,877 15,553
1999........................................................................................... N/A 176,119 72,537 52,630 31,792 15,855
2000........................................................................................... N/A 182,038 74,527 53,510 32,070 16,075 2001........................................................................................... N/A 165,394 72,221 52,374 31,669 16,108
Footnotes at end of Table 6.

38
Individual Income Tax Rates and Shares, 2001
38
Table 5.--Returns with Positive Adjusted Gross Income (AGI): Number of Returns, Shares of AGI andTotal Income Tax, AGI Floor on Percentiles in Current and Constant Dollars, and Average Tax Rates, bySelected Descending Cumulative Percentiles of Returns Based on Income Size Using the Definition ofAGI for Each Year, Tax Years 1986-2001--Continued[All figures are estimates based on samples]
Descending cumulative percentiles
Item, tax year Total Top Top Top Top Top
1 percent 5 percent 10 percent 25 percent 50 percent
(1) (2) (3) (4) (5) (6)
Adjusted gross income (millions of dollars):
1986...........................................................................................2,524,124 285,197 608,467 886,510 1,490,173 2,103,569 1987...........................................................................................2,813,728 346,635 722,221 1,038,221 1,709,389 2,373,869 1988...........................................................................................3,124,156 473,527 890,702 1,232,536 1,950,860 2,657,865 1989...........................................................................................3,298,858 468,079 918,421 1,286,539 2,054,478 2,805,235
1990...........................................................................................3,451,237 483,252 953,337 1,338,032 2,144,177 2,932,537 1991...........................................................................................3,516,142 456,603 943,350 1,343,202 2,174,765 2,984,003 1992...........................................................................................3,680,552 523,586 1,031,093 1,443,784 2,299,401 3,131,400 1993...........................................................................................3,775,578 520,586 1,048,252 1,474,463 2,357,953 3,212,299 1994...........................................................................................3,961,146 546,700 1,103,084 1,552,205 2,481,074 3,371,352 1995...........................................................................................4,244,607 619,610 1,222,723 1,704,513 2,689,820 3,627,542 1996...........................................................................................4,590,527 736,545 1,393,805 1,909,149 2,952,637 3,944,383 1997...........................................................................................5,023,457 872,826 1,597,107 2,151,401 3,267,600 4,327,992 1998...........................................................................................5,469,211 1,010,245 1,796,647 2,393,716 3,589,600 4,721,430 1999...........................................................................................5,909,329 1,152,820 2,011,763 2,652,835 3,927,308 5,126,164 2000...........................................................................................6,423,977 1,336,773 2,267,403 2,955,386 4,313,786 5,589,755 2001...........................................................................................6,241,036 1,094,296 1,996,492 2,690,589 4,071,034 5,379,286
Total income tax (millions of dollars): ² 1986...........................................................................................366,979 94,491 156,240 200,703 278,976 343,289 1987...........................................................................................369,046 91,559 159,642 205,230 283,857 346,655 1988...........................................................................................412,761 113,841 188,303 236,411 321,297 389,145 1989...........................................................................................432,838 109,259 190,188 241,458 334,258 407,599 1990...........................................................................................447,061 112,338 195,088 247,514 344,340 421,075 1991...........................................................................................448,349 111,267 194,480 250,282 346,511 423,759 1992...........................................................................................476,163 131,156 218,479 276,213 373,700 452,070 1993...........................................................................................502,720 145,836 238,083 297,808 398,516 478,563 1994...........................................................................................534,754 154,337 254,106 317,902 425,402 509,256 1995...........................................................................................588,331 178,035 287,741 357,402 472,808 561,225 1996...........................................................................................658,124 212,626 335,433 411,404 535,164 629,684 1997...........................................................................................727,303 241,239 377,241 459,639 594,007 696,161 1998...........................................................................................788,452 274,009 424,506 512,836 651,964 755,240 1999...........................................................................................877,292 317,419 486,464 583,002 732,890 842,168 2000...........................................................................................980,521 366,929 553,670 660,150 823,706 942,179 2001...........................................................................................887,882 300,898 472,823 576,163 736,053 852,642
Average tax rate (percentage): ³
1986........................................................................................... 14.54 33.13 25.68 22.64 18.72 16.32 1987........................................................................................... 13.12 26.41 22.10 19.77 16.61 14.60 1988........................................................................................... 13.21 24.04 21.14 19.18 16.47 14.64 1989........................................................................................... 13.12 23.34 20.71 18.77 16.27 14.53 1990........................................................................................... 12.95 23.25 20.46 18.50 16.06 14.36 1991........................................................................................... 12.75 24.37 20.62 18.63 15.93 14.20 1992........................................................................................... 12.94 25.05 21.19 19.13 16.25 14.44 1993........................................................................................... 13.32 28.01 22.71 20.20 16.90 14.90 1994........................................................................................... 13.50 28.23 23.04 20.48 17.15 15.11 1995........................................................................................... 13.86 28.73 23.53 20.97 17.58 15.47 1996........................................................................................... 14.34 28.87 24.07 21.55 18.12 15.96 1997........................................................................................... 14.48 27.64 23.62 21.36 18.18 16.09 1998........................................................................................... 14.42 27.12 23.63 21.42 18.16 16.00 1999........................................................................................... 14.85 27.53 24.18 21.98 18.66 16.43 2000........................................................................................... 15.26 27.45 24.42 22.34 19.09 16.86 2001........................................................................................... 14.23 27.50 23.68 21.41 18.08 15.85
Footnotes at end of Table 6.

39
Individual Income Tax Rates and Shares, 2001
Table 5.--Returns with Positive Adjusted Gross Income (AGI): Number of Returns, Shares of AGI andTotal Income Tax, AGI Floor on Percentiles in Current and Constant Dollars, and Average Tax Rates, bySelected Descending Cumulative Percentiles of Returns Based on Income Size Using the Definition ofAGI for Each Year, Tax Years 1986-2001--Continued[All figures are estimates based on samples]
Descending cumulative percentiles
Item, tax year Total Top Top Top Top Top
1 percent 5 percent 10 percent 25 percent 50 percent
(1) (2) (3) (4) (5) (6)
Adjusted gross income share (percentage):
1986........................................................................................... 100.00 11.30 24.11 35.12 59.04 83.34 1987........................................................................................... 100.00 12.32 25.67 36.90 60.75 84.37 1988........................................................................................... 100.00 15.16 28.51 39.45 62.44 85.07 1989........................................................................................... 100.00 14.19 27.84 39.00 62.28 85.04 1990........................................................................................... 100.00 14.00 27.62 38.77 62.13 84.97 1991........................................................................................... 100.00 12.99 26.83 38.20 61.85 84.87 1992........................................................................................... 100.00 14.23 28.01 39.23 62.47 85.08 1993........................................................................................... 100.00 13.79 27.76 39.05 62.45 85.08 1994........................................................................................... 100.00 13.80 27.85 39.19 62.64 85.11 1995........................................................................................... 100.00 14.60 28.81 40.16 63.37 85.46 1996........................................................................................... 100.00 16.04 30.36 41.59 64.32 85.92 1997........................................................................................... 100.00 17.38 31.79 42.83 65.05 86.16 1998........................................................................................... 100.00 18.47 32.85 43.77 65.63 86.33 1999........................................................................................... 100.00 19.51 34.04 44.89 66.46 86.75 2000........................................................................................... 100.00 20.81 35.30 46.01 67.15 87.01 2001........................................................................................... 100.00 17.53 31.99 43.11 65.23 86.19
Total income tax share (percentage):
1986........................................................................................... 100.00 25.75 42.57 54.69 76.02 93.54 1987........................................................................................... 100.00 24.81 43.26 55.61 76.92 93.93 1988........................................................................................... 100.00 27.58 45.62 57.28 77.84 94.28 1989........................................................................................... 100.00 25.24 43.94 55.78 77.22 94.17 1990........................................................................................... 100.00 25.13 43.64 55.36 77.02 94.19 1991........................................................................................... 100.00 24.82 43.38 55.82 77.29 94.52 1992........................................................................................... 100.00 27.54 45.88 58.01 78.48 94.94 1993........................................................................................... 100.00 29.01 47.36 59.24 79.27 95.19 1994........................................................................................... 100.00 28.86 47.52 59.45 79.55 95.23 1995........................................................................................... 100.00 30.26 48.91 60.75 80.36 95.39 1996........................................................................................... 100.00 32.31 50.97 62.51 81.32 95.68 1997........................................................................................... 100.00 33.17 51.87 63.20 81.67 95.72 1998........................................................................................... 100.00 34.75 53.84 65.04 82.69 95.79 1999........................................................................................... 100.00 36.18 55.45 66.45 83.54 96.00 2000........................................................................................... 100.00 37.42 56.47 67.33 84.01 96.09 2001........................................................................................... 100.00 33.89 53.25 64.89 82.90 96.03 Footnotes at end of Table 6.
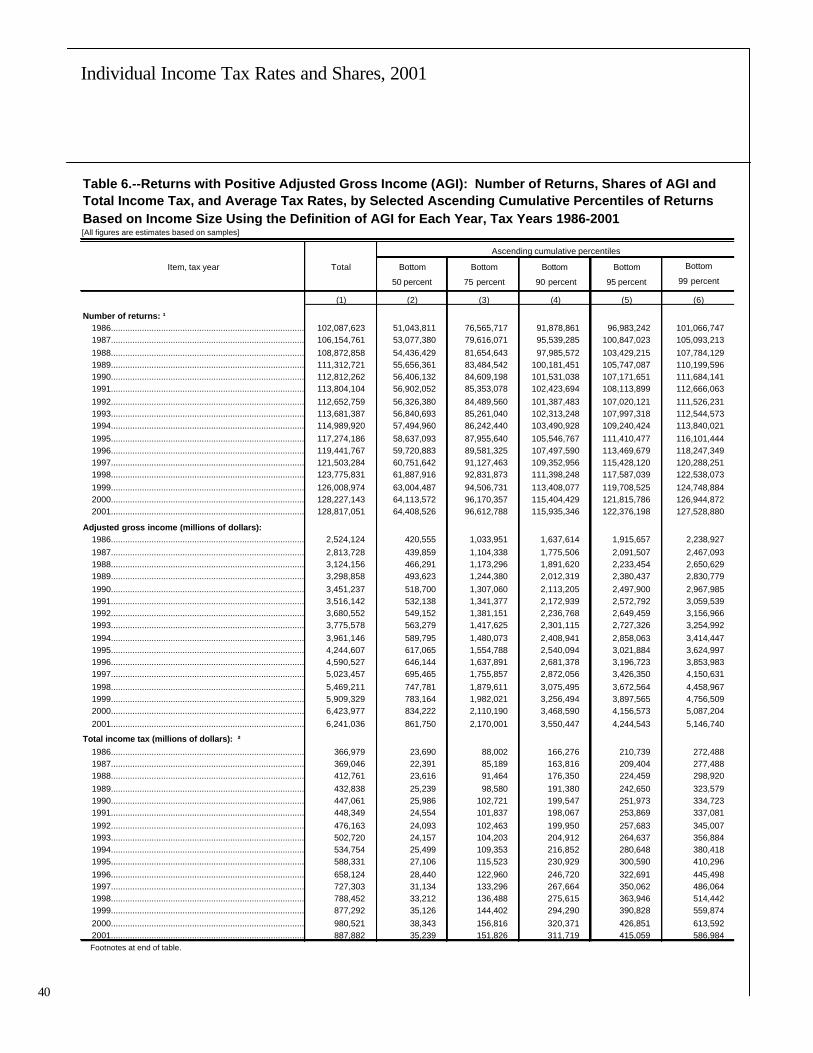
40
Individual Income Tax Rates and Shares, 2001
40
Table 6.--Returns with Positive Adjusted Gross Income (AGI): Number of Returns, Shares of AGI andTotal Income Tax, and Average Tax Rates, by Selected Ascending Cumulative Percentiles of Returns Based on Income Size Using the Definition of AGI for Each Year, Tax Years 1986-2001[All figures are estimates based on samples]
Ascending cumulative percentiles
Item, tax year Total Bottom Bottom Bottom Bottom Bottom
50 percent 75 percent 90 percent 95 percent 99 percent
(1) (2) (3) (4) (5) (6)
Number of returns: ¹ 1986...........................................................................................................102,087,623 51,043,811 76,565,717 91,878,861 96,983,242 101,066,747 1987...........................................................................................................106,154,761 53,077,380 79,616,071 95,539,285 100,847,023 105,093,213 1988...........................................................................................................108,872,858 54,436,429 81,654,643 97,985,572 103,429,215 107,784,129 1989...........................................................................................................111,312,721 55,656,361 83,484,542 100,181,451 105,747,087 110,199,596 1990...........................................................................................................112,812,262 56,406,132 84,609,198 101,531,038 107,171,651 111,684,141 1991...........................................................................................................113,804,104 56,902,052 85,353,078 102,423,694 108,113,899 112,666,063 1992...........................................................................................................112,652,759 56,326,380 84,489,560 101,387,483 107,020,121 111,526,231 1993...........................................................................................................113,681,387 56,840,693 85,261,040 102,313,248 107,997,318 112,544,573 1994...........................................................................................................114,989,920 57,494,960 86,242,440 103,490,928 109,240,424 113,840,021 1995...........................................................................................................117,274,186 58,637,093 87,955,640 105,546,767 111,410,477 116,101,444 1996...........................................................................................................119,441,767 59,720,883 89,581,325 107,497,590 113,469,679 118,247,349 1997...........................................................................................................121,503,284 60,751,642 91,127,463 109,352,956 115,428,120 120,288,251 1998...........................................................................................................123,775,831 61,887,916 92,831,873 111,398,248 117,587,039 122,538,073 1999...........................................................................................................126,008,974 63,004,487 94,506,731 113,408,077 119,708,525 124,748,884 2000...........................................................................................................128,227,143 64,113,572 96,170,357 115,404,429 121,815,786 126,944,872 2001...........................................................................................................128,817,051 64,408,526 96,612,788 115,935,346 122,376,198 127,528,880
Adjusted gross income (millions of dollars): 1986...........................................................................................................2,524,124 420,555 1,033,951 1,637,614 1,915,657 2,238,927 1987...........................................................................................................2,813,728 439,859 1,104,338 1,775,506 2,091,507 2,467,093 1988...........................................................................................................3,124,156 466,291 1,173,296 1,891,620 2,233,454 2,650,629 1989...........................................................................................................3,298,858 493,623 1,244,380 2,012,319 2,380,437 2,830,779 1990...........................................................................................................3,451,237 518,700 1,307,060 2,113,205 2,497,900 2,967,985 1991...........................................................................................................3,516,142 532,138 1,341,377 2,172,939 2,572,792 3,059,539 1992...........................................................................................................3,680,552 549,152 1,381,151 2,236,768 2,649,459 3,156,966 1993...........................................................................................................3,775,578 563,279 1,417,625 2,301,115 2,727,326 3,254,992 1994...........................................................................................................3,961,146 589,795 1,480,073 2,408,941 2,858,063 3,414,447 1995...........................................................................................................4,244,607 617,065 1,554,788 2,540,094 3,021,884 3,624,997 1996...........................................................................................................4,590,527 646,144 1,637,891 2,681,378 3,196,723 3,853,983 1997...........................................................................................................5,023,457 695,465 1,755,857 2,872,056 3,426,350 4,150,631 1998...........................................................................................................5,469,211 747,781 1,879,611 3,075,495 3,672,564 4,458,967 1999...........................................................................................................5,909,329 783,164 1,982,021 3,256,494 3,897,565 4,756,509 2000...........................................................................................................6,423,977 834,222 2,110,190 3,468,590 4,156,573 5,087,204 2001...........................................................................................................6,241,036 861,750 2,170,001 3,550,447 4,244,543 5,146,740
Total income tax (millions of dollars): ² 1986...........................................................................................................366,979 23,690 88,002 166,276 210,739 272,488 1987...........................................................................................................369,046 22,391 85,189 163,816 209,404 277,488 1988...........................................................................................................412,761 23,616 91,464 176,350 224,459 298,920 1989...........................................................................................................432,838 25,239 98,580 191,380 242,650 323,579 1990...........................................................................................................447,061 25,986 102,721 199,547 251,973 334,723 1991...........................................................................................................448,349 24,554 101,837 198,067 253,869 337,081 1992...........................................................................................................476,163 24,093 102,463 199,950 257,683 345,007 1993...........................................................................................................502,720 24,157 104,203 204,912 264,637 356,884 1994...........................................................................................................534,754 25,499 109,353 216,852 280,648 380,418 1995...........................................................................................................588,331 27,106 115,523 230,929 300,590 410,296 1996...........................................................................................................658,124 28,440 122,960 246,720 322,691 445,498 1997...........................................................................................................727,303 31,134 133,296 267,664 350,062 486,064 1998...........................................................................................................788,452 33,212 136,488 275,615 363,946 514,442 1999...........................................................................................................877,292 35,126 144,402 294,290 390,828 559,874 2000...........................................................................................................980,521 38,343 156,816 320,371 426,851 613,592 2001...........................................................................................................887,882 35,239 151,826 311,719 415,059 586,984 Footnotes at end of table.

41
Individual Income Tax Rates and Shares, 2001
Table 6.--Returns with Positive Adjusted Gross Income (AGI): Number of Returns, Shares of AGI andTotal Income Tax, and Average Tax Rates, by Selected Ascending Cumulative Percentiles of Returns Based on Income Size Using the Definition of AGI for Each Year, Tax Years 1986-2001--Continued[All figures are estimates based on samples]
Ascending cumulative percentiles
Item, tax year Total Bottom Bottom Bottom Bottom Bottom
50 percent 75 percent 90 percent 95 percent 99 percent
(1) (2) (3) (4) (5) (6)Average tax rate (percentage): ³ 1986...........................................................................................................14.54 5.63 8.51 10.15 11.00 12.17 1987...........................................................................................................13.12 5.09 7.71 9.23 10.01 11.25 1988...........................................................................................................13.21 5.06 7.80 9.32 10.05 11.28 1989...........................................................................................................13.12 5.11 7.92 9.51 10.19 11.43 1990...........................................................................................................12.95 5.01 7.86 9.44 10.09 11.28
1991...........................................................................................................12.75 4.61 7.59 9.12 9.87 11.04 1992...........................................................................................................12.94 4.39 7.42 8.94 9.73 10.93 1993...........................................................................................................13.32 4.29 7.35 8.90 9.70 10.96 1994...........................................................................................................13.50 4.32 7.39 9.00 9.82 11.14 1995...........................................................................................................13.86 4.39 7.43 9.09 9.95 11.32 1996...........................................................................................................14.34 4.40 7.51 9.20 10.09 11.56 1997...........................................................................................................14.48 4.48 7.59 9.32 10.22 11.71 1998...........................................................................................................14.42 4.44 7.26 8.96 9.91 11.54 1999...........................................................................................................14.85 4.49 7.29 9.04 10.03 11.77 2000...........................................................................................................15.26 4.60 7.43 9.24 10.27 12.06 2001...........................................................................................................14.23 4.09 7.00 8.78 9.78 11.41
Adjusted gross income share (percentage):
1986...........................................................................................................100.00 16.66 40.96 64.88 75.89 88.70 1987...........................................................................................................100.00 15.63 39.25 63.10 74.33 87.68 1988...........................................................................................................100.00 14.93 37.56 60.55 71.49 84.84 1989...........................................................................................................100.00 14.96 37.72 61.00 72.16 85.81 1990...........................................................................................................100.00 15.03 37.87 61.23 72.38 86.00 1991...........................................................................................................100.00 15.13 38.15 61.80 73.17 87.01 1992...........................................................................................................100.00 14.92 37.53 60.77 71.99 85.77 1993...........................................................................................................100.00 14.92 37.55 60.95 72.24 86.21 1994...........................................................................................................100.00 14.89 37.36 60.81 72.15 86.20 1995...........................................................................................................100.00 14.54 36.63 59.84 71.19 85.40
1996...........................................................................................................100.00 14.08 35.68 58.41 69.64 83.96 1997...........................................................................................................100.00 13.84 34.95 57.17 68.21 82.63 1998...........................................................................................................100.00 13.67 34.37 56.23 67.15 81.53 1999...........................................................................................................100.00 13.25 33.54 55.11 65.96 80.49 2000...........................................................................................................100.00 12.99 32.85 53.99 64.70 79.19 2001...........................................................................................................100.00 13.81 34.77 56.89 68.01 82.47
Total income tax share (percentage): 1986...........................................................................................................100.00 6.46 23.98 45.31 57.43 74.25 1987...........................................................................................................100.00 6.07 23.08 44.39 56.74 75.19 1988...........................................................................................................100.00 5.72 22.16 42.72 54.38 72.42 1989...........................................................................................................100.00 5.83 22.78 44.22 56.06 74.76 1990...........................................................................................................100.00 5.81 22.98 44.64 56.36 74.87 1991...........................................................................................................100.00 5.48 22.71 44.18 56.62 75.18
1992...........................................................................................................100.00 5.06 21.52 41.99 54.12 72.46 1993...........................................................................................................100.00 4.81 20.73 40.76 52.64 70.99 1994...........................................................................................................100.00 4.77 20.45 40.55 52.48 71.14 1995...........................................................................................................100.00 4.61 19.64 39.25 51.09 69.74 1996...........................................................................................................100.00 4.32 18.68 37.49 49.03 67.69 1997...........................................................................................................100.00 4.28 18.33 36.80 48.13 66.83 1998...........................................................................................................100.00 4.21 17.31 34.96 46.16 65.25 1999...........................................................................................................100.00 4.00 16.46 33.55 44.55 63.82 2000...........................................................................................................100.00 3.91 15.99 32.67 43.53 62.58 2001...........................................................................................................100.00 3.97 17.10 35.11 46.75 66.11 ¹ The number of returns with negative adjusted gross income, i.e., returns with an adjusted gross deficit, and the corresponding amounts for adjusted gross deficit were excluded from Tables 5 and 6. By excluding deficit returns, alternative minimum tax reported on some of these returns was also excluded. For Tax Year 2001, there were 5,267 returns with no adjusted gross income that reported income tax, mostly alternative minimum tax, totaling $94.5 million. ² Total income tax is the sum of income tax after credits and alternative minimum tax for 1999 and prior years reported on returns that showed a positive amount for adjusted gross income. (For 2000 and later years, alternative minimum tax is included in income tax before credits.) Therefore, total income tax excludes alternative minimum tax, Form 8814 tax (tax on a child's interest or dividends), and Form 4972 tax (tax on lump-sum distributions from qualified retirement plans) reported on some returns with a negative amount for adjusted gross income. See also footnote 1 and Figure D. ³ The average tax rate was computed by dividing total income tax (see footnote 2) by (positive) adjusted gross income.
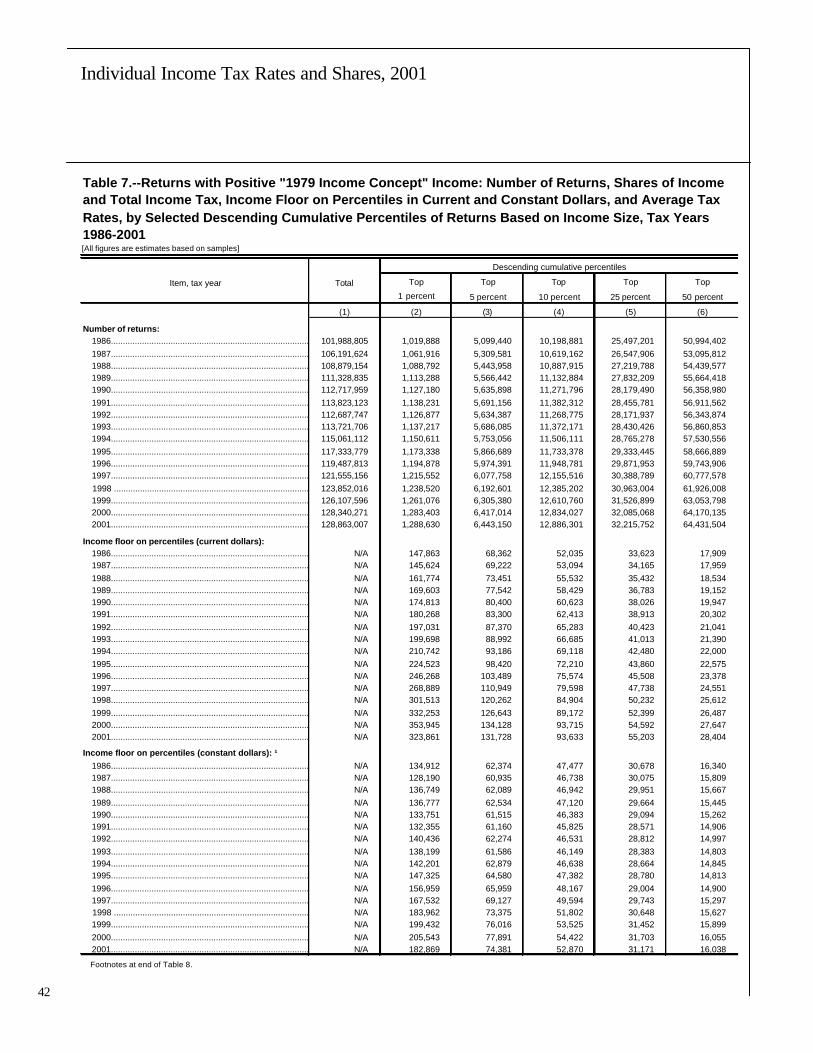
42
Individual Income Tax Rates and Shares, 2001
42
Table 7.--Returns with Positive "1979 Income Concept" Income: Number of Returns, Shares of Income and Total Income Tax, Income Floor on Percentiles in Current and Constant Dollars, and Average Tax Rates, by Selected Descending Cumulative Percentiles of Returns Based on Income Size, Tax Years 1986-2001[All figures are estimates based on samples]
Descending cumulative percentiles
Item, tax year Total Top Top Top Top Top
1 percent 5 percent 10 percent 25 percent 50 percent
(1) (2) (3) (4) (5) (6)
Number of returns: 1986.......................................................................................................................101,988,805 1,019,888 5,099,440 10,198,881 25,497,201 50,994,402 1987.......................................................................................................................106,191,624 1,061,916 5,309,581 10,619,162 26,547,906 53,095,812 1988.......................................................................................................................108,879,154 1,088,792 5,443,958 10,887,915 27,219,788 54,439,577 1989.......................................................................................................................111,328,835 1,113,288 5,566,442 11,132,884 27,832,209 55,664,418 1990.......................................................................................................................112,717,959 1,127,180 5,635,898 11,271,796 28,179,490 56,358,980 1991.......................................................................................................................113,823,123 1,138,231 5,691,156 11,382,312 28,455,781 56,911,562 1992.......................................................................................................................112,687,747 1,126,877 5,634,387 11,268,775 28,171,937 56,343,874 1993.......................................................................................................................113,721,706 1,137,217 5,686,085 11,372,171 28,430,426 56,860,853 1994.......................................................................................................................115,061,112 1,150,611 5,753,056 11,506,111 28,765,278 57,530,556 1995.......................................................................................................................117,333,779 1,173,338 5,866,689 11,733,378 29,333,445 58,666,889 1996.......................................................................................................................119,487,813 1,194,878 5,974,391 11,948,781 29,871,953 59,743,906 1997.......................................................................................................................121,555,156 1,215,552 6,077,758 12,155,516 30,388,789 60,777,578 1998 .......................................................................................................................123,852,016 1,238,520 6,192,601 12,385,202 30,963,004 61,926,008 1999.......................................................................................................................126,107,596 1,261,076 6,305,380 12,610,760 31,526,899 63,053,798 2000.......................................................................................................................128,340,271 1,283,403 6,417,014 12,834,027 32,085,068 64,170,135 2001.......................................................................................................................128,863,007 1,288,630 6,443,150 12,886,301 32,215,752 64,431,504
Income floor on percentiles (current dollars): 1986.......................................................................................................................N/A 147,863 68,362 52,035 33,623 17,909 1987.......................................................................................................................N/A 145,624 69,222 53,094 34,165 17,959 1988.......................................................................................................................N/A 161,774 73,451 55,532 35,432 18,534 1989.......................................................................................................................N/A 169,603 77,542 58,429 36,783 19,152 1990.......................................................................................................................N/A 174,813 80,400 60,623 38,026 19,947 1991.......................................................................................................................N/A 180,268 83,300 62,413 38,913 20,302 1992.......................................................................................................................N/A 197,031 87,370 65,283 40,423 21,041 1993.......................................................................................................................N/A 199,698 88,992 66,685 41,013 21,390 1994.......................................................................................................................N/A 210,742 93,186 69,118 42,480 22,000 1995.......................................................................................................................N/A 224,523 98,420 72,210 43,860 22,575 1996.......................................................................................................................N/A 246,268 103,489 75,574 45,508 23,378 1997.......................................................................................................................N/A 268,889 110,949 79,598 47,738 24,551 1998.......................................................................................................................N/A 301,513 120,262 84,904 50,232 25,612 1999.......................................................................................................................N/A 332,253 126,643 89,172 52,399 26,487 2000.......................................................................................................................N/A 353,945 134,128 93,715 54,592 27,647 2001.......................................................................................................................N/A 323,861 131,728 93,633 55,203 28,404
Income floor on percentiles (constant dollars): ¹ 1986.......................................................................................................................N/A 134,912 62,374 47,477 30,678 16,340 1987.......................................................................................................................N/A 128,190 60,935 46,738 30,075 15,809 1988.......................................................................................................................N/A 136,749 62,089 46,942 29,951 15,667 1989.......................................................................................................................N/A 136,777 62,534 47,120 29,664 15,445 1990.......................................................................................................................N/A 133,751 61,515 46,383 29,094 15,262 1991.......................................................................................................................N/A 132,355 61,160 45,825 28,571 14,906 1992.......................................................................................................................N/A 140,436 62,274 46,531 28,812 14,997 1993.......................................................................................................................N/A 138,199 61,586 46,149 28,383 14,803 1994.......................................................................................................................N/A 142,201 62,879 46,638 28,664 14,845 1995.......................................................................................................................N/A 147,325 64,580 47,382 28,780 14,813 1996.......................................................................................................................N/A 156,959 65,959 48,167 29,004 14,900 1997.......................................................................................................................N/A 167,532 69,127 49,594 29,743 15,297 1998 .......................................................................................................................N/A 183,962 73,375 51,802 30,648 15,627 1999.......................................................................................................................N/A 199,432 76,016 53,525 31,452 15,899 2000.......................................................................................................................N/A 205,543 77,891 54,422 31,703 16,055 2001.......................................................................................................................N/A 182,869 74,381 52,870 31,171 16,038
Footnotes at end of Table 8.

43
Individual Income Tax Rates and Shares, 2001
Table 7.--Returns with Positive "1979 Income Concept" Income: Number of Returns, Shares of Income and Total Income Tax, Income Floor on Percentiles in Current and Constant Dollars, and Average Tax Rates, by Selected Descending Cumulative Percentiles of Returns Based on Income Size, Tax Years 1986-2001--Continued[All figures are estimates based on samples]
Descending cumulative percentiles
Item, tax year Total Top Top Top Top Top
1 percent 5 percent 10 percent 25 percent 50 percent
(1) (2) (3) (4) (5) (6)
Income (millions of dollars): 1986.......................................................................................................................2,804,691 427,513 796,935 1,097,550 1,732,231 2,368,620 1987.......................................................................................................................2,856,118 363,880 749,240 1,067,438 1,741,747 2,411,715 1988.......................................................................................................................3,153,639 484,675 911,170 1,255,108 1,973,061 2,683,524 1989.......................................................................................................................3,336,571 486,976 947,363 1,317,619 2,085,003 2,838,481 1990.......................................................................................................................3,497,118 504,687 987,582 1,376,162 2,182,091 2,973,847 1991.......................................................................................................................3,577,337 478,756 985,590 1,390,924 2,224,979 3,038,428 1992.......................................................................................................................3,763,002 556,421 1,090,019 1,509,728 2,369,701 3,206,490 1993.......................................................................................................................3,849,532 554,075 1,105,014 1,537,285 2,422,475 3,278,866 1994.......................................................................................................................4,033,642 579,564 1,161,972 1,617,250 2,544,400 3,436,167 1995.......................................................................................................................4,317,506 653,717 1,284,726 1,772,890 2,754,988 3,692,267 1996.......................................................................................................................4,670,644 772,868 1,462,979 1,984,931 3,025,107 4,015,461 1997.......................................................................................................................5,112,706 918,007 1,679,877 2,242,353 3,353,245 4,409,075 1998 .......................................................................................................................5,626,390 1,072,779 1,925,214 2,542,399 3,742,006 4,869,467 1999.......................................................................................................................6,082,931 1,236,081 2,166,370 2,825,789 4,099,929 5,290,805 2000.......................................................................................................................6,601,494 1,424,436 2,430,957 3,138,299 4,495,910 5,758,808 2001.......................................................................................................................6,361,523 1,159,037 2,121,055 2,828,677 4,202,776 5,491,703
Total income tax (millions of dollars): ² 1986.......................................................................................................................366,763 93,128 155,553 198,862 277,578 342,296 1987.......................................................................................................................368,924 89,908 158,485 204,050 282,970 346,228 1988.......................................................................................................................412,549 112,208 186,793 235,121 320,152 388,631 1989.......................................................................................................................432,643 107,508 188,588 240,229 333,285 407,106 1990.......................................................................................................................446,906 110,530 192,991 245,856 342,926 420,345 1991.......................................................................................................................448,177 107,926 192,548 246,745 345,168 423,180 1992.......................................................................................................................476,067 127,361 216,303 272,361 372,352 451,494 1993.......................................................................................................................502,638 142,329 235,908 294,238 397,261 477,997 1994.......................................................................................................................534,693 150,133 250,770 314,909 423,743 508,540 1995.......................................................................................................................588,292 173,877 284,036 354,427 471,035 560,748 1996.......................................................................................................................658,059 208,071 331,404 407,726 532,750 628,918 1997.......................................................................................................................731,123 238,978 376,046 459,674 595,060 699,131 1998 .......................................................................................................................783,437 262,464 413,303 503,577 644,182 749,547 1999.......................................................................................................................877,199 307,382 479,531 577,903 729,679 841,172 2000.......................................................................................................................980,459 355,911 546,102 654,155 819,937 941,304 2001.......................................................................................................................887,770 291,907 466,057 570,430 732,094 851,539
Average tax rate (percentage): ³ 1986.......................................................................................................................13.08 21.78 19.52 18.12 16.02 14.45 1987.......................................................................................................................12.92 24.71 21.15 19.12 16.25 14.36 1988.......................................................................................................................13.08 23.15 20.50 18.73 16.23 14.48 1989.......................................................................................................................12.97 22.08 19.91 18.23 15.98 14.34 1990.......................................................................................................................12.78 21.90 19.54 17.87 15.72 14.13 1991.......................................................................................................................12.53 22.54 19.54 17.74 15.51 13.93 1992.......................................................................................................................12.65 22.89 19.84 18.04 15.71 14.08 1993.......................................................................................................................13.06 25.69 21.35 19.14 16.40 14.58 1994.......................................................................................................................13.26 25.90 21.58 19.47 16.65 14.80 1995.......................................................................................................................13.63 26.60 22.11 19.99 17.10 15.19 1996.......................................................................................................................14.09 26.92 22.65 20.54 17.61 15.66 1997.......................................................................................................................14.30 26.03 22.39 20.50 17.75 15.86 1998 .......................................................................................................................13.92 24.47 21.47 19.81 17.21 15.39 1999.......................................................................................................................14.42 24.87 22.14 20.45 17.80 15.90 2000.......................................................................................................................14.85 24.99 22.46 20.84 18.24 16.35 2001.......................................................................................................................13.96 25.19 21.97 20.17 17.42 15.51 Footnotes at end of Table 8.
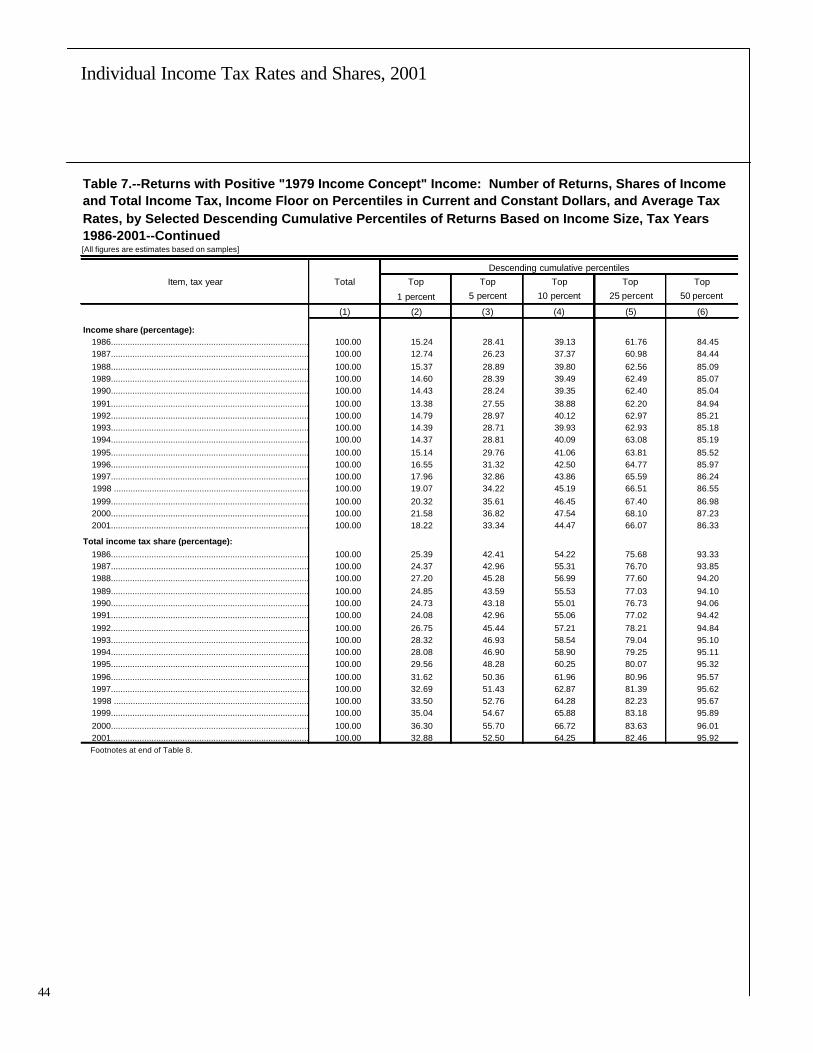
44
Individual Income Tax Rates and Shares, 2001
44
Table 7.--Returns with Positive "1979 Income Concept" Income: Number of Returns, Shares of Income and Total Income Tax, Income Floor on Percentiles in Current and Constant Dollars, and Average Tax Rates, by Selected Descending Cumulative Percentiles of Returns Based on Income Size, Tax Years 1986-2001--Continued[All figures are estimates based on samples]
Descending cumulative percentiles
Item, tax year Total Top Top Top Top Top
1 percent 5 percent 10 percent 25 percent 50 percent
(1) (2) (3) (4) (5) (6)
Income share (percentage): 1986.......................................................................................................................100.00 15.24 28.41 39.13 61.76 84.45 1987.......................................................................................................................100.00 12.74 26.23 37.37 60.98 84.44 1988.......................................................................................................................100.00 15.37 28.89 39.80 62.56 85.09 1989.......................................................................................................................100.00 14.60 28.39 39.49 62.49 85.07 1990.......................................................................................................................100.00 14.43 28.24 39.35 62.40 85.04 1991.......................................................................................................................100.00 13.38 27.55 38.88 62.20 84.94 1992.......................................................................................................................100.00 14.79 28.97 40.12 62.97 85.21 1993.......................................................................................................................100.00 14.39 28.71 39.93 62.93 85.18 1994.......................................................................................................................100.00 14.37 28.81 40.09 63.08 85.19 1995.......................................................................................................................100.00 15.14 29.76 41.06 63.81 85.52 1996.......................................................................................................................100.00 16.55 31.32 42.50 64.77 85.97 1997.......................................................................................................................100.00 17.96 32.86 43.86 65.59 86.24 1998 .......................................................................................................................100.00 19.07 34.22 45.19 66.51 86.55 1999.......................................................................................................................100.00 20.32 35.61 46.45 67.40 86.98 2000.......................................................................................................................100.00 21.58 36.82 47.54 68.10 87.23 2001.......................................................................................................................100.00 18.22 33.34 44.47 66.07 86.33
Total income tax share (percentage): 1986.......................................................................................................................100.00 25.39 42.41 54.22 75.68 93.33 1987.......................................................................................................................100.00 24.37 42.96 55.31 76.70 93.85 1988.......................................................................................................................100.00 27.20 45.28 56.99 77.60 94.20 1989.......................................................................................................................100.00 24.85 43.59 55.53 77.03 94.10 1990.......................................................................................................................100.00 24.73 43.18 55.01 76.73 94.06 1991.......................................................................................................................100.00 24.08 42.96 55.06 77.02 94.42 1992.......................................................................................................................100.00 26.75 45.44 57.21 78.21 94.84 1993.......................................................................................................................100.00 28.32 46.93 58.54 79.04 95.10 1994.......................................................................................................................100.00 28.08 46.90 58.90 79.25 95.11 1995.......................................................................................................................100.00 29.56 48.28 60.25 80.07 95.32 1996.......................................................................................................................100.00 31.62 50.36 61.96 80.96 95.57 1997.......................................................................................................................100.00 32.69 51.43 62.87 81.39 95.62 1998 .......................................................................................................................100.00 33.50 52.76 64.28 82.23 95.67 1999.......................................................................................................................100.00 35.04 54.67 65.88 83.18 95.89 2000.......................................................................................................................100.00 36.30 55.70 66.72 83.63 96.01 2001.......................................................................................................................100.00 32.88 52.50 64.25 82.46 95.92 Footnotes at end of Table 8.
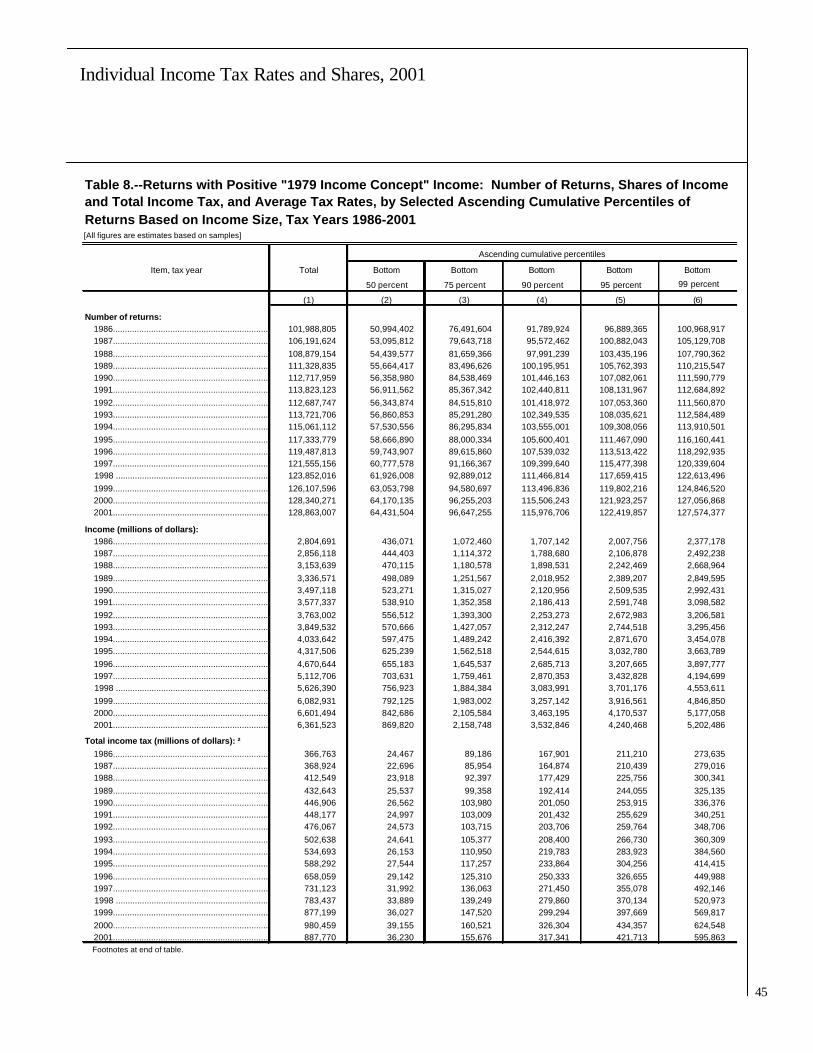
45
Individual Income Tax Rates and Shares, 2001
Table 8.--Returns with Positive "1979 Income Concept" Income: Number of Returns, Shares of Income and Total Income Tax, and Average Tax Rates, by Selected Ascending Cumulative Percentiles of Returns Based on Income Size, Tax Years 1986-2001[All figures are estimates based on samples]
Ascending cumulative percentiles
Item, tax year Total Bottom Bottom Bottom Bottom Bottom
50 percent 75 percent 90 percent 95 percent 99 percent
(1) (2) (3) (4) (5) (6)
Number of returns: 1986........................................................................................................101,988,805 50,994,402 76,491,604 91,789,924 96,889,365 100,968,917 1987........................................................................................................106,191,624 53,095,812 79,643,718 95,572,462 100,882,043 105,129,708 1988........................................................................................................108,879,154 54,439,577 81,659,366 97,991,239 103,435,196 107,790,362 1989........................................................................................................111,328,835 55,664,417 83,496,626 100,195,951 105,762,393 110,215,547 1990........................................................................................................112,717,959 56,358,980 84,538,469 101,446,163 107,082,061 111,590,779 1991........................................................................................................113,823,123 56,911,562 85,367,342 102,440,811 108,131,967 112,684,892 1992........................................................................................................112,687,747 56,343,874 84,515,810 101,418,972 107,053,360 111,560,870 1993........................................................................................................113,721,706 56,860,853 85,291,280 102,349,535 108,035,621 112,584,489 1994........................................................................................................115,061,112 57,530,556 86,295,834 103,555,001 109,308,056 113,910,501 1995........................................................................................................117,333,779 58,666,890 88,000,334 105,600,401 111,467,090 116,160,441 1996........................................................................................................119,487,813 59,743,907 89,615,860 107,539,032 113,513,422 118,292,935 1997........................................................................................................121,555,156 60,777,578 91,166,367 109,399,640 115,477,398 120,339,604 1998 ........................................................................................................123,852,016 61,926,008 92,889,012 111,466,814 117,659,415 122,613,496 1999........................................................................................................126,107,596 63,053,798 94,580,697 113,496,836 119,802,216 124,846,520 2000........................................................................................................128,340,271 64,170,135 96,255,203 115,506,243 121,923,257 127,056,868 2001........................................................................................................128,863,007 64,431,504 96,647,255 115,976,706 122,419,857 127,574,377
Income (millions of dollars): 1986........................................................................................................2,804,691 436,071 1,072,460 1,707,142 2,007,756 2,377,178 1987........................................................................................................2,856,118 444,403 1,114,372 1,788,680 2,106,878 2,492,238 1988........................................................................................................3,153,639 470,115 1,180,578 1,898,531 2,242,469 2,668,964 1989........................................................................................................3,336,571 498,089 1,251,567 2,018,952 2,389,207 2,849,595 1990........................................................................................................3,497,118 523,271 1,315,027 2,120,956 2,509,535 2,992,431 1991........................................................................................................3,577,337 538,910 1,352,358 2,186,413 2,591,748 3,098,582 1992........................................................................................................3,763,002 556,512 1,393,300 2,253,273 2,672,983 3,206,581 1993........................................................................................................3,849,532 570,666 1,427,057 2,312,247 2,744,518 3,295,456 1994........................................................................................................4,033,642 597,475 1,489,242 2,416,392 2,871,670 3,454,078 1995........................................................................................................4,317,506 625,239 1,562,518 2,544,615 3,032,780 3,663,789 1996........................................................................................................4,670,644 655,183 1,645,537 2,685,713 3,207,665 3,897,777 1997........................................................................................................5,112,706 703,631 1,759,461 2,870,353 3,432,828 4,194,699 1998 ........................................................................................................5,626,390 756,923 1,884,384 3,083,991 3,701,176 4,553,611 1999........................................................................................................6,082,931 792,125 1,983,002 3,257,142 3,916,561 4,846,850 2000........................................................................................................6,601,494 842,686 2,105,584 3,463,195 4,170,537 5,177,058 2001........................................................................................................6,361,523 869,820 2,158,748 3,532,846 4,240,468 5,202,486
Total income tax (millions of dollars): ² 1986........................................................................................................366,763 24,467 89,186 167,901 211,210 273,635 1987........................................................................................................368,924 22,696 85,954 164,874 210,439 279,016 1988........................................................................................................412,549 23,918 92,397 177,429 225,756 300,341 1989........................................................................................................432,643 25,537 99,358 192,414 244,055 325,135 1990........................................................................................................446,906 26,562 103,980 201,050 253,915 336,376 1991........................................................................................................448,177 24,997 103,009 201,432 255,629 340,251 1992........................................................................................................476,067 24,573 103,715 203,706 259,764 348,706 1993........................................................................................................502,638 24,641 105,377 208,400 266,730 360,309 1994........................................................................................................534,693 26,153 110,950 219,783 283,923 384,560 1995........................................................................................................588,292 27,544 117,257 233,864 304,256 414,415 1996........................................................................................................658,059 29,142 125,310 250,333 326,655 449,988 1997........................................................................................................731,123 31,992 136,063 271,450 355,078 492,146 1998 ........................................................................................................783,437 33,889 139,249 279,860 370,134 520,973 1999........................................................................................................877,199 36,027 147,520 299,294 397,669 569,817 2000........................................................................................................980,459 39,155 160,521 326,304 434,357 624,548 2001........................................................................................................887,770 36,230 155,676 317,341 421,713 595,863 Footnotes at end of table.
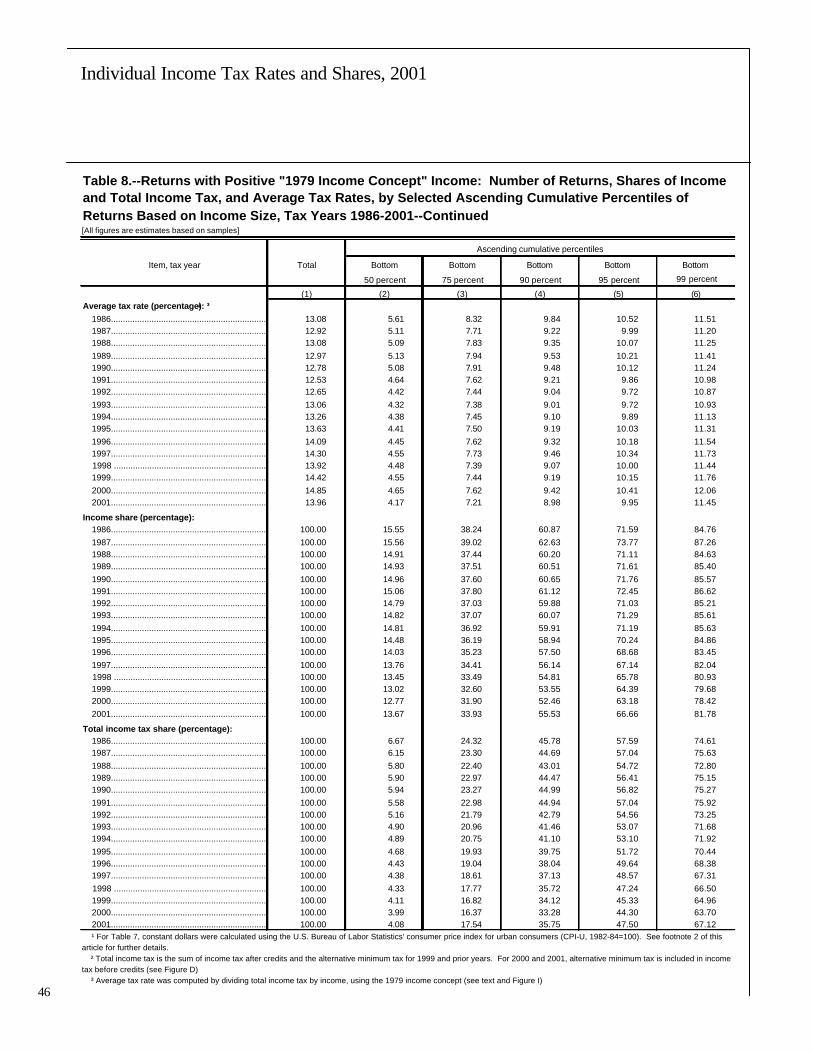
46
Individual Income Tax Rates and Shares, 2001
46
Table 8.--Returns with Positive "1979 Income Concept" Income: Number of Returns, Shares of Income and Total Income Tax, and Average Tax Rates, by Selected Ascending Cumulative Percentiles of Returns Based on Income Size, Tax Years 1986-2001--Continued[All figures are estimates based on samples]
Ascending cumulative percentiles
Item, tax year Total Bottom Bottom Bottom Bottom Bottom
50 percent 75 percent 90 percent 95 percent 99 percent
(1) (2) (3) (4) (5) (6)Average tax rate (percentage): ³ 1986........................................................................................................13.08 5.61 8.32 9.84 10.52 11.51 1987........................................................................................................12.92 5.11 7.71 9.22 9.99 11.20 1988........................................................................................................13.08 5.09 7.83 9.35 10.07 11.25 1989........................................................................................................12.97 5.13 7.94 9.53 10.21 11.41 1990........................................................................................................12.78 5.08 7.91 9.48 10.12 11.24 1991........................................................................................................12.53 4.64 7.62 9.21 9.86 10.98 1992........................................................................................................12.65 4.42 7.44 9.04 9.72 10.87 1993........................................................................................................13.06 4.32 7.38 9.01 9.72 10.93 1994........................................................................................................13.26 4.38 7.45 9.10 9.89 11.13 1995........................................................................................................13.63 4.41 7.50 9.19 10.03 11.31 1996........................................................................................................14.09 4.45 7.62 9.32 10.18 11.54 1997........................................................................................................14.30 4.55 7.73 9.46 10.34 11.73 1998 ........................................................................................................13.92 4.48 7.39 9.07 10.00 11.44 1999........................................................................................................14.42 4.55 7.44 9.19 10.15 11.76 2000........................................................................................................14.85 4.65 7.62 9.42 10.41 12.06 2001........................................................................................................13.96 4.17 7.21 8.98 9.95 11.45
Income share (percentage): 1986........................................................................................................100.00 15.55 38.24 60.87 71.59 84.76 1987........................................................................................................100.00 15.56 39.02 62.63 73.77 87.26 1988........................................................................................................100.00 14.91 37.44 60.20 71.11 84.63 1989........................................................................................................100.00 14.93 37.51 60.51 71.61 85.40 1990........................................................................................................100.00 14.96 37.60 60.65 71.76 85.57 1991........................................................................................................100.00 15.06 37.80 61.12 72.45 86.62 1992........................................................................................................100.00 14.79 37.03 59.88 71.03 85.21 1993........................................................................................................100.00 14.82 37.07 60.07 71.29 85.61 1994........................................................................................................100.00 14.81 36.92 59.91 71.19 85.63 1995........................................................................................................100.00 14.48 36.19 58.94 70.24 84.86 1996........................................................................................................100.00 14.03 35.23 57.50 68.68 83.45 1997........................................................................................................100.00 13.76 34.41 56.14 67.14 82.04 1998 ........................................................................................................100.00 13.45 33.49 54.81 65.78 80.93 1999........................................................................................................100.00 13.02 32.60 53.55 64.39 79.68 2000........................................................................................................100.00 12.77 31.90 52.46 63.18 78.42 2001........................................................................................................100.00 13.67 33.93 55.53 66.66 81.78
Total income tax share (percentage): 1986........................................................................................................100.00 6.67 24.32 45.78 57.59 74.61 1987........................................................................................................100.00 6.15 23.30 44.69 57.04 75.63 1988........................................................................................................100.00 5.80 22.40 43.01 54.72 72.80 1989........................................................................................................100.00 5.90 22.97 44.47 56.41 75.15 1990........................................................................................................100.00 5.94 23.27 44.99 56.82 75.27 1991........................................................................................................100.00 5.58 22.98 44.94 57.04 75.92 1992........................................................................................................100.00 5.16 21.79 42.79 54.56 73.25 1993........................................................................................................100.00 4.90 20.96 41.46 53.07 71.68 1994........................................................................................................100.00 4.89 20.75 41.10 53.10 71.92 1995........................................................................................................100.00 4.68 19.93 39.75 51.72 70.44 1996........................................................................................................100.00 4.43 19.04 38.04 49.64 68.38 1997........................................................................................................100.00 4.38 18.61 37.13 48.57 67.31 1998 ........................................................................................................100.00 4.33 17.77 35.72 47.24 66.50 1999........................................................................................................100.00 4.11 16.82 34.12 45.33 64.96 2000........................................................................................................100.00 3.99 16.37 33.28 44.30 63.70 2001........................................................................................................100.00 4.08 17.54 35.75 47.50 67.12 ¹ For Table 7, constant dollars were calculated using the U.S. Bureau of Labor Statistics' consumer price index for urban consumers (CPI-U, 1982-84=100). See footnote 2 of thisarticle for further details. ² Total income tax is the sum of income tax after credits and the alternative minimum tax for 1999 and prior years. For 2000 and 2001, alternative minimum tax is included in income tax before credits (see Figure D). ³ Average tax rate was computed by dividing total income tax by income, using the 1979 income concept (see text and Figure I).
4
8
8
by David Campbell and Michael Parisi
Individual Income Tax Rates and Shares, 2001
David Campbell and Michael Parisi are economists withthe Individual Statistics Branch Returns Analysis Section.This article was written under the direction of JeffHartzok, Chief.
T axpayers filed 130.3 million returns for TaxYear 2001, of which almost 94.8 million (or72.8 percent) were classified as taxable
returns. Adjusted gross income (AGI) on taxablereturns fell 4.0 percent to $5,847 billion for 2001.Total income tax fell 10.4 percent for 2001, a ratemore than twice that of AGI. This decrease in totalincome tax was attributable to a decline in incomebeing reported and to tax cuts implemented in theEconomic Growth and Tax Relief Reconciliation Actof 2001 (EGTRRA). The average tax rate fortaxable returns fell 0.9 percentage points to 15.2percent. The last decline in average tax rates wasin 1991 when the economy declined, and the last timethe average tax rate fell by a similar magnitude wasfor 1987, the first year under the Tax Reform Actof 1986.
Using the 1979 Income Concept (see AppendixD for an explanation of the 1979 Income Concept),the income share for the top 1 percent of taxpayersfell from 21.6 percent from 2000 to 18.2 percent for2001, while the share of income for the bottom 50percent of taxpayers increased from 12.8 percent to13.7 percent (Table 7). The resulting 4.5-percentagepoint gap for 2001 between the income shares of thetop 1 percent and the bottom 50 percent of taxpayerscontrasted with the 28.8-percentage point gap be-tween the shares of income tax from the same twogroups. The income tax share for the top 1 percentof taxpayers was 32.9 percent for 2001, while thecorresponding share for the bottom 50 percent was4.1 percent.
This article discusses the individual income taxrates and tax shares and the computation of “taxgenerated” for 2001. To put this discussion intoperspective, the appendices to the article provideexplanations of selected terms used in the articleand describe the income tax structure, certain taxlaw changes, income and tax concepts (the “1979Income Tax Concept,” “modified” taxable income,and marginal tax rates), the computation of “alterna-tive minimum taxable income,” and the data sourcesand limitations.
Income Tax RatesDiscussions of income tax rates generally center onmeasuring two distinct tax rates: average tax ratesand marginal tax rates. Average tax rates arecalculated by dividing some measure of tax by somemeasure of income. For the statistics in this article,the average tax rate is “tax generated” (see Appen-dix A: Explanation of Selected Terms) divided byAGI reported on returns showing some income taxliability. Measures of marginal tax rates, on the otherhand, focus on determining the tax rate imposed onthe last (or next) dollar of income received by ataxpayer. For this article, the marginal tax rate is thestatutory rate at which the last dollar of taxableincome is taxed. (See Appendix D for a moredetailed explanation of marginal tax rates.) Thefollowing sections describe the measurement of theaverage and marginal tax rates in more detail, anddiscuss the statistics based on these rates for 2001.
Average Tax RatesFigure A presents statistics for 1986 through 2001 onincome (based on each year’s definition of AGI andon the common 1979 Income Concept) and taxesreported. (See Appendix D for an explanation of the1979 Income Concept.) These tax years can bepartitioned into seven distinct subperiods:
(1) Tax Year 1986 was the last year under theEconomic Recovery Tax Act of 1981(ERTA81). The tax bracket boundaries,personal exemptions, and standard deductionswere indexed for inflation, and the maximum taxrate was 50 percent.
(2) Tax Year 1987 was the first year under the TaxReform Act of 1986 (TRA86). For 1987, a 1-year, transitional, five-rate tax bracket structurewas established with a partial phase-in of newprovisions that broadened the definition of AGI.The maximum tax rate was 38.5 percent.
(3) During Tax Years 1988 through 1990, there waseffectively a three-rate tax bracket structure [1].The phase-in of the provisions of TRA86 con-tinued with a maximum tax rate of 33 percent.
(4) Tax Years 1991 and 1992 brought a three-ratetax bracket structure (with a maximum tax rate

9
Individual Income Tax Rates and Shares, 2001
Figure A
Adjusted Gross Income, Total Income Tax, Average Tax Rate, and Average Total Income Tax, Tax Years 1986-2001[Money amounts are in billions of dollars, except where indicated]
Taxable returns
Average per return (whole dollars) ³Tax Total number Number of As a Adjusted Total Average Current dollars Constant dollarsyear of returns returns percentage of gross income income tax rate Adjusted Total Adjusted Total
total returns ¹ (less deficit) tax (percent) gross income income gross income income(less deficit) tax (less deficit) tax
(1) (2) (3) (4) (5) (6) (7) (8) (9) (10)
Using each tax year's adjusted gross income
1986....................................................103,045,170 83,967,413 81.5 2,440 367 15.1 29,062 4,374 26,516 3,991 1987....................................................106,996,270 86,723,796 81.1 2,701 369 13.7 31,142 4,257 27,414 3,747
1988....................................................109,708,280 87,135,332 79.4 2,990 413 13.8 34,313 4,738 29,005 4,005 1989....................................................112,135,673 89,178,355 79.5 3,158 433 13.7 35,415 4,855 28,560 3,915 1990....................................................113,717,138 89,862,434 79.0 3,299 447 13.6 36,711 4,976 28,088 3,807 1991....................................................114,730,123 88,733,587 77.3 3,337 448 13.4 37,603 5,054 27,609 3,711 1992....................................................113,604,503 86,731,946 76.3 3,484 476 13.7 40,168 5,491 28,630 3,914
1993....................................................114,601,819 86,435,367 75.4 3,564 503 14.1 41,233 5,817 28,535 4,026 1994....................................................115,943,131 87,619,446 75.6 3,737 535 14.3 42,646 6,104 28,776 4,119 1995....................................................118,218,327 89,252,989 75.5 4,008 588 14.7 44,901 6,593 29,463 4,326 1996....................................................120,351,208 90,929,350 75.6 4,342 658 15.2 47,750 7,239 30,433 4,614
1997....................................................122,421,991 93,471,200 76.4 4,765 731 15.3 50,980 7,824 31,763 4,875 1998....................................................124,770,662 93,047,898 74.6 5,160 789 15.3 55,458 8,475 33,836 5,171 1999....................................................127,075,145 94,546,080 74.4 5,581 877 15.7 59,028 9,280 35,431 5,570 2000....................................................129,373,500 96,817,603 74.8 6,083 981 16.1 62,832 10,129 36,488 5,882
2001....................................................130,255,237 94,763,530 72.8 5,847 888 15.2 61,702 9,370 34,840 5,291
Using 1979 Income Concept 5
1986....................................................103,045,170 83,967,413 81.5 2,703 367 13.6 32,194 4,374 29,374 3,991
1987....................................................106,996,270 86,723,796 81.1 2,736 369 13.5 31,551 4,257 27,774 3,747 1988....................................................109,708,280 87,135,332 79.4 3,011 413 13.7 34,556 4,738 29,210 4,005 1989....................................................112,135,673 89,178,355 79.5 3,188 433 13.6 35,752 4,855 28,832 3,915 1990....................................................113,717,138 89,862,434 79.0 3,335 447 13.4 37,108 4,976 28,392 3,807
1991....................................................114,730,123 88,733,587 77.3 3,387 448 13.2 38,169 5,054 28,024 3,711 1992....................................................113,604,503 86,731,946 76.3 3,553 476 13.4 40,964 5,491 29,198 3,914 1993....................................................114,601,819 86,435,367 75.4 3,625 503 13.9 41,938 5,817 29,023 4,026 1994....................................................115,943,131 87,619,446 75.6 3,796 535 14.1 43,322 6,104 29,232 4,119 1995....................................................118,218,327 89,252,989 75.5 4,075 588 14.4 45,655 6,593 29,957 4,326
1996....................................................120,351,208 90,929,350 75.6 4,418 658 14.9 48,582 7,239 30,964 4,614 1997....................................................122,421,991 93,471,200 76.4 4,849 731 15.1 51,875 7,824 32,321 4,875 1998....................................................124,770,662 93,047,898 74.6 5,299 789 14.9 56,947 8,475 34,745 5,171 1999....................................................127,075,145 94,546,080 74.4 5,736 877 15.3 60,666 9,280 36,414 5,570
2000....................................................129,373,500 96,817,603 74.8 6,294 981 15.6 65,012 10,129 37,754 5,882 2001....................................................130,255,237 94,763,530 72.8 5,943 888 14.9 62,716 9,370 35,413 5,291
¹ Number of taxable returns (column 2) divided by total number of returns (column 1). ² Average tax rate is "total income tax" (column 5) divided by adjusted gross income less deficit (AGI) (column 4). ³ The average adjusted gross income (less deficit), average total income tax, and average tax rate were calculated from unrounded data.
Constant dollars were calculated using the U.S. Bureau of Labor Statistics' consumer price index for urban consumers (CPI-U, 1982-84=100). See footnote 2 of this article for further details. These statistics are based on adjusted gross income less deficit (AGI) recomputed to reflect the 1979 Income Concept, thus enabling more valid comparisons of the average tax rates among years. Changes in the definition of AGI among years render direct comparison of the unadjusted figures misleading. For additional information, see Statistics
of Income--Individual Income Tax Returns, for 1986-2001. See Figure G for components of the 1979 Income Concept.
4
5
4
2,3

10
Individual Income Tax Rates and Shares, 2001
10
of 31 percent), a limitation on some itemized de-ductions, and a phaseout of personal exemptions.
(5) Tax Years 1993 through 1996 had a five-rate taxbracket structure (with a maximum statutory taxrate of 39.6 percent), a limitation on some itemizeddeductions, and a phaseout of personal exemptions.
(6) Tax Years 1997 through 2000 were subject tothe Taxpayer Relief Act of 1997 which addedthree new capital gain tax rates to the previousrate structure to form a new eight-rate tax bracketstructure (with maximum statutory tax rate of39.6 percent). See Appendix C for a moredetailed description of the capital gain rates.
(7) Tax Year 2001 was the first year affected bythe Economic Growth and Tax Relief Reconcili-ation Act of 2001 (EGTRRA). This law in-cluded a new 10-percent tax rate bracket, halfpercentage point reductions in marginal tax rateshigher than the 15-percent rate, increases in thechild tax credit, and an increase in alternativeminimum tax exemptions. See the Changes inLaw section for more details.
More than 94.8 million, or 72.8 percent, of the130.3 million individual returns filed for 2001 wereclassified as taxable returns. This was a 2.1-percentreduction in the number of taxable returns from2000. The last time the number of taxable returnsfell by this magnitude was for 1992. Total AGIreported on taxable returns decreased 4.0 percent to$5,847 billion. This was the first time that AGI fortaxable returns has fallen since 1953 [2]. Totalincome on taxable returns fell using the 1979 IncomeConcept as well, dropping 5.6 percent to $5,943billion for 2001. Total income tax fell for the firsttime since 1983, declining by almost $93 billion to$888 billion for 2001. This 10.4-percent decline inincome tax was more than double the rate of declinein AGI for 2001. The steeper drop in tax was par-tially attributable to both the disproportionately largereduction in income that occurred in the higher taxrate brackets (Figure B), as well as the tax cutsimplemented in EGTRRA.
Average AGI and income tax, reported in currentdollars, fell by a smaller percentage than total AGIand income tax due to the corresponding fall in tax-
able returns for 2001. Average AGI for taxablereturns fell to $61,702 for 2001, a 1.8-percent declinefrom 2000. Average AGI in constant 1982-84 dollarsdecreased 4.5 percent to $34,840 [3]. Averageincome tax fell more than four times as fast as aver-age AGI for 2001, slipping 7.5 percent to $9,370. Inconstant dollars, income tax fell more than twice asfast as AGI, decreasing 10.0 percent to $5,291. Therelatively large reductions in average income tax, forboth current and constant dollars, suggest that factorsother than the falling level of income may have con-tributed to the decrease in tax generated.
In order to analyze the average tax rate overtime, it is necessary to use an alternative measure toAGI because changes in the tax law alter AGI’sdefinition from year to year. The 1979 IncomeConcept controls for much of this variation in taxlaw, and its use provides a more consistent estimateof the average tax rate across years. For 2001, theaverage tax rate fell to 14.9 percent from 15.6 per-cent for 2000. Though the 0.7-percent decline is thefirst fall in the average tax rate since 1998, the 14.9-percent rate is still higher than 10 of the 16 years forwhich data are reported. The average tax rate hasnot been less than 14 percent since 1993, the year theOmnibus Reconciliation Act of 1993 passed(OBRA93), which created new 36-percent and 39.6-percent tax brackets.
As shown in Figure B, the average tax rateon all taxable returns as a percentage of AGI was15.2 percent for 2001. The average tax rate for theAGI-size classes ranged from 2.8 percent for the “$1under $10,000” AGI-size class to 28.4 percent for the“$1,000,000 or more” AGI-size class. This range ofvalues highlights the progressive nature of the taxcode, as the average tax rate increases in eachsuccessively higher AGI-size class. The average taxrate in each AGI-size classes, with the exception ofthe “$1,000,000 or more” class, fell for 2001. Theaverage tax rate on the “$1,000,000 or more” AGI-size class increased 0.7 percentage points for 2001.This may have been attributable to the reduction oflong-term capital gain income as a share of totalincome for returns in this class.
The average tax rate of 15.2 percent for 2001 forall income classes combined was a decrease of 0.9percentage points from the all-time high of 16.1percent reported for 2000. This reduction was atleast partially attributable to the implementation of tax

11
Individual Income Tax Rates and Shares, 2001
rate reductions under EGTRRA. Also, many of thehigher income tax returns of previous years shifted tolower income brackets for 2001 partially due to thevery large reductions in realized capital gain (lessloss). Specifically, the number of taxpayers in the topthree AGI-size classes declined by: 19.5 percent forthe “$1 million or more” AGI-class; 10.3 percent forthe “$500,000 under $1,000,000” AGI-class; and 5.5percent for the “$200,000 under $500,000” AGI-class. The last decline in average tax rates was in1991 when the economy was in a recession. The lasttime the average tax rate fell by a similar magnitudewas for 1987, the first year under TRA86.
Marginal Tax Rate ClassificationsA return’s marginal tax rate is the highest statutorytax rate bracket applicable to that tax return. Mar-ginal tax rate statistics are presented in Figure C andTable 1. These statistics are based on individualincome tax returns showing a positive taxable incomeamount based on “tax generated” and items ofincome that were subject to the regular income tax,generally those included in AGI [4]. Tables 2 and 3contain additional data based on marginal tax rates.These tables present statistics on the income and taxgenerated at each marginal tax rate by size of AGI(Table 2) and by filing status (Table 3). Appendix D
Figure B
Taxable Returns: Number of Returns, Adjusted Gross Income, and Total Income Tax, by Size of Adjusted Gross Income, Tax Years 2000 and 2001[Number of returns is in thousands--money amounts are in millions of dollars]
Size of adjusted gross income
Tax year, $1 $10,000 $20,000 $30,000 $50,000 $100,000 $200,000 $500,000 $1,000,000
items Under under under under under under under under under or
$1 ¹ $10,000 $20,000 $30,000 $50,000 $100,000 $200,000 $500,000 $1,000,000 more
(1) (2) (3) (4) (5) (6) (7) (8) (9) (10) (11)
Tax Year 2001:
Number of taxable returns...........................................................................94,764 5 6,460 13,791 14,060 23,153 26,269 8,461 2,016 355 193
Adjusted gross income
(less deficit)...........................................................................5,847,060 -1,817 42,914 209,345 351,885 908,461 1,826,558 1,113,189 577,874 240,493 578,159
Total income tax...........................................................................887,974 92 1,219 11,999 27,184 82,926 212,798 185,264 134,591 67,781 164,120
Average tax rate (percent) ²...........................................................................15.2 ( ³ ) 2.8 5.7 7.7 9.1 11.7 16.6 23.3 28.2 28.4
Tax Year 2000:
Number of taxable returns...........................................................................96,818 6 7,831 14,476 14,863 23,253 25,542 8,078 2,134 396 239
Adjusted gross income
(less deficit)...........................................................................6,083,263 -5,646 49,981 219,038 370,902 910,893 1,774,029 1,065,629 613,255 268,765 816,418
Total income tax...........................................................................980,645 124 2,231 14,408 29,533 85,969 215,549 184,035 146,454 76,022 226,320
Average tax rate (percent) ²...........................................................................16.1 ( ³ ) 4.5 6.6 8.0 9.4 12.2 17.3 23.9 28.3 27.7
Change in:
Number of taxable returns...........................................................................-2,054 ( Z ) -1,372 -685 -803 -99 728 383 -118 -41 -47
Percent...........................................................................-2.1 -7.8 -17.5 -4.7 -5.4 -0.4 2.8 4.7 -5.5 -10.3 -19.5
Adjusted gross income (less deficit)...........................................................................-236,203 3,830 -7,067 -9,693 -19,017 -2,432 52,529 47,560 -35,381 -28,272 -238,259
Percent...........................................................................-3.9 -67.8 -14.1 -4.4 -5.1 -0.3 3.0 4.5 -5.8 -10.5 -29.2
Total income tax...........................................................................-92,671 -32 -1,012 -2,409 -2,349 -3,043 -2,751 1,229 -11,864 -8,240 -62,201
Percent...........................................................................-9.5 -25.6 -45.3 -16.7 -8.0 -3.5 -1.3 0.7 -8.1 -10.8 -27.5
Average tax rate
Percentage point change...........................................................................-0.9 ( ) -1.6 -0.8 -0.2 -0.3 -0.5 -0.6 -0.6 -0.1 0.7
¹ Includes returns with adjusted gross deficit. Tax in these returns represents some combination of alternative minimum tax, Form 4972 tax on lump-sum distributions from qualified retirement plans, and Form 8814 tax on a child's interest and dividends not reflected in adjusted gross income or taxable income.
² Average tax rate is "total income tax" as a percentage of adjusted gross income less deficit (AGI). The average tax rate was calculated from unrounded data. ³ Percentage not computed. Increase not computed. Z--Less than 1,000.
NOTE: Detail may not add to totals because of rounding.
Total
4
4

12
Individual Income Tax Rates and Shares, 2001
12
explains the details of the determination of themarginal tax rate bracket into which a return isassumed to fall.
For 2001, the number of individual returns withmodified taxable income fell 1.0 percent to 104.2million. The amount of modified taxable incomereported on these returns fell 6.1 percent to $4,269.3billion [5]. As a result of both the falling level oftaxable income and the tax cuts implemented underEGTRRA, these returns generated $926.6 billion inincome taxes before credits for 2001, an 8.1-percentdrop from the previous year. Figure C presents theamounts and percentages of modified taxable incomeand income tax generated (before reduction by taxcredits, including the earned income credit) by themarginal tax rate categories (defined in Appendix D).The 2001 marginal tax rate categories for 2001 aredifferent than those for 2000 due to changes in statu-tory tax rates resulting from EGTRRA. The taxrates for the four highest income brackets were eachreduced by half a percentage point, and 8-percentand 10-percent rate brackets were created for in-
come from capital gains. A 10-percent tax bracketfor ordinary income was introduced for dependentsfor 2001 (all others for 2002, see Changes in Lawsection for more detail).
The “15 percent” marginal tax rate bracketcontained the largest share of returns for 2001, at62.6 percent. These returns reported 24.7 percent ofmodified taxable income for 2001 and 17.0 percent ofincome tax before credits. Conversely, the 0.8 per-cent of returns in the “39.1 percent” marginal ratebracket reported 17.8 percent of the modified taxableincome and 27.6 percent of the tax. The 26.1 per-cent of returns in the “27.5 percent” marginal ratebracket reported 36.4 percent of the modified taxableincome and 32.0 percent of income tax before cred-its. Returns in the “30.5 percent” rate bracket re-ported 10.5 percent of the modified taxable incomeand 11.5 percent of the income tax. Returns in the“35.5 percent” rate bracket reported showed 7.7percent of the modified taxable income and 9.6percent of the income tax. The two new marginaltax rate brackets, “8 percent” and “10 percent (capi-
Figure C
Returns with Modified Taxable Income: Tax Generated at All Rates on Returns with the Indicated Marginal Tax Rate, Tax Year 2001[Money amounts are in thousands of dollars]
Marginal tax Number of returns Modified taxable income Tax generated
rate classes Number Percent of total Amount Percent of total Amount Percent of total
(1) (2) (3) (4) (5) (6)
All rates............................................................................104,163,693 100.0 4,269,339,932 100.0 926,646,417 100.0
8 percent.........................................................................................187,240 0.2 1,410,668 ( ² ) 112,850 ( ² )
10 percent (capital gains).........................................................................................554,064 0.5 2,645,170 0.1 257,111 ( ² ) 10 percent.........................................................................................3,877,821 3.7 7,834,252 0.2 783,586 0.1 10 percent (Form 8814) ¹.........................................................................................8,324 ( ² ) 10,580 ( ² ) 1,058 ( ² ) 15 percent.........................................................................................65,207,298 62.6 1,056,357,480 24.7 157,672,420 17.0
20 percent.........................................................................................685,760 0.7 95,447,222 2.2 17,160,764 1.9 25 percent.........................................................................................47,801 ( ² ) 6,781,981 0.2 1,338,779 0.1 27.5 percent.........................................................................................27,219,888 26.1 1,554,572,661 36.4 296,370,247 32.0 28 percent (capital gains).........................................................................................49,296 ( ² ) 3,897,093 0.1 793,800 0.1
30.5 percent.........................................................................................3,824,132 3.7 450,404,363 10.5 106,868,479 11.5 35.5 percent.........................................................................................1,453,822 1.4 328,972,332 7.7 89,323,624 9.6 39.1 percent.........................................................................................846,345 0.8 759,379,672 17.8 255,544,943 27.6 Form 8615 ³.........................................................................................201,902 0.2 1,626,456 ( ² ) 418,758 ( ² )
¹ Form 8814 was filed for a dependent child under age 14 for whom the parents made an election to report the child's investment income (if it was from interest or dividends totaling between $700 and $7,500) on the parents' income tax return. This rate classification is comprised of those returns with a tax liability only from the dependents' incomes. ² Less than 0.05 percent. ³ Form 8615 was filed for a child under age 14 to report the child's investment income in excess of $1,500. The returns in this rate classification are not distributed by tax rate.
NOTE: Detail may not add to totals because of rounding.
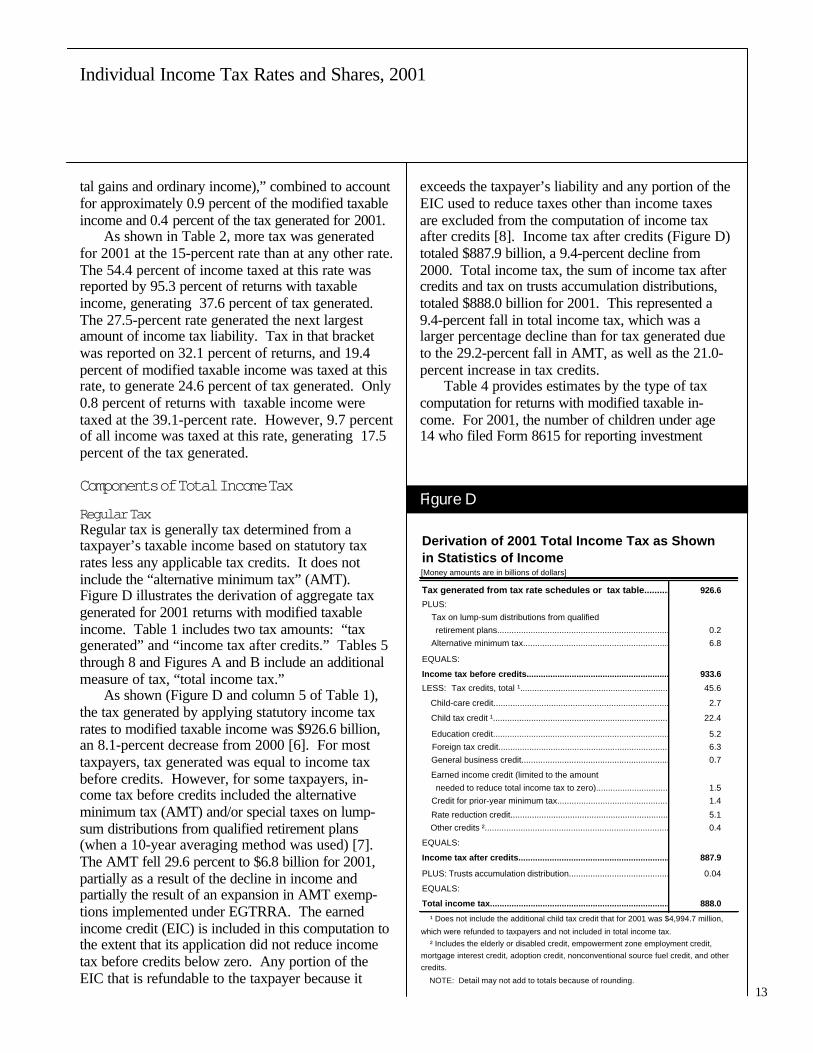
13
Individual Income Tax Rates and Shares, 2001
tal gains and ordinary income),” combined to accountfor approximately 0.9 percent of the modified taxableincome and 0.4 percent of the tax generated for 2001.
As shown in Table 2, more tax was generatedfor 2001 at the 15-percent rate than at any other rate.The 54.4 percent of income taxed at this rate wasreported by 95.3 percent of returns with taxableincome, generating 37.6 percent of tax generated.The 27.5-percent rate generated the next largestamount of income tax liability. Tax in that bracketwas reported on 32.1 percent of returns, and 19.4percent of modified taxable income was taxed at thisrate, to generate 24.6 percent of tax generated. Only0.8 percent of returns with taxable income weretaxed at the 39.1-percent rate. However, 9.7 percentof all income was taxed at this rate, generating 17.5percent of the tax generated.
Components of Total Income Tax
Regular TaxRegular tax is generally tax determined from ataxpayer’s taxable income based on statutory taxrates less any applicable tax credits. It does notinclude the “alternative minimum tax” (AMT).Figure D illustrates the derivation of aggregate taxgenerated for 2001 returns with modified taxableincome. Table 1 includes two tax amounts: “taxgenerated” and “income tax after credits.” Tables 5through 8 and Figures A and B include an additionalmeasure of tax, “total income tax.”
As shown (Figure D and column 5 of Table 1),the tax generated by applying statutory income taxrates to modified taxable income was $926.6 billion,an 8.1-percent decrease from 2000 [6]. For mosttaxpayers, tax generated was equal to income taxbefore credits. However, for some taxpayers, in-come tax before credits included the alternativeminimum tax (AMT) and/or special taxes on lump-sum distributions from qualified retirement plans(when a 10-year averaging method was used) [7].The AMT fell 29.6 percent to $6.8 billion for 2001,partially as a result of the decline in income andpartially the result of an expansion in AMT exemp-tions implemented under EGTRRA. The earnedincome credit (EIC) is included in this computation tothe extent that its application did not reduce incometax before credits below zero. Any portion of theEIC that is refundable to the taxpayer because it
exceeds the taxpayer’s liability and any portion of theEIC used to reduce taxes other than income taxesare excluded from the computation of income taxafter credits [8]. Income tax after credits (Figure D)totaled $887.9 billion, a 9.4-percent decline from2000. Total income tax, the sum of income tax aftercredits and tax on trusts accumulation distributions,totaled $888.0 billion for 2001. This represented a9.4-percent fall in total income tax, which was alarger percentage decline than for tax generated dueto the 29.2-percent fall in AMT, as well as the 21.0-percent increase in tax credits.
Table 4 provides estimates by the type of taxcomputation for returns with modified taxable in-come. For 2001, the number of children under age14 who filed Form 8615 for reporting investment
Figure D
Derivation of 2001 Total Income Tax as Shownin Statistics of Income[Money amounts are in billions of dollars]
Tax generated from tax rate schedules or tax table.......................................................................................................926.6
PLUS: Tax on lump-sum distributions from qualified retirement plans.......................................................................................................0.2 Alternative minimum tax.......................................................................................................6.8
EQUALS:
Income tax before credits.......................................................................................................933.6
LESS: Tax credits, total ¹.......................................................................................................45.6
Child-care credit.......................................................................................................2.7
Child tax credit ¹.......................................................................................................22.4
Education credit.......................................................................................................5.2 Foreign tax credit.......................................................................................................6.3 General business credit.......................................................................................................0.7
Earned income credit (limited to the amount needed to reduce total income tax to zero).......................................................................................................1.5 Credit for prior-year minimum tax.......................................................................................................1.4
Rate reduction credit.......................................................................................................5.1 Other credits ².......................................................................................................0.4
EQUALS:
Income tax after credits.......................................................................................................887.9
PLUS: Trusts accumulation distribution.......................................................................................................0.04
EQUALS:
Total income tax.......................................................................................................888.0
¹ Does not include the additional child tax credit that for 2001 was $4,994.7 million,
which were refunded to taxpayers and not included in total income tax. ² Includes the elderly or disabled credit, empowerment zone employment credit, mortgage interest credit, adoption credit, nonconventional source fuel credit, and other credits.
NOTE: Detail may not add to totals because of rounding.
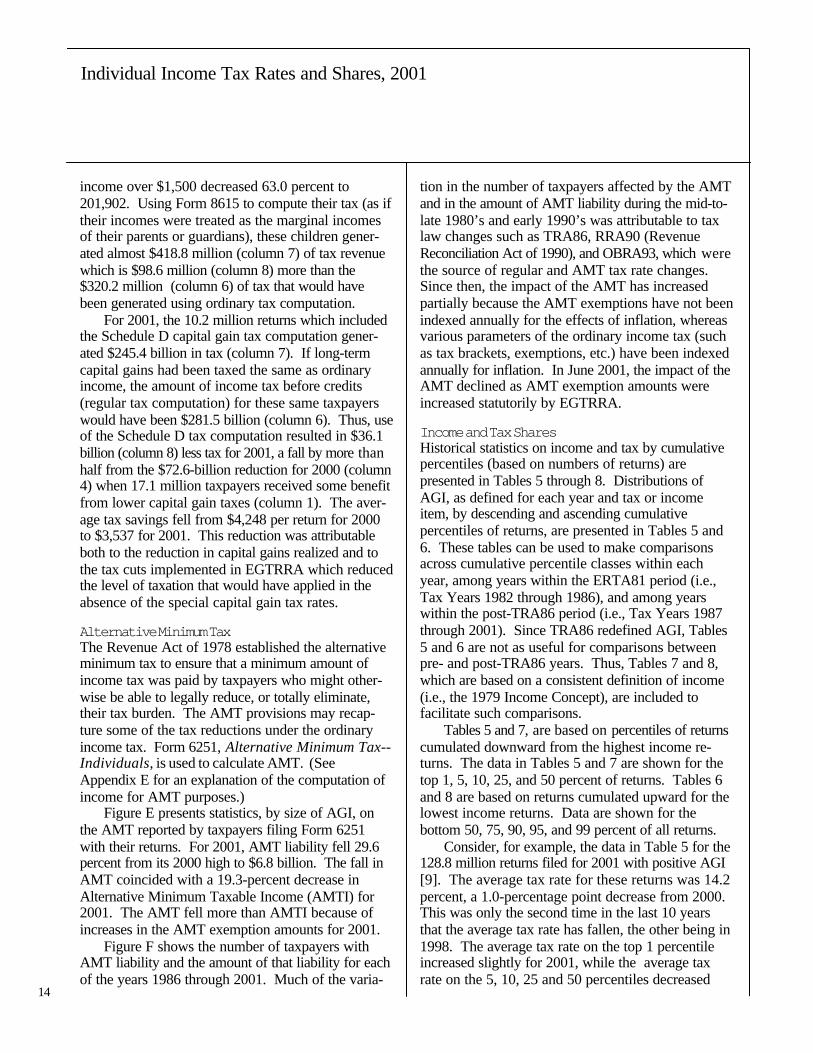
14
Individual Income Tax Rates and Shares, 2001
14
income over $1,500 decreased 63.0 percent to201,902. Using Form 8615 to compute their tax (as iftheir incomes were treated as the marginal incomesof their parents or guardians), these children gener-ated almost $418.8 million (column 7) of tax revenuewhich is $98.6 million (column 8) more than the$320.2 million (column 6) of tax that would havebeen generated using ordinary tax computation.
For 2001, the 10.2 million returns which includedthe Schedule D capital gain tax computation gener-ated $245.4 billion in tax (column 7). If long-termcapital gains had been taxed the same as ordinaryincome, the amount of income tax before credits(regular tax computation) for these same taxpayerswould have been $281.5 billion (column 6). Thus, useof the Schedule D tax computation resulted in $36.1billion (column 8) less tax for 2001, a fall by more thanhalf from the $72.6-billion reduction for 2000 (column4) when 17.1 million taxpayers received some benefitfrom lower capital gain taxes (column 1). The aver-age tax savings fell from $4,248 per return for 2000to $3,537 for 2001. This reduction was attributableboth to the reduction in capital gains realized and tothe tax cuts implemented in EGTRRA which reducedthe level of taxation that would have applied in theabsence of the special capital gain tax rates.
Alternative Minimum TaxThe Revenue Act of 1978 established the alternativeminimum tax to ensure that a minimum amount ofincome tax was paid by taxpayers who might other-wise be able to legally reduce, or totally eliminate,their tax burden. The AMT provisions may recap-ture some of the tax reductions under the ordinaryincome tax. Form 6251, Alternative Minimum Tax--Individuals, is used to calculate AMT. (SeeAppendix E for an explanation of the computation ofincome for AMT purposes.)
Figure E presents statistics, by size of AGI, onthe AMT reported by taxpayers filing Form 6251with their returns. For 2001, AMT liability fell 29.6percent from its 2000 high to $6.8 billion. The fall inAMT coincided with a 19.3-percent decrease inAlternative Minimum Taxable Income (AMTI) for2001. The AMT fell more than AMTI because ofincreases in the AMT exemption amounts for 2001.
Figure F shows the number of taxpayers withAMT liability and the amount of that liability for eachof the years 1986 through 2001. Much of the varia-
tion in the number of taxpayers affected by the AMTand in the amount of AMT liability during the mid-to-late 1980’s and early 1990’s was attributable to taxlaw changes such as TRA86, RRA90 (RevenueReconciliation Act of 1990), and OBRA93, which werethe source of regular and AMT tax rate changes.Since then, the impact of the AMT has increasedpartially because the AMT exemptions have not beenindexed annually for the effects of inflation, whereasvarious parameters of the ordinary income tax (suchas tax brackets, exemptions, etc.) have been indexedannually for inflation. In June 2001, the impact of theAMT declined as AMT exemption amounts wereincreased statutorily by EGTRRA.
Income and Tax SharesHistorical statistics on income and tax by cumulativepercentiles (based on numbers of returns) arepresented in Tables 5 through 8. Distributions ofAGI, as defined for each year and tax or incomeitem, by descending and ascending cumulativepercentiles of returns, are presented in Tables 5 and6. These tables can be used to make comparisonsacross cumulative percentile classes within eachyear, among years within the ERTA81 period (i.e.,Tax Years 1982 through 1986), and among yearswithin the post-TRA86 period (i.e., Tax Years 1987through 2001). Since TRA86 redefined AGI, Tables5 and 6 are not as useful for comparisons betweenpre- and post-TRA86 years. Thus, Tables 7 and 8,which are based on a consistent definition of income(i.e., the 1979 Income Concept), are included tofacilitate such comparisons.
Tables 5 and 7, are based on percentiles of returnscumulated downward from the highest income re-turns. The data in Tables 5 and 7 are shown for thetop 1, 5, 10, 25, and 50 percent of returns. Tables 6and 8 are based on returns cumulated upward for thelowest income returns. Data are shown for thebottom 50, 75, 90, 95, and 99 percent of all returns.
Consider, for example, the data in Table 5 for the128.8 million returns filed for 2001 with positive AGI[9]. The average tax rate for these returns was 14.2percent, a 1.0-percentage point decrease from 2000.This was only the second time in the last 10 yearsthat the average tax rate has fallen, the other being in1998. The average tax rate on the top 1 percentileincreased slightly for 2001, while the average taxrate on the 5, 10, 25 and 50 percentiles decreased

15
Individual Income Tax Rates and Shares, 2001
from 2000. The 1, 5, 10, 25, and 50 percentiles allrecorded a larger share of the income tax burdenthan their respective shares of AGI. For 2001, thereturns in the top 1 percentile reported 17.5 percentof total AGI and 33.9 percent of income tax . Theamount of AGI needed for inclusion in this percentilegroup (i.e., the AGI floor) was $292,913. For 2000,the returns in this percentile group (i.e., those with atleast $313,469 in AGI) reported 20.8 percent of totalAGI and 37.4 percent of income tax generated. Thefall in both the share of AGI and income tax for thetop 1 percentile, and corresponding increase in the
average tax rate, was largely attributable to thereduction in net capital gains (less losses) for thesetaxpayers. This was the first time that the share ofAGI and income tax for returns in the top 1 percen-tile fell since 1993 and 1994, respectively.
For 2001, the returns in the top 5-percentile group(returns reporting AGI of $127,904 or more) reported32.0 percent of total AGI and 53.3 percent of incometax, less than the 35.3 percent and 56.5 percent,respectively, for 2000 (when the AGI floor was$128,336). For 2001, returns in the top 10-percentilegroup (returns with AGI of at least $92,754) earned
Figure E
Returns with Alternative Minimum Tax Computation Reported on Form 6251: Total Adjustments andPreferences, and Alternative Minimum Taxable Income and Tax, by Size of Adjusted Gross Income,Tax Years 2000 and 2001[Money amounts are in thousands of dollars]
Total adjustments and preferences ¹ Alternative minimum taxable income Alternative minimum tax
Size of adjusted gross income Number of returns Amount Number of returns Amount Number of returns Amount
(1) (2) (3) (4) (5) (6)
Tax Year 2001
All returns.............................................................................4,592,037 100,771,657 4,597,132 882,736,264 1,120,047 6,756,705 Under $1 ².............................................................................106,190 1,889,581 106,544 -7,726,068 4,649 94,531 $1 under $10,000.............................................................................309,982 1,046,724 310,030 1,122,367 341 4,225 $10,000 under $20,000.............................................................................256,655 1,153,904 256,655 2,880,714 4,010 8,267 $20,000 under $30,000.............................................................................210,848 1,163,511 210,871 4,399,782 1,472 6,680 $30,000 under $40,000.............................................................................198,549 1,282,994 198,609 5,826,148 4,596 7,002 $40,000 under $50,000.............................................................................207,675 1,664,953 207,795 8,045,248 20,688 17,702 $50,000 under $75,000.............................................................................566,150 5,425,665 567,004 30,916,546 93,712 131,362 $75,000 under $100,000.............................................................................537,308 7,012,547 538,453 41,370,355 143,871 277,858 $100,000 under $200,000.............................................................................1,149,155 20,361,438 1,150,178 143,838,113 418,268 1,169,972 $200,000 under $500,000.............................................................................775,973 23,668,224 776,911 209,328,128 352,603 2,332,675 $500,000 under $1,000,000.............................................................................165,906 9,538,219 166,203 103,946,143 50,676 892,284 $1,000,000 or more.............................................................................107,647 26,563,897 107,878 338,788,788 25,159 1,814,144
Tax Year 2000
All returns.............................................................................4,668,843 116,693,913 4,674,927 1,093,505,463 1,304,197 9,600,840 Under $1 ².............................................................................85,443 1,474,623 85,262 -4,680,793 3,823 100,636 $1 under $10,000.............................................................................314,222 1,026,652 314,222 1,417,120 3,058 8,131 $10,000 under $20,000.............................................................................241,475 1,248,547 241,475 3,121,189 5,724 5,760 $20,000 under $30,000.............................................................................189,486 989,525 189,486 4,146,827 3,544 8,260 $30,000 under $40,000.............................................................................209,270 1,418,881 209,270 6,624,480 12,493 14,323 $40,000 under $50,000.............................................................................215,047 1,486,481 215,048 8,658,725 20,063 19,819 $50,000 under $75,000.............................................................................594,332 5,638,126 594,528 33,107,110 121,906 168,366 $75,000 under $100,000.............................................................................568,183 6,675,031 571,240 44,771,889 177,433 244,174 $100,000 under $200,000.............................................................................1,097,292 20,063,494 1,099,350 141,514,523 437,004 1,531,783 $200,000 under $500,000.............................................................................832,265 26,342,935 832,654 231,645,543 416,198 3,340,500 $500,000 under $1,000,000.............................................................................187,674 12,198,541 187,992 122,178,405 66,860 1,438,572 $1,000,000 or more.............................................................................134,153 38,131,077 134,397 501,000,444 36,093 2,720,516 ¹ See Figures I-1 and I-2 for the calculation of alternative minimum taxable income and the list of alternative minimum tax adjustments and preferences.
² Includes returns with adjusted gross deficit.
NOTE: Detail may not add to totals because of rounding.

16
Individual Income Tax Rates and Shares, 2001
16
43.1 percent of AGI and paid 64.9 percent of incometax. For 2000, the returns in this percentile group(with AGI of $92,144 or more) reported 46.0 percentof total AGI and 67.3 percent of income tax. The top50-percentile group accounted for 86.2 percent ofincome and 96.0 percent of the income tax for 2001.
The statistics by percentile in Tables 5 and 6 foryears prior to 1991 and in Tables 7 and 8 for yearsprior to 1994 were estimated, using a mathematicaltechnique called “osculatory interpolation,” applied toaggregated data tabulated by income-size classes, inorder to distribute the tax returns within each class [10].For 1991 and later years, the statistics by percentilesin Tables 5 and 6 and Tables 7 and 8 for 1994through 2001 were computed based on an actualranking of the returns in the statistical sample thatserved as the basis for Individual Statistics of Incomeestimates. The differences under the two methodswere judged to be minor enough so that the pre-1991and post-1990 data are believed to be comparable.
Appendix A: Explanation of Selected TermsThis appendix provides brief explanations of themajor tax concepts discussed. For more extensive
definitions, see Individual Income Tax Returns 2001,Statistics of Income Division, Internal RevenueService, Publication 1304.
Adjusted Gross Income .--Adjusted grossincome is “total income,” as defined by the tax code,less “statutory adjustments” (primarily business,investment, or certain other deductions, such aspayments to a Keogh self-employed retirement plan,certain deductible contributions to an IndividualRetirement Arrangement (IRA), self-employedhealth insurance deductions, and one-half of SocialSecurity taxes for the self-employed). Total incomeincludes, for example, salaries and wages, taxableinterest, dividends, alimony, and net amounts fromsuch sources as business income, rents and royalties,and sales of capital assets.
Difference Due to Special Tax Computation.--For this article, the tax difference is the amount oftax resulting from using provisions of one of thespecial tax computations (Form 8615 or Schedule D)less the amount of tax that would have resulted fromnot having used any of these provisions (regulartax computation).
Form 8615 Tax Computation.--Form 8615 wasused to compute the tax on investment income ofchildren under age 14 who had investment income ofmore than $1,500. Generally, such income was taxedas the marginal income of the parents.
Income Tax Before Credits.--This amountconsisted of the tax liability on taxable income,computed by using the tax tables, tax rate schedules,Schedule D Tax worksheet, Schedule J, or Form8615, plus Form (s) 8814, and any additional taxesfrom Form 4972. Beginning for Tax Year 2001, thisamount also includes the Alternative Minimum Tax.
Income Tax Before Credits (Regular TaxComputation).--This amount consisted of the taxliability on ordinary income, computed by using thetax table or applying the rates from one of the fourtax rate schedules, plus any additional tax (tax onlump-sum distributions from qualified retirementplans). When Form 8615 tax was payable on invest-ment income of children, for this concept, all theincome was taxed at the child’s rate rather than atthe rate of the parents. When the Schedule D taxwas payable on net long-term capital gains, the taxwas based on the regular tax rates rather than the 8-percent, 10-percent, 20-percent, 25-percent, or28-percent tax rate for capital gains. This is in
Figure F
Alternative Minimum Tax, Tax Years 1986-2001[Tax rates are in percentages--money amounts are in thousands of dollars]
Higheststatutory Alternative minimum tax
Tax alternativeyear minimum Number
tax of Amount
rate returns
(1) (2) (3)1986...................................................................20 608,907 6,713,149 1987...................................................................21 139,779 1,674,898
1988...................................................................21 113,562 1,027,884 1989...................................................................21 117,483 831,012 1990...................................................................21 132,103 830,313 1991...................................................................24 243,672 1,213,426
1992...................................................................24 287,183 1,357,063 1993...................................................................28 334,615 2,052,790 1994...................................................................28 368,964 2,212,094 1995...................................................................28 414,106 2,290,576
1996...................................................................28 477,898 2,812,746 1997................................................................... 28 ¹ 618,072 4,005,101 1998................................................................... 28 ¹ 853,433 5,014,549 1999................................................................... 28 ¹ 1,018,063 6,477,697
2000................................................................... 28 ¹ 1,304,197 9,600,840 2001................................................................... 28 ¹ 1,120,047 6,756,705
¹ Top rate on most long term capital gains was 20 percent.
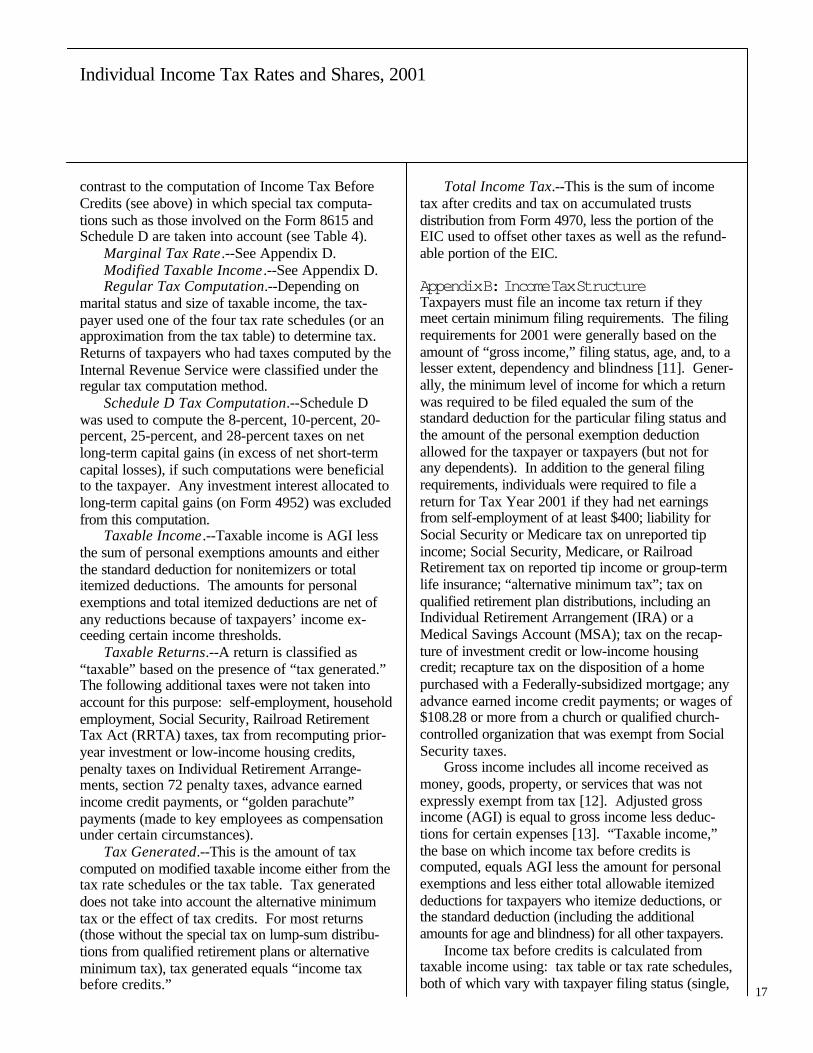
17
Individual Income Tax Rates and Shares, 2001
contrast to the computation of Income Tax BeforeCredits (see above) in which special tax computa-tions such as those involved on the Form 8615 andSchedule D are taken into account (see Table 4).
Marginal Tax Rate .--See Appendix D.Modified Taxable Income .--See Appendix D.Regular Tax Computation.--Depending on
marital status and size of taxable income, the tax-payer used one of the four tax rate schedules (or anapproximation from the tax table) to determine tax.Returns of taxpayers who had taxes computed by theInternal Revenue Service were classified under theregular tax computation method.
Schedule D Tax Computation.--Schedule Dwas used to compute the 8-percent, 10-percent, 20-percent, 25-percent, and 28-percent taxes on netlong-term capital gains (in excess of net short-termcapital losses), if such computations were beneficialto the taxpayer. Any investment interest allocated tolong-term capital gains (on Form 4952) was excludedfrom this computation.
Taxable Income.--Taxable income is AGI lessthe sum of personal exemptions amounts and eitherthe standard deduction for nonitemizers or totalitemized deductions. The amounts for personalexemptions and total itemized deductions are net ofany reductions because of taxpayers’ income ex-ceeding certain income thresholds.
Taxable Returns.--A return is classified as“taxable” based on the presence of “tax generated.”The following additional taxes were not taken intoaccount for this purpose: self-employment, householdemployment, Social Security, Railroad RetirementTax Act (RRTA) taxes, tax from recomputing prior-year investment or low-income housing credits,penalty taxes on Individual Retirement Arrange-ments, section 72 penalty taxes, advance earnedincome credit payments, or “golden parachute”payments (made to key employees as compensationunder certain circumstances).
Tax Generated.--This is the amount of taxcomputed on modified taxable income either from thetax rate schedules or the tax table. Tax generateddoes not take into account the alternative minimumtax or the effect of tax credits. For most returns(those without the special tax on lump-sum distribu-tions from qualified retirement plans or alternativeminimum tax), tax generated equals “income taxbefore credits.”
Total Income Tax.--This is the sum of incometax after credits and tax on accumulated trustsdistribution from Form 4970, less the portion of theEIC used to offset other taxes as well as the refund-able portion of the EIC.
Appendix B: Income Tax StructureTaxpayers must file an income tax return if theymeet certain minimum filing requirements. The filingrequirements for 2001 were generally based on theamount of “gross income,” filing status, age, and, to alesser extent, dependency and blindness [11]. Gener-ally, the minimum level of income for which a returnwas required to be filed equaled the sum of thestandard deduction for the particular filing status andthe amount of the personal exemption deductionallowed for the taxpayer or taxpayers (but not forany dependents). In addition to the general filingrequirements, individuals were required to file areturn for Tax Year 2001 if they had net earningsfrom self-employment of at least $400; liability forSocial Security or Medicare tax on unreported tipincome; Social Security, Medicare, or RailroadRetirement tax on reported tip income or group-termlife insurance; “alternative minimum tax”; tax onqualified retirement plan distributions, including anIndividual Retirement Arrangement (IRA) or aMedical Savings Account (MSA); tax on the recap-ture of investment credit or low-income housingcredit; recapture tax on the disposition of a homepurchased with a Federally-subsidized mortgage; anyadvance earned income credit payments; or wages of$108.28 or more from a church or qualified church-controlled organization that was exempt from SocialSecurity taxes.
Gross income includes all income received asmoney, goods, property, or services that was notexpressly exempt from tax [12]. Adjusted grossincome (AGI) is equal to gross income less deduc-tions for certain expenses [13]. “Taxable income,”the base on which income tax before credits iscomputed, equals AGI less the amount for personalexemptions and less either total allowable itemizeddeductions for taxpayers who itemize deductions, orthe standard deduction (including the additionalamounts for age and blindness) for all other taxpayers.
Income tax before credits is calculated fromtaxable income using: tax table or tax rate schedules,both of which vary with taxpayer filing status (single,

18
Individual Income Tax Rates and Shares, 2001
18
married filing jointly, surviving spouse, married filingseparately, and head of household); Form 8615 orForm 8814 for children’s investment income; Sched-ule D worksheet for net long-term capital gains; orsome combination of the above [14]. For 2001, thetax rates for each filing status were 8 percent, 10percent, 15 percent, 20 percent, 25 percent, 26 per-cent, 27.5 percent, 28 percent, 30.5 percent, 35.5percent, and 39.1 percent [15]. The tax rates of 8percent, 20 percent, 25 percent, and 28 percent wereonly for net long-term capital gains (in excess of netshort-term capital losses). Income tax before creditsincludes any alternative minimum tax. (See Appen-dix C for further details on these rates.)
To calculate their Federal income tax liability for2001, taxpayers used either the tax table or the taxrate schedules. Taxpayers with taxable income lessthan $100,000 were required to use the tax table,while those with taxable income of $100,000 or morewere required to use the tax rate schedules. The taxtable was based on income tax “brackets” up to $50wide [16]. The tax within each bracket was basedon the tax calculated at the midpoint of the bracketand then rounded to the nearest whole dollar. As aresult, the tax table and the tax rate schedules couldproduce different amounts of tax for the sameamount of taxable income. Use of the tax table couldhave produced either a slightly higher or loweramount of tax than that produced by the tax rateschedules. For taxpayers using the tax table withtaxable income that was subject to the 35.5-percentmarginal rate, the maximum difference in tax be-tween the tax rate schedules and the tax table was$9.25 [17]. However, for most taxpayers the actualdifference in tax was smaller.
Appendix C: Changes in Law for 2001Alternative Minimum Tax.--For Tax Year 2001,
The Economic Growth and Tax Relief ReconciliationAct of 2001 (EGTRRA) increased the AMT exemp-tion amounts as follows:
Filing Status 2000 2001Married filing jointly and surviving spouses $45,000 $49,000Married filing separately $22,500 $24,500Single $33,750 $35,750
Capital Gain Tax Rate.--The rate at which netcapital gain (less loss) that was held for at least 5years was lowered to 8 percent for 2001 for thoseindividuals who would otherwise have paid a 10-percent tax rate on these gains.
Child Tax Credit.--The amount of the child taxcredit was increased from $500 to $600 for 2001.The refundable portion of the child tax credit wasalso extended to families with fewer than threechildren. It was refundable up to 10 percent of theamount by which a taxpayer’s earned income ex-ceeded $10,000. Families with more than threechildren could choose the greater of this value, or theamount by which the taxpayer’s Social Security taxesexceeded his or her earned income credit.
Earned Income Credit.--The maximum amountof the earned income credit (EIC) increased, as didthe amounts of earned income and investment in-come an individual could have and still claim thecredit. The maximum amount of investment income(interest, dividends and capital gain income) a tax-payer could have and still claim the credit increasedto $2,450 from $2,400. The maximum credit fortaxpayers with no qualifying children increased to$364. For these taxpayers, earned income and modi-fied AGI had to be less than $10,710 (up from$10,380 for 2000). For taxpayers with one qualifyingchild, the maximum credit increased to $2,428, and,for taxpayers with two or more qualifying children,the maximum credit increased to $4,008. To beeligible for the credit, a taxpayers’ earned incomeand modified AGI had to be less than $28,281 for onequalifying child, or less than $32,121 for two or morequalifying children.
Foreign Earned Income Exclusion.--For TaxYear 2001, the amount of foreign earned income thatcould have been excluded from income per taxpayerincreased from $76,000 to $78,000.
Indexing.--The following items increased due toindexing for inflation: personal exemption amounts;the basic standard deduction amounts; and the taxbracket boundaries, the beginning income amountsfor limiting certain itemized deductions and for phas-ing out personal exemptions. The maximum amountof earnings subject to self-employment tax increasedbased on the percentage change in average coveredearnings.
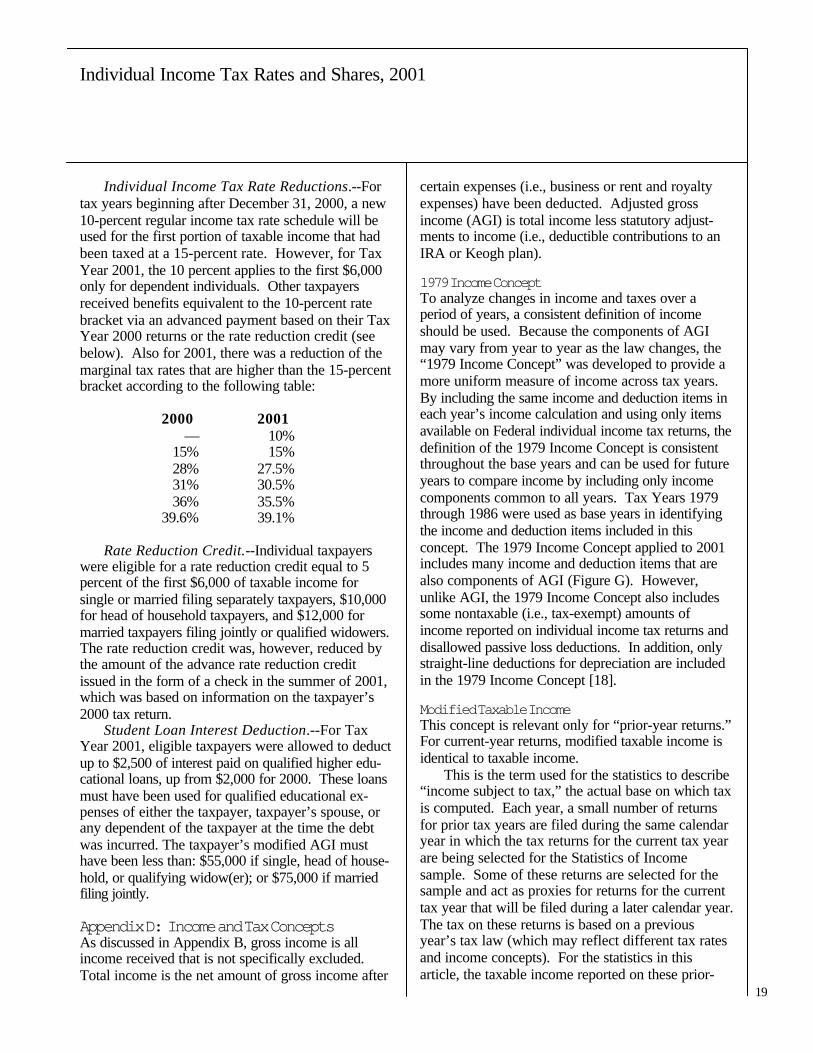
19
Individual Income Tax Rates and Shares, 2001
Individual Income Tax Rate Reductions.--Fortax years beginning after December 31, 2000, a new10-percent regular income tax rate schedule will beused for the first portion of taxable income that hadbeen taxed at a 15-percent rate. However, for TaxYear 2001, the 10 percent applies to the first $6,000only for dependent individuals. Other taxpayersreceived benefits equivalent to the 10-percent ratebracket via an advanced payment based on their TaxYear 2000 returns or the rate reduction credit (seebelow). Also for 2001, there was a reduction of themarginal tax rates that are higher than the 15-percentbracket according to the following table:
2000 2001— 10%
15% 15%28% 27.5%31% 30.5%36% 35.5%
39.6% 39.1%
Rate Reduction Credit.--Individual taxpayerswere eligible for a rate reduction credit equal to 5percent of the first $6,000 of taxable income forsingle or married filing separately taxpayers, $10,000for head of household taxpayers, and $12,000 formarried taxpayers filing jointly or qualified widowers.The rate reduction credit was, however, reduced bythe amount of the advance rate reduction creditissued in the form of a check in the summer of 2001,which was based on information on the taxpayer’s2000 tax return.
Student Loan Interest Deduction.--For TaxYear 2001, eligible taxpayers were allowed to deductup to $2,500 of interest paid on qualified higher edu-cational loans, up from $2,000 for 2000. These loansmust have been used for qualified educational ex-penses of either the taxpayer, taxpayer’s spouse, orany dependent of the taxpayer at the time the debtwas incurred. The taxpayer’s modified AGI musthave been less than: $55,000 if single, head of house-hold, or qualifying widow(er); or $75,000 if marriedfiling jointly.
Appendix D: Income and Tax ConceptsAs discussed in Appendix B, gross income is allincome received that is not specifically excluded.Total income is the net amount of gross income after
certain expenses (i.e., business or rent and royaltyexpenses) have been deducted. Adjusted grossincome (AGI) is total income less statutory adjust-ments to income (i.e., deductible contributions to anIRA or Keogh plan).
1979 Income ConceptTo analyze changes in income and taxes over aperiod of years, a consistent definition of incomeshould be used. Because the components of AGImay vary from year to year as the law changes, the“1979 Income Concept” was developed to provide amore uniform measure of income across tax years.By including the same income and deduction items ineach year’s income calculation and using only itemsavailable on Federal individual income tax returns, thedefinition of the 1979 Income Concept is consistentthroughout the base years and can be used for futureyears to compare income by including only incomecomponents common to all years. Tax Years 1979through 1986 were used as base years in identifyingthe income and deduction items included in thisconcept. The 1979 Income Concept applied to 2001includes many income and deduction items that arealso components of AGI (Figure G). However,unlike AGI, the 1979 Income Concept also includessome nontaxable (i.e., tax-exempt) amounts ofincome reported on individual income tax returns anddisallowed passive loss deductions. In addition, onlystraight-line deductions for depreciation are includedin the 1979 Income Concept [18].
Modified Taxable IncomeThis concept is relevant only for “prior-year returns.”For current-year returns, modified taxable income isidentical to taxable income.
This is the term used for the statistics to describe“income subject to tax,” the actual base on which taxis computed. Each year, a small number of returnsfor prior tax years are filed during the same calendaryear in which the tax returns for the current tax yearare being selected for the Statistics of Incomesample. Some of these returns are selected for thesample and act as proxies for returns for the currenttax year that will be filed during a later calendar year.The tax on these returns is based on a previousyear’s tax law (which may reflect different tax ratesand income concepts). For the statistics in thisarticle, the taxable income reported on these prior-

20
Individual Income Tax Rates and Shares, 2001
20
year returns is modified to equal an amount neces-sary to generate the tax actually shown on thesereturns using current-year rates.
Marginal Tax RatesUnder the progressive U.S. income tax rate struc-ture, different portions of taxable income are taxed atdifferent rates. Figure H illustrates how income taxis determined for a single taxpayer with AGI of$310,000 who used the standard deduction. Asshown in the example, five different tax rates wereapplied to the taxable income to arrive at total tax.The first $27,050 of taxable income were taxed at the15-percent rate; the next $38,500 were taxed at the
27.5-percent rate; the next $71,200 were taxed at the30.5-percent rate; the next $160,600 were taxed atthe 35.5-percent rate; and the remaining $8,100 weretaxed at the 39.1-percent rate. For purposes of thisarticle, the tax rate applied to the last dollar of income(given certain assumptions about which source ofincome provided the last dollar of income subject totax) is the marginal tax rate for that return. In theexample, the marginal tax rate is 39.1 percent.
Since the individual income tax structure includesvarious types of income, deductions, exclusions,credits, and taxes which are not subject to the sametreatment under tax laws, the marginal tax rate is notalways apparent. For instance, investment income ofa dependent under age 14 in excess of a specificamount is treated differently than salaries and wagesof the same dependent. The investment income inexcess of $1,500 was taxed at the marginal tax rateof the parents, whereas the salaries and wages weretaxed at the dependent’s own rate.
Calculating marginal tax rates for a specificindividual income tax return generally depends bothon the types and amounts of income reported and theassumptions made about the order in which theincome is taxed, in particular, which type of income isassumed to be received “last.” Additional complexityis added by the presence of such items as the alter-native minimum tax and various tax credits.
For this article, it is assumed that the income
Components of the 1979 Income Concept,Tax Year 2001Income or Loss: Salaries and wages ¹ Interest ¹ Dividends ¹ Taxable refunds ¹ Alimony received ¹ Capital gain distributions not reported on Schedule D ¹ Capital gains reported on Schedule D minus allowable losses ¹ Other gains and losses (Form 4797) ¹ Business net income or loss ¹ Farm net income or loss ¹ Rent net income or loss ¹ Royalty net income or loss ¹ Partnership net income or loss ¹ S corporation net income or loss ¹ Farm rental net income or loss ¹ Estate or trust net income or loss ¹ Unemployment compensation ¹ Depreciation in excess of straight-line depreciation ² Total pension income Other net income or loss Net operating loss ¹
Deductions: Disallowed passive losses (Form 8582) Moving expenses ¹ Alimony paid ¹ Unreimbursed business expenses
¹ Included in adjusted gross income (less deficit) (AGI) for Tax Year 2001. ² Adjustment to add back excess depreciation (accelerated over straight-line depreciation) deducted in the course of a trade or business and included in net income (loss) amounts shown above. ³ Includes taxable and tax-exempt pension and retirement distributions, including IRA distributions. Not fully included in AGI for Tax Year 2001. Includes an adjustment to add back amounts reported for the "foreign-earned income exclusion." Not included in AGI for Tax Year 2001.
44
5
6
6
5
3, 4
6
Income Tax Calculation for a Single Taxpayer With One Exemption Who Used the Standard Deduction, Tax Year 2001[Money amounts are in whole dollars]
Item Amount
Adjusted gross income.......................................................................................................................310,000
Less: Exemption amount.......................................................................................................................0¹ Standard deduction amount.......................................................................................................................4,550
Equals: Taxable income.......................................................................................................................305,450
Tax based on tax rates for single taxpayers:
First $27,050 taxed at 15 percent.......................................................................................................................4,058 Next $38,500 taxed at 27.5 percent.......................................................................................................................10,588 Next $71,200 taxed at 30.5 percent.......................................................................................................................21,716 Next $160,600 taxed at 35.5 percent.......................................................................................................................57,013 Next $8,100 taxed at 39.1 percent.......................................................................................................................3,167
Total tax from tax rate schedule.......................................................................................................................96,541 ¹ The exemption amount was phased out completely because AGI exceeded $255,450.
Figure G
Figure H

21
Individual Income Tax Rates and Shares, 2001
taxed at the marginal rate was the “last” incomereceived. The alternative minimum tax and incometax credits, such as the earned income credit, areexcluded in determining the marginal tax rates. Themarginal tax rate is defined as follows:
(1) If a return showed taxable income, the marginaltax rate of the return was the highest rate atwhich any amount of taxable income reportedon the return was taxed.
(2) If the return had no taxable income except fornet long-term capital gains and that amount wasless than or equal to the 15-percent tax bracketlimit, the return was defined as having an “8- or10-percent rate” marginal tax rate. If the returnhad taxable income (from other than net long-term capital gains) to which only the 15-percenttax rate applied, as well as net long-term capitalgains to which the 20-percent or 25-percent rateon the net gain applied, the return was definedas having a marginal tax rate equal to themaximum rate at which the net gains weretaxed. If the return had taxable income (fromother than net long-term capital gains) to whichthe 27.5-percent tax rate applied as the highestrate, as well as net long-term capital gains towhich the maximum 28-percent rate on net gainapplied, the return was defined as having a “28-percent (capital gains)” marginal tax rate.However, if the return had taxable income (fromother than net long-term capital gains) above themaximum amount to which the 27.5-percentapplied, as well as net long-term capital gains towhich the 28-percent rate on the net gainapplied, the return was classified as having thehighest rate at which any amount of taxableincome reported on the return was taxed.
(3) For returns of dependents with a Form 8615attached when the use of this form resulted inthe taxation of some of the dependent’s incomeas if it were that of the parents, the return wasclassified as having a “Form 8615” marginal taxrate (the returns in the Form 8615 classificationare not distributed by tax rate).
(4) For returns of parents choosing to report interestand dividend income of their dependents under
age 14 on their own (i.e., the parents’) returnusing Form 8814, when the dependent’s incomegenerated the only tax liability on the parent’sreturn, the return was classified with a “Form8814” marginal tax rate.
The classification of returns into marginal taxrate categories for Statistics of Income purposes wasessentially a function of filing status, size of taxableincome, presence of net long-term capital gains (inexcess of net short-term capital losses), and presenceof Form 8615 or Form 8814. Returns were classifiedinto one of the following thirteen mutually exclusivemarginal tax rate categories: (1) 8-percent rate; (2)10-percent rate; (3) 10-percent (capital gains); (4)Form 8814 (10-percent rate with no tax liability otherthan that generated by the dependent’s income); (5)15-percent rate; (6) 20-percent rate; (7) 25-percentrate; (8) 27.5-percent rate; (9) 28-percent rate; (10)30.5-percent rate; (11) 35.5-percent rate; (12) 39.1-percent rate; and (13) Form 8615 (with income taxedat any rate) [19].
Table 1 presents statistics by marginal tax rateclassification and filing status for returns with modi-fied taxable income. For each marginal rate classifi-cation, modified taxable income and “income taxgenerated” were computed “at all rates” and “ atmarginal rate.” The “at all rates” computations(columns 3 and 5) show the total amount of modifiedtaxable income or tax generated, tabulated by themarginal tax rate specified; each tax rate classifica-tion is mutually exclusive. The “at marginal rate”computations (columns 4 and 6) report the specificamounts of modified taxable income taxed and thetax generated at the marginal tax rate shown, for allreturns in each of the marginal rate classifications.The alternative minimum tax was not included in thestatistics by marginal tax rate.
The alternative minimum tax was not included inthe statistics by marginal tax rate. For example,consider returns in the “joint returns and returns ofsurviving spouses” filing status that were included inthe “39.1-percent” marginal tax rate classification.The total modified taxable income for the 713,981returns in this classification “at all rates” was $638.1billion (column 3), and the total tax generated was$214.5 billion (column 5). Approximately $346.5billion (column 4) of the modified taxable income were
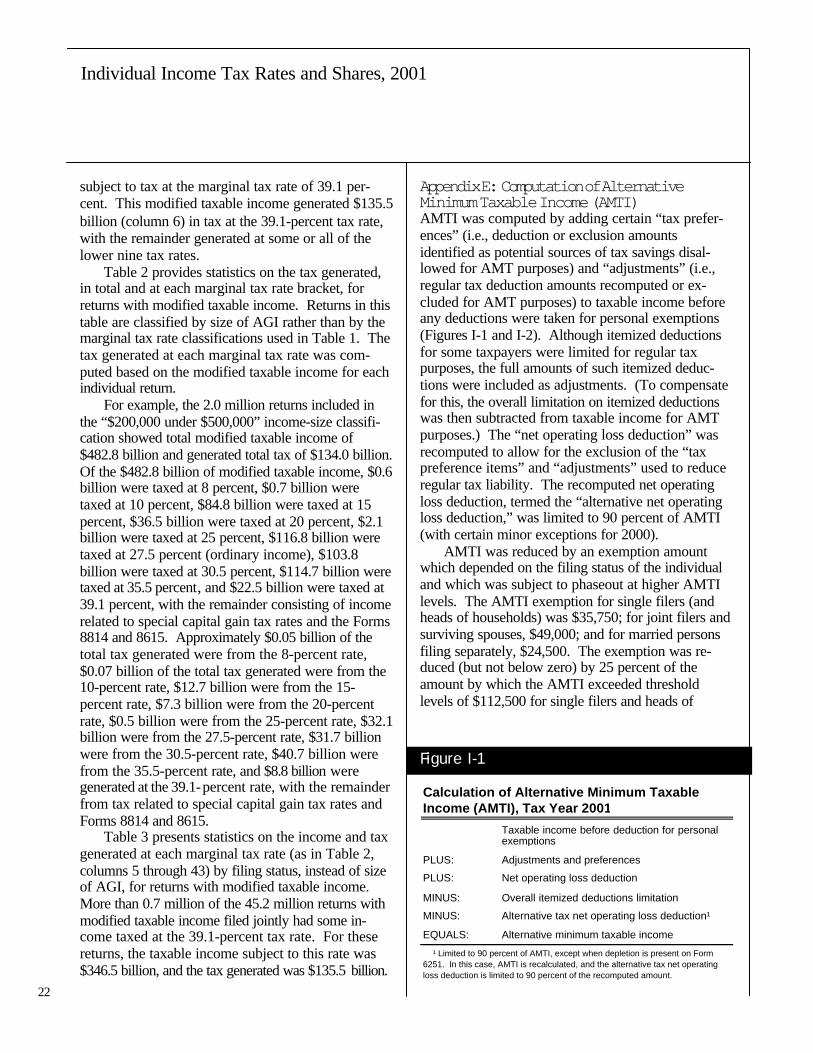
22
Individual Income Tax Rates and Shares, 2001
22
subject to tax at the marginal tax rate of 39.1 per-cent. This modified taxable income generated $135.5billion (column 6) in tax at the 39.1-percent tax rate,with the remainder generated at some or all of thelower nine tax rates.
Table 2 provides statistics on the tax generated,in total and at each marginal tax rate bracket, forreturns with modified taxable income. Returns in thistable are classified by size of AGI rather than by themarginal tax rate classifications used in Table 1. Thetax generated at each marginal tax rate was com-puted based on the modified taxable income for eachindividual return.
For example, the 2.0 million returns included inthe “$200,000 under $500,000” income-size classifi-cation showed total modified taxable income of$482.8 billion and generated total tax of $134.0 billion.Of the $482.8 billion of modified taxable income, $0.6billion were taxed at 8 percent, $0.7 billion weretaxed at 10 percent, $84.8 billion were taxed at 15percent, $36.5 billion were taxed at 20 percent, $2.1billion were taxed at 25 percent, $116.8 billion weretaxed at 27.5 percent (ordinary income), $103.8billion were taxed at 30.5 percent, $114.7 billion weretaxed at 35.5 percent, and $22.5 billion were taxed at39.1 percent, with the remainder consisting of incomerelated to special capital gain tax rates and the Forms8814 and 8615. Approximately $0.05 billion of thetotal tax generated were from the 8-percent rate,$0.07 billion of the total tax generated were from the10-percent rate, $12.7 billion were from the 15-percent rate, $7.3 billion were from the 20-percentrate, $0.5 billion were from the 25-percent rate, $32.1billion were from the 27.5-percent rate, $31.7 billionwere from the 30.5-percent rate, $40.7 billion werefrom the 35.5-percent rate, and $8.8 billion weregenerated at the 39.1-percent rate, with the remainderfrom tax related to special capital gain tax rates andForms 8814 and 8615.
Table 3 presents statistics on the income and taxgenerated at each marginal tax rate (as in Table 2,columns 5 through 43) by filing status, instead of sizeof AGI, for returns with modified taxable income.More than 0.7 million of the 45.2 million returns withmodified taxable income filed jointly had some in-come taxed at the 39.1-percent tax rate. For thesereturns, the taxable income subject to this rate was$346.5 billion, and the tax generated was $135.5 billion.
Appendix E: Computation of AlternativeMinimum Taxable Income (AMTI)AMTI was computed by adding certain “tax prefer-ences” (i.e., deduction or exclusion amountsidentified as potential sources of tax savings disal-lowed for AMT purposes) and “adjustments” (i.e.,regular tax deduction amounts recomputed or ex-cluded for AMT purposes) to taxable income beforeany deductions were taken for personal exemptions(Figures I-1 and I-2). Although itemized deductionsfor some taxpayers were limited for regular taxpurposes, the full amounts of such itemized deduc-tions were included as adjustments. (To compensatefor this, the overall limitation on itemized deductionswas then subtracted from taxable income for AMTpurposes.) The “net operating loss deduction” wasrecomputed to allow for the exclusion of the “taxpreference items” and “adjustments” used to reduceregular tax liability. The recomputed net operatingloss deduction, termed the “alternative net operatingloss deduction,” was limited to 90 percent of AMTI(with certain minor exceptions for 2000).
AMTI was reduced by an exemption amountwhich depended on the filing status of the individualand which was subject to phaseout at higher AMTIlevels. The AMTI exemption for single filers (andheads of households) was $35,750; for joint filers andsurviving spouses, $49,000; and for married personsfiling separately, $24,500. The exemption was re-duced (but not below zero) by 25 percent of theamount by which the AMTI exceeded thresholdlevels of $112,500 for single filers and heads of
Calculation of Alternative Minimum TaxableIncome (AMTI), Tax Year 2001
Taxable income before deduction for personalexemptions
PLUS: Adjustments and preferences
PLUS: Net operating loss deduction
MINUS: Overall itemized deductions limitation
MINUS: Alternative tax net operating loss deduction¹
EQUALS: Alternative minimum taxable income
¹ Limited to 90 percent of AMTI, except when depletion is present on Form6251. In this case, AMTI is recalculated, and the alternative tax net operating loss deduction is limited to 90 percent of the recomputed amount.
Figure I-1

23
Individual Income Tax Rates and Shares, 2001
Alternative Minimum Tax Adjustments and Preferences, Tax Year 2001 Standard deduction
Medical and dental expenses from Schedule A (the lesser of deductible medical and dental expenses or 2.5 percent of AGI)
Deductions for State and local income, real estate, personal property, and foreign taxes
Deductions for interest on certain home mortgages not used to buy, build, or improve the taxpayer's main home or second home
Miscellaneous itemized deductions subject to the 2-percent-of-AGI limitation
Refunds of State and local income, real estate, personal property, and foreign taxes previously deducted (negative)
Investment interest expense (the result could be negative)
Excess of depreciation on property placed in service after 1986 over less liberal methods allowed for alternative minimum tax (AMT) purposes (straight-line or 150-percent declining balance method, depending on the type of property; the result could be negative)
Adjustment of gain or loss on property, the basis of which was affected by accelerated depreciation or rapid amortization and which was reduced for AMT purposes (the result could be negative)
Incentive stock options which were exercised after 1987 (the amount by which the value of the option when exercised exceeded the price paid by the taxpayer; the result could be negative)
Passive activity gains and losses allowed for regular tax purposes for activities acquired before October 23, 1986, taking into account AMT adjustments and preference items and any AMT prior-year unallowed losses (the result could be negative)
Difference between income distributions to beneficiaries of estates and trusts for regular tax purposes and the amounts refigured for AMT purposes (the result could be negative)
Tax-exempt interest from private activity bonds issued after August 7, 1986
Excess of circulation expenditures paid or incurred after 1986 over allowable amortization if the expenditures were capitalized (the result could be negative)
Excess of percentage depletion deduction for sections 611 and 613 property over the adjusted basis (the result could be negative)
Excess of accelerated depreciation on property placed in service before 1987 over straight-line depreciation as refigured for AMT purposes
Adjustment from disallowing the installment sales method of accounting for sales of inventory and stock in trade after March 1, 1986, with certain exceptions (the result could be negative)
Amount by which excess intangible drilling costs deducted currently over allowable amortization (if these costs were capitalized) were more than 65 percent of the taxpayer's "net income" from oil, gas, and geothermal wells, with exceptions for independent oil producers and royalty owners
Amount of net section 1231 gain or loss other than due to casualty or theft from large partnerships
Deferred income from long-term contracts entered into after February 28, 1986, with certain exceptions and limitations (the result could be negative)
Adjustment for refigured loss from activities in which allowable losses from partnerships or S corporations were limited by "at-risk" and other rules, taking into account AMT adjustments and preference items (the result could be negative)
Excess of mining exploration and development costs paid or incurred after 1986 over allowable amortization if the expenditures were capitalized (the result could be negative)
Adjustment for taxable distributions received from a cooperative (total AMT patronage dividend and per-unit retain allocation adjustment)
Excess of rapid amortization of pollution control facilities placed in service after 1986 over otherwise allowable depreciation (the result could be negative)
Excess of research and experimental expenditures paid or incurred after 1986 over allowable amortization if the expenditures were capitalized (the result could be negative)
Excluded gain, under the section 1202 gain on qualified small business stock held more than 5 years, multiplied by 42 percent
Adjustment for refigured tax shelter farm losses, taking into account AMT adjustments and preference items (the result could be negative)
Related adjustments, refigured for AMT purposes, including section 179 expense deduction, expenses for business or rental use of the home, conservation expenses, taxable IRA distributions, self-employed health insurance deduction, Keogh retirement plan or self-employed SEP deduction, and IRA deductions (the result could be negative)
Figure I-2

24
Individual Income Tax Rates and Shares, 2001
24
households, $150,000 for joint filers, and $75,000 formarried persons filing separately. The exemptionwas phased out completely for individuals whosefiling status was single or head of household, marriedfiling jointly, and married filing separately, at $247,500,$330,000, and $165,000, of AMTI, respectively.
After reduction by the exemption, the first$175,000 ($87,500 if married filing separately) of theremaining AMTI were subject to tax at a 26-percentrate, with any excess taxed at a 28-percent rate.However, capital gains (recalculated for AMT pur-poses) that were taxed at lower rates (8 percent, 10percent, 20 percent, and 25 percent) were tax atthese same rates for the AMT, with the rest ofAMTI being taxed at the rates mentioned above (26percent or 28 percent). The resulting tax was re-duced by the “alternative minimum tax foreign taxcredit,” which produced a “tentative minimum tax.”Tentative minimum tax was further reduced by theindividual’s regular tax before credits (excluding taxon lump-sum distributions from qualified retirementplans) less the foreign tax credit (for regular taxpurposes) to yield the alternative minimum tax.
Dependents under the age of 14 with investmentincome over a certain amount who filed their ownreturns were subject to special rules for AMT pur-poses. These rules required that the dependents paythe same amount of AMT as their parents wouldhave paid if the parents included the dependents’incomes on their own tax returns. (Dependents filingtheir own returns were limited to an AMT exemptionof $5,200 plus their “earned income.” Thedependent’s AMT could be reduced if the parentshad regular tax greater than the child’s own tentativeminimum tax, or if any other dependent under age 14of the same parents had regular tax greater than thisdependent’s own tentative minimum tax.)
Appendix F: Data Sources and LimitationsThese statistics are based on a sample of individualincome tax returns (Forms 1040, 1040A, and 1040EZ,including electronically-filed returns) filed duringCalendar Year 2002. Returns in the sample werestratified based on: (1) the larger of positive incomeor negative income; (2) the size of business and farmreceipts; (3) the presence or absence of specificforms or schedules; and (4) the usefulness of returnsfor tax policy modeling purposes [20]. Returns werethen selected at rates ranging from 0.05 percent to
100 percent. The 2001 data are based on a sampleof 191,975 returns and an estimated final populationof 130,571,421 returns. The corresponding sampleand population for the 2000 data were 196,150 and129,644,980 returns, respectively.
Since the data presented here are estimatesbased on a sample of returns filed, they are subject tosampling error. To properly use the statistical dataprovided, the magnitude of the potential samplingerror must be known; coefficients of variation (CV’s)are used to measure that magnitude. Figure J showsestimated CV’s for the numbers of returns andmoney amounts for selected income items. Thereliability of estimates based on samples, and the useof coefficients of variation for evaluating the preci-sion of estimates based on samples, are discussed inthe appendix to this issue of the Bulletin.
Notes and References[1] For Tax Years 1988 through 1990, the tax rate
schedules provided only two basic rates: 15percent and 28 percent. However, taxableincome over certain levels was subject to a 33-percent tax rate to phase out the benefit of the15-percent tax bracket (as compared to the 28-percent rate) and the deduction for personalexemptions. At the taxable income level wherethese benefits were completely phased out, thetax rate returned to 28 percent.
[2] Individual Income Tax Returns, Statistics ofIncome Division, Internal Revenue Service,Publication 1304, Years 1953 through 2001.
[3] U.S. Department of Labor, Bureau of LaborStatistics, Monthly Labor Review. The con-sumer price index (CPI-U) represents annualaverages of monthly figures and reflects thebuying of typical urban consumers (1982-84=100):
Year CPI-U2001 177.12000 172.2
[4] Nontaxable (i.e., tax-exempt) forms of income,such as interest on State and local governmentobligations, were not included in AGI andgenerally did not affect the marginal tax rate.However, in some situations the receipt of someforms of tax-exempt income, such as tax-
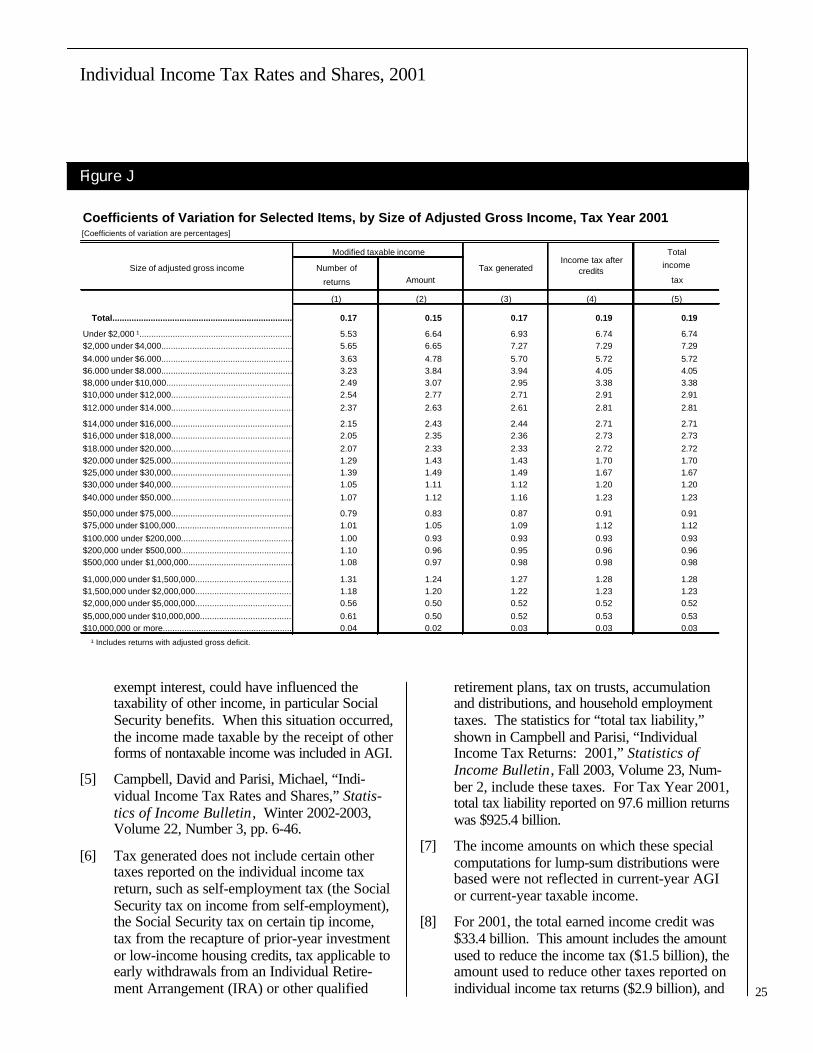
25
Individual Income Tax Rates and Shares, 2001
exempt interest, could have influenced thetaxability of other income, in particular SocialSecurity benefits. When this situation occurred,the income made taxable by the receipt of otherforms of nontaxable income was included in AGI.
[5] Campbell, David and Parisi, Michael, “Indi-vidual Income Tax Rates and Shares,” Statis-tics of Income Bulletin, Winter 2002-2003,Volume 22, Number 3, pp. 6-46.
[6] Tax generated does not include certain othertaxes reported on the individual income taxreturn, such as self-employment tax (the SocialSecurity tax on income from self-employment),the Social Security tax on certain tip income,tax from the recapture of prior-year investmentor low-income housing credits, tax applicable toearly withdrawals from an Individual Retire-ment Arrangement (IRA) or other qualified
retirement plans, tax on trusts, accumulationand distributions, and household employmenttaxes. The statistics for “total tax liability,”shown in Campbell and Parisi, “IndividualIncome Tax Returns: 2001,” Statistics ofIncome Bulletin, Fall 2003, Volume 23, Num-ber 2, include these taxes. For Tax Year 2001,total tax liability reported on 97.6 million returnswas $925.4 billion.
[7] The income amounts on which these specialcomputations for lump-sum distributions werebased were not reflected in current-year AGIor current-year taxable income.
[8] For 2001, the total earned income credit was$33.4 billion. This amount includes the amountused to reduce the income tax ($1.5 billion), theamount used to reduce other taxes reported onindividual income tax returns ($2.9 billion), and
Figure J
Coefficients of Variation for Selected Items, by Size of Adjusted Gross Income, Tax Year 2001[Coefficients of variation are percentages]
Modified taxable income Total
Size of adjusted gross income Number of Tax generated income
returns Amount tax
(1) (2) (3) (4) (5)
Total................................................................................... 0.17 0.15 0.17 0.19 0.19
Under $2,000 ¹................................................................................... 5.53 6.64 6.93 6.74 6.74 $2,000 under $4,000...................................................................................5.65 6.65 7.27 7.29 7.29 $4,000 under $6,000...................................................................................3.63 4.78 5.70 5.72 5.72 $6,000 under $8,000...................................................................................3.23 3.84 3.94 4.05 4.05 $8,000 under $10,000...................................................................................2.49 3.07 2.95 3.38 3.38 $10,000 under $12,000...................................................................................2.54 2.77 2.71 2.91 2.91 $12,000 under $14,000...................................................................................2.37 2.63 2.61 2.81 2.81
$14,000 under $16,000...................................................................................2.15 2.43 2.44 2.71 2.71 $16,000 under $18,000...................................................................................2.05 2.35 2.36 2.73 2.73 $18,000 under $20,000...................................................................................2.07 2.33 2.33 2.72 2.72 $20,000 under $25,000...................................................................................1.29 1.43 1.43 1.70 1.70 $25,000 under $30,000...................................................................................1.39 1.49 1.49 1.67 1.67 $30,000 under $40,000...................................................................................1.05 1.11 1.12 1.20 1.20 $40,000 under $50,000...................................................................................1.07 1.12 1.16 1.23 1.23
$50,000 under $75,000...................................................................................0.79 0.83 0.87 0.91 0.91 $75,000 under $100,000...................................................................................1.01 1.05 1.09 1.12 1.12 $100,000 under $200,000...................................................................................1.00 0.93 0.93 0.93 0.93 $200,000 under $500,000...................................................................................1.10 0.96 0.95 0.96 0.96 $500,000 under $1,000,000...................................................................................1.08 0.97 0.98 0.98 0.98
$1,000,000 under $1,500,000........................................ 1.31 1.24 1.27 1.28 1.28 $1,500,000 under $2,000,000........................................ 1.18 1.20 1.22 1.23 1.23 $2,000,000 under $5,000,000........................................ 0.56 0.50 0.52 0.52 0.52 $5,000,000 under $10,000,000...................................... 0.61 0.50 0.52 0.53 0.53 $10,000,000 or more...................................................................................0.04 0.02 0.03 0.03 0.03
¹ Includes returns with adjusted gross deficit.
Income tax after credits

26
Individual Income Tax Rates and Shares, 2001
26
the amount refunded to taxpayers ($29.0billion). Table 4 in Campbell and Parisi, “Indi-vidual Income Tax Returns: 2001,” Statisticsof Income Bulletin, Fall 2003, Volume 23,Number 2, shows these amounts.
[9] The percentile groupings of tax filers excludereturns with zero or negative AGI.
[10] For an explanation of the osculatory interpola-tion technique, see Oh, H. Lock, “OsculatoryInterpolation with a Monotonicity Constraint,”1977 Proceedings of the American Statisti-cal Association, Section on StatisticalComputing, 1978.
[11] Taxpayers fall into one of five filing statuses:single; married filing jointly; married filingseparately; head of household; or survivingspouse. Being age 65 or older or being legallyblind affects the amount of the standard deduc-tion and, hence, the filing requirements. Tax-payers who are (or could be) dependents ofother taxpayers have different filing require-ments. For more information on the generalfiling requirements, see Campbell and Parisi,“Individual Income Tax Returns: 2001,”Statistics of Income Bulletin, Fall 2003,Volume 23, Number 2.
[12] As defined under section 61 of the InternalRevenue Code, gross income includes amountsfrom wages and salaries, interest and dividends,alimony, bartering income, canceled debtincome, gambling winnings, rents and royalties,and gains from property sales or exchanges, aswell as gross income from sole proprietorshipsand farming, income from partnerships and Scorporations, and distributions from estates andtrusts. This definition of gross income is slightlydifferent from the Form 1040, U.S. IndividualIncome Tax Return, concept of “total income,”which is a component of the adjusted grossincome (AGI) calculation on Form 1040. Totalincome includes net amounts rather than grossamounts (income prior to deductions) from suchitems as business income and rents and royalties.
[13] As defined under Internal Revenue Codesection 62, deductible expenses are thoseincurred in the course of a trade or business or
in connection with rents and royalties; lossesfrom property sales or exchanges; and certainstatutory adjustments, such as deductiblecontributions to an IRA or Keogh plan, movingexpenses, or the health insurance deduction forcertain self-employed taxpayers.
[14] Income tax before credits includes tax onlump-sum distributions from qualified retire-ment plans.
[15] The 26-percent tax rate is for AMT purposes only.
[16] For taxable income between $0 and $5 andbetween $5 and $25, the tax brackets were $5and $10 wide, respectively. For taxable incomebetween $25 and $3,000, the brackets were $25wide. Brackets for taxable income above$3,000 were $50 wide.
[17] For example, assume a taxpayer filing as “marriedfiling separately” reported taxable income of$85,000. Using the tax table, the tax would be$21,558, but, using the tax rate schedules, thetax would be $21,548.75, a difference of $9.25.
[18] For more details on the income computationunder the 1979 Income Concept for 2001, seeIndividual Income Tax Returns, 2001,Statistics of Income Division, Internal RevenueService, Publication 1304.
[19] For some taxpayers, the statutory marginal taxrate may differ from the effective marginal taxrate. For example, extra income received bycertain taxpayers may result in the phaseout oftheir personal exemptions as well as some oftheir itemized deductions. Therefore, an extra$1 of income could add more than $1 of taxableincome. While this taxpayer could face astatutory marginal tax rate of 30.5 percent, theeffective marginal rate faced by the taxpayerwould be somewhat higher.
[20] Returns in the sample were stratified based onthe presence or absence of one or more of thefollowing forms or schedules: Form 2555,Foreign Earned Income; Form 1116, ForeignTax Credit (Individual, Fiduciary, or Non-resident Alien Individual); Schedule C, Profitor Loss from Business (Sole Proprietorship);and Schedule F, Profit or Loss From Farming.
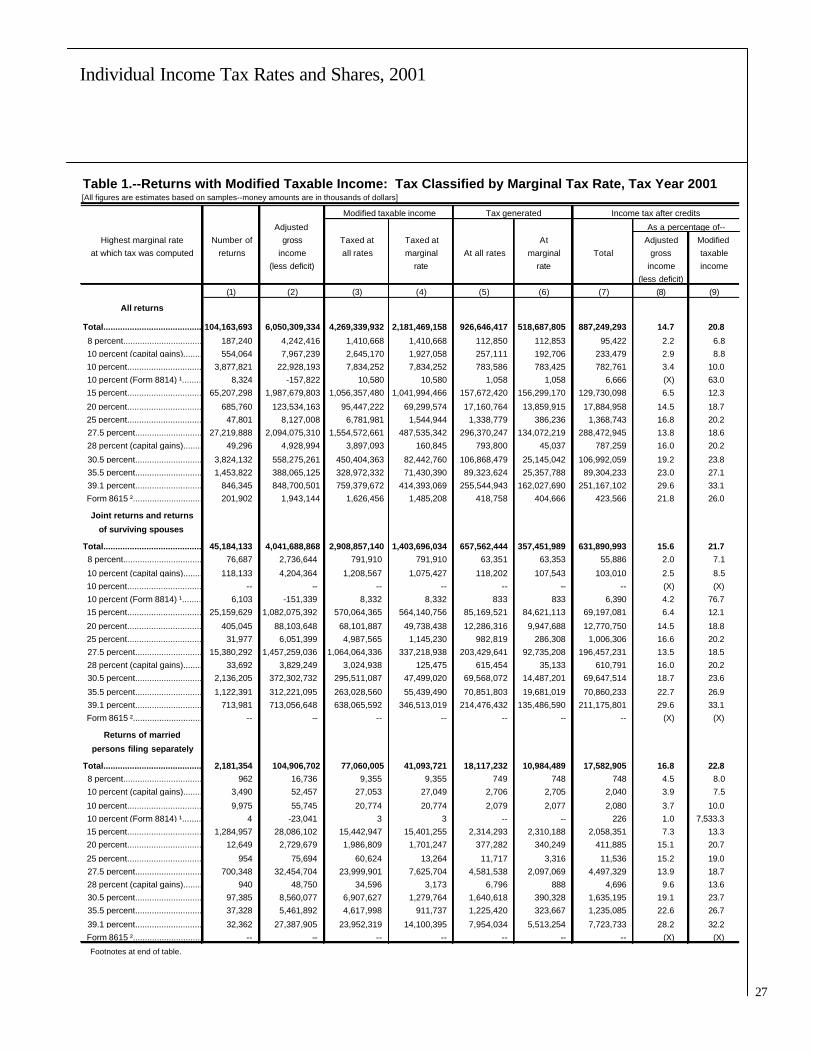
27
Individual Income Tax Rates and Shares, 2001
Table 1.--Returns with Modified Taxable Income: Tax Classified by Marginal Tax Rate, Tax Year 2001[All figures are estimates based on samples--money amounts are in thousands of dollars]
Modified taxable income Tax generated Income tax after credits
Adjusted As a percentage of--Highest marginal rate Number of gross Taxed at Taxed at At Adjusted Modified
at which tax was computed returns income all rates marginal At all rates marginal Total gross taxable(less deficit) rate rate income income
(less deficit)(1) (2) (3) (4) (5) (6) (7) (8) (9)
All returns
Total..................................................................................................................104,163,693 6,050,309,334 4,269,339,932 2,181,469,158 926,646,417 518,687,805 887,249,293 14.7 20.8
8 percent..................................................................................................................187,240 4,242,416 1,410,668 1,410,668 112,850 112,853 95,422 2.2 6.8 10 percent (capital gains)..................................................................................................................554,064 7,967,239 2,645,170 1,927,058 257,111 192,706 233,479 2.9 8.8 10 percent..................................................................................................................3,877,821 22,928,193 7,834,252 7,834,252 783,586 783,425 782,761 3.4 10.0 10 percent (Form 8814) ¹..................................................................................................................8,324 -157,822 10,580 10,580 1,058 1,058 6,666 (X) 63.0 15 percent..................................................................................................................65,207,298 1,987,679,803 1,056,357,480 1,041,994,466 157,672,420 156,299,170 129,730,098 6.5 12.3
20 percent..................................................................................................................685,760 123,534,163 95,447,222 69,299,574 17,160,764 13,859,915 17,884,958 14.5 18.7 25 percent..................................................................................................................47,801 8,127,008 6,781,981 1,544,944 1,338,779 386,236 1,368,743 16.8 20.2 27.5 percent..................................................................................................................27,219,888 2,094,075,310 1,554,572,661 487,535,342 296,370,247 134,072,219 288,472,945 13.8 18.6 28 percent (capital gains)..................................................................................................................49,296 4,928,994 3,897,093 160,845 793,800 45,037 787,259 16.0 20.2
30.5 percent..................................................................................................................3,824,132 558,275,261 450,404,363 82,442,760 106,868,479 25,145,042 106,992,059 19.2 23.8 35.5 percent..................................................................................................................1,453,822 388,065,125 328,972,332 71,430,390 89,323,624 25,357,788 89,304,233 23.0 27.1 39.1 percent..................................................................................................................846,345 848,700,501 759,379,672 414,393,069 255,544,943 162,027,690 251,167,102 29.6 33.1 Form 8615 ²..................................................................................................................201,902 1,943,144 1,626,456 1,485,208 418,758 404,666 423,566 21.8 26.0
Joint returns and returns
of surviving spouses
Total..................................................................................................................45,184,133 4,041,688,868 2,908,857,140 1,403,696,034 657,562,444 357,451,989 631,890,993 15.6 21.7 8 percent..................................................................................................................76,687 2,736,644 791,910 791,910 63,351 63,353 55,886 2.0 7.1
10 percent (capital gains)..................................................................................................................118,133 4,204,364 1,208,567 1,075,427 118,202 107,543 103,010 2.5 8.5 10 percent..................................................................................................................-- -- -- -- -- -- -- (X) (X) 10 percent (Form 8814) ¹..................................................................................................................6,103 -151,339 8,332 8,332 833 833 6,390 4.2 76.7 15 percent..................................................................................................................25,159,629 1,082,075,392 570,064,365 564,140,756 85,169,521 84,621,113 69,197,081 6.4 12.1
20 percent..................................................................................................................405,045 88,103,648 68,101,887 49,738,438 12,286,316 9,947,688 12,770,750 14.5 18.8 25 percent..................................................................................................................31,977 6,051,399 4,987,565 1,145,230 982,819 286,308 1,006,306 16.6 20.2 27.5 percent..................................................................................................................15,380,292 1,457,259,036 1,064,064,336 337,218,938 203,429,641 92,735,208 196,457,231 13.5 18.5 28 percent (capital gains)..................................................................................................................33,692 3,829,249 3,024,938 125,475 615,454 35,133 610,791 16.0 20.2 30.5 percent..................................................................................................................2,136,205 372,302,732 295,511,087 47,499,020 69,568,072 14,487,201 69,647,514 18.7 23.6
35.5 percent..................................................................................................................1,122,391 312,221,095 263,028,560 55,439,490 70,851,803 19,681,019 70,860,233 22.7 26.9 39.1 percent..................................................................................................................713,981 713,056,648 638,065,592 346,513,019 214,476,432 135,486,590 211,175,801 29.6 33.1 Form 8615 ²..................................................................................................................-- -- -- -- -- -- -- (X) (X)
Returns of married
persons filing separately
Total..................................................................................................................2,181,354 104,906,702 77,060,005 41,093,721 18,117,232 10,984,489 17,582,905 16.8 22.8 8 percent..................................................................................................................962 16,736 9,355 9,355 749 748 748 4.5 8.0 10 percent (capital gains)..................................................................................................................3,490 52,457 27,053 27,049 2,706 2,705 2,040 3.9 7.5
10 percent..................................................................................................................9,975 55,745 20,774 20,774 2,079 2,077 2,080 3.7 10.0 10 percent (Form 8814) ¹..................................................................................................................4 -23,041 3 3 -- -- 226 1.0 7,533.3 15 percent..................................................................................................................1,284,957 28,086,102 15,442,947 15,401,255 2,314,293 2,310,188 2,058,351 7.3 13.3 20 percent..................................................................................................................12,649 2,729,679 1,986,809 1,701,247 377,282 340,249 411,885 15.1 20.7
25 percent..................................................................................................................954 75,694 60,624 13,264 11,717 3,316 11,536 15.2 19.0 27.5 percent..................................................................................................................700,348 32,454,704 23,999,901 7,625,704 4,581,538 2,097,069 4,497,329 13.9 18.7 28 percent (capital gains)..................................................................................................................940 48,750 34,596 3,173 6,796 888 4,696 9.6 13.6 30.5 percent..................................................................................................................97,385 8,560,077 6,907,627 1,279,764 1,640,618 390,328 1,635,195 19.1 23.7 35.5 percent..................................................................................................................37,328 5,461,892 4,617,998 911,737 1,225,420 323,667 1,235,085 22.6 26.7
39.1 percent..................................................................................................................32,362 27,387,905 23,952,319 14,100,395 7,954,034 5,513,254 7,723,733 28.2 32.2 Form 8615 ²..................................................................................................................-- -- -- -- -- -- -- (X) (X)
Footnotes at end of table.
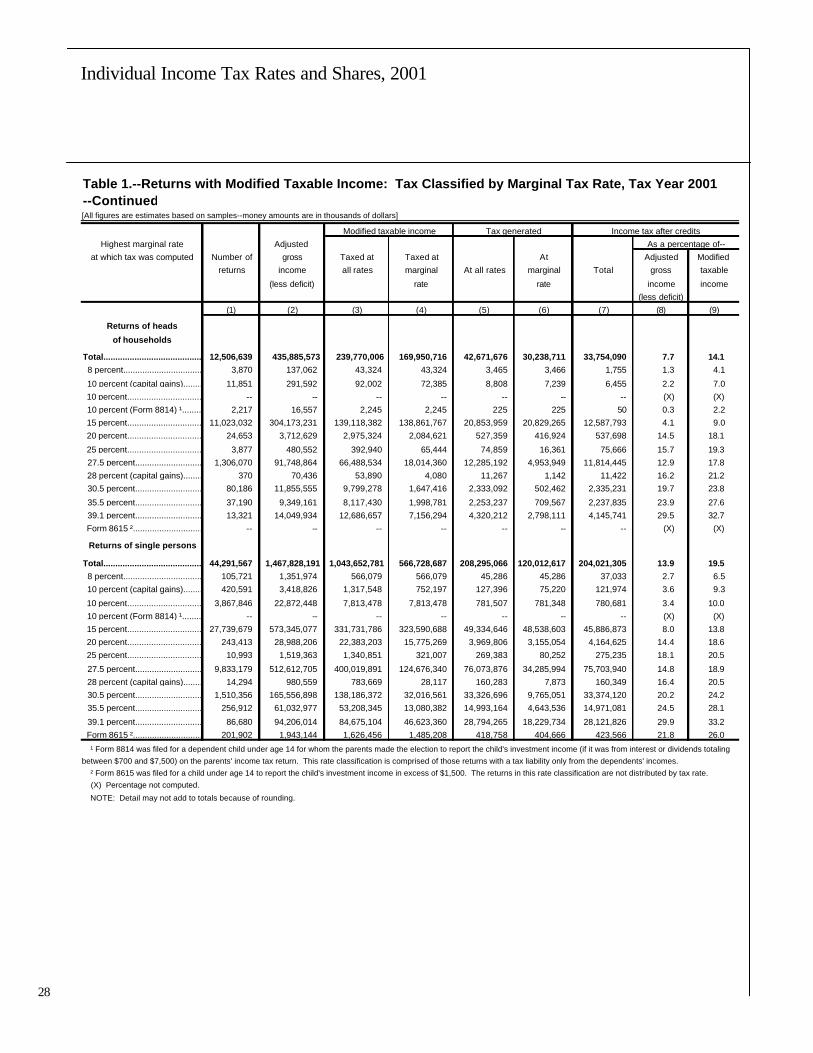
28
Individual Income Tax Rates and Shares, 2001
28
Table 1.--Returns with Modified Taxable Income: Tax Classified by Marginal Tax Rate, Tax Year 2001--Continued[All figures are estimates based on samples--money amounts are in thousands of dollars]
Modified taxable income Tax generated Income tax after creditsHighest marginal rate Adjusted As a percentage of--
at which tax was computed Number of gross Taxed at Taxed at At Adjusted Modifiedreturns income all rates marginal At all rates marginal Total gross taxable
(less deficit) rate rate income income(less deficit)
(1) (2) (3) (4) (5) (6) (7) (8) (9)
Returns of heads
of households
Total..................................................................................................................12,506,639 435,885,573 239,770,006 169,950,716 42,671,676 30,238,711 33,754,090 7.7 14.1 8 percent..................................................................................................................3,870 137,062 43,324 43,324 3,465 3,466 1,755 1.3 4.1
10 percent (capital gains)..................................................................................................................11,851 291,592 92,002 72,385 8,808 7,239 6,455 2.2 7.0 10 percent..................................................................................................................-- -- -- -- -- -- -- (X) (X) 10 percent (Form 8814) ¹..................................................................................................................2,217 16,557 2,245 2,245 225 225 50 0.3 2.2 15 percent..................................................................................................................11,023,032 304,173,231 139,118,382 138,861,767 20,853,959 20,829,265 12,587,793 4.1 9.0 20 percent..................................................................................................................24,653 3,712,629 2,975,324 2,084,621 527,359 416,924 537,698 14.5 18.1
25 percent..................................................................................................................3,877 480,552 392,940 65,444 74,859 16,361 75,666 15.7 19.3 27.5 percent..................................................................................................................1,306,070 91,748,864 66,488,534 18,014,360 12,285,192 4,953,949 11,814,445 12.9 17.8 28 percent (capital gains)..................................................................................................................370 70,436 53,890 4,080 11,267 1,142 11,422 16.2 21.2 30.5 percent..................................................................................................................80,186 11,855,555 9,799,278 1,647,416 2,333,092 502,462 2,335,231 19.7 23.8
35.5 percent..................................................................................................................37,190 9,349,161 8,117,430 1,998,781 2,253,237 709,567 2,237,835 23.9 27.6 39.1 percent..................................................................................................................13,321 14,049,934 12,686,657 7,156,294 4,320,212 2,798,111 4,145,741 29.5 32.7 Form 8615 ²..................................................................................................................-- -- -- -- -- -- -- (X) (X)
Returns of single persons
Total..................................................................................................................44,291,567 1,467,828,191 1,043,652,781 566,728,687 208,295,066 120,012,617 204,021,305 13.9 19.5 8 percent..................................................................................................................105,721 1,351,974 566,079 566,079 45,286 45,286 37,033 2.7 6.5 10 percent (capital gains)..................................................................................................................420,591 3,418,826 1,317,548 752,197 127,396 75,220 121,974 3.6 9.3
10 percent..................................................................................................................3,867,846 22,872,448 7,813,478 7,813,478 781,507 781,348 780,681 3.4 10.0 10 percent (Form 8814) ¹..................................................................................................................-- -- -- -- -- -- -- (X) (X) 15 percent..................................................................................................................27,739,679 573,345,077 331,731,786 323,590,688 49,334,646 48,538,603 45,886,873 8.0 13.8 20 percent..................................................................................................................243,413 28,988,206 22,383,203 15,775,269 3,969,806 3,155,054 4,164,625 14.4 18.6 25 percent..................................................................................................................10,993 1,519,363 1,340,851 321,007 269,383 80,252 275,235 18.1 20.5
27.5 percent..................................................................................................................9,833,179 512,612,705 400,019,891 124,676,340 76,073,876 34,285,994 75,703,940 14.8 18.9 28 percent (capital gains)..................................................................................................................14,294 980,559 783,669 28,117 160,283 7,873 160,349 16.4 20.5 30.5 percent..................................................................................................................1,510,356 165,556,898 138,186,372 32,016,561 33,326,696 9,765,051 33,374,120 20.2 24.2 35.5 percent..................................................................................................................256,912 61,032,977 53,208,345 13,080,382 14,993,164 4,643,536 14,971,081 24.5 28.1
39.1 percent..................................................................................................................86,680 94,206,014 84,675,104 46,623,360 28,794,265 18,229,734 28,121,826 29.9 33.2 Form 8615 ²..................................................................................................................201,902 1,943,144 1,626,456 1,485,208 418,758 404,666 423,566 21.8 26.0
¹ Form 8814 was filed for a dependent child under age 14 for whom the parents made the election to report the child's investment income (if it was from interest or dividends totaling between $700 and $7,500) on the parents' income tax return. This rate classification is comprised of those returns with a tax liability only from the dependents' incomes. ² Form 8615 was filed for a child under age 14 to report the child's investment income in excess of $1,500. The returns in this rate classification are not distributed by tax rate. (X) Percentage not computed.
NOTE: Detail may not add to totals because of rounding.
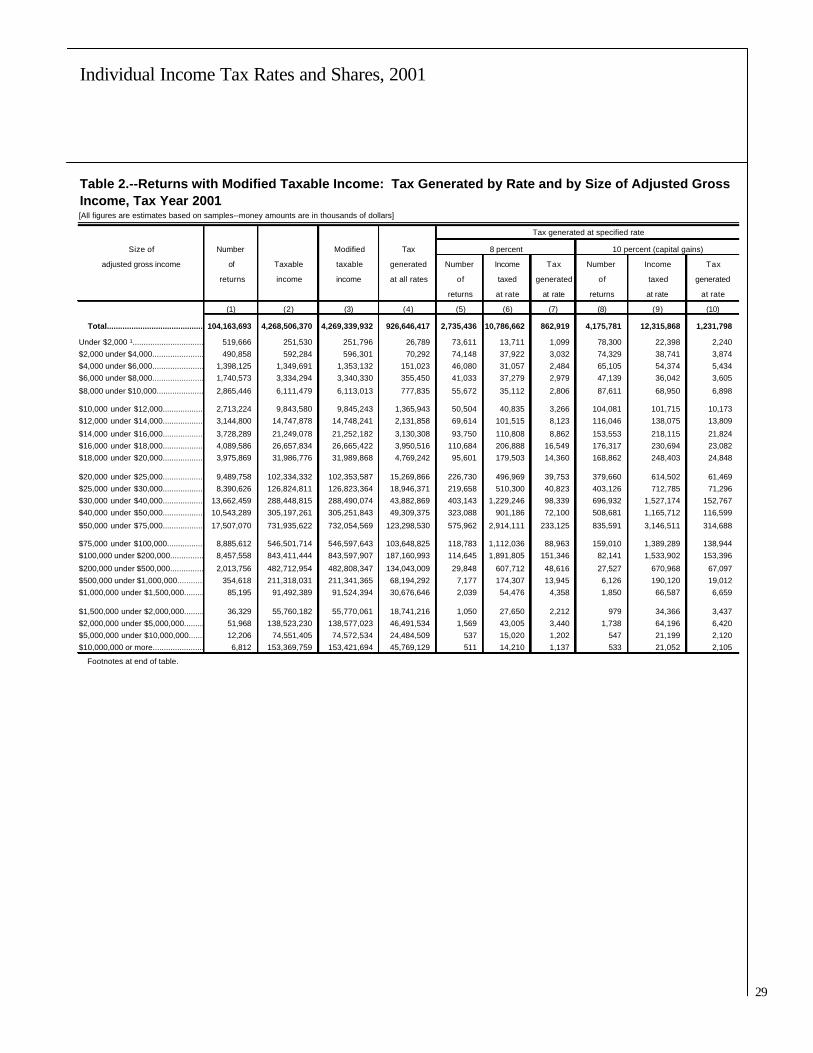
29
Individual Income Tax Rates and Shares, 2001
Table 2.--Returns with Modified Taxable Income: Tax Generated by Rate and by Size of Adjusted GrossIncome, Tax Year 2001[All figures are estimates based on samples--money amounts are in thousands of dollars]
Tax generated at specified rate
Size of Number Modified Tax 8 percent 10 percent (capital gains)
adjusted gross income of Taxable taxable generated Number Income Tax Number Income Tax
returns income income at all rates of taxed generated of taxed generated
returns at rate at rate returns at rate at rate
(1) (2) (3) (4) (5) (6) (7) (8) (9) (10)
Total...........................................................104,163,693 4,268,506,370 4,269,339,932 926,646,417 2,735,436 10,786,662 862,919 4,175,781 12,315,868 1,231,798
Under $2,000 ¹......................................................519,666 251,530 251,796 26,789 73,611 13,711 1,099 78,300 22,398 2,240 $2,000 under $4,000......................................................490,858 592,284 596,301 70,292 74,148 37,922 3,032 74,329 38,741 3,874 $4,000 under $6,000......................................................1,398,125 1,349,691 1,353,132 151,023 46,080 31,057 2,484 65,105 54,374 5,434 $6,000 under $8,000......................................................1,740,573 3,334,294 3,340,330 355,450 41,033 37,279 2,979 47,139 36,042 3,605
$8,000 under $10,000......................................................2,865,446 6,111,479 6,113,013 777,835 55,672 35,112 2,806 87,611 68,950 6,898
$10,000 under $12,000......................................................2,713,224 9,843,580 9,845,243 1,365,943 50,504 40,835 3,266 104,081 101,715 10,173 $12,000 under $14,000......................................................3,144,800 14,747,878 14,748,241 2,131,858 69,614 101,515 8,123 116,046 138,075 13,809
$14,000 under $16,000......................................................3,728,289 21,249,078 21,252,182 3,130,308 93,750 110,808 8,862 153,553 218,115 21,824 $16,000 under $18,000......................................................4,089,586 26,657,834 26,665,422 3,950,516 110,684 206,888 16,549 176,317 230,694 23,082 $18,000 under $20,000......................................................3,975,869 31,986,776 31,989,868 4,769,242 95,601 179,503 14,360 168,862 248,403 24,848
$20,000 under $25,000......................................................9,489,758 102,334,332 102,353,587 15,269,866 226,730 496,969 39,753 379,660 614,502 61,469 $25,000 under $30,000......................................................8,390,626 126,824,811 126,823,364 18,946,371 219,658 510,300 40,823 403,126 712,785 71,296 $30,000 under $40,000......................................................13,662,459 288,448,815 288,490,074 43,882,869 403,143 1,229,246 98,339 696,932 1,527,174 152,767 $40,000 under $50,000......................................................10,543,289 305,197,261 305,251,843 49,309,375 323,088 901,186 72,100 508,681 1,165,712 116,599
$50,000 under $75,000......................................................17,507,070 731,935,622 732,054,569 123,298,530 575,962 2,914,111 233,125 835,591 3,146,511 314,688
$75,000 under $100,000......................................................8,885,612 546,501,714 546,597,643 103,648,825 118,783 1,112,036 88,963 159,010 1,389,289 138,944 $100,000 under $200,000......................................................8,457,558 843,411,444 843,597,907 187,160,993 114,645 1,891,805 151,346 82,141 1,533,902 153,396
$200,000 under $500,000......................................................2,013,756 482,712,954 482,808,347 134,043,009 29,848 607,712 48,616 27,527 670,968 67,097 $500,000 under $1,000,000......................................................354,618 211,318,031 211,341,365 68,194,292 7,177 174,307 13,945 6,126 190,120 19,012 $1,000,000 under $1,500,000......................................................85,195 91,492,389 91,524,394 30,676,646 2,039 54,476 4,358 1,850 66,587 6,659
$1,500,000 under $2,000,000......................................................36,329 55,760,182 55,770,061 18,741,216 1,050 27,650 2,212 979 34,366 3,437 $2,000,000 under $5,000,000......................................................51,968 138,523,230 138,577,023 46,491,534 1,569 43,005 3,440 1,738 64,196 6,420 $5,000,000 under $10,000,000......................................................12,206 74,551,405 74,572,534 24,484,509 537 15,020 1,202 547 21,199 2,120 $10,000,000 or more......................................................6,812 153,369,759 153,421,694 45,769,129 511 14,210 1,137 533 21,052 2,105
Footnotes at end of table.

30
Individual Income Tax Rates and Shares, 2001
30
Table 2.--Returns with Modified Taxable Income: Tax Generated by Rate and by Size of Adjusted GrossIncome, Tax Year 2001--Continued[All figures are estimates based on samples--money amounts are in thousands of dollars]
Tax generated at specified rate--continued
Size of 10 percent 10 percent (from Form 8814) ² 15 percent
adjusted gross income Number Income Tax Number Income Tax Number Income Tax
of taxed generated of taxed generated of taxed generated
returns at rate at rate returns at rate at rate returns at rate at rate
(11) (12) (13) (14) (15) (16) (17) (18) (19)
Total...........................................................5,226,657 13,879,743 1,387,974 144,897 119,730 12,178 99,228,958 2,323,780,421 348,567,063
Under $2,000 ¹......................................................445,293 197,788 19,779 756 612 62 10,796 8,350 1,253 $2,000 under $4,000......................................................452,325 418,023 41,802 *961 *467 *47 *10,713 *16,826 *2,523 $4,000 under $6,000......................................................1,365,233 1,136,167 113,617 *135 *174 *17 19,109 29,002 4,350 $6,000 under $8,000......................................................1,212,213 2,959,443 295,944 *8 *6 *1 514,903 234,541 35,181
$8,000 under $10,000......................................................663,921 2,851,863 285,186 *1,024 *1,471 *147 2,176,816 3,078,105 461,716
$10,000 under $12,000......................................................373,094 2,164,656 216,466 *1,125 *1,565 *157 2,544,677 7,480,356 1,122,053 $12,000 under $14,000......................................................259,699 1,510,244 151,024 *161 *211 *21 3,101,591 12,903,446 1,935,517
$14,000 under $16,000......................................................172,595 1,003,493 100,349 *2,912 *2,915 *292 3,673,422 19,819,530 2,972,930 $16,000 under $18,000......................................................92,147 541,597 54,160 *150 *163 *16 4,044,831 25,656,301 3,848,445 $18,000 under $20,000......................................................47,488 265,121 26,512 *2,901 *2,897 *290 3,932,517 31,188,857 4,678,329
$20,000 under $25,000......................................................78,427 464,874 46,487 7,748 8,682 868 9,435,280 100,729,443 15,109,416 $25,000 under $30,000......................................................35,825 214,720 21,472 *1,713 *935 *94 8,363,608 125,316,347 18,797,452 $30,000 under $40,000......................................................11,651 61,725 6,173 11,224 8,477 882 13,617,713 279,349,519 41,902,428 $40,000 under $50,000......................................................*5,903 *33,421 *3,342 *12,014 *13,972 *1,396 10,521,240 273,525,085 41,028,763
$50,000 under $75,000......................................................*5,810 *29,273 *2,927 22,762 16,249 1,711 17,455,208 612,752,765 91,912,915
$75,000 under $100,000......................................................*12 *71 *7 23,380 17,462 1,749 8,866,341 367,234,272 55,085,141 $100,000 under $200,000......................................................*3,694 *19,595 *1,960 29,806 22,800 2,286 8,415,576 357,177,288 53,576,593
$200,000 under $500,000......................................................*897 *5,381 *538 18,479 14,073 1,451 1,992,745 84,801,786 12,720,268 $500,000 under $1,000,000......................................................*219 *1,093 *109 4,407 3,784 393 347,518 14,711,338 2,206,701 $1,000,000 under $1,500,000......................................................91 499 50 1,244 1,080 114 82,556 3,485,032 522,755
$1,500,000 under $2,000,000......................................................*33 *197 *20 566 496 52 34,992 1,472,485 220,873 $2,000,000 under $5,000,000......................................................63 361 36 1,009 842 89 49,479 2,085,773 312,866 $5,000,000 under $10,000,000......................................................**26 **136 **14 248 240 25 11,356 475,593 71,339 $10,000,000 or more......................................................** ** ** 162 157 16 5,971 248,382 37,257
Footnotes at end of table.
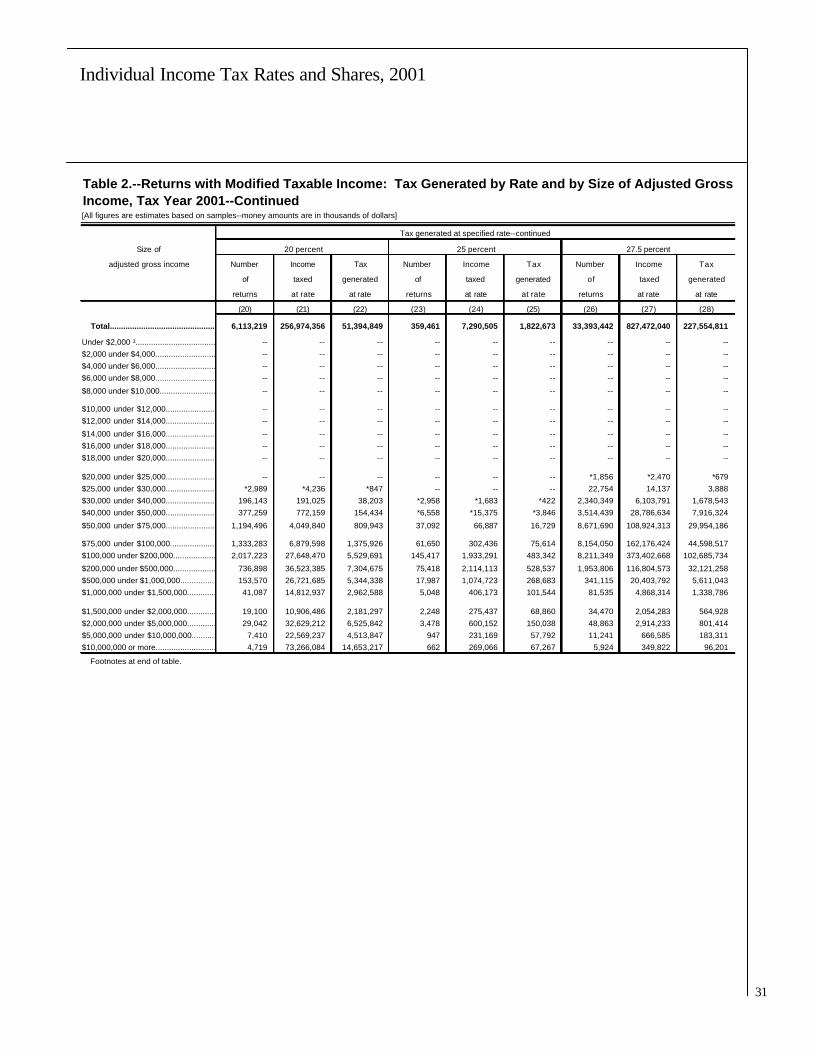
31
Individual Income Tax Rates and Shares, 2001
Table 2.--Returns with Modified Taxable Income: Tax Generated by Rate and by Size of Adjusted GrossIncome, Tax Year 2001--Continued[All figures are estimates based on samples--money amounts are in thousands of dollars]
Tax generated at specified rate--continued
Size of 20 percent 25 percent 27.5 percent
adjusted gross income Number Income Tax Number Income Tax Number Income Tax
of taxed generated of taxed generated of taxed generated
returns at rate at rate returns at rate at rate returns at rate at rate
(20) (21) (22) (23) (24) (25) (26) (27) (28)
Total...........................................................6,113,219 256,974,356 51,394,849 359,461 7,290,505 1,822,673 33,393,442 827,472,040 227,554,811
Under $2,000 ¹...................................................... -- -- -- -- -- -- -- -- -- $2,000 under $4,000......................................................-- -- -- -- -- -- -- -- -- $4,000 under $6,000......................................................-- -- -- -- -- -- -- -- -- $6,000 under $8,000......................................................-- -- -- -- -- -- -- -- --
$8,000 under $10,000......................................................-- -- -- -- -- -- -- -- --
$10,000 under $12,000......................................................-- -- -- -- -- -- -- -- -- $12,000 under $14,000......................................................-- -- -- -- -- -- -- -- --
$14,000 under $16,000......................................................-- -- -- -- -- -- -- -- -- $16,000 under $18,000......................................................-- -- -- -- -- -- -- -- -- $18,000 under $20,000......................................................-- -- -- -- -- -- -- -- --
$20,000 under $25,000......................................................-- -- -- -- -- -- *1,856 *2,470 *679 $25,000 under $30,000......................................................*2,989 *4,236 *847 -- -- -- 22,754 14,137 3,888 $30,000 under $40,000......................................................196,143 191,025 38,203 *2,958 *1,683 *422 2,340,349 6,103,791 1,678,543 $40,000 under $50,000......................................................377,259 772,159 154,434 *6,558 *15,375 *3,846 3,514,439 28,786,634 7,916,324
$50,000 under $75,000......................................................1,194,496 4,049,840 809,943 37,092 66,887 16,729 8,671,690 108,924,313 29,954,186
$75,000 under $100,000......................................................1,333,283 6,879,598 1,375,926 61,650 302,436 75,614 8,154,050 162,176,424 44,598,517 $100,000 under $200,000......................................................2,017,223 27,648,470 5,529,691 145,417 1,933,291 483,342 8,211,349 373,402,668 102,685,734
$200,000 under $500,000......................................................736,898 36,523,385 7,304,675 75,418 2,114,113 528,537 1,953,806 116,804,573 32,121,258 $500,000 under $1,000,000......................................................153,570 26,721,685 5,344,338 17,987 1,074,723 268,683 341,115 20,403,792 5,611,043 $1,000,000 under $1,500,000......................................................41,087 14,812,937 2,962,588 5,048 406,173 101,544 81,535 4,868,314 1,338,786
$1,500,000 under $2,000,000......................................................19,100 10,906,486 2,181,297 2,248 275,437 68,860 34,470 2,054,283 564,928 $2,000,000 under $5,000,000......................................................29,042 32,629,212 6,525,842 3,478 600,152 150,038 48,863 2,914,233 801,414 $5,000,000 under $10,000,000......................................................7,410 22,569,237 4,513,847 947 231,169 57,792 11,241 666,585 183,311 $10,000,000 or more......................................................4,719 73,266,084 14,653,217 662 269,066 67,267 5,924 349,822 96,201
Footnotes at end of table.
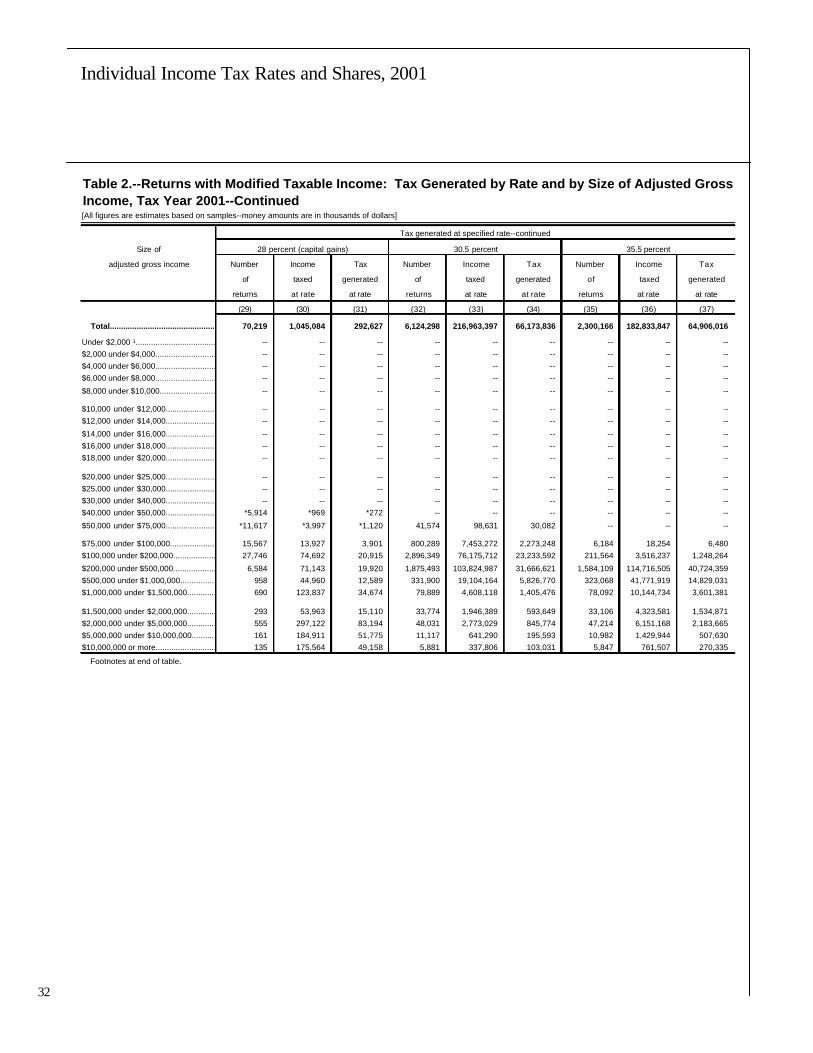
32
Individual Income Tax Rates and Shares, 2001
32
Table 2.--Returns with Modified Taxable Income: Tax Generated by Rate and by Size of Adjusted GrossIncome, Tax Year 2001--Continued[All figures are estimates based on samples--money amounts are in thousands of dollars]
Tax generated at specified rate--continued
Size of 28 percent (capital gains) 30.5 percent 35.5 percent
adjusted gross income Number Income Tax Number Income Tax Number Income Tax
of taxed generated of taxed generated of taxed generated
returns at rate at rate returns at rate at rate returns at rate at rate
(29) (30) (31) (32) (33) (34) (35) (36) (37)
Total........................................................... 70,219 1,045,084 292,627 6,124,298 216,963,397 66,173,836 2,300,166 182,833,847 64,906,016
Under $2,000 ¹...................................................... -- -- -- -- -- -- -- -- -- $2,000 under $4,000......................................................-- -- -- -- -- -- -- -- -- $4,000 under $6,000......................................................-- -- -- -- -- -- -- -- -- $6,000 under $8,000......................................................-- -- -- -- -- -- -- -- --
$8,000 under $10,000......................................................-- -- -- -- -- -- -- -- --
$10,000 under $12,000......................................................-- -- -- -- -- -- -- -- -- $12,000 under $14,000......................................................-- -- -- -- -- -- -- -- --
$14,000 under $16,000......................................................-- -- -- -- -- -- -- -- -- $16,000 under $18,000......................................................-- -- -- -- -- -- -- -- -- $18,000 under $20,000......................................................-- -- -- -- -- -- -- -- --
$20,000 under $25,000......................................................-- -- -- -- -- -- -- -- -- $25,000 under $30,000......................................................-- -- -- -- -- -- -- -- -- $30,000 under $40,000......................................................-- -- -- -- -- -- -- -- -- $40,000 under $50,000......................................................*5,914 *969 *272 -- -- -- -- -- --
$50,000 under $75,000......................................................*11,617 *3,997 *1,120 41,574 98,631 30,082 -- -- --
$75,000 under $100,000......................................................15,567 13,927 3,901 800,289 7,453,272 2,273,248 6,184 18,254 6,480 $100,000 under $200,000......................................................27,746 74,692 20,915 2,896,349 76,175,712 23,233,592 211,564 3,516,237 1,248,264
$200,000 under $500,000......................................................6,584 71,143 19,920 1,875,493 103,824,987 31,666,621 1,584,109 114,716,505 40,724,359 $500,000 under $1,000,000......................................................958 44,960 12,589 331,900 19,104,164 5,826,770 323,068 41,771,919 14,829,031 $1,000,000 under $1,500,000......................................................690 123,837 34,674 79,889 4,608,118 1,405,476 78,092 10,144,734 3,601,381
$1,500,000 under $2,000,000......................................................293 53,963 15,110 33,774 1,946,389 593,649 33,106 4,323,581 1,534,871 $2,000,000 under $5,000,000......................................................555 297,122 83,194 48,031 2,773,029 845,774 47,214 6,151,168 2,183,665 $5,000,000 under $10,000,000......................................................161 184,911 51,775 11,117 641,290 195,593 10,982 1,429,944 507,630 $10,000,000 or more......................................................135 175,564 49,158 5,881 337,806 103,031 5,847 761,507 270,335
Footnotes at end of table.

33
Individual Income Tax Rates and Shares, 2001
Table 2.--Returns with Modified Taxable Income: Tax Generated by Rate and by Size of Adjusted GrossIncome, Tax Year 2001--Continued[All figures are estimates based on samples--money amounts are in thousands of dollars]
Tax generated at specified rate--continued
Size of 39.1 percent Form 8615 ³
adjusted gross income Number Income Tax Number Income Tax
of taxed generated of taxed generated
returns at rate at rate returns at rate at rate
(38) (39) (40) (41) (42) (43)
Total..................................................................................................................846,345 414,393,069 162,027,690 201,902 1,485,208 404,666
Under $2,000 ¹..................................................................................................................-- -- -- 34,874 8,936 2,339 $2,000 under $4,000..................................................................................................................-- -- -- 67,703 84,322 18,984 $4,000 under $6,000..................................................................................................................-- -- -- 35,009 102,357 25,058
$6,000 under $8,000..................................................................................................................-- -- -- 13,742 73,020 17,643 $8,000 under $10,000..................................................................................................................-- -- -- 10,564 77,512 21,028
$10,000 under $12,000..................................................................................................................-- -- -- *6,718 *56,116 *13,778
$12,000 under $14,000..................................................................................................................-- -- -- *8,666 *94,750 *23,240 $14,000 under $16,000..................................................................................................................-- -- -- *7,769 *97,320 *25,995 $16,000 under $18,000..................................................................................................................-- -- -- *1,923 *29,778 *8,195 $18,000 under $20,000..................................................................................................................-- -- -- *6,596 *105,087 *24,841
$20,000 under $25,000..................................................................................................................-- -- -- *1,923 *36,647 *10,902 $25,000 under $30,000..................................................................................................................-- -- -- *1,923 *49,905 *10,161 $30,000 under $40,000..................................................................................................................-- -- -- *929 *17,434 *2,577
$40,000 under $50,000..................................................................................................................-- -- -- *931 *37,330 *11,082 $50,000 under $75,000..................................................................................................................-- -- -- *931 *51,992 *19,900
$75,000 under $100,000..................................................................................................................-- -- -- *8 *603 *235
$100,000 under $200,000..................................................................................................................5,580 103,645 40,525 *801 *97,802 *32,560 $200,000 under $500,000..................................................................................................................368,139 22,485,105 8,791,676 *642 *168,615 *47,814 $500,000 under $1,000,000..................................................................................................................304,177 87,047,778 34,035,681 *141 *91,703 *25,968
$1,000,000 under $1,500,000..................................................................................................................74,585 52,864,423 20,669,989 *78 *88,185 *28,261
$1,500,000 under $2,000,000..................................................................................................................31,984 34,662,831 13,553,167 *8 *11,898 *2,741 $2,000,000 under $5,000,000..................................................................................................................45,536 90,965,129 35,567,365 *15 *52,800 *11,384
$5,000,000 under $10,000,000..................................................................................................................10,625 48,306,044 18,887,663 **7 **51,096 **19,978 $10,000,000 or more..................................................................................................................5,719 77,958,115 30,481,623 ** ** **
* Estimate should be used with caution because of the small number of sample returns on which it is based.
** Data combined to prevent disclosure of information for specific taxpayers.
¹ Includes returns with adjusted gross deficit. ² Form 8814 was filed for a dependent child under age 14 for whom the parents made the election to report the child's investment income (if it was from interest or dividends totalingbetween $700 and $7,500) on the parents' income tax return. This rate classification is comprised of those returns with a tax liability only from the dependents' incomes. ³ Form 8615 was filed for a child under age 14 to report the child's investment income in excess of $1,500. The returns in this rate classification are not distributed by tax rate.
NOTE: Detail may not add to totals because of rounding.

34
Individual Income Tax Rates and Shares, 2001
34
Table 3.--Returns with Modified Taxable Income: Taxable Income, and Tax Classified by Marginal Tax Rate and by Filing Status, Tax Year 2001[All figures are estimates based on samples--money amounts are in thousands of dollars]
All Joint returns and Returns of married
Marginal tax returns returns of surviving spouses persons filing separately
rate classes Number Income Income tax Number Income Income tax Number Income Income taxof taxed generated of taxed generated of taxed generated
returns at rate at rate returns at rate at rate returns at rate at rate
(1) (2) (3) (4) (5) (6) (7) (8) (9)
All tax rates.............................................................................................................................104,163,693 4,269,339,932 926,638,876 45,184,133 2,908,857,140 657,561,712 2,181,354 77,060,005 18,117,200 8 percent.............................................................................................................................2,735,436 10,786,662 862,933 1,438,725 7,132,358 570,589 22,065 39,503 3,160 10 percent (capital gains).............................................................................................................................4,175,781 12,315,868 1,231,587 2,172,797 7,767,927 776,793 33,388 132,436 13,244 10 percent.............................................................................................................................5,226,657 13,879,743 1,387,974 -- -- -- 11,988 32,852 3,285 10 percent (Form 8814) ¹.............................................................................................................................144,897 119,730 12,178 119,865 100,359 10,237 993 552 56 15 percent.............................................................................................................................99,228,958 2,323,780,421 348,567,063 44,927,396 1,453,103,165 217,965,475 2,164,520 35,227,456 5,284,118 20 percent.............................................................................................................................6,113,219 256,974,356 51,394,871 4,037,963 193,448,622 38,689,724 100,957 8,107,155 1,621,431 25 percent.............................................................................................................................359,461 7,290,505 1,822,626 257,563 5,892,866 1,473,216 2,893 99,018 24,755 27.5 percent.............................................................................................................................33,393,442 827,472,040 227,554,811 19,386,531 592,631,480 162,973,657 868,360 12,985,373 3,570,978 28 percent (capital gains).............................................................................................................................70,219 1,045,084 292,624 48,347 772,150 216,202 1,299 31,564 8,838 30.5 percent.............................................................................................................................6,124,298 216,963,397 66,173,836 3,972,576 152,631,314 46,552,551 167,075 3,274,649 998,768 35.5 percent.............................................................................................................................2,300,166 182,833,847 64,906,016 1,836,372 148,863,881 52,846,678 69,690 3,029,052 1,075,313 39.1 percent.............................................................................................................................846,345 414,393,069 162,027,690 713,981 346,513,019 135,486,591 32,362 14,100,395 5,513,255 Form 8615 ².............................................................................................................................201,902 1,485,208 404,666 -- -- -- -- -- --
Returns of heads Returns of
Marginal tax of households single persons
rate classes Number Income Income tax Number Income Income tax
of taxed generated of taxed generatedreturns at rate at rate returns at rate at rate
(10) (11) (12) (13) (14) (15)
All tax rates.............................................................................................................................12,506,639 239,770,006 42,671,372 44,291,567 1,043,652,781 208,288,592 8 percent.............................................................................................................................82,087 269,369 21,549 1,192,558 3,345,433 267,635 10 percent (capital gains).............................................................................................................................204,912 519,403 51,940 1,764,685 3,896,103 389,610 10 percent............................................................................................................................. -- -- -- 5,214,670 13,846,891 1,384,689 10 percent (Form 8814) ¹.............................................................................................................................21,934 17,241 1,727 2,104 1,578 158 15 percent.............................................................................................................................12,485,917 191,582,975 28,737,446 39,651,125 643,866,826 96,580,024 20 percent.............................................................................................................................158,268 5,987,448 1,197,490 1,816,031 49,431,131 9,886,226 25 percent.............................................................................................................................11,925 186,533 46,633 87,081 1,112,088 278,022 27.5 percent.............................................................................................................................1,437,137 25,527,509 7,020,065 11,701,414 196,327,678 53,990,111 28 percent (capital gains).............................................................................................................................1,250 6,446 1,805 19,324 234,924 65,779 30.5 percent.............................................................................................................................130,698 4,577,096 1,396,014 1,853,949 56,480,338 17,226,503 35.5 percent.............................................................................................................................50,512 3,939,692 1,398,591 343,592 27,001,222 9,585,434 39.1 percent.............................................................................................................................13,321 7,156,294 2,798,111 86,680 46,623,360 18,229,734 Form 8615 ².............................................................................................................................-- -- -- 201,902 1,485,208 404,666 ¹ Form 8814 was filed for a dependent child under age 14 for whom the parents made an election to report the child's investment income (if it was from interest or dividends totaling between $700 and $7,500) on the parents' income tax return. This rate classification is comprised of those returns with a tax liability only from the dependents' incomes. ² Form 8615 was filed for a child under age 14 to report the child's investment income in excess of $1,500. The returns in this rate classification are not distributed by tax rate.
NOTE: Detail may not add to totals because of rounding.
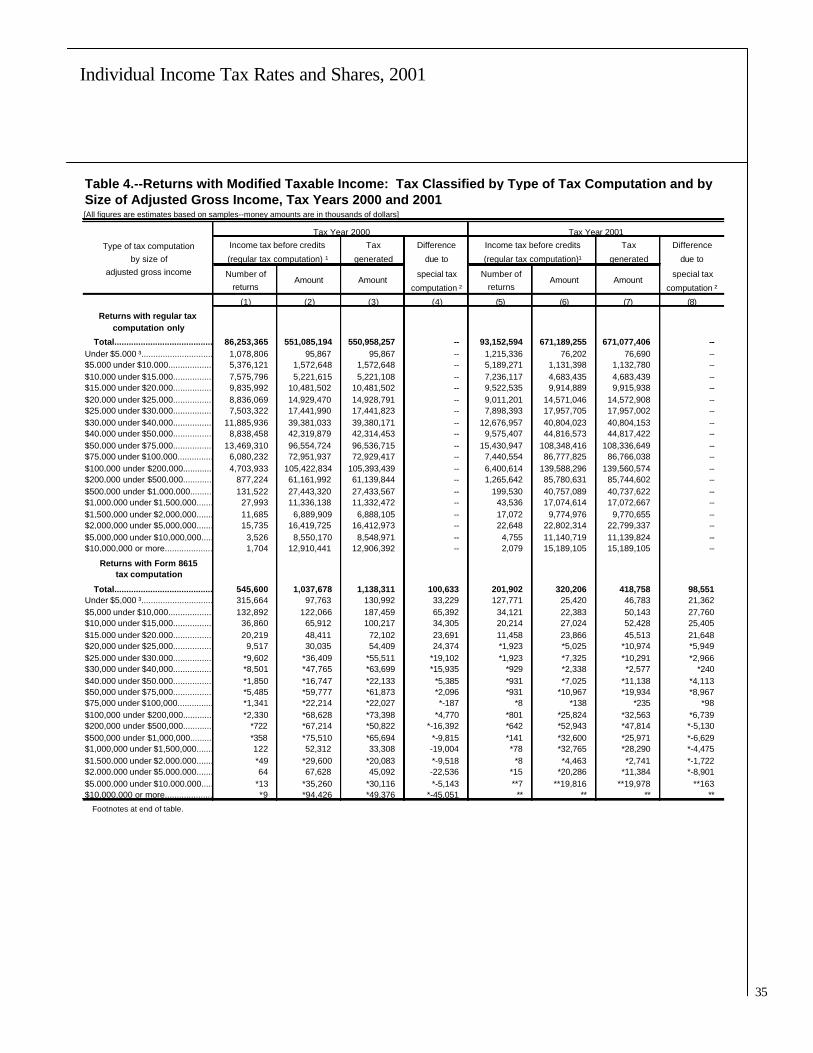
35
Individual Income Tax Rates and Shares, 2001
Table 4.--Returns with Modified Taxable Income: Tax Classified by Type of Tax Computation and by Size of Adjusted Gross Income, Tax Years 2000 and 2001[All figures are estimates based on samples--money amounts are in thousands of dollars]
Tax Year 2000 Tax Year 2001
Type of tax computation Income tax before credits Tax Difference Income tax before credits Tax Difference
by size of (regular tax computation) ¹ generated due to (regular tax computation)¹ generated due toadjusted gross income Number of special tax Number of special tax
returns computation ² returns computation ²
(1) (2) (3) (4) (5) (6) (7) (8)
Returns with regular taxcomputation only
Total..............................................................................86,253,365 551,085,194 550,958,257 -- 93,152,594 671,189,255 671,077,406 -- Under $5,000 ³..............................................................................1,078,806 95,867 95,867 -- 1,215,336 76,202 76,690 -- $5,000 under $10,000..............................................................................5,376,121 1,572,648 1,572,648 -- 5,189,271 1,131,398 1,132,780 -- $10,000 under $15,000..............................................................................7,575,796 5,221,615 5,221,108 -- 7,236,117 4,683,435 4,683,439 -- $15,000 under $20,000..............................................................................9,835,992 10,481,502 10,481,502 -- 9,522,535 9,914,889 9,915,938 -- $20,000 under $25,000..............................................................................8,836,069 14,929,470 14,928,791 -- 9,011,201 14,571,046 14,572,908 -- $25,000 under $30,000..............................................................................7,503,322 17,441,990 17,441,823 -- 7,898,393 17,957,705 17,957,002 -- $30,000 under $40,000..............................................................................11,885,936 39,381,033 39,380,171 -- 12,676,957 40,804,023 40,804,153 -- $40,000 under $50,000..............................................................................8,838,458 42,319,879 42,314,453 -- 9,575,407 44,816,573 44,817,422 -- $50,000 under $75,000..............................................................................13,469,310 96,554,724 96,536,715 -- 15,430,947 108,348,416 108,336,649 -- $75,000 under $100,000..............................................................................6,080,232 72,951,937 72,929,417 -- 7,440,554 86,777,825 86,766,038 -- $100,000 under $200,000..............................................................................4,703,933 105,422,834 105,393,439 -- 6,400,614 139,588,296 139,560,574 -- $200,000 under $500,000..............................................................................877,224 61,161,992 61,139,844 -- 1,265,642 85,780,631 85,744,602 -- $500,000 under $1,000,000..............................................................................131,522 27,443,320 27,433,567 -- 199,530 40,757,089 40,737,622 -- $1,000,000 under $1,500,000..............................................................................27,993 11,336,138 11,332,472 -- 43,536 17,074,614 17,072,667 -- $1,500,000 under $2,000,000..............................................................................11,685 6,889,909 6,888,105 -- 17,072 9,774,976 9,770,655 -- $2,000,000 under $5,000,000..............................................................................15,735 16,419,725 16,412,973 -- 22,648 22,802,314 22,799,337 -- $5,000,000 under $10,000,000..............................................................................3,526 8,550,170 8,548,971 -- 4,755 11,140,719 11,139,824 -- $10,000,000 or more..............................................................................1,704 12,910,441 12,906,392 -- 2,079 15,189,105 15,189,105 --
Returns with Form 8615tax computation
Total..............................................................................545,600 1,037,678 1,138,311 100,633 201,902 320,206 418,758 98,551 Under $5,000 ³..............................................................................315,664 97,763 130,992 33,229 127,771 25,420 46,783 21,362 $5,000 under $10,000..............................................................................132,892 122,066 187,459 65,392 34,121 22,383 50,143 27,760 $10,000 under $15,000..............................................................................36,860 65,912 100,217 34,305 20,214 27,024 52,428 25,405 $15,000 under $20,000..............................................................................20,219 48,411 72,102 23,691 11,458 23,866 45,513 21,648 $20,000 under $25,000..............................................................................9,517 30,035 54,409 24,374 *1,923 *5,025 *10,974 *5,949 $25,000 under $30,000..............................................................................*9,602 *36,409 *55,511 *19,102 *1,923 *7,325 *10,291 *2,966 $30,000 under $40,000..............................................................................*8,501 *47,765 *63,699 *15,935 *929 *2,338 *2,577 *240 $40,000 under $50,000..............................................................................*1,850 *16,747 *22,133 *5,385 *931 *7,025 *11,138 *4,113 $50,000 under $75,000..............................................................................*5,485 *59,777 *61,873 *2,096 *931 *10,967 *19,934 *8,967 $75,000 under $100,000..............................................................................*1,341 *22,214 *22,027 *-187 *8 *138 *235 *98 $100,000 under $200,000..............................................................................*2,330 *68,628 *73,398 *4,770 *801 *25,824 *32,563 *6,739 $200,000 under $500,000..............................................................................*722 *67,214 *50,822 *-16,392 *642 *52,943 *47,814 *-5,130 $500,000 under $1,000,000..............................................................................*358 *75,510 *65,694 *-9,815 *141 *32,600 *25,971 *-6,629 $1,000,000 under $1,500,000..............................................................................122 52,312 33,308 -19,004 *78 *32,765 *28,290 *-4,475 $1,500,000 under $2,000,000..............................................................................*49 *29,600 *20,083 *-9,518 *8 *4,463 *2,741 *-1,722 $2,000,000 under $5,000,000..............................................................................64 67,628 45,092 -22,536 *15 *20,286 *11,384 *-8,901 $5,000,000 under $10,000,000..............................................................................*13 *35,260 *30,116 *-5,143 **7 **19,816 **19,978 **163 $10,000,000 or more..............................................................................*9 *94,426 *49,376 *-45,051 ** ** ** **
Footnotes at end of table.
Amount Amount Amount Amount

36
Individual Income Tax Rates and Shares, 2001
36
Table 4.--Returns with Modified Taxable Income: Tax Classified by Type of Tax Computation and by Size of Adjusted Gross Income, Tax Years 2000 and 2001--Continued[All figures are estimates based on samples--money amounts are in thousands of dollars]
Tax Year 2000 Tax Year 2001
Type of tax computation Income tax before credits Tax Difference Income tax before credits Tax Difference
by size of (regular tax computation) ¹ generated due to (regular tax computation)¹ generated due toadjusted gross income Number of special tax Number of special tax
returns computation ² returns computation ²(1) (2) (3) (4) (5) (6) (7) (8)
Returns with Schedule Dtax computation
Total..............................................................................17,091,388 512,907,932 440,309,912 -72,598,019 10,207,370 281,489,962 245,382,758 -36,107,205 Under $5,000 ³..............................................................................352,329 90,427 71,582 -18,846 141,650 20,540 19,398 -1,142 $5,000 under $10,000..............................................................................453,538 253,821 208,746 -45,075 155,992 43,780 41,108 -2,672 $10,000 under $15,000..............................................................................454,214 396,705 346,607 -50,098 274,600 185,342 168,583 -16,759 $15,000 under $20,000..............................................................................606,573 742,182 675,322 -66,860 419,142 455,412 423,163 -32,249 $20,000 under $25,000..............................................................................653,902 1,149,155 1,061,668 -87,487 425,040 699,151 654,316 -44,834 $25,000 under $30,000..............................................................................673,190 1,599,616 1,500,569 -99,047 466,176 1,012,066 955,369 -56,697 $30,000 under $40,000..............................................................................1,451,698 5,017,390 4,758,088 -259,302 942,612 3,156,551 3,017,921 -138,630 $40,000 under $50,000..............................................................................1,488,654 7,531,647 7,156,434 -375,213 946,764 4,603,587 4,445,393 -158,194 $50,000 under $75,000..............................................................................3,506,337 27,987,392 26,643,396 -1,343,996 2,024,262 15,372,771 14,792,744 -580,027 $75,000 under $100,000..............................................................................2,471,632 32,263,622 30,774,256 -1,489,366 1,425,787 17,390,529 16,760,688 -629,841 $100,000 under $200,000..............................................................................3,325,589 84,065,248 78,973,737 -5,091,511 2,015,951 49,578,743 47,069,522 -2,509,221 $200,000 under $500,000..............................................................................1,232,936 92,326,984 82,606,393 -9,720,591 727,104 52,459,517 47,535,632 -4,923,885 $500,000 under $1,000,000..............................................................................254,211 55,040,976 47,198,832 -7,842,145 148,029 31,115,256 26,772,415 -4,342,841 $1,000,000 under $1,500,000..............................................................................67,975 27,982,643 23,374,232 -4,608,410 39,011 15,538,348 13,119,807 -2,418,541 $1,500,000 under $2,000,000..............................................................................30,902 18,512,565 15,227,396 -3,285,169 17,920 10,416,628 8,629,210 -1,787,418 $2,000,000 under $5,000,000..............................................................................47,114 50,219,836 40,292,614 -9,927,223 26,834 27,700,646 22,495,270 -5,205,376 $5,000,000 under $10,000,000..............................................................................12,553 31,171,166 24,308,683 -6,862,483 6,603 15,867,936 12,395,700 -3,472,236 $10,000,000 or more..............................................................................8,041 76,556,556 55,131,358 -21,425,198 3,892 35,873,158 26,086,517 -9,786,642 * Estimate should be used with caution due to the small number of sample returns on which it is based. ** Data combined to prevent disclosure of certain taxpayer information. ¹ Includes special tax not included in tax generated. ² The difference between the amount of tax resulting from using provisions of one of the special tax computations and the amount of tax resulting from the regular tax computation. ³ Includes returns with adjusted gross deficit. NOTE: Detail may not add to totals because of rounding.
Amount Amount Amount Amount
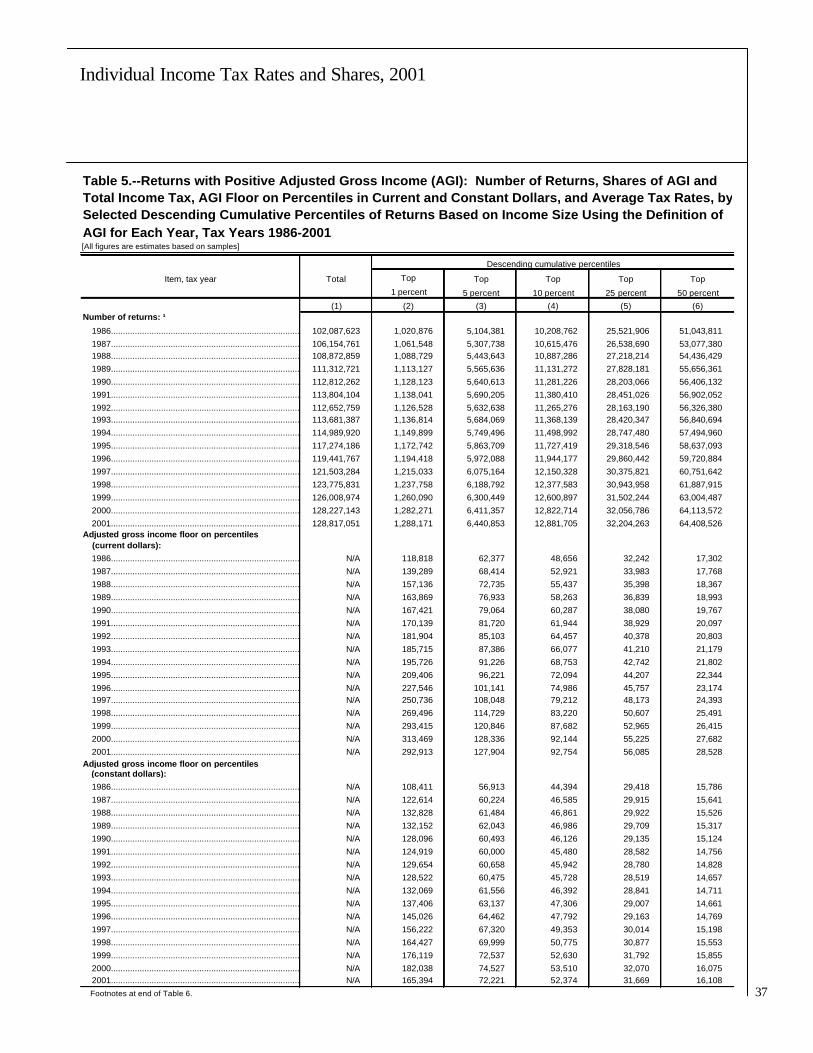
37
Individual Income Tax Rates and Shares, 2001
Table 5.--Returns with Positive Adjusted Gross Income (AGI): Number of Returns, Shares of AGI andTotal Income Tax, AGI Floor on Percentiles in Current and Constant Dollars, and Average Tax Rates, bySelected Descending Cumulative Percentiles of Returns Based on Income Size Using the Definition ofAGI for Each Year, Tax Years 1986-2001[All figures are estimates based on samples]
Descending cumulative percentiles
Item, tax year Total Top Top Top Top Top
1 percent 5 percent 10 percent 25 percent 50 percent
(1) (2) (3) (4) (5) (6)Number of returns: ¹
1986...........................................................................................102,087,623 1,020,876 5,104,381 10,208,762 25,521,906 51,043,811
1987...........................................................................................106,154,761 1,061,548 5,307,738 10,615,476 26,538,690 53,077,380 1988...........................................................................................108,872,859 1,088,729 5,443,643 10,887,286 27,218,214 54,436,429
1989...........................................................................................111,312,721 1,113,127 5,565,636 11,131,272 27,828,181 55,656,361
1990...........................................................................................112,812,262 1,128,123 5,640,613 11,281,226 28,203,066 56,406,132
1991...........................................................................................113,804,104 1,138,041 5,690,205 11,380,410 28,451,026 56,902,052
1992...........................................................................................112,652,759 1,126,528 5,632,638 11,265,276 28,163,190 56,326,380 1993...........................................................................................113,681,387 1,136,814 5,684,069 11,368,139 28,420,347 56,840,694
1994...........................................................................................114,989,920 1,149,899 5,749,496 11,498,992 28,747,480 57,494,960
1995...........................................................................................117,274,186 1,172,742 5,863,709 11,727,419 29,318,546 58,637,093
1996...........................................................................................119,441,767 1,194,418 5,972,088 11,944,177 29,860,442 59,720,884
1997...........................................................................................121,503,284 1,215,033 6,075,164 12,150,328 30,375,821 60,751,642
1998...........................................................................................123,775,831 1,237,758 6,188,792 12,377,583 30,943,958 61,887,915
1999...........................................................................................126,008,974 1,260,090 6,300,449 12,600,897 31,502,244 63,004,487
2000...........................................................................................128,227,143 1,282,271 6,411,357 12,822,714 32,056,786 64,113,572
2001...........................................................................................128,817,051 1,288,171 6,440,853 12,881,705 32,204,263 64,408,526 Adjusted gross income floor on percentiles (current dollars):
1986........................................................................................... N/A 118,818 62,377 48,656 32,242 17,302
1987........................................................................................... N/A 139,289 68,414 52,921 33,983 17,768
1988........................................................................................... N/A 157,136 72,735 55,437 35,398 18,367
1989........................................................................................... N/A 163,869 76,933 58,263 36,839 18,993
1990........................................................................................... N/A 167,421 79,064 60,287 38,080 19,767
1991........................................................................................... N/A 170,139 81,720 61,944 38,929 20,097
1992........................................................................................... N/A 181,904 85,103 64,457 40,378 20,803
1993........................................................................................... N/A 185,715 87,386 66,077 41,210 21,179
1994........................................................................................... N/A 195,726 91,226 68,753 42,742 21,802
1995........................................................................................... N/A 209,406 96,221 72,094 44,207 22,344
1996........................................................................................... N/A 227,546 101,141 74,986 45,757 23,174 1997........................................................................................... N/A 250,736 108,048 79,212 48,173 24,393
1998........................................................................................... N/A 269,496 114,729 83,220 50,607 25,491
1999........................................................................................... N/A 293,415 120,846 87,682 52,965 26,415
2000........................................................................................... N/A 313,469 128,336 92,144 55,225 27,682
2001........................................................................................... N/A 292,913 127,904 92,754 56,085 28,528 Adjusted gross income floor on percentiles (constant dollars):
1986........................................................................................... N/A 108,411 56,913 44,394 29,418 15,786
1987........................................................................................... N/A 122,614 60,224 46,585 29,915 15,641
1988........................................................................................... N/A 132,828 61,484 46,861 29,922 15,526
1989........................................................................................... N/A 132,152 62,043 46,986 29,709 15,317
1990........................................................................................... N/A 128,096 60,493 46,126 29,135 15,124
1991........................................................................................... N/A 124,919 60,000 45,480 28,582 14,756
1992........................................................................................... N/A 129,654 60,658 45,942 28,780 14,828
1993........................................................................................... N/A 128,522 60,475 45,728 28,519 14,657
1994........................................................................................... N/A 132,069 61,556 46,392 28,841 14,711
1995........................................................................................... N/A 137,406 63,137 47,306 29,007 14,661
1996........................................................................................... N/A 145,026 64,462 47,792 29,163 14,769
1997........................................................................................... N/A 156,222 67,320 49,353 30,014 15,198
1998........................................................................................... N/A 164,427 69,999 50,775 30,877 15,553
1999........................................................................................... N/A 176,119 72,537 52,630 31,792 15,855
2000........................................................................................... N/A 182,038 74,527 53,510 32,070 16,075 2001........................................................................................... N/A 165,394 72,221 52,374 31,669 16,108
Footnotes at end of Table 6.
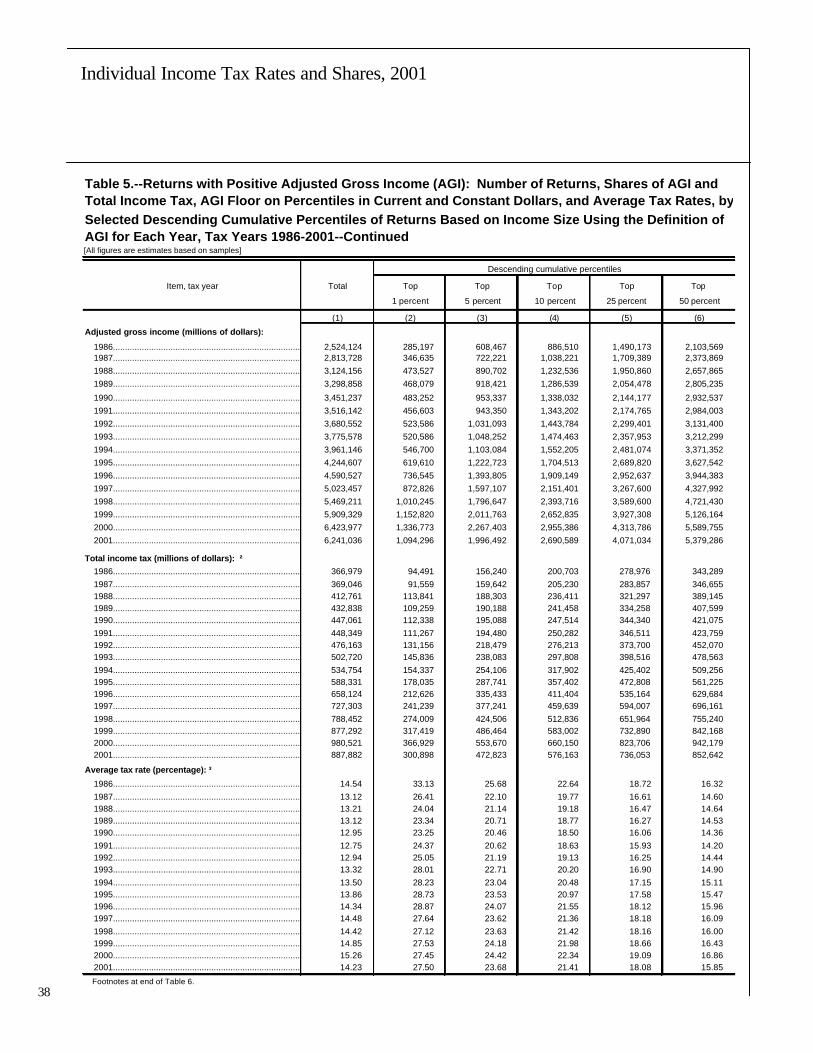
38
Individual Income Tax Rates and Shares, 2001
38
Table 5.--Returns with Positive Adjusted Gross Income (AGI): Number of Returns, Shares of AGI andTotal Income Tax, AGI Floor on Percentiles in Current and Constant Dollars, and Average Tax Rates, bySelected Descending Cumulative Percentiles of Returns Based on Income Size Using the Definition ofAGI for Each Year, Tax Years 1986-2001--Continued[All figures are estimates based on samples]
Descending cumulative percentiles
Item, tax year Total Top Top Top Top Top
1 percent 5 percent 10 percent 25 percent 50 percent
(1) (2) (3) (4) (5) (6)
Adjusted gross income (millions of dollars):
1986...........................................................................................2,524,124 285,197 608,467 886,510 1,490,173 2,103,569 1987...........................................................................................2,813,728 346,635 722,221 1,038,221 1,709,389 2,373,869 1988...........................................................................................3,124,156 473,527 890,702 1,232,536 1,950,860 2,657,865 1989...........................................................................................3,298,858 468,079 918,421 1,286,539 2,054,478 2,805,235
1990...........................................................................................3,451,237 483,252 953,337 1,338,032 2,144,177 2,932,537 1991...........................................................................................3,516,142 456,603 943,350 1,343,202 2,174,765 2,984,003 1992...........................................................................................3,680,552 523,586 1,031,093 1,443,784 2,299,401 3,131,400 1993...........................................................................................3,775,578 520,586 1,048,252 1,474,463 2,357,953 3,212,299 1994...........................................................................................3,961,146 546,700 1,103,084 1,552,205 2,481,074 3,371,352 1995...........................................................................................4,244,607 619,610 1,222,723 1,704,513 2,689,820 3,627,542 1996...........................................................................................4,590,527 736,545 1,393,805 1,909,149 2,952,637 3,944,383 1997...........................................................................................5,023,457 872,826 1,597,107 2,151,401 3,267,600 4,327,992 1998...........................................................................................5,469,211 1,010,245 1,796,647 2,393,716 3,589,600 4,721,430 1999...........................................................................................5,909,329 1,152,820 2,011,763 2,652,835 3,927,308 5,126,164 2000...........................................................................................6,423,977 1,336,773 2,267,403 2,955,386 4,313,786 5,589,755 2001...........................................................................................6,241,036 1,094,296 1,996,492 2,690,589 4,071,034 5,379,286
Total income tax (millions of dollars): ² 1986...........................................................................................366,979 94,491 156,240 200,703 278,976 343,289 1987...........................................................................................369,046 91,559 159,642 205,230 283,857 346,655 1988...........................................................................................412,761 113,841 188,303 236,411 321,297 389,145 1989...........................................................................................432,838 109,259 190,188 241,458 334,258 407,599 1990...........................................................................................447,061 112,338 195,088 247,514 344,340 421,075 1991...........................................................................................448,349 111,267 194,480 250,282 346,511 423,759 1992...........................................................................................476,163 131,156 218,479 276,213 373,700 452,070 1993...........................................................................................502,720 145,836 238,083 297,808 398,516 478,563 1994...........................................................................................534,754 154,337 254,106 317,902 425,402 509,256 1995...........................................................................................588,331 178,035 287,741 357,402 472,808 561,225 1996...........................................................................................658,124 212,626 335,433 411,404 535,164 629,684 1997...........................................................................................727,303 241,239 377,241 459,639 594,007 696,161 1998...........................................................................................788,452 274,009 424,506 512,836 651,964 755,240 1999...........................................................................................877,292 317,419 486,464 583,002 732,890 842,168 2000...........................................................................................980,521 366,929 553,670 660,150 823,706 942,179 2001...........................................................................................887,882 300,898 472,823 576,163 736,053 852,642
Average tax rate (percentage): ³
1986........................................................................................... 14.54 33.13 25.68 22.64 18.72 16.32 1987........................................................................................... 13.12 26.41 22.10 19.77 16.61 14.60 1988........................................................................................... 13.21 24.04 21.14 19.18 16.47 14.64 1989........................................................................................... 13.12 23.34 20.71 18.77 16.27 14.53 1990........................................................................................... 12.95 23.25 20.46 18.50 16.06 14.36 1991........................................................................................... 12.75 24.37 20.62 18.63 15.93 14.20 1992........................................................................................... 12.94 25.05 21.19 19.13 16.25 14.44 1993........................................................................................... 13.32 28.01 22.71 20.20 16.90 14.90 1994........................................................................................... 13.50 28.23 23.04 20.48 17.15 15.11 1995........................................................................................... 13.86 28.73 23.53 20.97 17.58 15.47 1996........................................................................................... 14.34 28.87 24.07 21.55 18.12 15.96 1997........................................................................................... 14.48 27.64 23.62 21.36 18.18 16.09 1998........................................................................................... 14.42 27.12 23.63 21.42 18.16 16.00 1999........................................................................................... 14.85 27.53 24.18 21.98 18.66 16.43 2000........................................................................................... 15.26 27.45 24.42 22.34 19.09 16.86 2001........................................................................................... 14.23 27.50 23.68 21.41 18.08 15.85
Footnotes at end of Table 6.
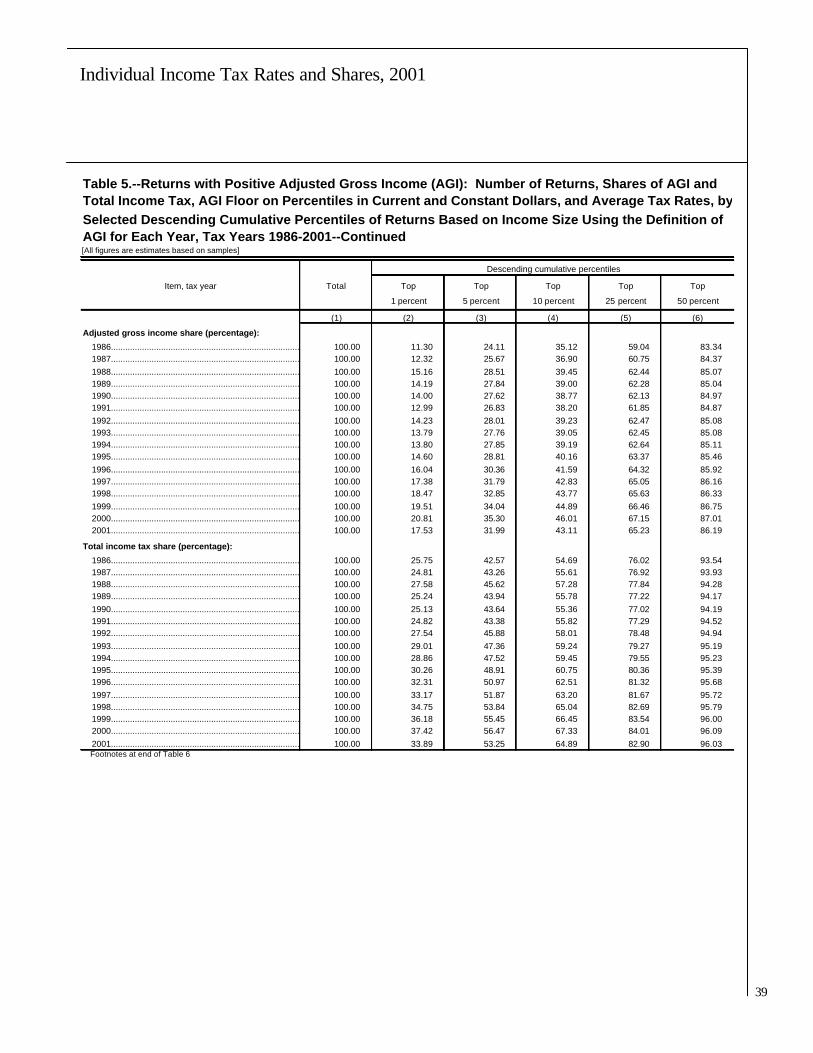
39
Individual Income Tax Rates and Shares, 2001
Table 5.--Returns with Positive Adjusted Gross Income (AGI): Number of Returns, Shares of AGI andTotal Income Tax, AGI Floor on Percentiles in Current and Constant Dollars, and Average Tax Rates, bySelected Descending Cumulative Percentiles of Returns Based on Income Size Using the Definition ofAGI for Each Year, Tax Years 1986-2001--Continued[All figures are estimates based on samples]
Descending cumulative percentiles
Item, tax year Total Top Top Top Top Top
1 percent 5 percent 10 percent 25 percent 50 percent
(1) (2) (3) (4) (5) (6)
Adjusted gross income share (percentage):
1986........................................................................................... 100.00 11.30 24.11 35.12 59.04 83.34 1987........................................................................................... 100.00 12.32 25.67 36.90 60.75 84.37 1988........................................................................................... 100.00 15.16 28.51 39.45 62.44 85.07 1989........................................................................................... 100.00 14.19 27.84 39.00 62.28 85.04 1990........................................................................................... 100.00 14.00 27.62 38.77 62.13 84.97 1991........................................................................................... 100.00 12.99 26.83 38.20 61.85 84.87 1992........................................................................................... 100.00 14.23 28.01 39.23 62.47 85.08 1993........................................................................................... 100.00 13.79 27.76 39.05 62.45 85.08 1994........................................................................................... 100.00 13.80 27.85 39.19 62.64 85.11 1995........................................................................................... 100.00 14.60 28.81 40.16 63.37 85.46 1996........................................................................................... 100.00 16.04 30.36 41.59 64.32 85.92 1997........................................................................................... 100.00 17.38 31.79 42.83 65.05 86.16 1998........................................................................................... 100.00 18.47 32.85 43.77 65.63 86.33 1999........................................................................................... 100.00 19.51 34.04 44.89 66.46 86.75 2000........................................................................................... 100.00 20.81 35.30 46.01 67.15 87.01 2001........................................................................................... 100.00 17.53 31.99 43.11 65.23 86.19
Total income tax share (percentage):
1986........................................................................................... 100.00 25.75 42.57 54.69 76.02 93.54 1987........................................................................................... 100.00 24.81 43.26 55.61 76.92 93.93 1988........................................................................................... 100.00 27.58 45.62 57.28 77.84 94.28 1989........................................................................................... 100.00 25.24 43.94 55.78 77.22 94.17 1990........................................................................................... 100.00 25.13 43.64 55.36 77.02 94.19 1991........................................................................................... 100.00 24.82 43.38 55.82 77.29 94.52 1992........................................................................................... 100.00 27.54 45.88 58.01 78.48 94.94 1993........................................................................................... 100.00 29.01 47.36 59.24 79.27 95.19 1994........................................................................................... 100.00 28.86 47.52 59.45 79.55 95.23 1995........................................................................................... 100.00 30.26 48.91 60.75 80.36 95.39 1996........................................................................................... 100.00 32.31 50.97 62.51 81.32 95.68 1997........................................................................................... 100.00 33.17 51.87 63.20 81.67 95.72 1998........................................................................................... 100.00 34.75 53.84 65.04 82.69 95.79 1999........................................................................................... 100.00 36.18 55.45 66.45 83.54 96.00 2000........................................................................................... 100.00 37.42 56.47 67.33 84.01 96.09 2001........................................................................................... 100.00 33.89 53.25 64.89 82.90 96.03 Footnotes at end of Table 6.

40
Individual Income Tax Rates and Shares, 2001
40
Table 6.--Returns with Positive Adjusted Gross Income (AGI): Number of Returns, Shares of AGI andTotal Income Tax, and Average Tax Rates, by Selected Ascending Cumulative Percentiles of Returns Based on Income Size Using the Definition of AGI for Each Year, Tax Years 1986-2001[All figures are estimates based on samples]
Ascending cumulative percentiles
Item, tax year Total Bottom Bottom Bottom Bottom Bottom
50 percent 75 percent 90 percent 95 percent 99 percent
(1) (2) (3) (4) (5) (6)
Number of returns: ¹ 1986...........................................................................................................102,087,623 51,043,811 76,565,717 91,878,861 96,983,242 101,066,747 1987...........................................................................................................106,154,761 53,077,380 79,616,071 95,539,285 100,847,023 105,093,213 1988...........................................................................................................108,872,858 54,436,429 81,654,643 97,985,572 103,429,215 107,784,129 1989...........................................................................................................111,312,721 55,656,361 83,484,542 100,181,451 105,747,087 110,199,596 1990...........................................................................................................112,812,262 56,406,132 84,609,198 101,531,038 107,171,651 111,684,141 1991...........................................................................................................113,804,104 56,902,052 85,353,078 102,423,694 108,113,899 112,666,063 1992...........................................................................................................112,652,759 56,326,380 84,489,560 101,387,483 107,020,121 111,526,231 1993...........................................................................................................113,681,387 56,840,693 85,261,040 102,313,248 107,997,318 112,544,573 1994...........................................................................................................114,989,920 57,494,960 86,242,440 103,490,928 109,240,424 113,840,021 1995...........................................................................................................117,274,186 58,637,093 87,955,640 105,546,767 111,410,477 116,101,444 1996...........................................................................................................119,441,767 59,720,883 89,581,325 107,497,590 113,469,679 118,247,349 1997...........................................................................................................121,503,284 60,751,642 91,127,463 109,352,956 115,428,120 120,288,251 1998...........................................................................................................123,775,831 61,887,916 92,831,873 111,398,248 117,587,039 122,538,073 1999...........................................................................................................126,008,974 63,004,487 94,506,731 113,408,077 119,708,525 124,748,884 2000...........................................................................................................128,227,143 64,113,572 96,170,357 115,404,429 121,815,786 126,944,872 2001...........................................................................................................128,817,051 64,408,526 96,612,788 115,935,346 122,376,198 127,528,880
Adjusted gross income (millions of dollars): 1986...........................................................................................................2,524,124 420,555 1,033,951 1,637,614 1,915,657 2,238,927 1987...........................................................................................................2,813,728 439,859 1,104,338 1,775,506 2,091,507 2,467,093 1988...........................................................................................................3,124,156 466,291 1,173,296 1,891,620 2,233,454 2,650,629 1989...........................................................................................................3,298,858 493,623 1,244,380 2,012,319 2,380,437 2,830,779 1990...........................................................................................................3,451,237 518,700 1,307,060 2,113,205 2,497,900 2,967,985 1991...........................................................................................................3,516,142 532,138 1,341,377 2,172,939 2,572,792 3,059,539 1992...........................................................................................................3,680,552 549,152 1,381,151 2,236,768 2,649,459 3,156,966 1993...........................................................................................................3,775,578 563,279 1,417,625 2,301,115 2,727,326 3,254,992 1994...........................................................................................................3,961,146 589,795 1,480,073 2,408,941 2,858,063 3,414,447 1995...........................................................................................................4,244,607 617,065 1,554,788 2,540,094 3,021,884 3,624,997 1996...........................................................................................................4,590,527 646,144 1,637,891 2,681,378 3,196,723 3,853,983 1997...........................................................................................................5,023,457 695,465 1,755,857 2,872,056 3,426,350 4,150,631 1998...........................................................................................................5,469,211 747,781 1,879,611 3,075,495 3,672,564 4,458,967 1999...........................................................................................................5,909,329 783,164 1,982,021 3,256,494 3,897,565 4,756,509 2000...........................................................................................................6,423,977 834,222 2,110,190 3,468,590 4,156,573 5,087,204 2001...........................................................................................................6,241,036 861,750 2,170,001 3,550,447 4,244,543 5,146,740
Total income tax (millions of dollars): ² 1986...........................................................................................................366,979 23,690 88,002 166,276 210,739 272,488 1987...........................................................................................................369,046 22,391 85,189 163,816 209,404 277,488 1988...........................................................................................................412,761 23,616 91,464 176,350 224,459 298,920 1989...........................................................................................................432,838 25,239 98,580 191,380 242,650 323,579 1990...........................................................................................................447,061 25,986 102,721 199,547 251,973 334,723 1991...........................................................................................................448,349 24,554 101,837 198,067 253,869 337,081 1992...........................................................................................................476,163 24,093 102,463 199,950 257,683 345,007 1993...........................................................................................................502,720 24,157 104,203 204,912 264,637 356,884 1994...........................................................................................................534,754 25,499 109,353 216,852 280,648 380,418 1995...........................................................................................................588,331 27,106 115,523 230,929 300,590 410,296 1996...........................................................................................................658,124 28,440 122,960 246,720 322,691 445,498 1997...........................................................................................................727,303 31,134 133,296 267,664 350,062 486,064 1998...........................................................................................................788,452 33,212 136,488 275,615 363,946 514,442 1999...........................................................................................................877,292 35,126 144,402 294,290 390,828 559,874 2000...........................................................................................................980,521 38,343 156,816 320,371 426,851 613,592 2001...........................................................................................................887,882 35,239 151,826 311,719 415,059 586,984 Footnotes at end of table.
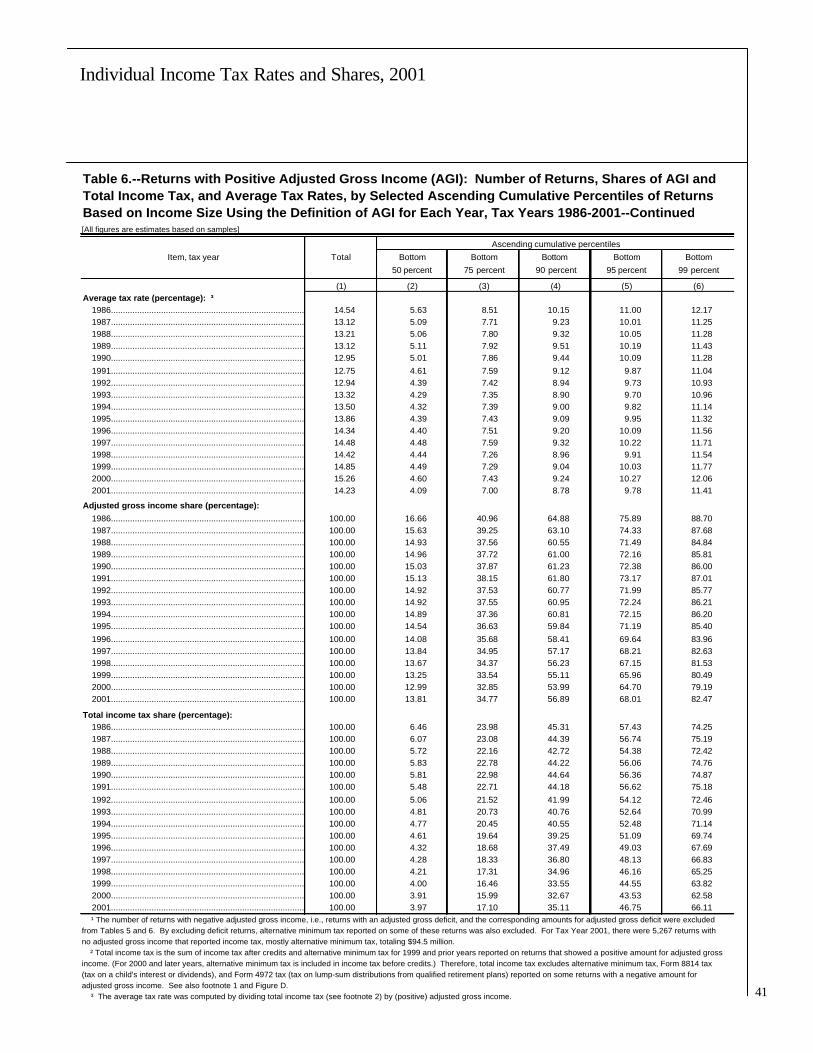
41
Individual Income Tax Rates and Shares, 2001
Table 6.--Returns with Positive Adjusted Gross Income (AGI): Number of Returns, Shares of AGI andTotal Income Tax, and Average Tax Rates, by Selected Ascending Cumulative Percentiles of Returns Based on Income Size Using the Definition of AGI for Each Year, Tax Years 1986-2001--Continued[All figures are estimates based on samples]
Ascending cumulative percentiles
Item, tax year Total Bottom Bottom Bottom Bottom Bottom
50 percent 75 percent 90 percent 95 percent 99 percent
(1) (2) (3) (4) (5) (6)Average tax rate (percentage): ³ 1986...........................................................................................................14.54 5.63 8.51 10.15 11.00 12.17 1987...........................................................................................................13.12 5.09 7.71 9.23 10.01 11.25 1988...........................................................................................................13.21 5.06 7.80 9.32 10.05 11.28 1989...........................................................................................................13.12 5.11 7.92 9.51 10.19 11.43 1990...........................................................................................................12.95 5.01 7.86 9.44 10.09 11.28
1991...........................................................................................................12.75 4.61 7.59 9.12 9.87 11.04 1992...........................................................................................................12.94 4.39 7.42 8.94 9.73 10.93 1993...........................................................................................................13.32 4.29 7.35 8.90 9.70 10.96 1994...........................................................................................................13.50 4.32 7.39 9.00 9.82 11.14 1995...........................................................................................................13.86 4.39 7.43 9.09 9.95 11.32 1996...........................................................................................................14.34 4.40 7.51 9.20 10.09 11.56 1997...........................................................................................................14.48 4.48 7.59 9.32 10.22 11.71 1998...........................................................................................................14.42 4.44 7.26 8.96 9.91 11.54 1999...........................................................................................................14.85 4.49 7.29 9.04 10.03 11.77 2000...........................................................................................................15.26 4.60 7.43 9.24 10.27 12.06 2001...........................................................................................................14.23 4.09 7.00 8.78 9.78 11.41
Adjusted gross income share (percentage):
1986...........................................................................................................100.00 16.66 40.96 64.88 75.89 88.70 1987...........................................................................................................100.00 15.63 39.25 63.10 74.33 87.68 1988...........................................................................................................100.00 14.93 37.56 60.55 71.49 84.84 1989...........................................................................................................100.00 14.96 37.72 61.00 72.16 85.81 1990...........................................................................................................100.00 15.03 37.87 61.23 72.38 86.00 1991...........................................................................................................100.00 15.13 38.15 61.80 73.17 87.01 1992...........................................................................................................100.00 14.92 37.53 60.77 71.99 85.77 1993...........................................................................................................100.00 14.92 37.55 60.95 72.24 86.21 1994...........................................................................................................100.00 14.89 37.36 60.81 72.15 86.20 1995...........................................................................................................100.00 14.54 36.63 59.84 71.19 85.40
1996...........................................................................................................100.00 14.08 35.68 58.41 69.64 83.96 1997...........................................................................................................100.00 13.84 34.95 57.17 68.21 82.63 1998...........................................................................................................100.00 13.67 34.37 56.23 67.15 81.53 1999...........................................................................................................100.00 13.25 33.54 55.11 65.96 80.49 2000...........................................................................................................100.00 12.99 32.85 53.99 64.70 79.19 2001...........................................................................................................100.00 13.81 34.77 56.89 68.01 82.47
Total income tax share (percentage): 1986...........................................................................................................100.00 6.46 23.98 45.31 57.43 74.25 1987...........................................................................................................100.00 6.07 23.08 44.39 56.74 75.19 1988...........................................................................................................100.00 5.72 22.16 42.72 54.38 72.42 1989...........................................................................................................100.00 5.83 22.78 44.22 56.06 74.76 1990...........................................................................................................100.00 5.81 22.98 44.64 56.36 74.87 1991...........................................................................................................100.00 5.48 22.71 44.18 56.62 75.18
1992...........................................................................................................100.00 5.06 21.52 41.99 54.12 72.46 1993...........................................................................................................100.00 4.81 20.73 40.76 52.64 70.99 1994...........................................................................................................100.00 4.77 20.45 40.55 52.48 71.14 1995...........................................................................................................100.00 4.61 19.64 39.25 51.09 69.74 1996...........................................................................................................100.00 4.32 18.68 37.49 49.03 67.69 1997...........................................................................................................100.00 4.28 18.33 36.80 48.13 66.83 1998...........................................................................................................100.00 4.21 17.31 34.96 46.16 65.25 1999...........................................................................................................100.00 4.00 16.46 33.55 44.55 63.82 2000...........................................................................................................100.00 3.91 15.99 32.67 43.53 62.58 2001...........................................................................................................100.00 3.97 17.10 35.11 46.75 66.11 ¹ The number of returns with negative adjusted gross income, i.e., returns with an adjusted gross deficit, and the corresponding amounts for adjusted gross deficit were excluded from Tables 5 and 6. By excluding deficit returns, alternative minimum tax reported on some of these returns was also excluded. For Tax Year 2001, there were 5,267 returns with no adjusted gross income that reported income tax, mostly alternative minimum tax, totaling $94.5 million. ² Total income tax is the sum of income tax after credits and alternative minimum tax for 1999 and prior years reported on returns that showed a positive amount for adjusted gross income. (For 2000 and later years, alternative minimum tax is included in income tax before credits.) Therefore, total income tax excludes alternative minimum tax, Form 8814 tax (tax on a child's interest or dividends), and Form 4972 tax (tax on lump-sum distributions from qualified retirement plans) reported on some returns with a negative amount for adjusted gross income. See also footnote 1 and Figure D. ³ The average tax rate was computed by dividing total income tax (see footnote 2) by (positive) adjusted gross income.

42
Individual Income Tax Rates and Shares, 2001
42
Table 7.--Returns with Positive "1979 Income Concept" Income: Number of Returns, Shares of Income and Total Income Tax, Income Floor on Percentiles in Current and Constant Dollars, and Average Tax Rates, by Selected Descending Cumulative Percentiles of Returns Based on Income Size, Tax Years 1986-2001[All figures are estimates based on samples]
Descending cumulative percentiles
Item, tax year Total Top Top Top Top Top
1 percent 5 percent 10 percent 25 percent 50 percent
(1) (2) (3) (4) (5) (6)
Number of returns: 1986.......................................................................................................................101,988,805 1,019,888 5,099,440 10,198,881 25,497,201 50,994,402 1987.......................................................................................................................106,191,624 1,061,916 5,309,581 10,619,162 26,547,906 53,095,812 1988.......................................................................................................................108,879,154 1,088,792 5,443,958 10,887,915 27,219,788 54,439,577 1989.......................................................................................................................111,328,835 1,113,288 5,566,442 11,132,884 27,832,209 55,664,418 1990.......................................................................................................................112,717,959 1,127,180 5,635,898 11,271,796 28,179,490 56,358,980 1991.......................................................................................................................113,823,123 1,138,231 5,691,156 11,382,312 28,455,781 56,911,562 1992.......................................................................................................................112,687,747 1,126,877 5,634,387 11,268,775 28,171,937 56,343,874 1993.......................................................................................................................113,721,706 1,137,217 5,686,085 11,372,171 28,430,426 56,860,853 1994.......................................................................................................................115,061,112 1,150,611 5,753,056 11,506,111 28,765,278 57,530,556 1995.......................................................................................................................117,333,779 1,173,338 5,866,689 11,733,378 29,333,445 58,666,889 1996.......................................................................................................................119,487,813 1,194,878 5,974,391 11,948,781 29,871,953 59,743,906 1997.......................................................................................................................121,555,156 1,215,552 6,077,758 12,155,516 30,388,789 60,777,578 1998 .......................................................................................................................123,852,016 1,238,520 6,192,601 12,385,202 30,963,004 61,926,008 1999.......................................................................................................................126,107,596 1,261,076 6,305,380 12,610,760 31,526,899 63,053,798 2000.......................................................................................................................128,340,271 1,283,403 6,417,014 12,834,027 32,085,068 64,170,135 2001.......................................................................................................................128,863,007 1,288,630 6,443,150 12,886,301 32,215,752 64,431,504
Income floor on percentiles (current dollars): 1986.......................................................................................................................N/A 147,863 68,362 52,035 33,623 17,909 1987.......................................................................................................................N/A 145,624 69,222 53,094 34,165 17,959 1988.......................................................................................................................N/A 161,774 73,451 55,532 35,432 18,534 1989.......................................................................................................................N/A 169,603 77,542 58,429 36,783 19,152 1990.......................................................................................................................N/A 174,813 80,400 60,623 38,026 19,947 1991.......................................................................................................................N/A 180,268 83,300 62,413 38,913 20,302 1992.......................................................................................................................N/A 197,031 87,370 65,283 40,423 21,041 1993.......................................................................................................................N/A 199,698 88,992 66,685 41,013 21,390 1994.......................................................................................................................N/A 210,742 93,186 69,118 42,480 22,000 1995.......................................................................................................................N/A 224,523 98,420 72,210 43,860 22,575 1996.......................................................................................................................N/A 246,268 103,489 75,574 45,508 23,378 1997.......................................................................................................................N/A 268,889 110,949 79,598 47,738 24,551 1998.......................................................................................................................N/A 301,513 120,262 84,904 50,232 25,612 1999.......................................................................................................................N/A 332,253 126,643 89,172 52,399 26,487 2000.......................................................................................................................N/A 353,945 134,128 93,715 54,592 27,647 2001.......................................................................................................................N/A 323,861 131,728 93,633 55,203 28,404
Income floor on percentiles (constant dollars): ¹ 1986.......................................................................................................................N/A 134,912 62,374 47,477 30,678 16,340 1987.......................................................................................................................N/A 128,190 60,935 46,738 30,075 15,809 1988.......................................................................................................................N/A 136,749 62,089 46,942 29,951 15,667 1989.......................................................................................................................N/A 136,777 62,534 47,120 29,664 15,445 1990.......................................................................................................................N/A 133,751 61,515 46,383 29,094 15,262 1991.......................................................................................................................N/A 132,355 61,160 45,825 28,571 14,906 1992.......................................................................................................................N/A 140,436 62,274 46,531 28,812 14,997 1993.......................................................................................................................N/A 138,199 61,586 46,149 28,383 14,803 1994.......................................................................................................................N/A 142,201 62,879 46,638 28,664 14,845 1995.......................................................................................................................N/A 147,325 64,580 47,382 28,780 14,813 1996.......................................................................................................................N/A 156,959 65,959 48,167 29,004 14,900 1997.......................................................................................................................N/A 167,532 69,127 49,594 29,743 15,297 1998 .......................................................................................................................N/A 183,962 73,375 51,802 30,648 15,627 1999.......................................................................................................................N/A 199,432 76,016 53,525 31,452 15,899 2000.......................................................................................................................N/A 205,543 77,891 54,422 31,703 16,055 2001.......................................................................................................................N/A 182,869 74,381 52,870 31,171 16,038
Footnotes at end of Table 8.
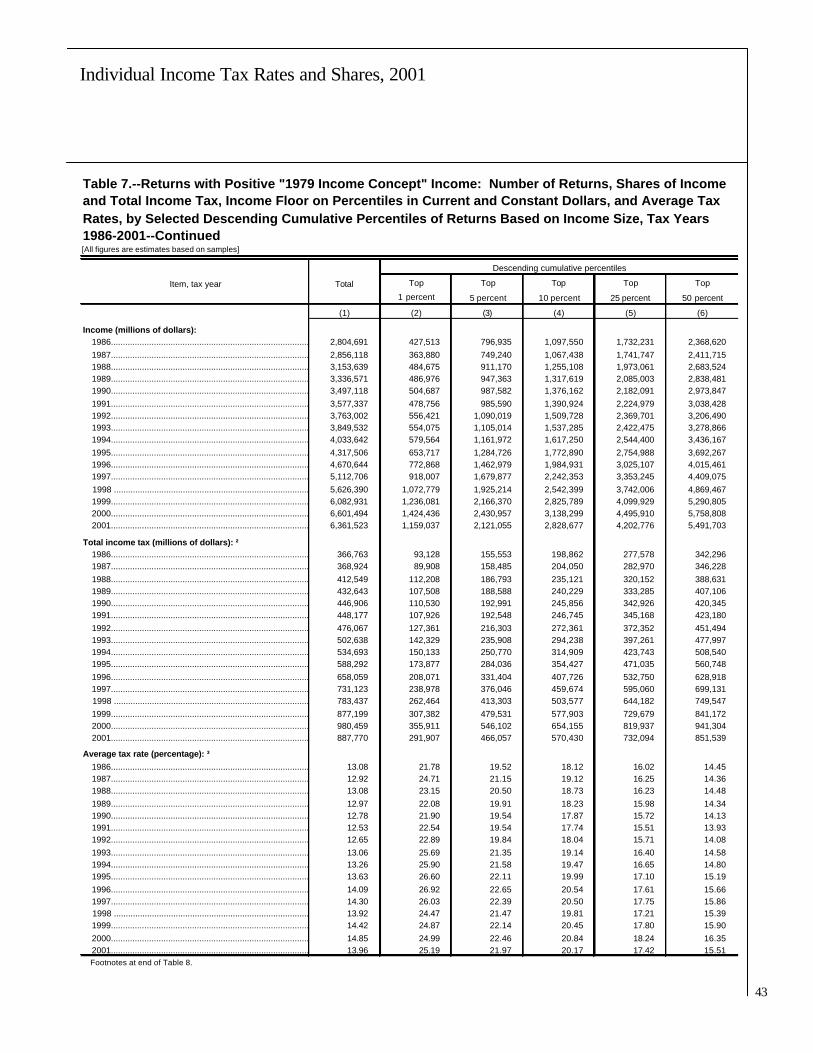
43
Individual Income Tax Rates and Shares, 2001
Table 7.--Returns with Positive "1979 Income Concept" Income: Number of Returns, Shares of Income and Total Income Tax, Income Floor on Percentiles in Current and Constant Dollars, and Average Tax Rates, by Selected Descending Cumulative Percentiles of Returns Based on Income Size, Tax Years 1986-2001--Continued[All figures are estimates based on samples]
Descending cumulative percentiles
Item, tax year Total Top Top Top Top Top
1 percent 5 percent 10 percent 25 percent 50 percent
(1) (2) (3) (4) (5) (6)
Income (millions of dollars): 1986.......................................................................................................................2,804,691 427,513 796,935 1,097,550 1,732,231 2,368,620 1987.......................................................................................................................2,856,118 363,880 749,240 1,067,438 1,741,747 2,411,715 1988.......................................................................................................................3,153,639 484,675 911,170 1,255,108 1,973,061 2,683,524 1989.......................................................................................................................3,336,571 486,976 947,363 1,317,619 2,085,003 2,838,481 1990.......................................................................................................................3,497,118 504,687 987,582 1,376,162 2,182,091 2,973,847 1991.......................................................................................................................3,577,337 478,756 985,590 1,390,924 2,224,979 3,038,428 1992.......................................................................................................................3,763,002 556,421 1,090,019 1,509,728 2,369,701 3,206,490 1993.......................................................................................................................3,849,532 554,075 1,105,014 1,537,285 2,422,475 3,278,866 1994.......................................................................................................................4,033,642 579,564 1,161,972 1,617,250 2,544,400 3,436,167 1995.......................................................................................................................4,317,506 653,717 1,284,726 1,772,890 2,754,988 3,692,267 1996.......................................................................................................................4,670,644 772,868 1,462,979 1,984,931 3,025,107 4,015,461 1997.......................................................................................................................5,112,706 918,007 1,679,877 2,242,353 3,353,245 4,409,075 1998 .......................................................................................................................5,626,390 1,072,779 1,925,214 2,542,399 3,742,006 4,869,467 1999.......................................................................................................................6,082,931 1,236,081 2,166,370 2,825,789 4,099,929 5,290,805 2000.......................................................................................................................6,601,494 1,424,436 2,430,957 3,138,299 4,495,910 5,758,808 2001.......................................................................................................................6,361,523 1,159,037 2,121,055 2,828,677 4,202,776 5,491,703
Total income tax (millions of dollars): ² 1986.......................................................................................................................366,763 93,128 155,553 198,862 277,578 342,296 1987.......................................................................................................................368,924 89,908 158,485 204,050 282,970 346,228 1988.......................................................................................................................412,549 112,208 186,793 235,121 320,152 388,631 1989.......................................................................................................................432,643 107,508 188,588 240,229 333,285 407,106 1990.......................................................................................................................446,906 110,530 192,991 245,856 342,926 420,345 1991.......................................................................................................................448,177 107,926 192,548 246,745 345,168 423,180 1992.......................................................................................................................476,067 127,361 216,303 272,361 372,352 451,494 1993.......................................................................................................................502,638 142,329 235,908 294,238 397,261 477,997 1994.......................................................................................................................534,693 150,133 250,770 314,909 423,743 508,540 1995.......................................................................................................................588,292 173,877 284,036 354,427 471,035 560,748 1996.......................................................................................................................658,059 208,071 331,404 407,726 532,750 628,918 1997.......................................................................................................................731,123 238,978 376,046 459,674 595,060 699,131 1998 .......................................................................................................................783,437 262,464 413,303 503,577 644,182 749,547 1999.......................................................................................................................877,199 307,382 479,531 577,903 729,679 841,172 2000.......................................................................................................................980,459 355,911 546,102 654,155 819,937 941,304 2001.......................................................................................................................887,770 291,907 466,057 570,430 732,094 851,539
Average tax rate (percentage): ³ 1986.......................................................................................................................13.08 21.78 19.52 18.12 16.02 14.45 1987.......................................................................................................................12.92 24.71 21.15 19.12 16.25 14.36 1988.......................................................................................................................13.08 23.15 20.50 18.73 16.23 14.48 1989.......................................................................................................................12.97 22.08 19.91 18.23 15.98 14.34 1990.......................................................................................................................12.78 21.90 19.54 17.87 15.72 14.13 1991.......................................................................................................................12.53 22.54 19.54 17.74 15.51 13.93 1992.......................................................................................................................12.65 22.89 19.84 18.04 15.71 14.08 1993.......................................................................................................................13.06 25.69 21.35 19.14 16.40 14.58 1994.......................................................................................................................13.26 25.90 21.58 19.47 16.65 14.80 1995.......................................................................................................................13.63 26.60 22.11 19.99 17.10 15.19 1996.......................................................................................................................14.09 26.92 22.65 20.54 17.61 15.66 1997.......................................................................................................................14.30 26.03 22.39 20.50 17.75 15.86 1998 .......................................................................................................................13.92 24.47 21.47 19.81 17.21 15.39 1999.......................................................................................................................14.42 24.87 22.14 20.45 17.80 15.90 2000.......................................................................................................................14.85 24.99 22.46 20.84 18.24 16.35 2001.......................................................................................................................13.96 25.19 21.97 20.17 17.42 15.51 Footnotes at end of Table 8.

44
Individual Income Tax Rates and Shares, 2001
44
Table 7.--Returns with Positive "1979 Income Concept" Income: Number of Returns, Shares of Income and Total Income Tax, Income Floor on Percentiles in Current and Constant Dollars, and Average Tax Rates, by Selected Descending Cumulative Percentiles of Returns Based on Income Size, Tax Years 1986-2001--Continued[All figures are estimates based on samples]
Descending cumulative percentiles
Item, tax year Total Top Top Top Top Top
1 percent 5 percent 10 percent 25 percent 50 percent
(1) (2) (3) (4) (5) (6)
Income share (percentage): 1986.......................................................................................................................100.00 15.24 28.41 39.13 61.76 84.45 1987.......................................................................................................................100.00 12.74 26.23 37.37 60.98 84.44 1988.......................................................................................................................100.00 15.37 28.89 39.80 62.56 85.09 1989.......................................................................................................................100.00 14.60 28.39 39.49 62.49 85.07 1990.......................................................................................................................100.00 14.43 28.24 39.35 62.40 85.04 1991.......................................................................................................................100.00 13.38 27.55 38.88 62.20 84.94 1992.......................................................................................................................100.00 14.79 28.97 40.12 62.97 85.21 1993.......................................................................................................................100.00 14.39 28.71 39.93 62.93 85.18 1994.......................................................................................................................100.00 14.37 28.81 40.09 63.08 85.19 1995.......................................................................................................................100.00 15.14 29.76 41.06 63.81 85.52 1996.......................................................................................................................100.00 16.55 31.32 42.50 64.77 85.97 1997.......................................................................................................................100.00 17.96 32.86 43.86 65.59 86.24 1998 .......................................................................................................................100.00 19.07 34.22 45.19 66.51 86.55 1999.......................................................................................................................100.00 20.32 35.61 46.45 67.40 86.98 2000.......................................................................................................................100.00 21.58 36.82 47.54 68.10 87.23 2001.......................................................................................................................100.00 18.22 33.34 44.47 66.07 86.33
Total income tax share (percentage): 1986.......................................................................................................................100.00 25.39 42.41 54.22 75.68 93.33 1987.......................................................................................................................100.00 24.37 42.96 55.31 76.70 93.85 1988.......................................................................................................................100.00 27.20 45.28 56.99 77.60 94.20 1989.......................................................................................................................100.00 24.85 43.59 55.53 77.03 94.10 1990.......................................................................................................................100.00 24.73 43.18 55.01 76.73 94.06 1991.......................................................................................................................100.00 24.08 42.96 55.06 77.02 94.42 1992.......................................................................................................................100.00 26.75 45.44 57.21 78.21 94.84 1993.......................................................................................................................100.00 28.32 46.93 58.54 79.04 95.10 1994.......................................................................................................................100.00 28.08 46.90 58.90 79.25 95.11 1995.......................................................................................................................100.00 29.56 48.28 60.25 80.07 95.32 1996.......................................................................................................................100.00 31.62 50.36 61.96 80.96 95.57 1997.......................................................................................................................100.00 32.69 51.43 62.87 81.39 95.62 1998 .......................................................................................................................100.00 33.50 52.76 64.28 82.23 95.67 1999.......................................................................................................................100.00 35.04 54.67 65.88 83.18 95.89 2000.......................................................................................................................100.00 36.30 55.70 66.72 83.63 96.01 2001.......................................................................................................................100.00 32.88 52.50 64.25 82.46 95.92 Footnotes at end of Table 8.

45
Individual Income Tax Rates and Shares, 2001
Table 8.--Returns with Positive "1979 Income Concept" Income: Number of Returns, Shares of Income and Total Income Tax, and Average Tax Rates, by Selected Ascending Cumulative Percentiles of Returns Based on Income Size, Tax Years 1986-2001[All figures are estimates based on samples]
Ascending cumulative percentiles
Item, tax year Total Bottom Bottom Bottom Bottom Bottom
50 percent 75 percent 90 percent 95 percent 99 percent
(1) (2) (3) (4) (5) (6)
Number of returns: 1986........................................................................................................101,988,805 50,994,402 76,491,604 91,789,924 96,889,365 100,968,917 1987........................................................................................................106,191,624 53,095,812 79,643,718 95,572,462 100,882,043 105,129,708 1988........................................................................................................108,879,154 54,439,577 81,659,366 97,991,239 103,435,196 107,790,362 1989........................................................................................................111,328,835 55,664,417 83,496,626 100,195,951 105,762,393 110,215,547 1990........................................................................................................112,717,959 56,358,980 84,538,469 101,446,163 107,082,061 111,590,779 1991........................................................................................................113,823,123 56,911,562 85,367,342 102,440,811 108,131,967 112,684,892 1992........................................................................................................112,687,747 56,343,874 84,515,810 101,418,972 107,053,360 111,560,870 1993........................................................................................................113,721,706 56,860,853 85,291,280 102,349,535 108,035,621 112,584,489 1994........................................................................................................115,061,112 57,530,556 86,295,834 103,555,001 109,308,056 113,910,501 1995........................................................................................................117,333,779 58,666,890 88,000,334 105,600,401 111,467,090 116,160,441 1996........................................................................................................119,487,813 59,743,907 89,615,860 107,539,032 113,513,422 118,292,935 1997........................................................................................................121,555,156 60,777,578 91,166,367 109,399,640 115,477,398 120,339,604 1998 ........................................................................................................123,852,016 61,926,008 92,889,012 111,466,814 117,659,415 122,613,496 1999........................................................................................................126,107,596 63,053,798 94,580,697 113,496,836 119,802,216 124,846,520 2000........................................................................................................128,340,271 64,170,135 96,255,203 115,506,243 121,923,257 127,056,868 2001........................................................................................................128,863,007 64,431,504 96,647,255 115,976,706 122,419,857 127,574,377
Income (millions of dollars): 1986........................................................................................................2,804,691 436,071 1,072,460 1,707,142 2,007,756 2,377,178 1987........................................................................................................2,856,118 444,403 1,114,372 1,788,680 2,106,878 2,492,238 1988........................................................................................................3,153,639 470,115 1,180,578 1,898,531 2,242,469 2,668,964 1989........................................................................................................3,336,571 498,089 1,251,567 2,018,952 2,389,207 2,849,595 1990........................................................................................................3,497,118 523,271 1,315,027 2,120,956 2,509,535 2,992,431 1991........................................................................................................3,577,337 538,910 1,352,358 2,186,413 2,591,748 3,098,582 1992........................................................................................................3,763,002 556,512 1,393,300 2,253,273 2,672,983 3,206,581 1993........................................................................................................3,849,532 570,666 1,427,057 2,312,247 2,744,518 3,295,456 1994........................................................................................................4,033,642 597,475 1,489,242 2,416,392 2,871,670 3,454,078 1995........................................................................................................4,317,506 625,239 1,562,518 2,544,615 3,032,780 3,663,789 1996........................................................................................................4,670,644 655,183 1,645,537 2,685,713 3,207,665 3,897,777 1997........................................................................................................5,112,706 703,631 1,759,461 2,870,353 3,432,828 4,194,699 1998 ........................................................................................................5,626,390 756,923 1,884,384 3,083,991 3,701,176 4,553,611 1999........................................................................................................6,082,931 792,125 1,983,002 3,257,142 3,916,561 4,846,850 2000........................................................................................................6,601,494 842,686 2,105,584 3,463,195 4,170,537 5,177,058 2001........................................................................................................6,361,523 869,820 2,158,748 3,532,846 4,240,468 5,202,486
Total income tax (millions of dollars): ² 1986........................................................................................................366,763 24,467 89,186 167,901 211,210 273,635 1987........................................................................................................368,924 22,696 85,954 164,874 210,439 279,016 1988........................................................................................................412,549 23,918 92,397 177,429 225,756 300,341 1989........................................................................................................432,643 25,537 99,358 192,414 244,055 325,135 1990........................................................................................................446,906 26,562 103,980 201,050 253,915 336,376 1991........................................................................................................448,177 24,997 103,009 201,432 255,629 340,251 1992........................................................................................................476,067 24,573 103,715 203,706 259,764 348,706 1993........................................................................................................502,638 24,641 105,377 208,400 266,730 360,309 1994........................................................................................................534,693 26,153 110,950 219,783 283,923 384,560 1995........................................................................................................588,292 27,544 117,257 233,864 304,256 414,415 1996........................................................................................................658,059 29,142 125,310 250,333 326,655 449,988 1997........................................................................................................731,123 31,992 136,063 271,450 355,078 492,146 1998 ........................................................................................................783,437 33,889 139,249 279,860 370,134 520,973 1999........................................................................................................877,199 36,027 147,520 299,294 397,669 569,817 2000........................................................................................................980,459 39,155 160,521 326,304 434,357 624,548 2001........................................................................................................887,770 36,230 155,676 317,341 421,713 595,863 Footnotes at end of table.

46
Individual Income Tax Rates and Shares, 2001
46
Table 8.--Returns with Positive "1979 Income Concept" Income: Number of Returns, Shares of Income and Total Income Tax, and Average Tax Rates, by Selected Ascending Cumulative Percentiles of Returns Based on Income Size, Tax Years 1986-2001--Continued[All figures are estimates based on samples]
Ascending cumulative percentiles
Item, tax year Total Bottom Bottom Bottom Bottom Bottom
50 percent 75 percent 90 percent 95 percent 99 percent
(1) (2) (3) (4) (5) (6)Average tax rate (percentage): ³ 1986........................................................................................................13.08 5.61 8.32 9.84 10.52 11.51 1987........................................................................................................12.92 5.11 7.71 9.22 9.99 11.20 1988........................................................................................................13.08 5.09 7.83 9.35 10.07 11.25 1989........................................................................................................12.97 5.13 7.94 9.53 10.21 11.41 1990........................................................................................................12.78 5.08 7.91 9.48 10.12 11.24 1991........................................................................................................12.53 4.64 7.62 9.21 9.86 10.98 1992........................................................................................................12.65 4.42 7.44 9.04 9.72 10.87 1993........................................................................................................13.06 4.32 7.38 9.01 9.72 10.93 1994........................................................................................................13.26 4.38 7.45 9.10 9.89 11.13 1995........................................................................................................13.63 4.41 7.50 9.19 10.03 11.31 1996........................................................................................................14.09 4.45 7.62 9.32 10.18 11.54 1997........................................................................................................14.30 4.55 7.73 9.46 10.34 11.73 1998 ........................................................................................................13.92 4.48 7.39 9.07 10.00 11.44 1999........................................................................................................14.42 4.55 7.44 9.19 10.15 11.76 2000........................................................................................................14.85 4.65 7.62 9.42 10.41 12.06 2001........................................................................................................13.96 4.17 7.21 8.98 9.95 11.45
Income share (percentage): 1986........................................................................................................100.00 15.55 38.24 60.87 71.59 84.76 1987........................................................................................................100.00 15.56 39.02 62.63 73.77 87.26 1988........................................................................................................100.00 14.91 37.44 60.20 71.11 84.63 1989........................................................................................................100.00 14.93 37.51 60.51 71.61 85.40 1990........................................................................................................100.00 14.96 37.60 60.65 71.76 85.57 1991........................................................................................................100.00 15.06 37.80 61.12 72.45 86.62 1992........................................................................................................100.00 14.79 37.03 59.88 71.03 85.21 1993........................................................................................................100.00 14.82 37.07 60.07 71.29 85.61 1994........................................................................................................100.00 14.81 36.92 59.91 71.19 85.63 1995........................................................................................................100.00 14.48 36.19 58.94 70.24 84.86 1996........................................................................................................100.00 14.03 35.23 57.50 68.68 83.45 1997........................................................................................................100.00 13.76 34.41 56.14 67.14 82.04 1998 ........................................................................................................100.00 13.45 33.49 54.81 65.78 80.93 1999........................................................................................................100.00 13.02 32.60 53.55 64.39 79.68 2000........................................................................................................100.00 12.77 31.90 52.46 63.18 78.42 2001........................................................................................................100.00 13.67 33.93 55.53 66.66 81.78
Total income tax share (percentage): 1986........................................................................................................100.00 6.67 24.32 45.78 57.59 74.61 1987........................................................................................................100.00 6.15 23.30 44.69 57.04 75.63 1988........................................................................................................100.00 5.80 22.40 43.01 54.72 72.80 1989........................................................................................................100.00 5.90 22.97 44.47 56.41 75.15 1990........................................................................................................100.00 5.94 23.27 44.99 56.82 75.27 1991........................................................................................................100.00 5.58 22.98 44.94 57.04 75.92 1992........................................................................................................100.00 5.16 21.79 42.79 54.56 73.25 1993........................................................................................................100.00 4.90 20.96 41.46 53.07 71.68 1994........................................................................................................100.00 4.89 20.75 41.10 53.10 71.92 1995........................................................................................................100.00 4.68 19.93 39.75 51.72 70.44 1996........................................................................................................100.00 4.43 19.04 38.04 49.64 68.38 1997........................................................................................................100.00 4.38 18.61 37.13 48.57 67.31 1998 ........................................................................................................100.00 4.33 17.77 35.72 47.24 66.50 1999........................................................................................................100.00 4.11 16.82 34.12 45.33 64.96 2000........................................................................................................100.00 3.99 16.37 33.28 44.30 63.70 2001........................................................................................................100.00 4.08 17.54 35.75 47.50 67.12 ¹ For Table 7, constant dollars were calculated using the U.S. Bureau of Labor Statistics' consumer price index for urban consumers (CPI-U, 1982-84=100). See footnote 2 of thisarticle for further details. ² Total income tax is the sum of income tax after credits and the alternative minimum tax for 1999 and prior years. For 2000 and 2001, alternative minimum tax is included in income tax before credits (see Figure D). ³ Average tax rate was computed by dividing total income tax by income, using the 1979 income concept (see text and Figure I).
4