Embed Size (px)
Citation preview
Individual Income Tax Rates and Taxes Shares,1990by Sarah E Nutter
Nearly 89.9 million (79 percent) of the 113.7 millionindividual income tax returns filed for Tax Year1990 reported an income tax liability. The liability
shown on these "taxable returns" totaled $447.1 billion, anaverage of $4,976 per return. The "average tax rate" forthese taxable returns was 13.55 percent, continuing adecline from 13.81 percent and 13.71 percent for 1988and 1989, respectively, the first 2 years of the two-bracketrate structure (with an effective third-bracket for certainincome ranges) introduced under the Tax Reform Act of1986.
The Tax Reform Act of 1986 (TRA86) introducedmany changes in the tax treatment of income, losses, anddeductions, which resulted in a broader definition of"adjusted gross income" (AGI) for tax years after 1986[1]. All other things being equal, this broadened defini-tion of AGI would reduce the average income tax rate,even if economic income and tax rates remained the same.Thus, direct comparisons of the average tax rates for 1987and subsequent years with those for earlier years can bemisleading. To overcome this limitation and to facilitatecomparisons of income and income tax rates before andafter the redefinition of AGI by TRAM, the AGI statisticshave also been recomputed for 1985 and subsequent yearsusing a consistent definition of income. Using this consis-tent definition of income, the average tax rates were 13.56percent for 1985; 13.59 percent for 1986; 13.49 for 1987;13.71 percent for 1988; 13.58 percent for 1989; and 13.41percent for 1990.
1990 Tax Law HighlightsTo put the discussion of individual income tax rates andtax shares into perspective, the following sections brieflydescribe the Federal individual income tax structure,major individual income tax law changes for 1990, andtwo Statistics of Income (SOI) concepts of income (the"1979 Income Concept" and the "modified" taxableincome concept) used for this article.
Income Tax StructureEach year, taxpayers must file an income tax return if theymeet certain minimum filing requirements. The filingrequirements for 1990 were generally based on theamount of "gross income," filing status, marital status,age, and, to a lesser extent, on dependency, blindness, andthe amount of self-employment income [2]. As definedunder section 61 of the Internal Revenue Code, grossincome included all income (legal or illegal), received in
Sarah E. Nutter is an economist with the Foreign ReturnsAnalysis Section. This article was prepared under thedirection of Chris Carson, Chief.
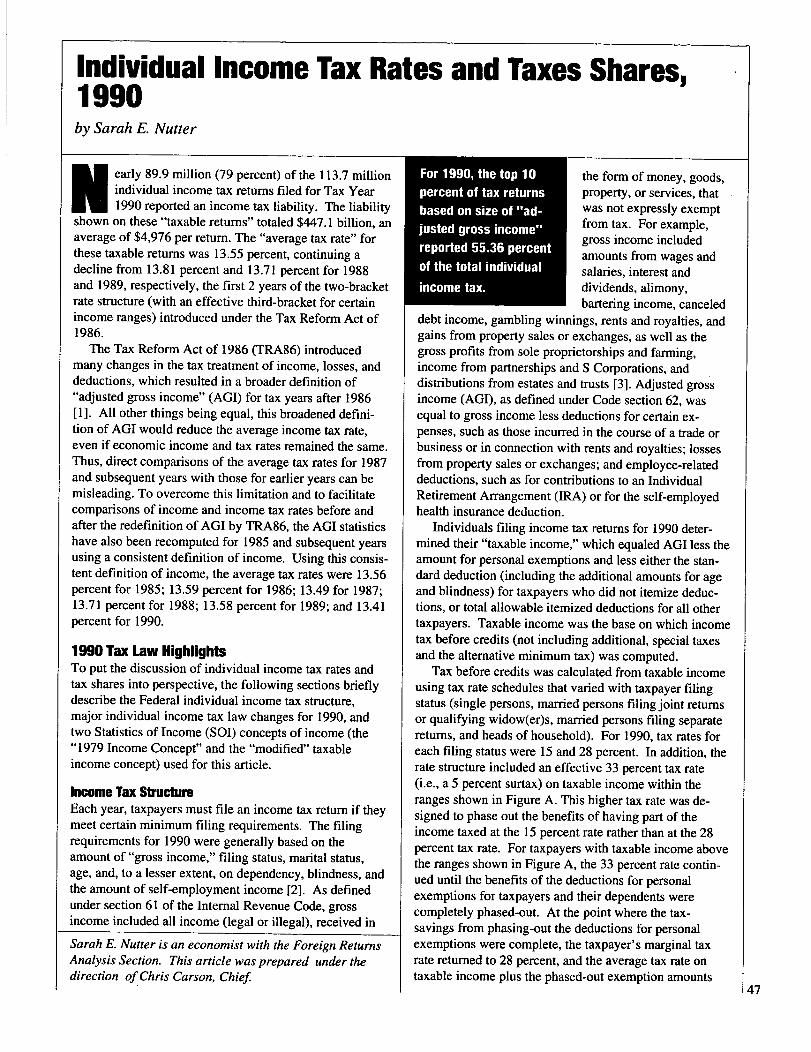
For 1990, the top 10percent of tax returnsbased on size of "ad-justed gross income"reported 55.36 percentof the total individual
income tax.
the form of money, goods,property, or services, thatwas not expressly exemptfrom tax. For example,gross income includedamounts from wages andsalaries, interest anddividends, alimony,bartering income, canceled
debt income, gambling winnings, rents and royalties, andgains from property sales or exchanges, as well as thegross profits from sole proprietorships and farming,income from partnerships and S Corporations, anddistributions from estates and trusts [3]. Adjusted grossincome (AGI), as defined under Code section 62, wasequal to gross income less deductions for certain ex-penses, such as those incurred in the course of a trade orbusiness or in connection with rents and royalties; lossesfrom property sales or exchanges; and employee-relateddeductions, such as for contributions to an IndividualRetirement Arrangement (IRA) or for the self-employedhealth insurance deduction.
Individuals filing income tax returns for 1990 deter-mined their "taxable income," which equaled AGI less theamount for personal exemptions and less either the stan-dard deduction (including the additional amounts for ageand blindness) for taxpayers who did not itemize deduc-tions, or total allowable itemized deductions for all othertaxpayers. Taxable income was the base on which incometax before credits (not including additional, special taxesand the alternative minimum tax) was computed.
Tax before credits was calculated from taxable incomeusing tax rate schedules that varied with taxpayer filingstatus (single persons, married persons filing joint returnsor qualifying widow(er)s, married persons filing separatereturns, and heads of household). For 1990, tax rates foreach filing status were 15 and 28 percent. In addition, therate structure included an effective 33 percent tax rate(i.e., a 5 percent surtax) on taxable income within theranges shown in Figure A. This higher tax rate was de-signed to phase out the benefits of having part of theincome taxed at the 15 percent rate rather than at the 28percent tax rate. For taxpayers with taxable income abovethe ranges shown in Figure A, the 33 percent rate contin-ued until the benefits of the deductions for personalexemptions for taxpayers and their dependents werecompletely phased-out. At the point where the tax-savings from phasing-out the deductions for personalexemptions were complete, the taxpayer's marginal taxrate returned to 28 percent, and the average tax rate ontaxable income plus the phased-out exemption amounts
47
Individual Income Tax Rates and Tax Shares, 1990
Figure A
Ranges of Taxable Income to Which the 33 PercentRate Applied, by Filing Status, Tax Year 1990[Money arnounts are in whole dollars]
Filing status
Head of household .........................
Married filing jointly ........................
Married filing separately .................
Taxable income range
$ 47,050 to $ 97,620$ 67,200 to $134,930$ 78,400 to $162,770$ 39,200 to $123,570
for these returins became 28 percent [4].To calculate their Federal income tax liability, taxpay-
ers used either the (look-up) tax tables or the tax rateschedules. Taxpayers with taxable incomes less than$50,000 were required to use the tax tables, while thosewith taxable income of $50,000 or more were required touse the'tax rate schedules. The tax tables were based on,income tax "brackets" that were $50 wide and the mid-point of the bracket was used to calculate the tax with thetax- rounded- to-the-nearest-dollar.-As-a-result~-the-tax-tables and the tax rate schedules could produce a differentamount of tax for the same amount of taxable income.The highest marginal tax rate imbedded in the tax tableswas 33 perce nt for 1990 for taxpayers using the single ormarried-filing separately- status;-for-taxpayers-using the- -mai-ried filing jointly or head of household status, thehighest imbedded marginal tax rate was 28 percent. Fortaxpayers (single or married filing separately) using thetax tables with taxable income that was subject to the 33percent marginal rate, the maximum difference in taxbetween the tax rate schedules and the tax tables was$8.75 [5]. However, the actual difference in tax wasgenerally smaller for most taxpayers. Use of the tax tablescould have produced either a higher or a lower amount oftax than that produced by the tax rate schedules.
Major Tax Law Changes for 1990The legislation enacted under TRA86 continued to alterthe tax treatment of certain income and deductions for1990. The phase-in of limitations on "passive activitylosses" (i.e., generally those generated by any trade,business, or rental activity in which the taxpayer did notmaterially participate) continued, along with the phase-outof the itemized deduction for personal interest (i.e.,interest on credit cards, car loans, or personal loans).
The passive loss rules were generally effective for taxyears beginning after December 31, 1986. In general,these rules required that the losses from passive activitiescould not be deducted frompther types of income, andthat tax credits from passive. activities could generallyoffset only the tax allocable to such activities [6]. How-ever, the restrictions on deducting passive losses were48
phased-in for taxpayers who had acquired an interest in apassive activity prior to October 23, 1986. For 1990,these taxpayers could use only 10 percent of such lossesto offset "active" (or "non-passive") income, but anydisallowed passive losses for 1990 could generally becarriedforward to offset future passive income. With thecontinued phase-out of the personal interest deduction,only 10 percent of personal interest expenses was deduct-ible for 1990.
. Other major changes in the tax law for 1990 includeda new deduction for self-employed health insurance; anexclusion of interest income from Series EE U.S. savingsbonds under certain conditions; and a deduction of one-half of the amount of an individual's self-employment taxliability. Taxpayers cashing series EE U.S. savings bondsin 1990 that were issued after 1989 could exclude part orall of the interest from income if the taxpayer paid for"qualified" higher education expenses [7]. In addition,the earned income credit, personal exemption Amounts,
-standard-deductions-and the tax bracket boundariescontinued to be adjusted for inflation for 1990 [8].
Another change legislated by TRA86, which contin-ued to have an impact for 1990, related to the treatmentof investment income of minor children under 14 years of
_age.- Tomoderate the use of "family inconleb splJLtting," amechanism used by higher-income tax bracket parents toreduce overall family taxes by shifting income-producingassets to dependent children in lower-income tax brack-ets, TRA86 included provisions that effectively taxed theunearned (investment-type) income over $1,000 ofchildren under age 14 at the parent's highest marginal taxrate if the parent's rate was higher than the child's rate[9]. The two methods of reporting and paying tax on thisincome were: ( 1) filing Form 8814, Parent's Election toReport Child's Interest and Dividends, as part of theparent's individual income tax retum, or (2) filing Form8615, Taxfor Children Under Age 14 Who Have Invest--ment Income ofMore than $1,000, as part of the child'sown individual income tax return [101. Generally, thesetwo methods of reporting the child's investment incomewould have resulted in the same amount of tax since, ineither case, the income was subject to tax at the parent'shighest marginal tax rate. However, because the child's.deductions could not be reported on the parent's returnwhen the child's income was included in the parent'sAGI, using Form 8814 could have resulted in a higheroverall family tax [I I].
A parent could elect to file Form 8814 under thefollowing conditions: (1) the child was under age 14 onJanuary 1, 1991, (2) the child had income only frominterest and dividends (including Alaska Permanent Funddividends), (3) the dividend and interest income was
Individual Income Tax Rates and Tax Shares, 1990
more than $500 and less than $5,000, (4) no estimated taxpayments had been made for 1990 under the child's nameand social security number, and (5) no Federal incometax had been withheld from the child's income under the"backup withholding" rules [121.
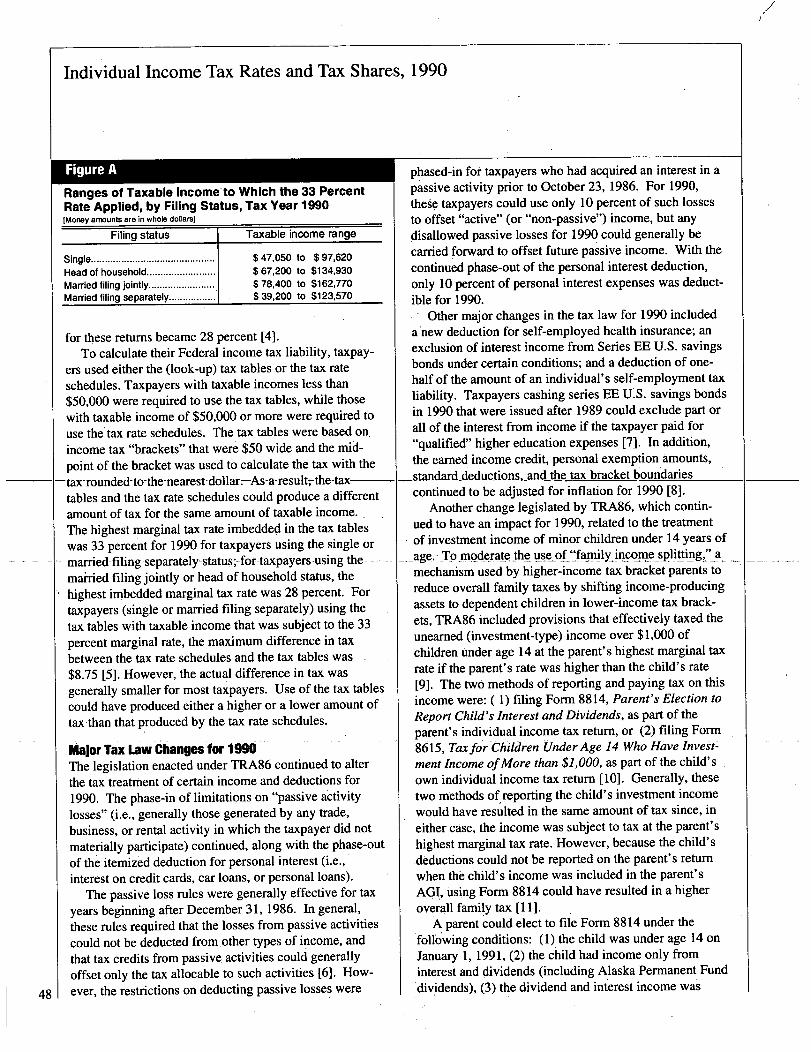
SOI Income ConceptsTo analyze changes in income and taxes over a period ofyears, a consistent definition of income should be used.Because the components of AGI vary from year to year,the "1979 Income Concept" was developed to provide amore uniform measure of income across tax years. TaxYears 1979 through 1986 were used as base years inidentifying the income and deduction items included inthe 1979 Income Concept. The 1979 Income Conceptincludes the same income and deduction items in eachyear's income calculation and uses only items availableon Federal individual income tax returns. As noted inFigure B, the 1979 Income Concept for 1990 includesmany income and deductions that are also components ofAGI. However, unlike AGI, the 1979 Income Conceptalso includes nontaxable (i.e., tax-exempt) amounts ofincome reported on individual income tax returns, as wellas disallowed passive loss deductions. In addition, onlystraight-line deductions for depreciation are included inthe 1979 Income Concept [ 13].
Each year, a relatively small number of returns forprior years are filed during the same period in whichreturns for the current year are being selected for Statis-tics ofIncome-Individual Income Tax Return statistics.These returns are included in the statistics as proxies forcurrent tax year returns that will be filed during a lateryear. Because the tax on these returns is based on aprevious year's tax law, which reflects different tax ratesand income concepts, the taxable income reported onthese prior-year returns was "modified" for the statisticsin this article by substituting the taxable income neces-sary to generate the amount of tax reported on the return,using the current year's tax law. For returns other thanprior-year returns, "modified taxable income" is generallythe same as taxable income [14].
Income Tax RatesDiscussions of income tax rates generally, either explic-itly or implicitly, center on measuring two distinct taxrates: average tax rates and marginal tax rates. Averagetax rates are calculated by dividing some measure of taxby some measure of income. For purposes of thestatistics, the average tax rate is defined as "total incometax" divided by "adjusted gross income" reported onreturns showing an income tax liability. Measures ofmarginal tax rates, on the other hand, focus on determin-
Figure B
Components of the 1979 Income Concept for 1990Income or Loss:
Salaries and wages'Interest'Dividends'Alimony received'Capital gains (before exclusion) reported on Schedule D minus
allowable capital losses'Capital gains and losses not reported on Schedule D
(before exclusion)'Other gains and losses (Form 4797)1Business net income or loss'Farm net income or loss'Rent net income or loss'Royalty net income or loss'Partnership net income or loss'Subchapter S Corporation net income or loss'Farm rental net income or loss'Estate or trust net income or loss'Unemployment compensation'Depreciation in excess of straight-line depreciation2Total pension income3Other net income or JOSS4
Deductions:Disallowed passive losses (Form 6251)Moving expenses5Alimony paid'Unreimbursed business expenses5
I Included in Adjusted Gross Income for Tax Year 1990.2Adjustment to add back excess depredation (accelerated over straight-line
depreciation) deducted in the course of a trade or business and included in netincome (loss) amounts shown above.
'includes; taxable and tax-exempt pension and retirement distributions.
%cludes an adjustment to add back amounts reported for the 'foreign earnedincome exclusion.'
sReported on Schedule A for those taxpayers who reported iternized deductions.
ing the tax rate imposed on the last (or next) dollar ofincome earned by a taxpayer. For purposes of the statisticsin this article, the marginal tax rate is defined as the rate atwhich the last dollar of taxable income is taxed [151. Thefollowing sections describe the measurement of theaverage and marginal tax rates in more detail and discussthe statistics based on these rates for 1990.
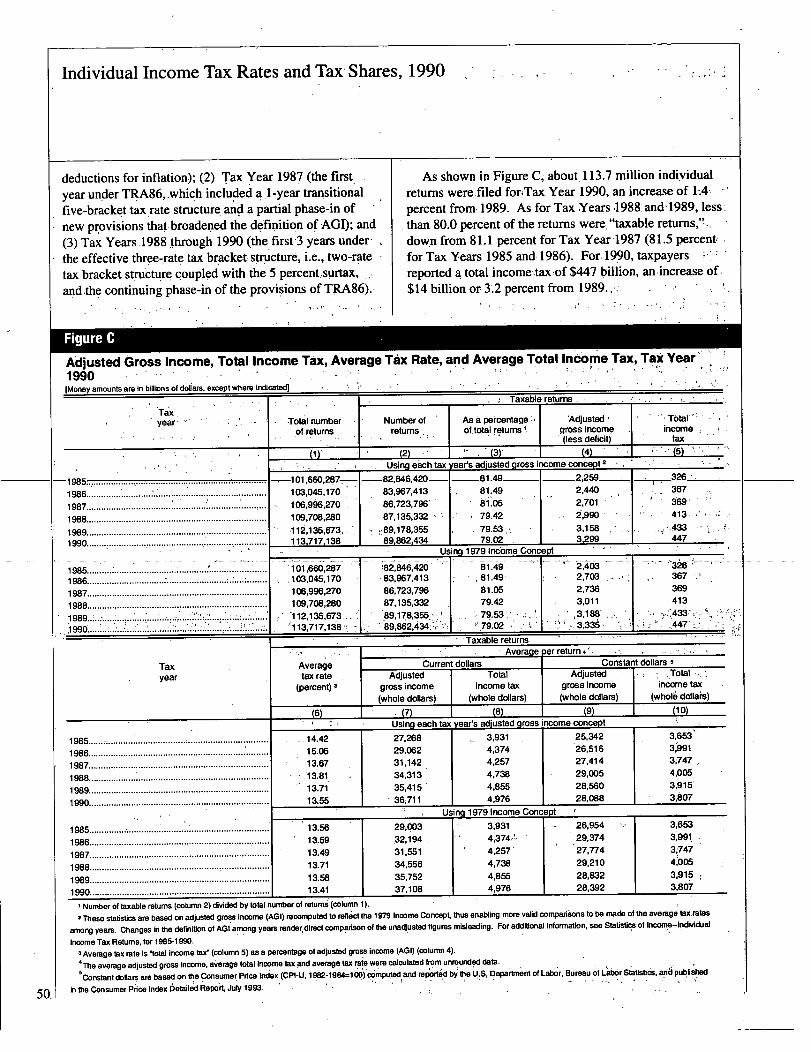
Average Tax RatesThe average tax rate, for this article, is defined as totalincome tax divided by the adjusted gross income reportedon returns showing an amount for total income tax (i.e.,"taxable returns"). Statistics on income (based on eachyear's definition of AGI, as well as on the common 1979Income Concept) and taxes reported for 1985 through1990 are presented in Figure C. These tax years can bepartitioned into three distinct sub-periods: (1) Tax Years1985 and 1986 (the last 2 years under the EconomicRecovery Tax Act of 1981 or ERTA81, which indexed thetax bracket boundaries, personal exemptions, and standard
49
Individual Income Tax Rates and Tax- Shares, 1990 1
deductions for inflation); (2) Tax Year 1987 (the first.year under TRA86, -which included al-year transitionalfive-bracket tax rate structure.and a partial phase-in ofnew provisions that broadened the definition of AGI); and(3) Tax Years.1988 through 1990 (the first 3 years under-the effective three-yate tax bracket- structure, -i.e., two-ratetax bracket structure coupled with the 5. percent,surtax,and the continuing phase-in of the provisions of TRA86).-
Figure C
As shown in Figure C, about, 113.7 inillion individualreturns werefiled foriTax. Year 1990, an increase of LA~ -percent from. 1989. As for Tax Years 4988 and- 1989, less.than 80.0 percent of the returns were. "taxable returns,'!..down from 8 1.1 percent for Tax Year -1987 (81.5 percent. -for Tax Years 1985 and..1986). For. 1990, taxpayersreported a total- income tax:of $447 billion, an increase of$14 billion or 12 percent from 1989.,
Adjusted Gross Income, Total Income Tax, Average Tax Rate, and Average Total Income Tax, Tax Year'1990[Money amounts are in billions of doliars, except whereindicated)
Taxyear,
-1985 ................................................................... ....
1986 .......................... ........... ..................................
1987 .........................................................................1988........................................................................
1989........................................................................1990........................................................................
..............................................................1985............I .
.1986................................ :.: ...................... ........
1987........................................................................1968 .... ...................................: ...................................
....................................................1989..~ ................................'1996 ............... ....... .
Taxyear
1985....... ................................................................
1986........................................................................1967........................................................................
1988........................................................................
1989 ........................................................................
1990 ...............................................
1985 ............... ..................... 1 ...............................
1986 ........................................................................
1987........................................................................
1988........................................................................
1969........................................................................
1990........................................................................
Total numberof returns
Oy
-101,660,287-103,045,170
96,270109,708,280112,1 35,673~~113,717,138
. ~611,660,287103,045,170106,996,270109,708,280
-112,135,673.113,717,138
Averagetax rate
(percent) 3
(6)
14.4215.0513.67'13.8113.7113.55
13.5613.59,13.4913.7113.58i 3.41
Number ofreturns
L2)
Taxable returns
As a percentageoftotal returns I
(3)Using each tax year's adjusted gross income concept 2
-82,846,420-83,967,41386,723,796'87,135,332
~~89.178,35589,862,434
;82,846,420.83,967,41386,723,79687,135,33289,178 355,89,862:434'~
_81.49-8174981.0579.4279.53.,79.02
Using 1979 Income Concept
81.49
81.0579.4279.5379.02
Taxable returns
'Adjustedgross income(less deficitj
U4
2,2592,4402,7012,9903,158
2,7032,7363,0113,1883;33~
Current dollarsAdjusted
gross income(whole dollars)
. _L7)
I Average per returnConsta
Total Adjustedincome tax gross income
(whole dollars) (whole dollars)
(8) (9)Using each tax year's adjusted gross income concept
27,26829,06231,14234,31335,4`1 536j711
29,00332,19431,55134,55635,75237,108
3,9314,3744,2574,7384,8554,976
25,34226,51627,41429,00528,56028,088
Using 1979 Income Concept
3,9314,374~tl4,257-4,7384,8554,976
26,95429,37427,77429,21028,83228,392
Total-':income
tax(5)
__326367~69 -413.
447
26367369
.413
dollars s~ Total
income tax(whole dollars)
(10)
3,6533,9913,7474,0053,9153,607
3,6533,9913,7474,0053,9153,8&
Number of taxable returns (column 2) divided by total number of returns (ODIumm 1).
2
These statistics are based on adjusted gross inoome (AGI) recomputed to reflect the 1979 income Concept thus enabling more valid comparisons to be made of the average tax rates
among years. Changes in the definifion of AGI among years renderdirect comparison of the unadjusted figures misleading. For additional information, see Statistics of Income-Individual
Income Tax Returns, for 1985-1990.
Average tax rate is 'total inoorne tax'(oolumn 5) as a percentage of adjusted gross income (AGI) (column 4).
4The average adjusted gross income, average total income tax
'
and average tax rate were calculated from unrounded data.
Constant dollars are based on the Consumer Price Index (CPI.IJ, 1 982-1984-0 66)'"puted and rep6rt~d by~ Ihe6:S, Depa
.riment of Labor, Bureau of Labor Statisticis, ap6 polished
in the Consumer Price Index betailed Report July 1993.5o.
Individual Income Tax Rates and Tax Shares, 1990
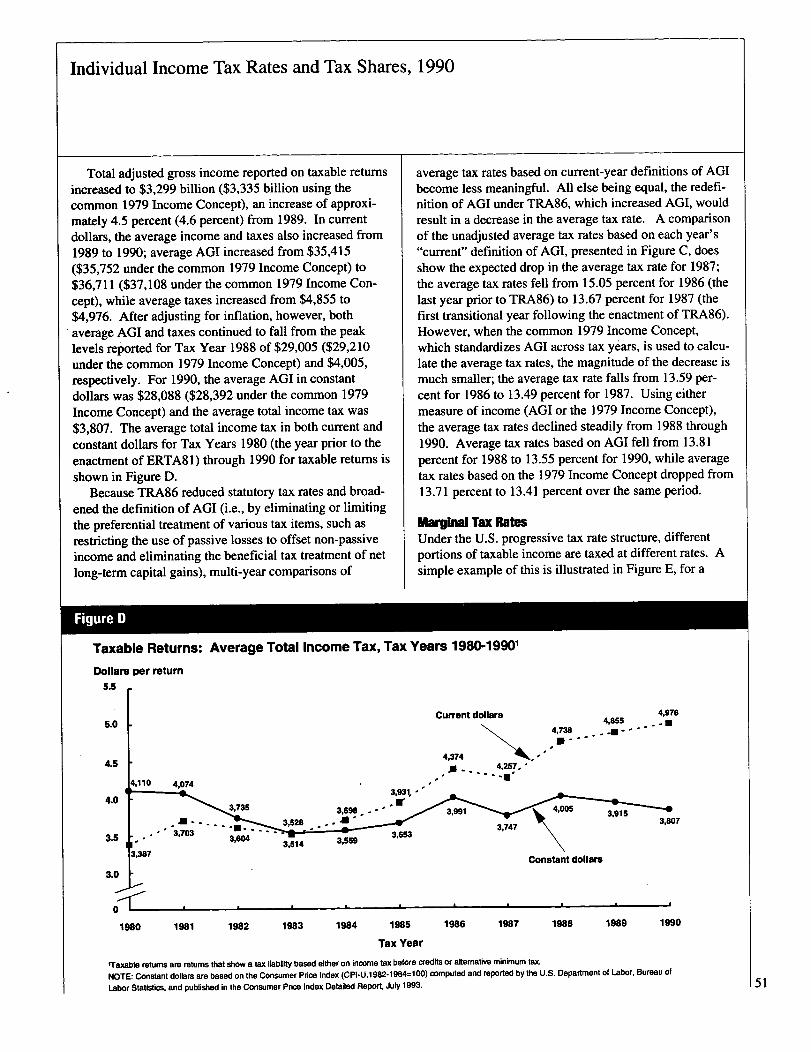
Total adjusted gross income reported on taxable returnsincreased to $3,299 billion ($3,335 billion using thecommon 1979 Income Concept), an increase of approxi-mately 4.5 percent (4.6 percent) from 1989. In currentdollars, the average income and taxes also increased from1989 to 1990; average AGI increased from $35,415($35,752 under the common 1979 Income Concept) to$36,711 ($37,108 under the common 1979 Income Con-cept), while average taxes increased from $4,855 to$4,976. After adjusting for inflation, however, bothaverage AGI and taxes continued to fall from the peaklevels reported for Tax Year 1988 of $29,005 ($29,210under the common 1979 Income Concept) and $4,005,respectively. For 1990, the average AGI in constantdollars was $28,088 ($28,392 under the common 1979Income Concept) and the average total income tax was$3,807. The average total income tax in both current andconstant dollars for Tax Years 1980 (the year prior to theenactment of ERTA81) through 1990 for taxable returns isshown in Figure D.
Because TRA86 reduced statutory tax rates and broad-ened the definition of AGI (i.e., by eliminating or limitingthe preferential treatment of various tax items, such asrestricting the use of passive losses to offset non-passiveincome and eliminating the beneficial tax treatment of netlong-term capital gains), multi-year comparisons of
Figure D
average tax rates based on current-year definitions of AGIbecome less meaningful. All else being equal, the redefi-nition of AGI under TRA86, which increased AGI, wouldresult in a decrease in the average tax rate. A comparisonof the unadjusted average tax rates based on each year's"current" definition of AGI, presented in Figure C, doesshow the expected drop in the average tax rate for 1987;the average tax rates fell from 15.05 percent for 1986 (thelast year prior to TRA86) to 13.67 percent for 1987 (thefirst transitional year following the enactment of TRA86).However, when the common 1979 Income Concept,which standardizes AGI across tax years, is used to calcu-late the average tax rates, the magnitude of the decrease ismuch smaller; the average tax rate falls from 13.59 per-cent for 1986 to 13.49 percent for 1987. Using eithermeasure of income (AGI or the 1979 Income Concept),the average tax rates declined steadily from 1988 through1990. Average tax rates based on AGI fell from 13.81percent for 1988 to 13.55 percent for 1990, while averagetax rates based on the 1979 Income Concept dropped from13.71 percent to 13.41 percent over the same period.
Marginal Tax RatesUnder the U.S. progressive tax rate structure, differentportions of taxable income are taxed at different rates. Asimple example of this is illustrated in Figure E, for a
Taxable Returns: Average Total Income Tax, Tax Years 1980-19901
-L0
1980 1981 1982 1983 1984 1985 1986 1987
Tax Year
1988 1989 1990
'Taxable returns are returns that show a tax liability based either on Income tax before credits or alternative minimum tax.
NOTE: Constant dollars are based on the Consumer Price Index (CPI-U,l 982-1984=1 00) computed and reported by the U.S. Department of Labor, Bureau of
Labor Statistics, and published in the Consumer Price Index Detailed Report, July 1993. 51
Individual Income Tax Rates and Tax Shares, 1990
52
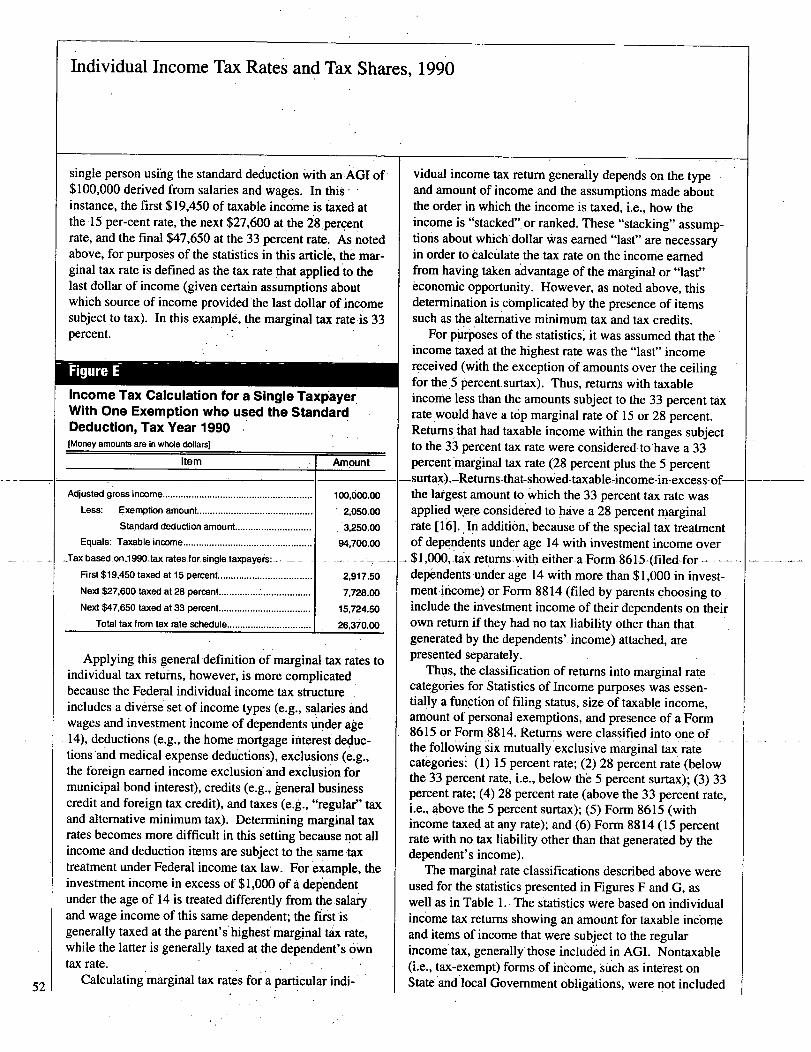
single person using the standard deduction with an AGI of$100,000 derived from salaries and wages. In thisinstance, the first $19,450 of taxable income is taxed atthe 15 per-cent rate, the next $27,600 at the H.percentrate, and the final $47,650 at the 33 percent rate. As
'noted
above, for purposes of the statistics in this article, the mar-ginal tax rate is defined as the tax rate
'that applied to the
last dollar of income (given certain assumptions aboutwhich source of income provided the last dollar of incomesubject to tax). In this example, the marginal tax rate,i s33percent.
f igure E
Income Tax Calculation for a Single TaxpayerWith One Exemption who used the StandardDeduction, Tax Year 1990[Money amounts are in whole dollars]
Item
Adjusted gross income...................................... I...................
Less: Exemption amount ............................................
Standard deduction amount .............................
Equals: Taxable income .................................................
- -Tax based -on -1 990.tax. rates for single taxpayers: - - -_ -
First $19,450 taxed at 15 percent....................................
Next.$27,600 taxed at 28 percent...................................
Next $47,650 taxed at 33 percent...................................
Total tax from tax rate schedule ................................
Amount
100,000.00
2,050.00
3,250.00
94,700.00
2,917.50
7,728.00
1V24.50
26,370.06
Applying this general definition of marginal tax rates toindividual tax returns, however, is more complicatedbecause the Federal individual income tax structureincludes a diverse set of income types (e.g., salaries andwages and investment income of dependents under agle14), deductions (e.g., the home mortgage interest deduc-tionsand medical expense deductions), exclusions (e.g.,the foreign earned income exclusion and exclusion formunicipal bond interest), credits (e.g., general businesscredit and foreign tax credit), and taxes (e.g., "regular" taxand alternative minimum tax). Determining marginal taxrates becomes more difficult in this setting because not allincome and deduction items are subject to the same taxtreatment under Federal income tax law. For example, theinvestment income in excess of $1,000 of a dependentunder the age of 14 is treated differently from the salaryand wage income of this same dependent; the first isgenerally taxed at the parent's* highest marginal tax rate,while the latter is generally taxed at the dependent's owntax rate.
Calculating marginal tax rates for a particular indi-
vidual income tax return generally depends on the typeand amount of income and the assumptions made aboutthe order in which the income is taxed, i.e., how theincome is "stacked". or ranked. These "stacking" assump-tions about which dollar Was earned "last" are necessaryin order to calculate the tax rate on the income earnedfrom having taken advantage of the marginal or "last"economic opportunity. However, as noted above, thisdetermination is complicated by the presence of itemssuch as the alternative minimum tax and tax credits.
For purposes of the statistics" it was assumed that theincome taxed at the highest rate was the "last7' incomereceived (with the exception of amounts over the ceilingfor the.5, percent, surtax). Thus, returns with taxable .income less than the amounts subject to the 33 percent taxrate would have a top marginal rate of 15 or 28 percent.Returns- that had taxable income within the ranges subjectto the 33 percent tax rate were considered to'have a 33percentmarginal tax rate (28 percent plus the 5 percent
-surtax)..-Retums-that-showed-taxable. income-in-excess-of-the largest amount to which the 33 percent tax rate wasapplied were considered to have a 28 percent marginalrate [161., In addition, because of the special tax treatmentof dependents under age 14 with investment income over
--$1,000,- tax-retums.with either-a Form 8615-(filed-for - - -dependents und
Ier age 14 with more than $1,000 in invest-
ment income) or Form 8814 (filed by parents choosing toinclude the investment income of their dependents on theirown return if they had no tax liability other than thatgenerated by the dependents'. income) attached, arepresented separately.
Thus, the classification of returns into marginal ratecategories for Statistics of Income purposes was essen-tially a.fun.ction of filing status, size of taxable income,amount of personal exemptions, and presence of a Form8615 or Form 8814. Returns were classified into one ofthe following six mutually exclusive marginal tax ratecategories: (1) 15 percent rate; (2) 28 percent rate (belowthe 33 percent rate, i.e., below th~ 5 percent surtax); (3) 33percent rate; (4) 28 percent rate (above the 33 percent rate,i.e., above the 5 percent surtax); (5) Form 8615 (withincome taxed at any rate); and (6) Form 8814 (15 percentrate with no tax liability other than that generated by thedependent's income).
The marginal rate classifications described above wereused for the statistics presented in Figures F and G, aswell as in Table 1. The statistics Were based on individualincome tax returns showing an amount for taxable incomeand items of income that were subject to the regularincome tax, generally those included in AGI. Nontaxable(i.e., tax-exempt) forms of incomej such as interest onStateand local Government obligations, were not included
Individual Income Tax Rates and Tax Shares, 1990
Figure F
Number of Taxable Returns, Modified Taxable Income, and Income Tax Generated at each Marginal Rateon Returns with the Indicated Marginal Tax Rate, Tax Year 1990[Money amounts are in thousands of dollars]
Marginal tax Taxable returns Modified taxable income Income tax gen rated at all ratesrate classes Number
-Percentage Amount
_Percentage Amount Percentage
(1) (2) (3) (4) (5) (6)
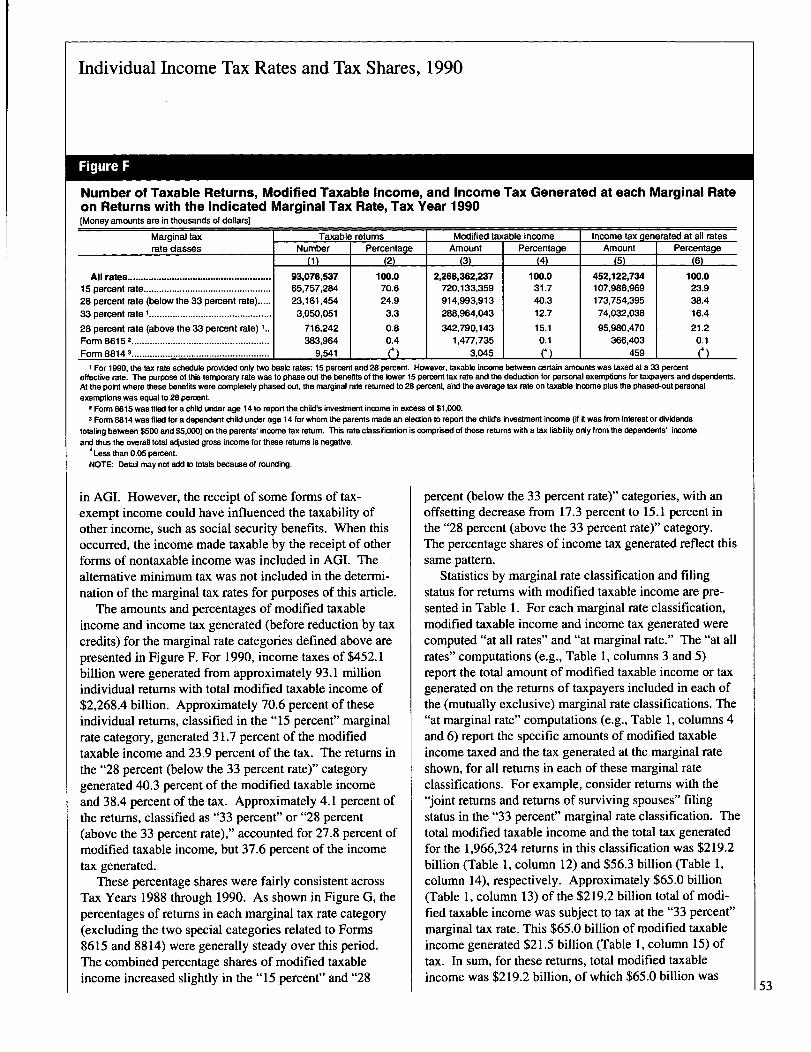
All rates ....................................................... 93,078,637 100.0 2,268,362,237 100.0 452,122,734 100.015 percent rate ................................................. 65,757,284 70.6 720,133,359 31.7 107,988,969 23.928 percent rate (below the 33 percent rate) ..... 23,161,454 24.9 914,993,913 40.3 173,754,395 38.433 percent rate I ............................................... 3,050,051 3.3 288,964,043 12.7 74,032,038 16.4
28 percent rate (above the 33 percent rate) 716,242 0.8 342,790,143 15.1 95,980,470 21.2Form 8615 2 ..................................................... 383,964 0.4 7351,4T7 0.1 366,403 0.1Form 8814 3 ..................................................... 9,541
(4):
3045 (4 ) 459 (4)
I For 1990, the tax rate schedule provided only two basic rates: 15 percent and 28 percent. However, taxable income between certain amounts was taxed at a 33 percent
0ffective rate. The purpose of this temporary rate was to phase out the benefits of the lower 15 percent tax rate and the deduction for personal exemptions for taxpayers and dependents.
At the point where these benefits were completely phased out, the marginal rate returned to 28 percent, and the average tax rate on taxable income plus the phased-out personal
exemptions was equal to 28 percent.2 Form 8615 was filed for a child under age 14 to report the child's investment income in excess of $1,000.3 Form 8814 was filed for a dependent child under age 14 for whom the parents made an election tc, report the child's investment income (if it was from interest or dividends
totaling between $500 and $5,000) an the parents' income tax return. This rate classification is comprised of those returns with a tax liability only from the dependents' income
and thus the overall total adjusted gross income for these returns is negative.4Less than 0.05 percent.
NOTE: Detail may not add to totals because of rounding.
in AGI. However, the receipt of some forms of tax-exempt income could have influenced the taxability ofother income, such as social security benefits. When thisoccurred, the income made taxable by the receipt of otherforms of nontaxable income was included in AGI. Thealternative minimum tax was not included in the determi-nation of the marginal tax rates for purposes of this article.
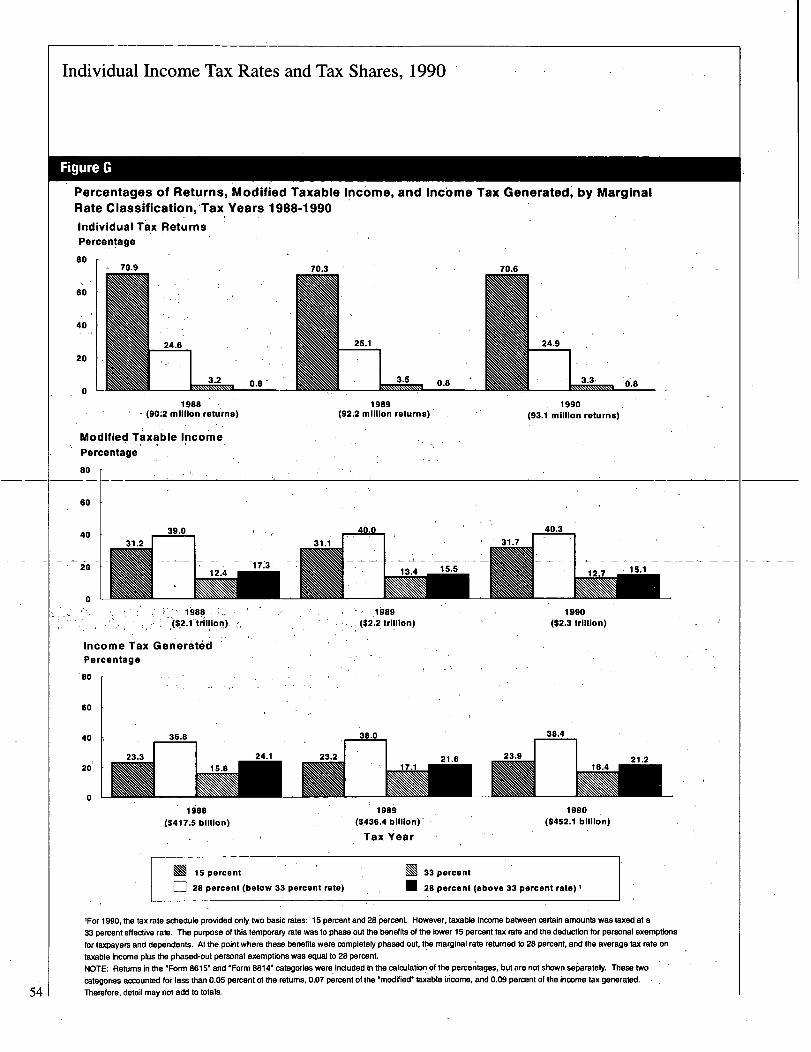
The amounts and percentages of modified taxableincome and income tax generated (before reduction by taxcredits) for the marginal rate categories defined above arepresented in Figure F. For 1990, income taxes of $452.1billion were generated from approximately 93.1 millionindividual returns with total modified taxable income of$2,268.4 billion. Approximately 70.6 percent of theseindividual returns, classified in the "15 percent" marginalrate category, generated 31.7 percent of the modifiedtaxable income and 23.9 percent of the tax. The returns inthe "28 percent (below the 33 percent rate)" categorygenerated 40.3 percent of the modified taxable incomeand 38.4 percent of the tax. Approximately 4.1 percent ofthe returns, classified as "33 percent" or "28 percent(above the 33 percent rate)," accounted for 27.8 percent ofmodified taxable income, but 37.6 percent of the incometax generated.
These percentage shares were fairly consistent acrossTax Years 1988 through 1990. As shown in Figure G, thepercentages of returns in each marginal tax rate category(excluding the two special categories related to Forms8615 and 8814) were generally steady over this period.The combined percentage shares of modified taxableincome increased slightly in the "15 percent" and "28
percent (below the 33 percent rate)" categories, with anoffsetting decrease from 17.3 percent to 15.1 percent inthe "28 percent (above the 33 percent rate)" category.The percentage shares of income tax generated reflect thissame pattern.
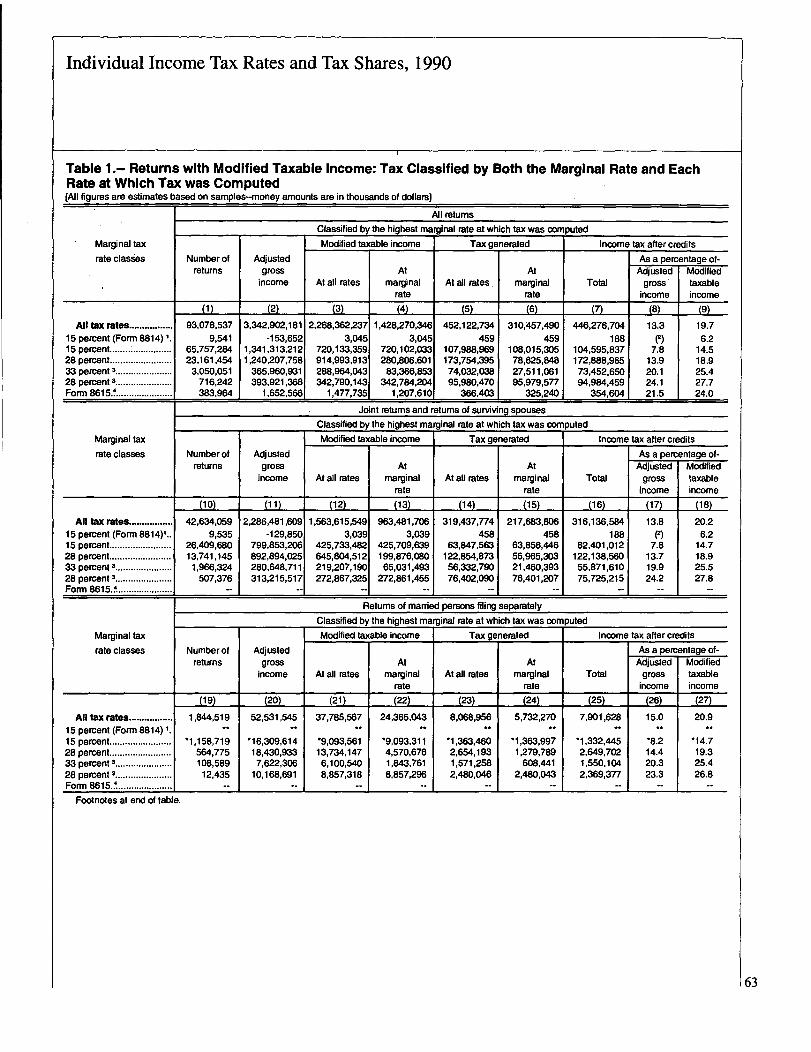
Statistics by marginal rate classification and filingstatus for returns with modified taxable income are pre-sented in Table 1. For each marginal rate classification,modified taxable income and income tax generated werecomputed "at all rates" and "at marginal rate." The "at allrates" computations (e.g., Table 1, columns 3 and 5)report the total amount of modified taxable income or taxgenerated on the returns of taxpayers included in each ofthe (mutually exclusive) marginal rate classifications. The"at marginal rate" computations (e.g., Table 1, columns 4and 6) report the specific amounts of modified taxableincome taxed and the tax generated at the marginal rateshown, for all returns in each of these marginal rateclassifications. For example, consider returns with the"joint returns and returns of surviving spouses" filingstatus in the "33 percent" marginal rate classification. Thetotal modified taxable income and the total tax generatedfor the 1,966,324 returns in this classification was $219.2billion (Table 1, column 12) and $56.3 billion (Table 1,column 14), respectively. Approximately $65.0 billion(Table 1, column 13) of the $219.2 billion total of modi-fied taxable income was subject to tax at the "33 percent"marginal tax rate. This $65.0 billion of modified taxableincome generated $21.5 billion (Table 1, column 15) oftax. In sum, for these returns, total modified taxableincome was $219.2 billion, of which $65.0 billion was
53
Individual Income Tax Rates and Tax Shares, 1990
Figure G
Percentages of Returns, Modified Taxable Income, and income Tax Generated, by MarginalRate Classification,
,*Tax Years 1988-1990
Individual Tax ReturnsPercentage80' r
M
EE
nil
24.6
3.2 0.8 -
1988(90!2 million retu rns)
Modified Taxable IncomePercentage
80 r
60
54
40
70.9
(~2.1 trillion.) ($2.2 trillion)
25.1
I.A.-5 0.8
1989(92.2 million returns)
1988 1989
Income Tax GeneratedPercentage
eO r
W
40
20
36.8
24.1
7nNOWNEEMEN,I .liBli
($417.5 billion)
XWX 15 percent
70.3
D 28 percent (below 33 percent'rete) 28 percent (above 33 percent rate)
40.3
_12J __ _15.1
1990($2.3 trillion)
38.4
21.2
Romommm'03"i'i - -1990
($452.1 billion)
33 percent
'For 1990, the tax rate schedule provided only two basic rates: 15 percent and 28 percent. However, taxable income between certain amounts was taxed at a
33 percent effective rate. The purpose of this temporary rate was to phase out the benefits of the lower 15 percent tax rate and the deduction for personal exemptions
for taxpayers and dependents. At the point where these benefits were completely phased out, the marginal rats returned to 28 percent, and the average tax rate on
taxable income plus the phased-out personal exemptions was equal to 28 percent.
NOTE: Returns in the "Form 8615" and 'Form 8814" categories were included in the calculation of the percentages, but are not shown separately. Thesetwo
categories accounted fo-r less than 0.05 percent of the returns, 0.07 percent of the "modified, taxable income, and 0.09 percent of the income tax generated.
Therefore, detail may not add to totals.
23.3
38.0
21.6
.mmommmamini"1989
($436.4 billion)'
Tax )~ear
,\00~
70.6
24.9
1990(93.1 million returns)
23.9
Individual Income Tax Rates and Tax Shares, 1990
subject to tax at the top marginal tax rate (for this classifi-cation) of 33 percent. About $21.5 billion of the total$56.3 billion in tax was generated by the 33 percent taxrate with the remainder generated by the lower (15 and 28percent) tax rates.
Statistics on the tax generated, in total and at eachmarginal rate, for returns with modified taxable incomeare provided in Table 2. Returns are classified in thistable by size of AGI rather than by the marginal rateclassifications used in Table 1. The tax generated at eachmarginal tax rate was computed based on the modifiedtaxable income for each individual return. For example,the 12.2 million returns included in the "$30,000 under$40,000" AGI-size classification showed total modifiedtaxable income of $280.6 billion and total tax generated of$45.8 billion. Of the $280.6 billion of modified taxableincome, nearly $252.4 billion was taxed at 15 percent,approximately $28.0 billion was taxed 28 percent, and theremainder was comprised of tax related to Form 8814 orForm 8615. Approximately $37.9 billion of the total taxgenerated of $45.8 billion was generated at the 15 percentrate, $7.9 billion was generated at the 28 percent rate, andthe remainder was generated from income reported onForm 8814 or Form 8615. It should be noted that due torounding differences, the sum of the tax generated at eachrate (the sum of columns 7, 10, 13, 16, 19, and 22) maynot equal the tax generated at all rates (column 4).
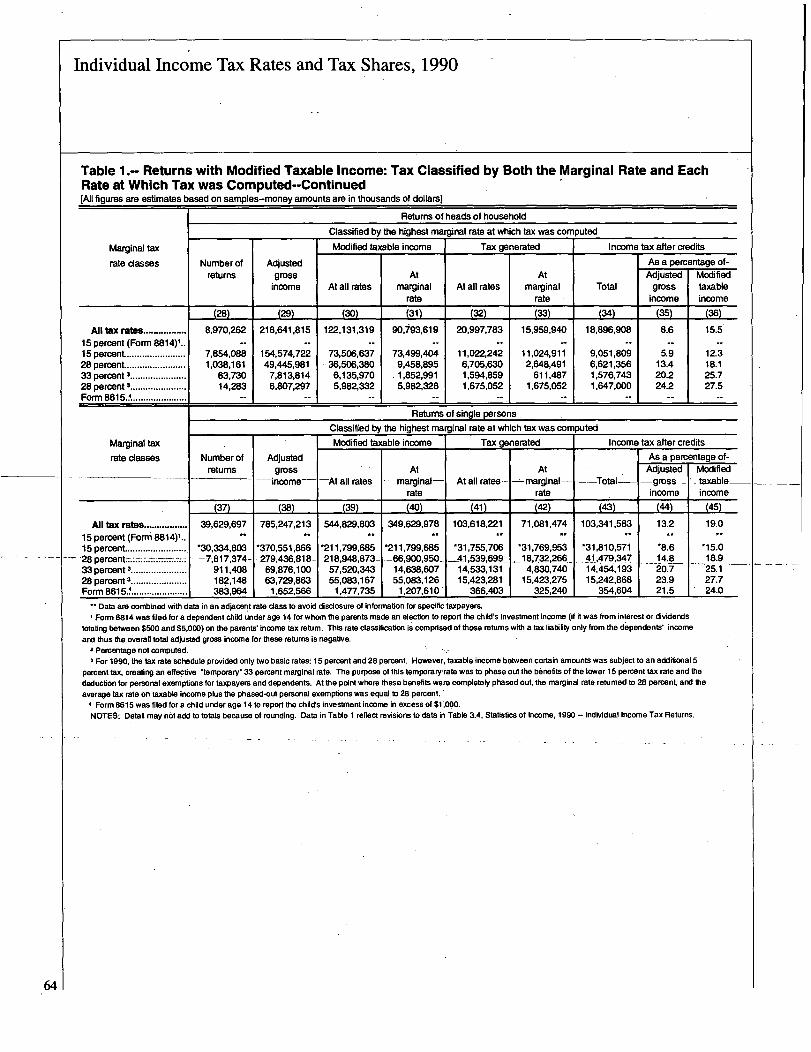
Statistics on the income and tax generated at eachmarginal rate (as in Table 2, columns 5 through 22) byfiling status, instead of AGI-size, for returns with modi-fied taxable income are presented in Table 3. In this tablefor example, approximately 8.7 million returns of the 39.6million returns filed by single persons had some incometaxed at the 28 percent tax rate. For these returns, the totalmodified taxable income subject to this rate was $92.1billion and the tax generated at the 28 percent rate was$25.8 billion.
Componerft of Total Income Tax
Regular TaxThe marginal tax rate statistics presented in Table I includetax amounts for "tax generated" and "income tax aftercredits." The average tax rate statistics presented inFigures C and D (and in Tables 4 through 7) include anadditional measure of tax, "total income tax." Totalincome tax is simply "income tax after credits" plus the"alternative minimum tax."
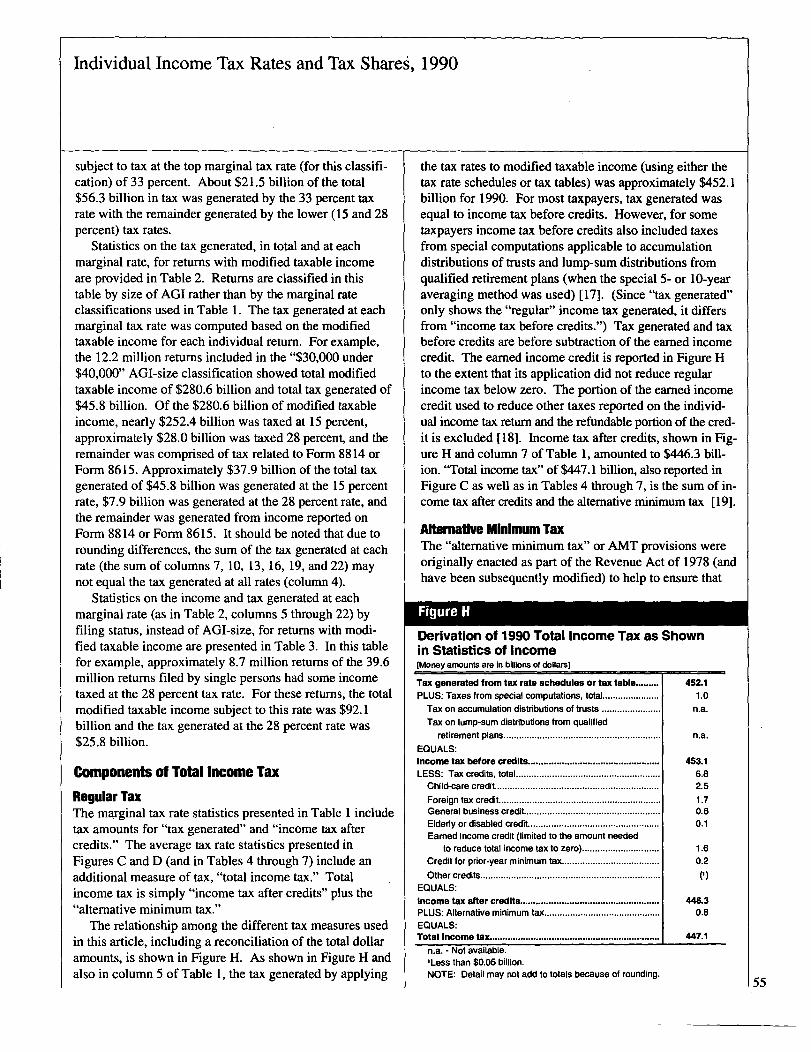
The relationship among the different tax measures usedin this article, including a reconciliation of the total dollaramounts, is shown in Figure H. As shown in Figure H andalso in column 5 of Table 1, the tax generated by applying
the tax rates to modified taxable income (using either the.tax rate schedules or tax tables) was approximately $452.1billion for 1990. For most taxpayers, tax generated wasequal to income tax before credits. However, for sometaxpayers income tax before credits also included taxesfrom special computations applicable to accumulationdistributions of trusts and lump-sum distributions fromqualified retirement plans (when the special 5- or 10-yearaveraging method was used) [171. (Since "tax generated"only shows the "regular" income tax generated, it differsfrom "income tax before credits.") Tax generated and taxbefore credits are before subtraction of the earned incomecredit. The earned income credit is reported in Figure Hto the extent that its application did not reduce regularincome tax below zero. The portion of the earned incomecredit used to reduce other taxes reported on the individ-ual income tax return and the refundable portion of the cred-it is excluded [181. Income tax after credits, shown in Fig-ure H and column 7 of Table 1, amounted to $446.3 bill-ion. "Total income tax" of $447.1 billion, also reported inFigure C as well as in Tables 4 through 7, is the sum of in-come tax after credits and the alternative minimum tax [19].
Altemative Minimum TaxThe "alternative minimum tax" or AMT provisions wereoriginally enacted as part of the Revenue Act of 1978 (andhave been subsequently modified) to help to ensure that
Figure H
Derivation of 1990 Total Income Tax as Shownin Statistics of Income[Money amounts are in billions of dollars]
Tax generated from tax rate schedules or tax table .........PLUS: Taxes from special computations, total......................
Tax on accumulation distributions of trusts .......................Tax on lump-sum distributions from qualified
retirement plans.............................................................
EQUALS:Income tax, before credits ...................................................
LESS:Tax
credits, total ........................................................Child-care credit................................................................
Foreign tax credit ...............................................................General business credit.....................................................Elderly or disabled credit ...................................................Earned income credit (limited to the amount needed
to reduce total income tax to zero) ..............................Credit for prior-year minimum tax......................................
Other credits ......................................................................
EQUALS:Income tax after credits......................................................PLUS: Alternative minimum tax .............................................
EQUALS:Total Income tax..................................................................
n.a' - Not available.'Less than $0.05 billion.NOTE: Detail may riot add to totals because of rounding.
452.11.0
n.a.
n.a.
453.16.82.51.70.60.1
1.60.2
(1)
446.30.8
"7.1
55
Individual Income Tax Rates and Tax Shares, 1990
56
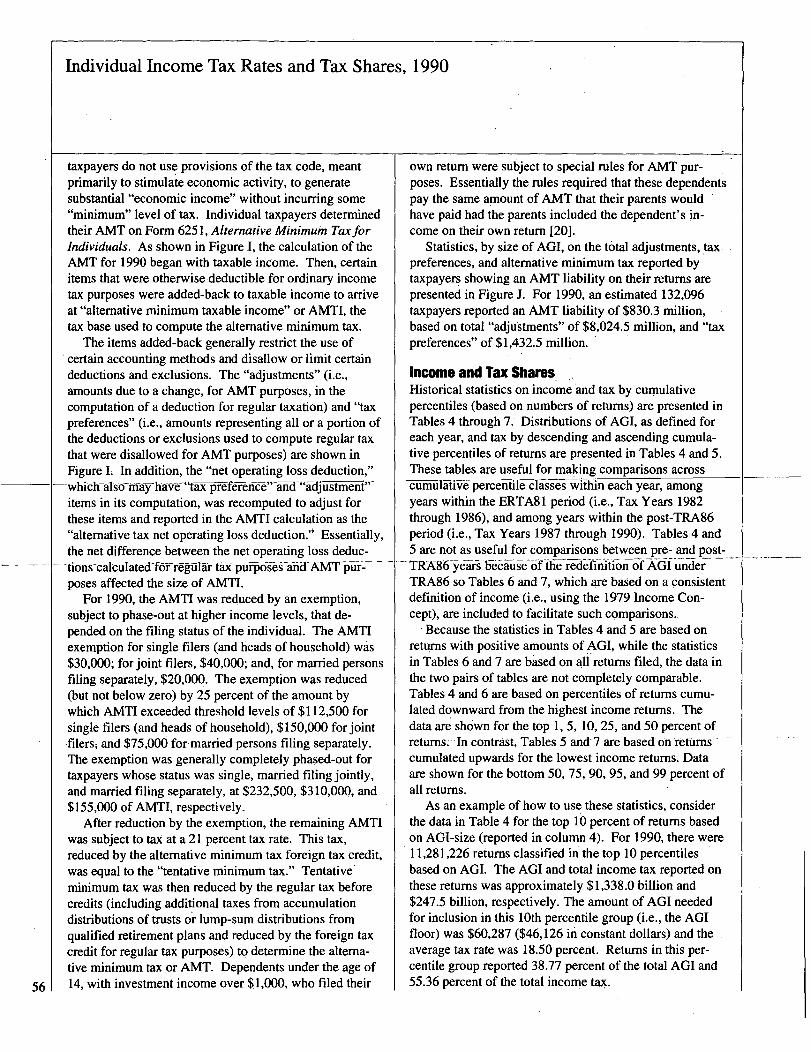
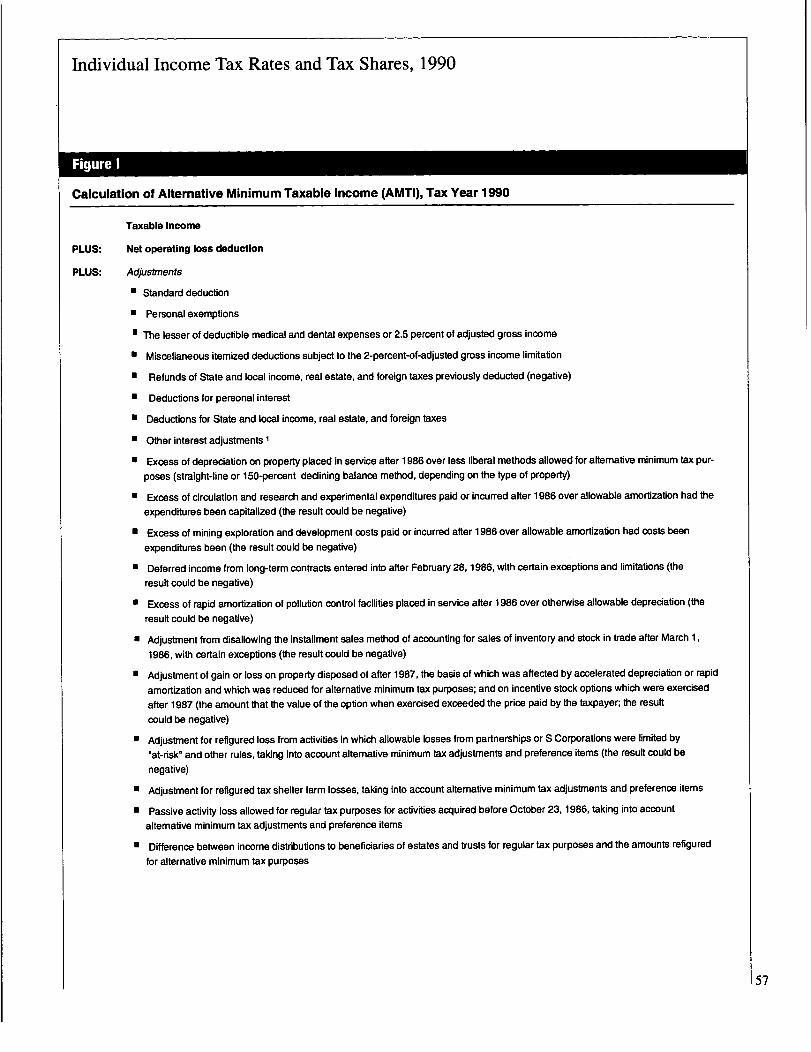
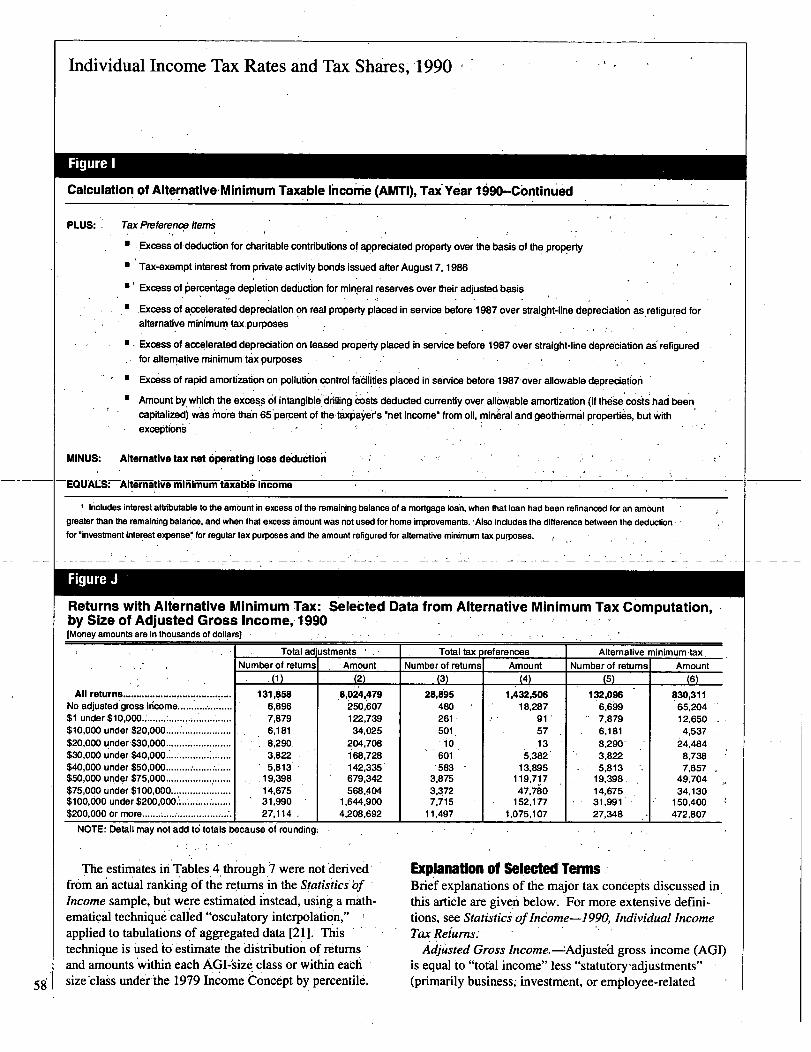
taxpayers do not use provisions of the tax code, meantprimarily to stimulate economic activity, to generatesubstantial "economic income" without incurring some"minimum" level of tax. Individual taxpayers determinedtheir AMT on Form 625 1, Alternative Minimum TaxforIndividuals. As shown in Figure 1, the calculation of theAMT for 1990 began with taxable income. Then, certainitems that were otherwise deductible for ordinary incometax purposes were added-back to taxable income to arriveat "alternative minimum taxable income" or AMTL thetax base used to compute the alternative minimum tax.
The items added-back generally restrict the use ofcertain accounting methods and disallow or limit certaindeductions and exclusions. The "adjustments" (i.e.,amounts due to a change, for AMT purposes, in thecomputation of a deduction for regular taxation) and "taxpreferences" (i.e., amounts representing all or a portion ofthe deductions or exclusions used to compute regular taxthat were disallowed for AMT purposes) are shown inFigure 1. In addition, the "net operating loss deduction,"
-whictf-alsormay-1fa-ve "tax-prefCren-ce"-a:n-d-"d-djustmenitems in its computation, was recomputed to adjust forthese items and reported in the AMTI calculation as the"alternative tax net operating loss deduction." Essentially,the net difference between the net operating loss deduc--tions-calculate-d-f6-frdgiiliCtdk-pbf-p6§6~-dfi-d-AMT-~u-f--poses affected the size of AMTL
For 1990, the AMTI was reduced by an exemption,subject to phase-out at higher income levels, that de-pended on the filing status of the individual. The AMTIexemption for single filers (and heads of household) was$30,000; for joint filers, $40,000; and, for married personsfiling separately, $20,000. The exemption was reduced(but not below zero) by 25 percent of the amount bywhich AMTI exceeded threshold levels of $112,500 forsingle filers (and heads of household), $150,000 for joint-filersi and $75,000 for married persons filing separately.The exemption was generally completely phased-out fortaxpayers whose status was single, married filing jointly,and married filing separately, at $232,500, $3 10,000, and$155,000 of AMTL respectively.
After reduction by the exemption, the remaining AMTIwas subject to tax at a 21 percent tax rate. This tax,reduced by the alternative minimum tax foreign tax credit,was equal to the "tentative minimum tax." Tentative*minimum tax was then reduced by the regular tax beforecredits (including additional taxes from accumulationdistributions of trusts or lump-sum distributions fromqualified retirement plans and reduced by the foreign taxcredit for regular tax purposes) to determine the alterna-tive minimum tax or AMT. Dependents under the age of14, with investment income over $1,000, who filed their
own. return were subject to special rules for AMT pur-poses. Essentially the rules required that these dependentspay the same a
'mount of AMT that their parents would
have paid had the parents included the dependent's in-come on their own return [20).
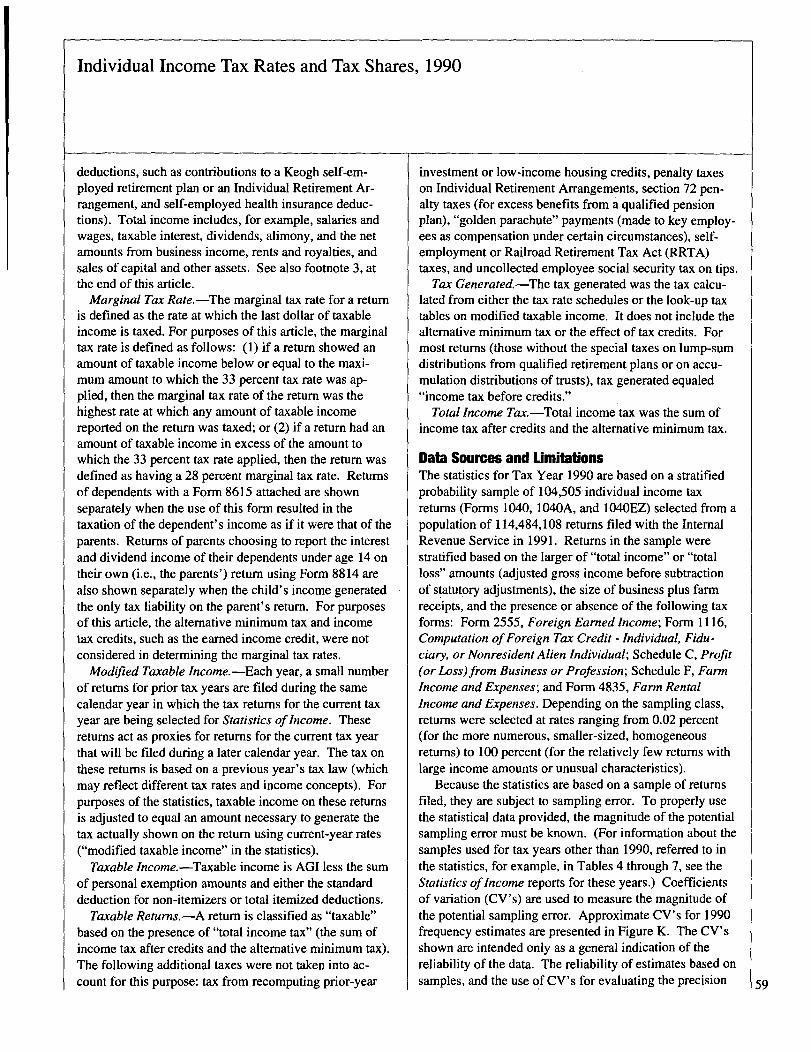
Statistics, by size of AGI, on the total adjustments,'tax
preferences, and alternative minimum tax reported bytaxpayers showing an AMT liability on their returns arepresented in Figure J. For 1990, an estimated 132,096taxpayers reported an AMT liability of $830.3 million,based on total "adjustments" of $8,024.5 million, and "taxpreferences" of $1,432.5 million.
Income and Tax ShamsHistorical statistics on incomeand tax by cumulativepercentiles (based on numbers of returns) are presented inTables 4 through 7.' Distributions of AGI, as defined foreach year, and tax by descending and ascending cumula-tive percentiles of returns are presented in Tables 4 and 5.These tables are useful for making comparisons across
-c-umuldtiVe-percentik-classes within each year, amongyears within the ERTA81 period (i.e., Tax Years 1982through 1986), and among years within the post-TRA86period (i.e., Tax Years 1987 through 1990). Tables 4 and5 are not as useful for comparisons between pre- and post-
--TWA86-y6ifsF6'ci-us-e--of-ili&-ie-&6-tiiifffo]i6fxdf~~~der- ___ __TRA86 so Tables 6 and 7, which are based on a consistentdefinition of income (i.e., using the 1979 Income Con-cept), are included to facilitate such comparisons.
. Because the statistics in Tables 4 and 5 are based onreturns with positive amounts of AGI, while the statisticsin Tables 6 and 7 are based on all returns filed, the data inthe two pairs of tables are not completely comparable.Tables 4 and 6 are based on percentiles of returns cumu-lated downward from the highest income returns. Thedata are shown for the top 1, 5, 10, 25, and 50 percent ofreturns. In contrast, Tables 5 and 7 are based on returnscumulated upwards for the lowest income returns. Dataare shown for the bottom 50, 75, 90, 95, and 99 percent ofall returns.
As an example of how to use these statistics, considerthe data in Table 4 for the top 1 0 percent of returns basedon AGI-size (reported in column 4). For 1990, there were11,281,226 returns classified in the top 10 percentilesbased on AGI. The AGI and total income tax reported onthese returns was approximately $1,338.0 billion and$247.5 billion, respectively. The amount of AGI neededfor inclusion in this 10th percentile group (i.e., the AGIfloor) was $60,287 ($46,126 in constant dollars) and theaverage tax rate was 18.50 percent. Returns in this per-centile group reported 38.77 percent of the total AGI and55.36 percent of the total income tax.
Individual Income Tax Rates and Tax Shares, 1990
Figure I
Calculation of Alternative Minimum Taxable Income (AMTQ, Tax Year 1990
Taxable Income
PLUS: Net operating loss deduction
PLUS: Adjustments
Standard deduction
Personal exemptions
The lesser of deductible medical and dental expenses or 2.5 percent of adjusted gross income
Miscellaneous itemized deductions subject to the 2-percent-of-adjusted gross income limitation
Refunds of State and local income, real estate, and foreign taxes previously deducted (negative)
Deductions for personal interest
Deductions for State and local income, real estate, and foreign taxes
Other interest adjustments I
Excess of depreciation on property placed in service after 1986 over less liberal methods allowed for aftemative minimum tax pur-
poses (straight-line or 150-percent declining balance method, depending on the type of property)
Excess of circulation and research and experimental expenditures paid or incurred after 1986 over allowable amortization had the
expenditures been capitalized (the result could be negative)
Excess of mining exploration and development costs paid or incurred after 1986 over allowable amortization had costs been
expenditures been (the result could be negative)
Deferred income from long-term contracts entered into after February 28,1986, with certain exceptions and limitations (the
result could be negative)
Excess of rapid amortization of pollution control facilities placed in service after 1986 over otherwise allowable depreciation (the
result could be negative)
Adjustment from disallowing the installment sales method of accounting for sales of inventory and stock in trade after March 1,
1986, with certain exceptions (the result could be negative)
Adjustment of gain or loss on property disposed of after 1987, the basis of which was affected by accelerated depreciation or rapid
amortization and which was reduced for alternative minimum tax purposes; and on incentive stock options which were exercised
after 1987 (the amount that the value of the option when exercised exceeded the price paid by the taxpayer; the result
could be negative)
• Adjustment for refigured loss from activities in which allowable losses from partnerships or S Corporations were limited by
"at-risk" and other rules, taking into account alternative minimum tax adjustments and preference items (the result could be
negative)
• Adjustment for refigured tax shelter farm losses, taking into account alternative minimum tax adjustments and preference items
• Passive activity loss allowed for regular tax purposes for activities acquired before October 23, 1986, taking into account
afternative minimum tax adjustments and preference items
• Difference between income distributions to beneficiaries of estates and trusts for regular tax purposes and the amounts refigured
for alternative minimum tax purposes
57
Individual Income Tax Rates and Tax Shares, 1990
Figure I
Calculation of Alternative. Minimum Taxable Income (AMTQ, Tax.Year 1090-Cbritinuied
PLUS: Tax Preference Items
0 Excess of deduction for charitable contributions of appreciated property over the basis of the property
0 Tax-exempt interest from private activity bonds issued afterAugust 7,1986
0 Excess of percentage depletion deduction for mineral reserves over their adjusted basis
lE1
Excess of accelerated depreciation.on real property placed in service before 1987 over straight-line depreciation as.refigured foralternative minimum tax.purposes
Excess ofaccelerated depreciation on leased property placed in service before 1987 over straight-line depreciation ai refiguredfor alternative minimum tax purposes
Excess of rapid amortization on pollution control facilities placed in service before 1987 over allowable depreciation
Amount by which the exce "drilling costs deducted currently over allowable arnortizatiss of intangible on (if these costs had beencapitalizedi was more than 6
15'percent of the,taxpayeir's "net income" from oil, mine'rail and geothbrmal properti e~s, but with
exceptions
MINUS: Alternative tax not dperatino loss deduction
_EQUALS.~Altem-atiV_e-mlnIMU_M tanable-ific-ome
includes interest attributable to the amount in excess of the remaining balance of a mortgage loan, when that loan had been refinanced for an amountgreater than the remaining balance, and when that excess amount was not used for home impro~emants. Also includes the difference between the deductionfor 'investment interest expense' for regular tax purposes and the amount refigured for alternative minimum tax purposes.
Figure J
Returns with Alternative Minimu'rh Tax: Selected Data from Alternative Minimum Tax Computation,by Size of Adjusted Gross Income, 1990[Money amounts are in thousands of dollars]
All returns........................................No adjusted gross income....................$1 under $10,000.: ................. v .........
I......
$10,000 under $20,000 ........................
$20,000 u*nder sn,000.7,....................
$30,000 under $40,000 ........................$40,000 under $50,000 .......... ................$50,000 under $75,000 ........................$75,000 under $100,000......................$100,000 under $200,000.~...~................$200,000 or more ....... ...........................
Total adj ustmentsNumber of returns
AT-)131,858
6,6967,8796,181.8,290,3,8225,813
.19,39814,67531,99027,114
I Amountt2)
.8,024,479250,607122,73934,025
204,708168,728142,335679,342568,404
1,644,9DO4,208,692
NOTE: Detail may not add to totals because of roundingL
59
The estimates in Tables 4 through 7 were not derived,from an actual ranking of the returns in the Statistics ofIncome sample, but were estimated i
.nstead, using a niath-
ematical technique'called "osculat6ry interpolation,applied to tabulations of aggregated data [21]. Thistechnique is used to eistimatethe distribution of returnsand amounts within each AGI-:§ize' class or within eachsizeclass unde'r*the 1979 Income Concept by percentile.
Total tax ereferences
Number of returns(3)
28,895480261501,- 10601583
3,8753,3727,715
11,497
Amountt4)
1,432,50618,287
9157
135,382
13,895119,71747,760
152,1771,075,107
Alternative
Number of returns,
LS)132,096
6,6997,8796,1818,290-3,8225,813
19,398.14,67531,99127,348
830,31165,20412,6504,537
~4,4848,7387,657
49,70434,130
150,400472,807
Explandion of Seleded' TermsBriefexplanations of the major tax concepts discussed inthis article are given below. For more extensive defini-tions, see Statistics of Income-1990, Individual IncomeTax Retums.-
Adjusted Gross Income.-Adjusted gross income (AGI)is equal to "total income" less "statutory -,adjustments"(primarily business; investment, or employee-related
minimum tax
Amount~~6)
Individual Income Tax Rates and Tax Shares, 1990
deductions, such as contributions to a Keogh self-em-ployed retirement plan or an Individual Retirement Ar-rangement, and self-employed health insurance deduc-tions). Total income includes, for example, salaries andwages, taxable interest, dividends, alimony, and the netamounts from business income, rents and royalties, andsales of capital and other assets. See also footnote 3, atthe end of this article.
Marginal Tax Rate.-The marginal tax rate for a returnis defined as the rate at which the last dollar of taxableincome is taxed. For purposes of this article, the marginaltax rate is defined as follows: (1) if a return showed anamount of taxable income below or equal to the maxi-mum amount to which the 33 percent tax rate was ap-plied, then the marginal tax rate of the return was thehighest rate at which any amount of taxable incomereported on the return was taxed; or (2) if a return had anamount of taxable income in excess of the amount towhich the 33 percent tax rate applied, then the return wasdefined as having a 28 percent marginal tax rate. Returnsof dependents with a Form 8615 attached are shownseparately when the use of this form resulted in thetaxation of the dependent's income as if it were that of theparents. Returns ofparents choosing to report the interestand dividend income of their dependents under age 14 ontheir own (i.e., the parents') return using Form 8814 arealso shown separately when the child's income generatedthe only tax liability on the parent's return. For purposesof this article, the alternative minimum tax and incometax credits, such as the earned income credit, were notconsidered in determining the marginal tax rates.
Modified Taxable Income.-Each year, a small numberof returns for prior tax years are filed during the samecalendar year in which the tax returns for the current taxyear are being selected for Statistics of Income. Thesereturns act as proxies for returns for the current tax yearthat will be filed during a later calendar year. The tax onthese returns is based on a previous year's tax law (whichmay reflect different tax rates and income concepts). Forpurposes of the statistics, taxable income on these returnsis adjusted to equal an amount necessary to generate thetax actually shown on the return using current-year rates("modified taxable income" in the statistics).
Taxable Income.-Taxable income is AGI less the sumof personal exemption amounts and either the standarddeduction for non-itemizers or total itemized deductions.
Taxable Returns.-A return is classified as "taxable"based on the presence of "total income tax" (the sum ofincome tax after credits and the alternative minimum tax).The following additional taxes were not taken into ac-count for this purpose: tax from recomputing prior-year
investment or low-income housing credits, penalty taxeson Individual Retirement Arrangements, section 72 pen-alty taxes (for excess benefits from a qualified pensionplan), "golden parachute" payments (made to key employ-ees as compensation under certain circumstances), self-employment or Railroad Retirement Tax Act (RRTA)taxes, and uncollected employee social security tax on tips.
Tax Generated.-The tax generated was the tax calcu-lated from either the tax rate schedules or the look-up taxtables on modified taxable income. It does not include thealternative minimum tax or the effect of tax credits. Formost returns (those without the special taxes on lump-sumdistributions from qualified retirement plans or on accu-mulation distributions of trusts), tax generated equaled"income tax before credits."
Total Income Tax.-Total income tax was the sum ofincome tax after credits and the alternative minimum tax.
Data Soumes and LimitationsThe statistics for Tax Year 1990 are based on a stratifiedprobability sample of 104,505 individual income taxreturns (Forms 1040, 1040A, and 1040EZ) selected from apopulation of 114,484,108 returns filed with the InternalRevenue Service in 1991. Returns in the sample werestratified based on the larger of "total income" or "totalloss" amounts (adjusted gross income before subtractionof statutory adjustments), the size of business plus farmreceipts, and the presence or absence of the following taxforms: Form 2555, Foreign Earned Income; Form 1116,Computation ofForeign Tax Credit - Individual, Fidu-ciary, or NonresidentAlien Individual; Schedule C, Profit(or Loss) from Business or Profession; Schedule F, FarmIncome and Expenses; and Form 4835, Farm RentalIncome and Expenses. Depending on the sampling class,returns were selected at rates ranging from 0.02 percent(for the more numerous, smaller-sized, homogeneousreturns) to 100 percent (for the relatively few returns withlarge income amounts or unusual characteristics).
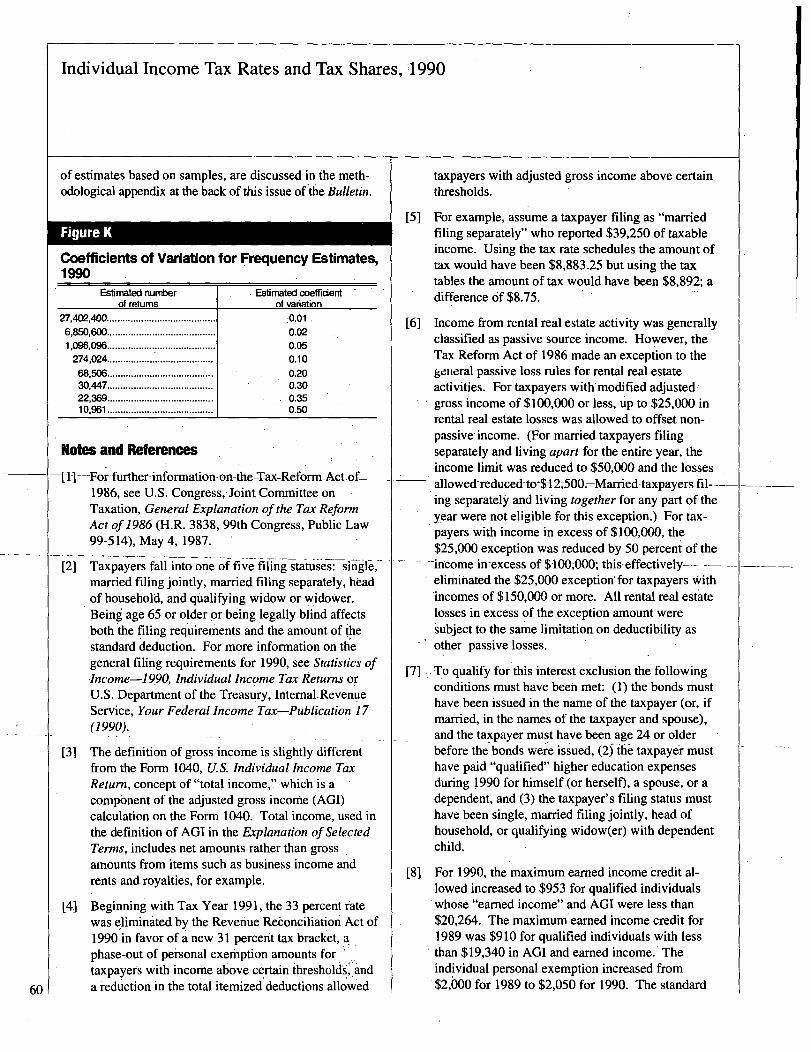
Because the statistics are based on a sample of returnsfiled, they are subject to sampling error. To properly usethe statistical data provided, the magnitude of the potentialsampling error must be known. (For information about thesamples used for tax years other than 1990, referred to inthe statistics, for example, in Tables 4 through 7, see theStatistics of Income reports for these years.) Coefficientsof variation (CV's) are used to measure the magnitude ofthe potential sampling error. Approximate CV's for 1990frequency estimates are presented in Figure K. The CV'sshown are intended only as a general indication of thereliability of the data. The reliability of estimates based onsamples, and the use of CV's for evaluating the precision 59
Individual Income Tax Rates and Tax Shares,'1990
60
of estimates based on samples, are discussed in the meth-odological appendix at the back of this issue of
,the Bulletin.
Figure K
Coefficients of Variation for Frequency Estimates,1990
Esfimated nuffftrof returns
27,402,400.........................................
6,850,600.........................................1,096,096.........................................274,024........................................
68,506 ........................................30,447 ........................................22,369 ........................................10,961 ........................................
Estiniated coeffidentof vafiabon
.0.010.020.050.100.200.300.350.50
Notes and References
-[I-]-For-further-information-on-the-T-ax-Reform-Act-of-1986, see U.S. Congress, Joint Committee on ,Taxation, General Explanation of the Tax ReformAct of1986 (H.R. 3838, 99th Congress, Public Law99-514), May 4,1987.
[2] Taxpayers fall into one of five filing statuses: single,married filing jointly, married filing separately, headof household, and qualifying widow or widower.Being age 65 or older or being legally blind affectsboth the filing requirements and the amount of thestandard deduction. For more information on thegeneral filing requirements for 1990, see Statistics ofIncome-] 990, Individual Income Tax Returns orU.S. Department of the Treasury, Internal.RevenueService, Your Federal Income Tax-Publication 17(1990).
[31 The definition of gross income is slightly differentfrom the Form 1040, U.S. Individual Income TaxReturn, concept of "total income,7 which is acomponent of the adjusted gross incorne (AGI)calculation on the Form 1040. Total income, used inthe definition of AGI in the Explanation ofSelectedTerms, includes net amounts rather than gross ,amounts from items such as business income andrents and royalties, for example.
[41 Beginning with Tax Year 1991, the 33 percent fatewas eliminated by the Revenue Reconciliation' Act of1990 in favor of a new 31 percent tax bracket, aphase-out of personal exemption amounts for 'taxpayers with income above certain ihresholds~,`~anda reduction in the total itemized deductions allowed
taxpayers with adjusted gross income above certainthresholds.
[5] For example, assume a taxpayer filing as "marriedfiling separately" who reported $39,250 of taxableincome. Using the tax rate schedules the amount oftax Would have been $8,883.25 but using the taxtables the amount of tax would have been $8,892; adifference of $8.75.
[6] Income from rental real estate activity was generallyclassified as passive source income. However, theTax Reform Act of 1986 made an exception to thegeiteral. passive loss rules for rental real estateactivities. For taxpayers with modified adjusted.-gross income of $100,000 or less, up to $25,000 inrental real estate losses was allowed to offset non-passive income. (For married taxpayers filingseparately and living apart for the entire year, theincome limit was reduced to $50,000 and the losses
-allowed-reduced-to-$-1-2-150O.-Married-taxpayers fil--ing separately and living together for any part of theyear were not eligible for this exception.) For tax-payers with income in excess of $100,000, the$25,000 exception was reduced by 50 percent of the
-iftcome-in-excess-of-$1001000;-this effectively— ---
[71
eliminated the $25,000 exception'for taxpayers Withincomes of $150,000 or more. All rental real estatelosses in excess of the exception amount wereIsubject to the same limitation on deductibility asother passive losses.
To qualify for this interest exclusion the followingconditions must have been met: (1) the bonds musthave been issued in the name of the taxpayer (or, ifmarried, in the names of the taxpayer and spouse),and the taxpayer must have been age 24 or olderbefore the bonds were issued, (2) the taxpayer musthave paid "qualified" higher education expensesduring 1990 for himself (or herself), a spouse, or adependent, and (3) the taxpayer's filing status musthave been single, married filing jointly, head ofhousehold, or qualifying widow(er) with dependentchild.
[8] For 1990, the maximum earned income'credit al-lowed increased to $953 for qualified individualswhose "earned income" and AGI were less thanW,264. The maximum earned income credit for1989 was $910 for qualified individuals with lessthan $19,340 in AGI and earned income. Theindividual personal exemption increased from$2,600 for 1989 to $2,050 for 1990. The standard
Individual Income Tax Rates and Tax Shares, 1990
deduction increased from $3,100 to $3,250 for singletaxpayers, from $5,200 to $5,450 for marriedpersons filing joint returns, from $2,600 to $2,725for married persons filing separately, and from$4,550 to $4,750 for heads of households.
[91 For 1990, dependent children under age 14 wererequired to file an income tax return if their "grossincome" included "unearned income" and exceeded$500. In contrast, dependent children with only"earned income" (e.g., from salaries and wages)were required to file only if their gross income wasmore than $3,250.
[10] Rules governing which parent could make theelection to include the child's income via Form 8814are illustrated in U.S. Department of the Treasury,Internal Revenue Service, Your Federal IncomeTax-Publication 17 (1990).
[111 For example, if the parent elected to use Form 8814to report the child's income, deductions which couldhave been taken on the child's return (if a return hadbeen filed for the child) that were not deductible onthe parent's return included: a) the additional $800standard deduction if the child were blind; b) thededuction for the penalty on early withdrawal of thechild's savings; and c) the child's itemized deduc-tions. In addition, because the parent's AGI in-creased by the amount of the child's income, certainitems on the parent's return that also could have beenaffected included: a) the deduction for contributionsto an Individual Retirement Arrangement (IRA); b)itemized deductions for medical expenses, casualtyand theft losses, and certain miscellaneous expenses;and c) the credit for child and dependent careexpenses. Conversely, the AGI-limits on thedeductions for charitable contributions could haveincreased resulting in a tax savings to the parent.
[12] The Alaska Permanent Fund was created to returnsome of the royalties generated by the Alaskapipeline to Alaskan residents. Alaska PermanentFund dividends are the distributions from this fundto these residents. "Backup withholding" is awithholding tax system in which the payer ofinterest, dividend or bond redemption income, or ofincome from the sale of securities, withholds tax at a20 percent rate if the payer has not been providedwith a correct taxpayer identification number or thepayee has not certified to the payer that the payee isnot subject to such withholding. Backup withhold
ing also may occur if the Internal Revenue Servicerequests that the payer begin such withholdingbecause the payee has persistently failed to properlyreport and pay taxes on interest or dividends.
[13] For more details on the income computation underthe 1979 Income Concept for 1990 and earlier years,see Statistics of lncome~-Individual Income TaxReturns, for the year concerned.
[141 Due to the phase-out of personal exemptions forthose high-income taxpayers with taxable incomes inexcess of the upper limits shown in Figure A,,'modified taxable income" for these taxpayersincluded taxable income plus some or all of theexemption amount.
[15] For additional discussion of the measurement ofaverage and marginal tax rates, see, for example,Bakija, Jon, and Steuerle, Eugene, "IndividualIncome Taxation Since 1948," National Tax Journal,Volume 44, Number 4, 199 1; Fullerton, Don, "TheUse of Effective Tax Rates in Tax Policy," NationalTax Journal, Volume 39, Number 3, 1986; Spooner,Gillian M., "Effective Tax Rates From FinancialStatements," National Tax Journal, Volume 39,Number 3, 1986; Bradford, David, and Stuart,Charles, "Issues in the Measurement and Interpreta-tion of Effective Tax Rates," National Tax Journal,Volume 39, Number 3, 1986; and, Fullerton, Don,"Which Effective Tax Rate?" National Tax Journal,Volume 37, Number 1, 1984.
[16] This treatment is consistent with the analytical usesof marginal rates in testing hypotheses about thebehavior of economic agents when faced withparticular marginal rates. To the extent that thetaxpayer can correctly predict that income will belarge enough to exceed the top 33 percent bracket,the decision to undertake an economic opportunity isaffected by the 28 percent rate rather than the 33percent rate.
[17] The income amounts on which these special compu-tations were based were not reflected in current-yeartaxable income.
[181 The total earned income credit for 1990 was $7.5billion. This included the amount used to reduce theregular income tax to zero ($1.6 billion), the amountused to reduce other taxes (including the alternativeminimum tax, self-employment social security tax,tax from recapture of certain prior-year tax credits, 61
Individual Income Tax Rates and Tax Shares, 1990
social security.tak.on certain tip. income, and tax -applicable to an Individual Retirement Arrangement)reported on individual income tax returns to zero($0.7 billion), and the excess which was refundable($5.3biliion).
[191 Total income tax: does'n'ot include certain other taxesreported on individual income tax returns, such asself-employment (social security) tax, social securitytax on certain tip income, tax f
*rom recapture of
prior-year investment or low-incorri6 housing credits,and tax applicable to early withdrawals from anIndividual Retirement Arrangement (IRA). Thesetaxes were included in the statistics for "total tax ,,liability." ForTax Year 1990, total tax liability wasequal to $468'.6 billion andWas reported on 9.2.1million returns., These taxes were reported in,
Statistics of Income-I990, Individual Income T&Returns.
[20] For 1990, dependents filing their own returns werelimited to an exemption of $1,000 plus their "earnedincome." The dependent's AMT could be, reduced ifthe parent had regular tax greater than the child'sown tentative minimum tax, or if any other depen-dent under age 14 of the same parents had regulartax greater than this dependent's own tentative'minimum tax.
[21] For an explanation of the osculatory interpolationtechnique, see Oh; H. Lock,,"Osculatory Interpola-tion with a Monotonicity Constraint,"'.1977 Proceed-ings of the American,Statistical Association, Sectionon Statistical Computing, 1978..
62
Individual Income Tax Rates and Tax Shares, 1990
Table 1.- Returns with Modified Taxable Income: Tax Classified by Both the Marginal Rate and EachRate at Which Tax was Computed[All figures are estimates based on samples--money amounts are in thousands of dollars)
All returns
Classified by the hiqhest marclinal rate at which taxwas oomDuted
Marginal tax Modified taxable income Tax generated Income tax after creditsrate classes Number of Adjusted As a percentage of-
returns gross At At Adjusted Modifiedincome At all rates marginal At ail rates marginal Total gross taxable
rate rate income income
(1) (2) (3) (4) (5) (6) (7) (8) (9)
All tax rates ................. 93,078.537 3,342,902,181 2,268,362,237 1,428,270,346 452,122,734 310,457,490 446,276,704 13.3 19.715 percent (Form 8814) 1. 9,541 -153,652 3,045 3,045 459 459 188 (2) 6.215 percent........ : ............... 65,757,284 1,341,313,212 720,133,359 720,102,033 107,988,969 108,015,305 104,595,837 7Z 14.528 percent........................ 23,161,454 1,240,207,758 914,993,913 280,806,601 173,754,395 78,625,80 172,888,965 13.9 18.933 percent 3 ...................... 3,050,051 365,960,931 288,964,043 83,366.853 74,032,038 27,511,061 73,452.650 20.1 25.428 percent3 ...................... 716,242 393921368 342,790,143 342,784 W4 95,980,470 95,979,577 94,984,459 24.1 27.7
4Form 8615
........................ 1 383,964 1 1:652:566 1 1,477,7351 1,207:610 1 366,4031 325,2401 354,604 1 21.5 1 24.0
Joint returns and returns of suntiving spouses
Classified by the highest m inal rate at which tax was computed
Marginal tax Modified taxable income Tax generated Income tax after credits
rate classes Number of Adj usted As a percentage of-returns gross At At Adjusted Modified
income At all rates marginal At all rates marginal Total gross taxablerate rate income income
(10) (11) (12) (13) (14) (15) (16) (17) (18)
All tax rates ................. 42,634,059 2,286,481,609 1,563,615,549 963,481,706 319,437,774 217,683,806 316,136,584 13.8 20.215 percent (Form 8814)'.. 9,535 -129,850 3,039 3,039 458 458 188 (2) 6.215 percent........................ 26,409,680 799,853,206 425,733,482 425,709,639 63,847,563 63,856,446 62,401,012 7.8 14.728 percent........................ 13,741,145 892,894,025 645,804,512 199,876,080 122,854,873 55,965,303 122,138,560 13.7 18.933 percent 3 ...................... 1,966,324 280,648,711 219,207,190 65,031,493 56,332,790 21,460,393 55,871,610 19.9 25.528 percent 3...................... 507,376 313,215,517 272,867,325 272,861,455 76,402,090 76,401,207 75,725,215 24.2 27.8Form 8615.! ............... * ..... I __ I
1--I - I __ I __ I __ I __ I
Returns of married persons filing separately
Classified by the highest marginal rate at which tax was computed
Marginal tax Modified taxable income Tax g erated income tax after credits
rate classes Numberof Adjusted As a percentage of-returns gross At At Adjusted Modified
income At all rates marginal At all rates marginal Total gross taxablerate rate income income
(19) (20) (21) (22) (23) (24) (25) (26) (27)
All taxrates ................. 1,8",519 52,531,545 37,785,567 24,365,043 8,068,956 5,732,270 7,901,628 15.0 20.915 percent (Form 8814) 1.15 percent........................ *11,1158,719 *16,309,614 *9,093,561 *9,093,311 *1,363,460 -1,363,997 *1,332,445 *8.2 *14.728 percent........................ 564,775 18,430,933 13,734,147 4,570,676 2,654,193 1,279,789 2,649,702 14.4 19.333 percent 3 ...................... 108,589 7,622,306 6,100,540 1,843,761 1,571,258 608,441 1,550,104 20.3 25.428 percent 3...................... 12,435 10,168,691 8,857,318 8,857,296 2,480,046 2,480,043 2,369,377 23.3 26.8Form 8615.~ ..................... I __ __ I
Footnotes at end of table.
63
Individual Income Tax Rates and Tax Shares, 1990
Table 1.- Returns with Modified Taxable Income: Tax Classified by Both the Marginal Rate and EachRate at Which Tax was Computed--Continued[All figures are estimates based on samples-money amounts are in thousands of dollars]
Marginal tax
rate classes
All tax rates .................15 percent (Form 8814)1..15 percent .......................28 percent........................33 percent 3 ......................28 percent 3 ......................Form 8615. ~ .....................
Marginal tax
rate classes
All tax rates.................
15 percent (Form 8814)1..
15 percent........................
28 . ......-...-. ";
33percent 3......................
28 percent 3......................
Form 861V......................
Number ofreturns
(28)
8,970,262
7,854,0881,038,161
63,73014,283
Number ofreturns
(37)
39,629,697
*30,334,803-7;817,374-
911,408182,148383.964
Adjustedgross
income
(29)
218,641,815
154,574,72249,445,981
7,813,8146,807,297
Adjustedgross
-income-
(38)
785,247,213
*370,551,866279,436,818-
69,876,10063,729,863
1,652,566
Returns of heads of household
Classified by the highest marginal rate at which tax was computed
Modified taxable income
At all ratesAt
marginalrate
122,131,319
73,506,63736,506,3806,135,9705,982,332
(31)
90J93,619
73,499,4049,458,895
.1,852,9915,982,328
Tax generated
At all rates
(32)
20,997,783
11,022,2426,705,6301,594,8591,675,052
Atmarginal
rate
(33)
15,959,940
11,024,9112,648,491
611,4871,675,052
Returns of single persons
Income tax after credits
Total
(34)
18,896,908
9,051,8096,621,3561,576,7431,647,000
Classified by the highest marginal rate at which tax was computed
As a percAdjusted
grossincome
J351
8.6
5.913.420.224.2
entage of-Modifiedtaxableincome
(36)
15.5
12.318.125.727.5
Modified taxable i,ncome Tax g erated income tax after credits
As a percentage of-At Adjusted Modified
At all rates- -marginal- -At all rates-1-marAgtinal -Total -gross- -taxable-rate - rate income I income
-
(39)
544,829,803
*211,799,685218,948,873-
57,520,34355,083,167
1,477,735
(40)
349,629,978
*211,799,685-66,900,950-
14,638,60755,083,126
1,207,610-
(41)
103,618,221
*31,755,706-41,539,699
14,533,13115,423,281
366,403
(42)
71,081,474
*31,769,95318,732,266._
4,&30,74015,423,275
325,240
103,341,583
~31,810,57141,479,347U,4MJ6S15,242,868
354,604
L,111
13.2
*8.614.8
__~OJ_23.921.5_A
19.0
*15.018.9
-725.1-27.724.0
** Data are combined with data in an adjacent rate class to avoid disclosure of information for specific taxpayers.Form 8814 was filed for a dependent child under age 14 for whom the parents made an election to repon the child's investment income (if it was from interest or dividends
totaling between $500 and $5,000) on the parents'InoDme tax return. This rate classification is comprised of those returns with a tax liability only from the dependents' incomeand thus the overall total adjusted gross income for these returns is negative.
2 Percentage not computed.3 For 1990, the tax rate schedule provided only two basic rates: 15 percent and 28 percent. However, taxable income between certain amounts was subject to an additional 5
percent tax, creating an effective 'temporary' 33 percent marginal rate. The purpose of this temporary rate was to phase out the benefits of the lower 15 percent tax rate and thededuction for personal exemptions for taxpayers and dependents. At the point where these benefits were completely phased out, the marginal rate returned to 28 percent, and theaverage tax rate on taxable income plus the phased-out personal exemptions was equal to 28 percent. '
4 Form 8615 was filed for a child under age 14 to report the child's investment income in excess of $1,000.NOTES: Detail may not add to totals because of rounding. Data in Table I reflect revisions to data in Table 3.4, Statistics of Income, 1990 -- Individual Income Tax Returns.
(45)
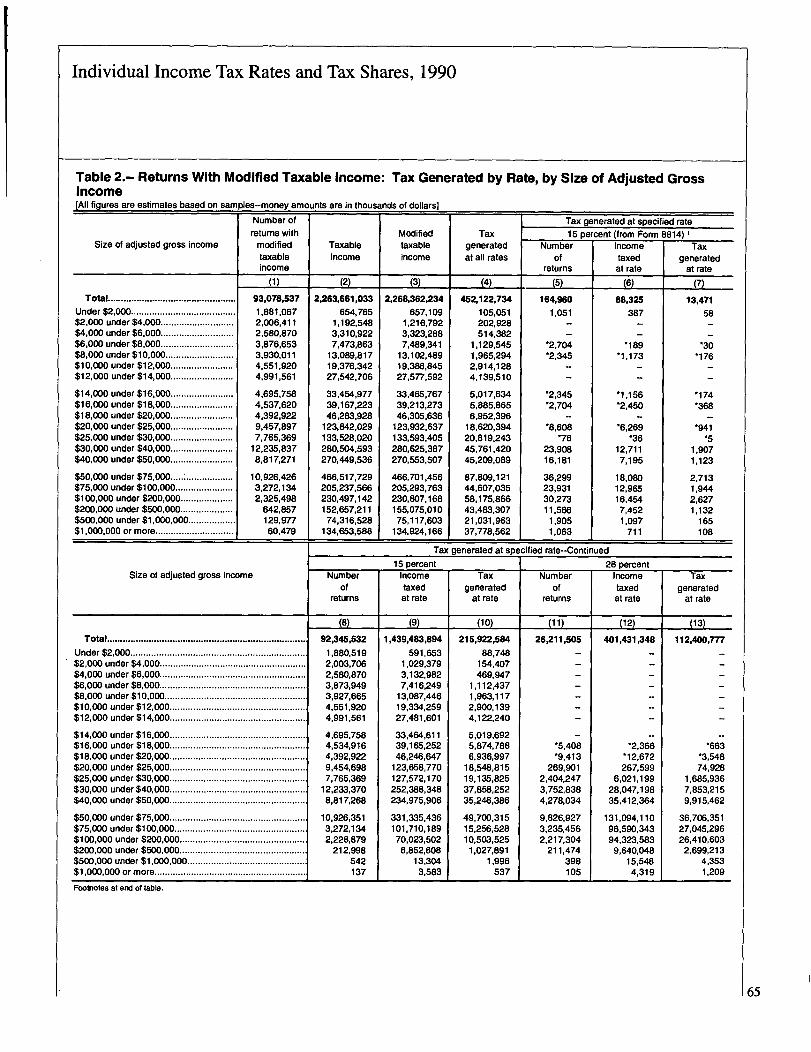
Individual Income Tax Rates and Tax Shares, 1990
Table 2.- Returns With Modified Taxable Income: Tax Generated by Rate, by Size of Adjusted GrossIncome[All figures are estimates based on samples--money am unts; are in thousands of dollars]
Size of adjusted gross income
Total .................................................
Under $2,000........................................$2,000 under $4,000 ............................$4,000 under $6,000............................$6,000 under $8,000 ............................$8,000 under $10,000..........................$10,000 under $12,000........................$12,000 under $14,000........................
$14,000 under $16,000........................$16,000 under $18,000........................$18,000 under $20,000 ........................$20,000 under $25,000........................$25,000 under $30,000 ........................$30,000 under $40,000........................$40,000 under $50,000 ........................
$50,000 under $75,000 ..... : ..................$75,000 under $100,000 ......................$100,000 under $200,000 ....................$200,000 under $500,000 ....................$500,000 under $1,000,000 ..................$1,000,000 or more ..............................
Number ofreturns with
modifiedtaxableincome
11)
93,078,5371,881,0672,006,4112,580,8703,876,6533,930,0114,551,9204,991,561
4,695,7584,537,6204,392,9229,457,8977,765,369
12,235,8378,817,271
10,926,4263,272,1342,325.498
642.857129,97760,479
Size of adjusted gross Income
Total............................................................................
Under $2,000 ...................................................................$2,000 under $4,000........................................................$4,000 under $6,000........................................................$6,000 under $8,000........................................................$8,000 under $10,000 ......................................................$10,000 under $12,000....................................................$12,000 under $14,000....................................................
$14,000 under $16,000....................................................$16,000 under $18,000....................................................$18,000 under $20,000....................................................$20,000 under $25,000....................................................$25,000 under $30,000....................................................$30,000 under $40,000....................................................$40,000 under $50,000....................................................
$50,000 under $75,000....................................................$75, 000 under $100,000..................................................$100,000 under $200,000 ................................................$200,000 under $500,000 ................................................$500,000 under $1,000,000 .............................................$1,000,000 or more ..........................................................
Footnotes at end of table.
Taxableincome
L2)
2,263,661,033654,765
1,192,5483,310,9227.473,863
13,089,81719,376,34227,542,706
33,454,97739,167,22346,283,928
123,842,029133,528,020280,504,593270,449,536
466,517,729205,237,566230,497,142152,657,21174,316,528
134,653,588
Numberof
returns
(8)
92,345,5321,880,5192,003,7062,580,8703,873,9493,927,6654,551,9204,991,561
4,695,7584,534,9164,392,9229,454,6987,765,369
12,233,3708,817,268
10.926,3513,272,1342,228,879
212,998542137
Modifiedtaxableincome
P)
2,268,362,234657,109
1,216,7923,323,2887,489,341
13,102,48919,386,84527,577,592
33,465,76739,213,27346,305,636
123,932,637133,593,405280,625,387270,553,507
466,701,456205,293,763230,807,168155,075,01075,117,603
134,924,166
15 percentIncometaxed
at rate
09)1,439,483,894
591,6531,029,3793,132,9827,416,249
13,087,44619,334,25927,481,601
33,464,61139,165,25246,246,647
123,658,770127,572,170252,388,348234,975,906
331,335,436101,710,18970,023,502
6,852,60813,3043,583
Taxgeneratedat all rates
L4)
45Z122,734105,051202,928514,382
1,129,5451,965,2942,914,1284,139,510
5,017,6345,885,8656,952,396
18,620,39420,819,24345,761,42045,209,089
87,809,12144,607,03558.175,86643,483,30721,031,96337,778,562
Tax generated at specifi15 percent (from Form
Numberof
returns
L5)
164,9601,051
-
Incometaxedat rate
(6)
88,325387
-
*2,704*2,345
-
-2,345-2,704
-8,608*76
23,90816,181
36,29923,93130,27311.566
1,9051,063
*189-1,173
-
-1,156-2,450
--6,269*36
12,7117,195
18,08012,96516,454
7,4521,097
711
Tax generated at specified rate--Continued
Taxgenerated
at rate
Numberof
returns
28 percent
(10)
215,922,58488,748
154,407469,947
1,112,4371,963,1172,900,1394,122,240
5,019,6925,874,7886,936,997
18,548,81519,135,82537,858,25235,246,386
49,700,31515,256,52810,503,5251,027,891
1,996537
0 1)
26,211,505
-*5,408*9,413
269,9012,404,2473,752,8384,278,034
9,826,9273,235,4562,217,304
211,474398105
Incometaxedat rate
(12)
401,431,348
--2,366-12,672267,599
6,021,19928,047,19835,412,364
131,094,11096,590,34394,323,583
9,640,04815,5484,319
ed rate3814) 1
Ta-xgenerated
at rate
(7)
13,471
58--
*30*176
-
*174*368
-*941
*5
1,9071,123
2,7131,9442,6271,132
165108
Taxgenerated
at rate
(13)
112,400,777
-*663
-3,54874,928
1,685,9367,853,2159,915,462
36,706,35127,045,29626,410,603
2,699,2134,3531,209
65
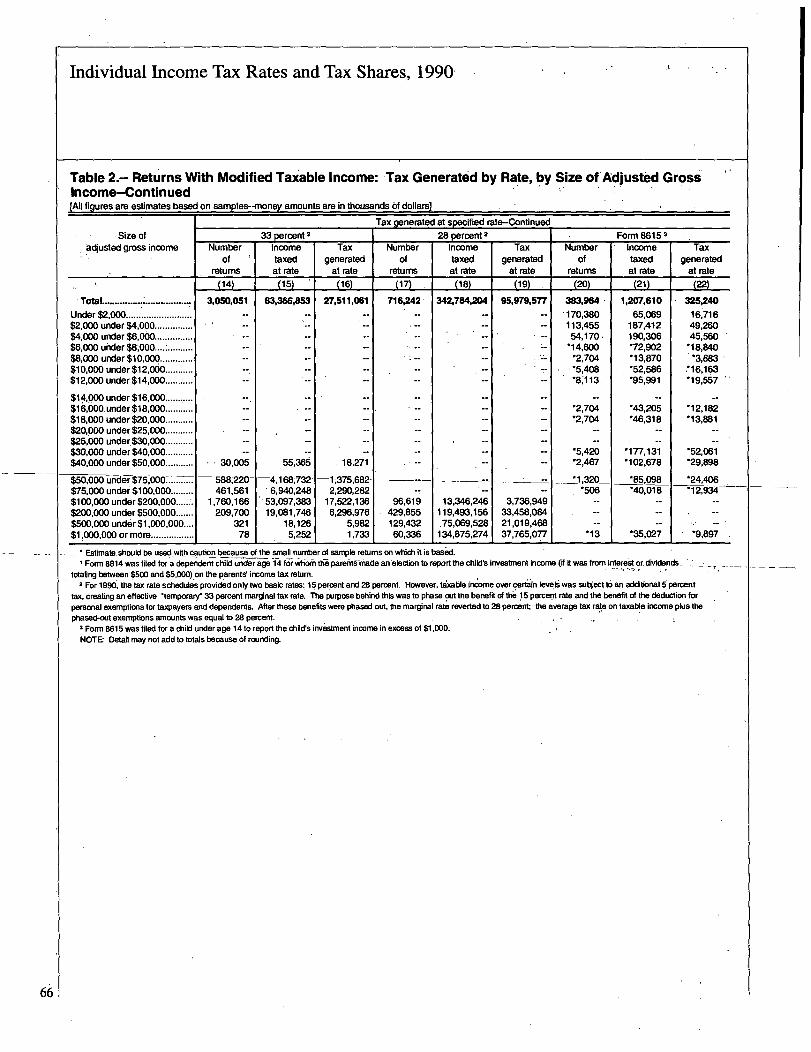
Individual Income Tax Rates and Tax Shares, 1990,
Table 2.- Returns With Modified Taxable Income: Tax Generated by Rate, by Size of Adjusted GrossIncome-Continued[AU figures are estimates based on samples-money amounts are in thousands of dollars]
Size of'adjusted gross income
I Total ...................................
Under $2,000 ............... ..........$2,000 under $4,000...............$4,OOD under $6,000...............$6,ODO under $8,000 ... : ..........$8,000 under $10,000 ............$1 O,ODO under $12,000...........$12,000 under $14,000...........
$14,.000 under $16,000...........$16,000 under $18,000...........$18,ODO under $20,000...........$20,000 under $25,ODO...........$25,000 under, $30,000...........$30,000 under $40,000...........$40,000 under $50,000...........
-~~0,00O under $75-,000 ..... .....$75,000 under $100,000$100,000 under $200,000.......$200,000 under $500,000.......$500,000 under $1;000,000....$1,000,000 or more.................
Numberof
returns(14)
3,050,051
30,005
5a8,220-461,561
1,760,166209,700
32178
33peroent 2Incometaxedat rate
_lJ1 51
83,366,853
55,365
-4-1168,7326,940,248
53,097,38319,081,746
18,1265,252
Taxgenerated
at rate(16)
27,511,061
18,271
-l-,375,682-2,290,282
.17,522,1366,296,976
5,9821,733
Tax generated at specified rate-Continued
NumberOf
returns
28 peroent2Incometaxedat rate
Taxgenerated
at rateM7
716,242-
96.619429,855129,43260,336
(18)
342,784,204
13,346,246119,493,156
~ 75,069,528134,875,274
(19)95,979,ST7
3,736,94933,458,08421,019,46837,765,077
NumberOf
returns'(20)
383,964170,380113,45554,170-
*14,600*2,704
- *5,408*81113
*2,704*2,704
-5,4202,467
*1,320-.506
*13
Form 8615 3
Incometaxed
at rate(21)
1,207,61065,069
187,412190,30672,902
-13,87052,586
-95,991
-43,205*46,318
'177,131*102,678
*85,09840,0-1-8
*35,027
Taxgenerated
at rate(22)
325,240
16,71649,26045 %0
'18,840*3,M16,163
*19,5~7
*12,18213,881
*52,061*29,898
*24,406*12,934
. *9,897 -
- Estimala.should be used with caution because of the small number of sample returns on which it is based.
Form 8814 was filed fore dependentch-ld-under age -i-4 for v~hom the parents-rhade an election to report the child's investment income (0 it was from interest or- dividends-
totaling between $500 and $5,000).on the parents' income tax return.`-;- :,
2 For 1990 the tax rate schedules provided only two basic rates: 15 percept and 28 percent However, ta~cable income over cert~in levels was subject to an aciditlonal 5, percent
tax, creating an effective 'temporaryO 33 percent marginal tax rate. The purpose behind this was to phase out the benefit of tha 15 percent rate and the benefit of the deduction for
personal exemptions for taxpayers and dependents. After these benefits were phased out, the marginal rate reverted to 28 percent; the average tax rate on taxable income plus the
phased-out exemptions amounts was equal to 28 percent3 Form 8615 was filed for a child under age 14 to report the child's investment income in excess of $1,000.
NOTE, Dated may not add to totals because of rounding.
6~
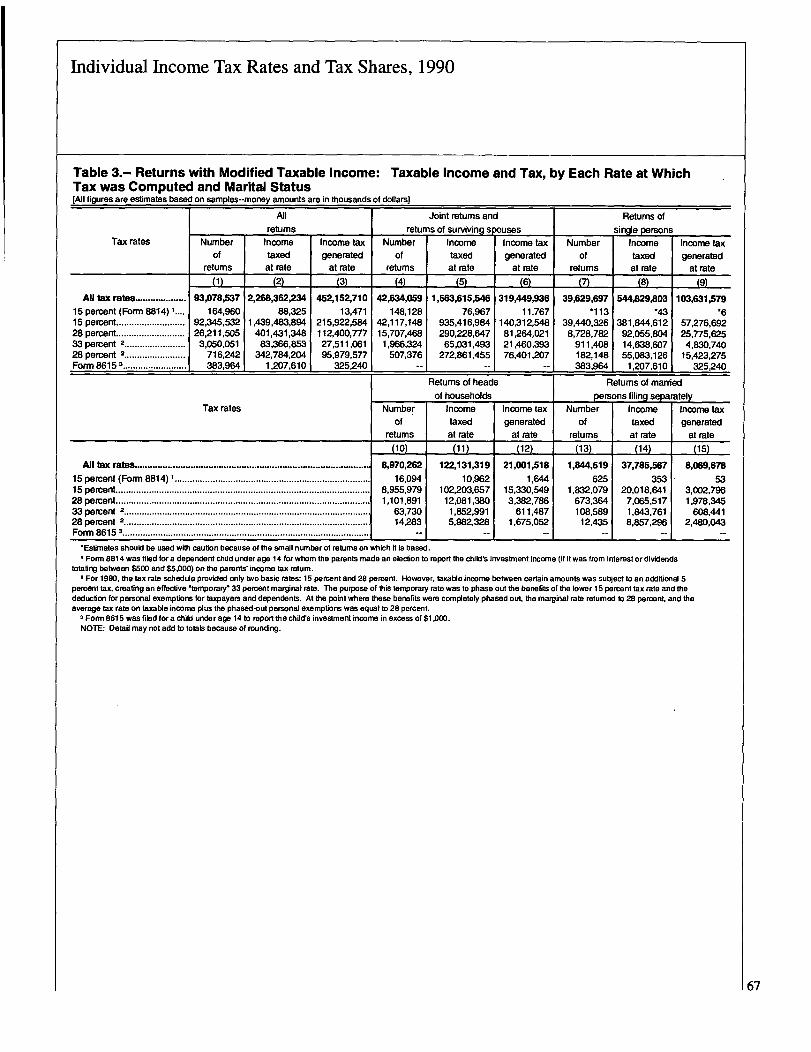
Individual Income Tax Rates and Tax Shares, 1990
Table 3.- Returns with Modified Taxable Income: Taxable Income and Tax, by Each Rate at WhichTax was Computed and Marital Status[An figures are estimates based on samples--money amounts are in thousands of dollars)
All Joint returns and Returns ofreturns retu sofsurvivings uses single persons
Tax rates Number Incomeme
Income tax Number Income Income tax Number Income Income taxof
r
taxed generated of taxed generated of taxed generatedeturns at rate at rate returns at rate at rate returns at rate at rate
(1) 2
P
(3) (4) (5) (6) (7) (8) (9)
All tax rates .................... 93A78,637 2,268,362,234 452,152,710 42,634,059 1,563,615,546 319,449,936 39,629,697 544,829,803 103,631,57915 percent (Form 8814) 1 .... 164,960 88,325 13,471 148,128 76,967 11,767 *113 *43 -615 percent........................... 92,345,532 1,439,483,894 215,922,584 42,117,148 935,416,984 140,312,548 39,440,326 381,844,612 57,276,69228 percent........................... 26,211,505 401,431,348 112,400,777 15,707,468 290,228,647 81,264,021 8,728,782 92,055,804 25,775,62533 percent 2........................ 3,050,051 83,366,&93 27,511,061 1,966,324 65,031,493 21,460,393 911,408 14,638,607 4,830,74028 percent 2........................ 716,242 342,784,204 95,979,577 507,376 272,861,455 76,401,207 182,148 55,083,126 15,423,275Form 8615 3......................... 1 383,9641 1,207,6101 325,240 1 -1-- -- I -- 1 383,9641 1,207,610 1 325,240
Returns of heads Returns of marriedof households pe ns filing sepa tely
Tax rates Number Income Income tax Number Income Income taxof taxed generated of taxed generated
returns strata at rate returns at rate at rate(10) (11) (12) (13) (14) (15)
All tax rates............................................................................................. 8,970,262 12Z131,319 21,001,518-
1,844,519 37,785,567 8,069,67815 percent (Form 8814) 1 ............................................................................. 16,094 10,962 1,644 625 353 5315 percent .................................................................................................... 8,955,979 102,203,657 15,330,549 1,832,079 20,018,641 3,002,79628 percent .................................................................................................... 1,101,891 12,081,380 3,382,786 673,364 7,065,517 1,978,M33 percent 2................................................................................................. 63,730 1,852,991 611,487 108,589 1,843,761 608,44128 percent 2................................................................................................ 14,283 5,982,328 1,675,052 12,435 8,857,296 2,400,043Form 8615 3 ........................................................................................ I ........ - I
-- I-- -- -- --
*Estimates should be used with caution because of the small number of returns on which it is based.
I Form 8814 was filed for a dependent child under age 14 for whom the parents made an election to report the child's investment income (if it was from interest or dividendstotaling between $500 and $5,000) on the parents'income tax return.
2 For 1990, the tax rate schadde provided only two basic rates: 15 percent and 28 percent. However, taxable income between certain amounts was subject to an additional 5percent tax, Creating an effective 'temporary' 33 percent marginal rate. The purpose of this temporary rate was to phase out the benefits of the lower 15 percent tax rate and thededuction for personal exemptions for taxpayers and dependents. At the point where these benefits were completely phased out, the marginal rate retumed to 28 percent, and theaverage tax rate on taxable income plus the phased-out personal exemptions was equal to 28 percent.
3 Form 8615 was filed for a child under age 14 to report the child's investment income in excess of $1,000.NOTE: Detail may not add to totals because Of rounding.
67
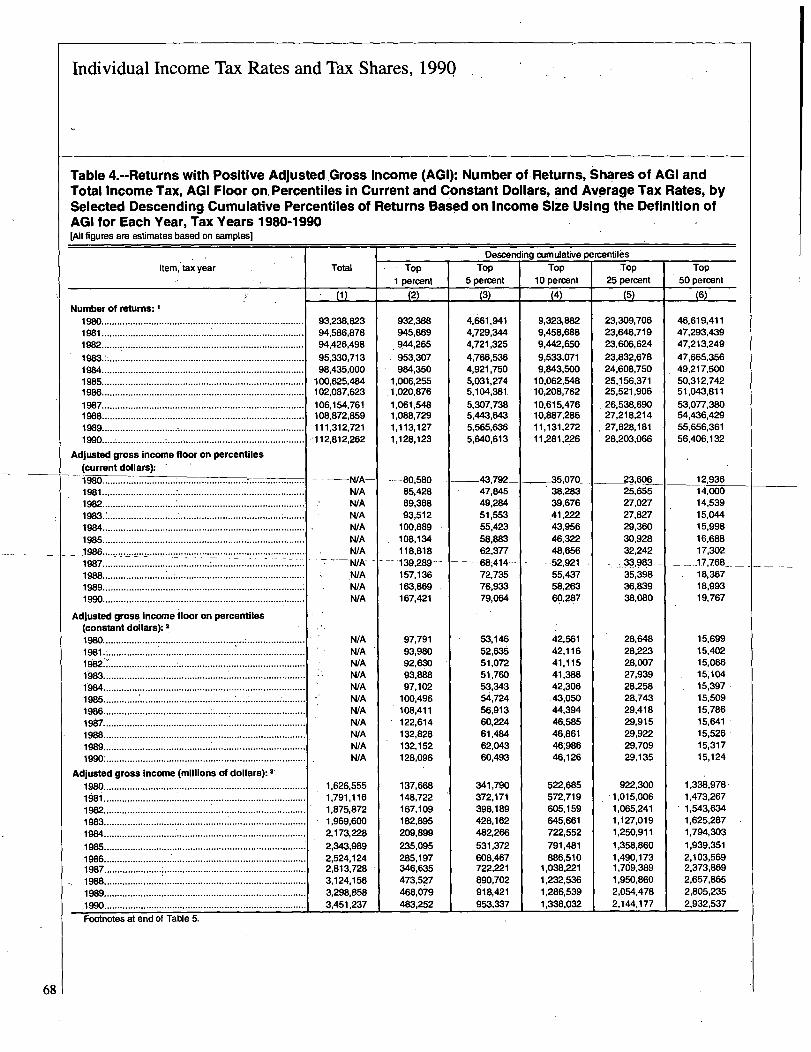
Individual Income Tax Rates and Tax Shares, 1990
Table 4.--Returns with Positive Adjusted Gross Income (AGI): Number of Returns, Shares of AGI andTotal Income Tax, AGI Floor on. Percentiles in Current and Constant Dollars, and Average Tax Rates, bySelected Descending Cumulative Percentiles of Returns Based on Income Size Using the Definition ofAGI for Each Year, Tax Years 1980-1990[All figures are estmates based on samples]
Item, tax year
Number of returns: 11980...........................................1981 ..............................................................................1982....... 7 .....................................................................
1983..............................................................................1984.............................................................................1985.............................................................................1986.............................................................................
1987.............................................................................1988 .............................................................................1989...1990 ..... .................. : .....................................................
..........................................................................
Adjusted gross income floor on percentiles(current dollars): '1980 ..................1981 .................1982 .................1983.: ............... ............................................. ; ........
1984 ........................... ***""'***"*1985 ..................................................... .......................
1986 ....... ........ *--*""--""* *-*"7**** ... *...... **: ... :*** .... *'*"-'**"-"-'1987 ......................................... : ...................................
1988.............................................................................
1989 ............................................................................1990....................................................................
Adjusted gross Income floor on percentiles(constant dollars): 2
19W...................................................... : ......................1981.:...........................................................................1 6132 ............................ : ................................................1983.............................................................................1984.............................................................................1985 .................................................. : ..........................
1986 ................................................ ............................
1987.............................................................................
1988 .............................................................................
1989 .............................................................................19W ............................................................................
Adjusted gross income (millions of dollars): 3
1980 .............................................................................1981 .............................................................................1982 .............................................................................1983 ...................... ......................................................1984.~ ...........................................................................
1985 .............................................................................1986......................1987...................... .......................................................1988.............................................................................1989.............................................................................1990.............................................................................
Footnotes at end of Table 5.
Total
93,238,82394,586,87894,426,49895,330,71398,435,000
100,625,484102,087,623106,154,761108,872,859111,312,721
'112,812,262
- WA-N/AN/AN/AN/AN/AN/A
-7 --- WK -
N/AN/AWA
N/ANIAN/AN/AN/AN/AN/AN/AN/AN/ANIA
1,626,5551,791,1161,875,8721,969,6002,173,2282,343,9892,524,1242,813,7283,124,1563,298,8583,451,237
. Top1 percent
(2)
932,388945,869
.944,265953,307984,350
1,006,255.1,020,876
1,061,5481,088,7291,113,1271,128,123
-80,580-85,42889,38893,512
100,889108,134118,818139,289--157,136163,869167,421
97,79193,98092,63093,88897,102
100,496108,411122,614132,828132,152128,096
137,6681 48,722167,109182,895209,899235,095285,197346,635473,527468,079483,252
Descending cumulative percentilesTop
5 percentTop
10 percentTop
25 percent
_ 30
4,661,9414,729,3444,721,3254,766,5364,921,7505,031,2745,104,3815,307,7385,443,6435,565,6365,640,613
43,792-47,84549,28451,55355,42358,88362,37768,41472,73576,0379,064
53,146UAW51,07251.,76053,34354,72456,91360,22461,48462,04360,493
341,790372,171398,189428,162482,M531,372608,467722,221890,702918,421953,337
(4)
9,323,8829,458,6889,442,6509,533,0719,843,500
10,062,54810,208,76210,615,47610,887,28611,131,27211,281,2.26
-35,07038.28339,676
43,95646,32248,65652,921 -55,43758,26360,287
42,56142,11641,11541,38842,306.43,05044,39446,58546,86146,98646,126
522,685572,719605,159645,661722,552791,481886,510
1,038,2211,232,5361,286,5391,338,032
0)
23,309,70623,646,71923,606,62423,832,67824,608,75025,1156,37125.521,90626,538,69027,218,21427,828,18128,203,066
23,60625,65527,02727,82729,36030,92832,242
,-..33,983-35,39836,83938,080
28,64828,22328,00727,93928,25828,74329,41829,91529,92229,70929,135
92-2,300.1,015,0061,065,2411,127,0191,250,9111,358,8601,490,1731,709,3891,950,8602,054,4782,144,177
Top
50 percent
P
46,619,41147,293,43947,213,24947,665,35649,217,50050,312,74251,043,81153,077,38054,436,42955,656,36156,406,132
12,93614,00014,53915,04415,99816,68817,302-17,768-18,36718,99319,767
15,69915,40215,06615;10415,39715,50915,78615,64115,52615,31715,124
1,338,978,1,473,2671,543,6341,625,2871,794,3031,939,3512,103,5692,373,8692,657,8652,805,2352,932,537
68
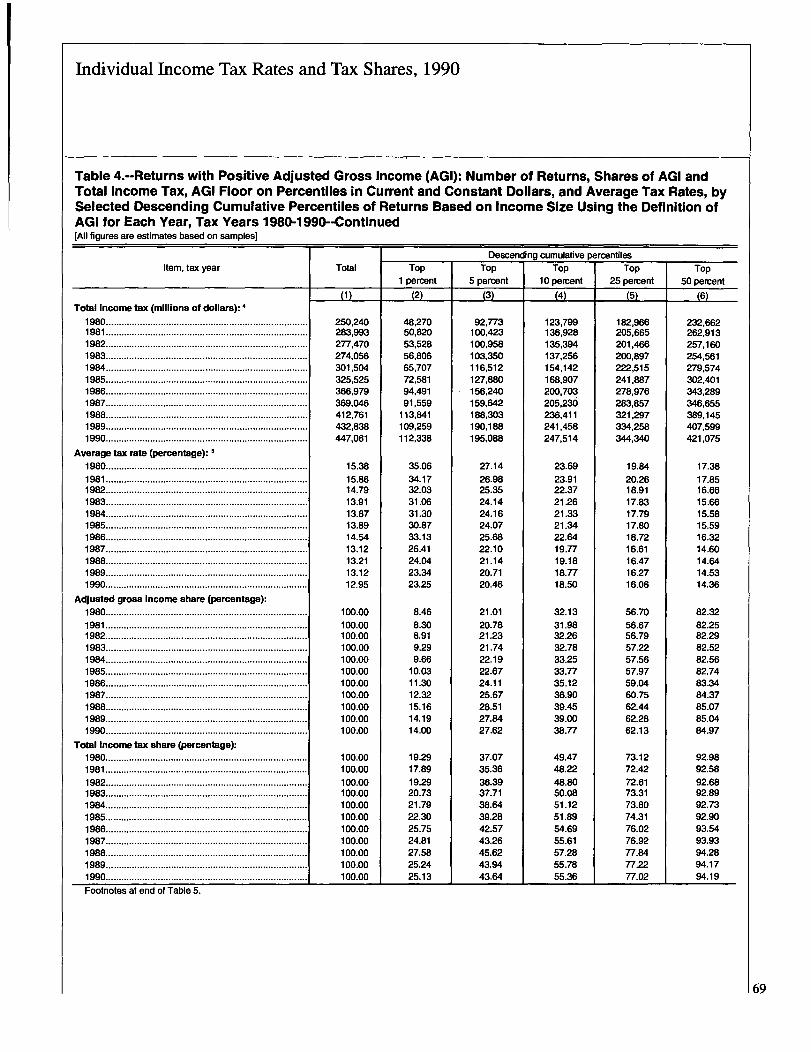
Individual Income Tax Rates and Tax Shares, 1990
Table 4.-Returns with Positive Adjusted Gross Income (AGQ: Number of Returns, Shares of AGI andTotal Income Tax, AGI Floor on Percentiles in Current and Constant Dollars, and Average Tax Rates, bySelected Descending Cumulative Percentiles of Returns Based on Income Size Using the Definition ofAGI for Each Year, Tax Years 1980-1990--Continued[All figures are estimates based on samples]
Item, tax year
Total Income tax (millions of dollars): 4
1980.............................................................................1981 .............................................................................1982.............................................................................1983.............................................................................1984 .............................................................................1985.............................................................................1986....................................................... .....................1987.............................................................................1988.............................................................................1989.............................................................................1990.............................................................................
Average tax rate (percentage): 5
1980.............................................................................1981 .............................................................................1982.............................................................................1983.............................................................................1984.............................................................................1985.............................................................................1986.............................................................................1987.............................................................................1988.............................................................................1989.............................................................................1990.............................................................................
Adjusted gross Income share (percentage):
1980.............................................................................
1981 .............................................................................1982 .............................................................................1983.............................................................................1984.............................................................................1985 .............................................................................1986.............................................................................1987.............................................................................1988.............................................................................
1989.............................................................................1990 .............................................................................
Total Income tax share (percentage):
1980.............................................................................1981 .............................................................................1982.............................................................................1983.............................................................................1984 .............................................................................1985 .............................................................................1986.............................................................................1987.............................................................................1988.............................................................................1989 .............................................................................1990.............................................................................
Footnotes at end of Table 5.
Total
11)
250,240283,993277,470274,056301,504325,525366,979369,046412,761432,838447,061
15.3815.8614.7913.9113.8713.8914.5413.1213.2113.1212~95
100.00100.00100.00100.00100.00100.00100.00100.00100.00100.00100.00
100.00100.00100.00100.00100.00100.00100.00100.00100.00100.00100.00
Top
1 percent
M
48,27050,82053,52856,80665,70772,58194,49191,559
113,841109,259112,338
35.0634.1732.0331.0631.3030.8733.1326.4124.0423.3423.25
8.468.308.919.299.66
10.0311.3012.3215.1614.1914.00
19.2917.8919.2920.7321.7922.3025.7524.8127.5825.2425.13
Descending cumulative percentilesTop
5 percentTop
10 percentTop
25 percent
U3
92,773100,423100,958103,350116,512127,880156,240159,642188,303190,188195,088
27.1426-9825.3524.1424.1624.0725.6822.1021.1420.7120.46
21.0120.7821.2321.7422.1922.6724.1125.6728.5127.8427.62
37.0735.3636.3937.7138-6439.2842.5743.2645.6243.9443.64
L4)
123,799136,928135,394137,256154,142168,907200,703205,230236,411241,458247,514
23.6923.9122.3721.2621.3321.3422.64197719.1818.7718.50
32.1331.9832.2632.7833.2533.T735.1236.9039.4539.0038.77
49.4748.2248.8050.0851.1251.8954.6955.6157.2855.7855.36
L5)
182,966205,665201,466200,897222,515241,887278,976283,857321,297334,258344,340
19.8420.2618.9117.8317.7917.8018.7216.6116.4716.2716.06
56.7056.6756.7957.2257.5657.9759.0460.7562.4462.2862.13
73.1272.4272.6173.3173.8074.3176.0276.9277.8477.2277.02
Top50 percent
(6)
232,662262,913257,160254,561279,574302,401343,289346,655389,145407,599421,075
17.3817.8516.6615.6615.5815.5916.3214.6014.6414.5314.36
82.3282.2582.2982.5282.5682.7483.3484.3785.0785.0484.97
92.9892.5892.6892.8992.7392.9093.5493.9394.2894.1794.19
69
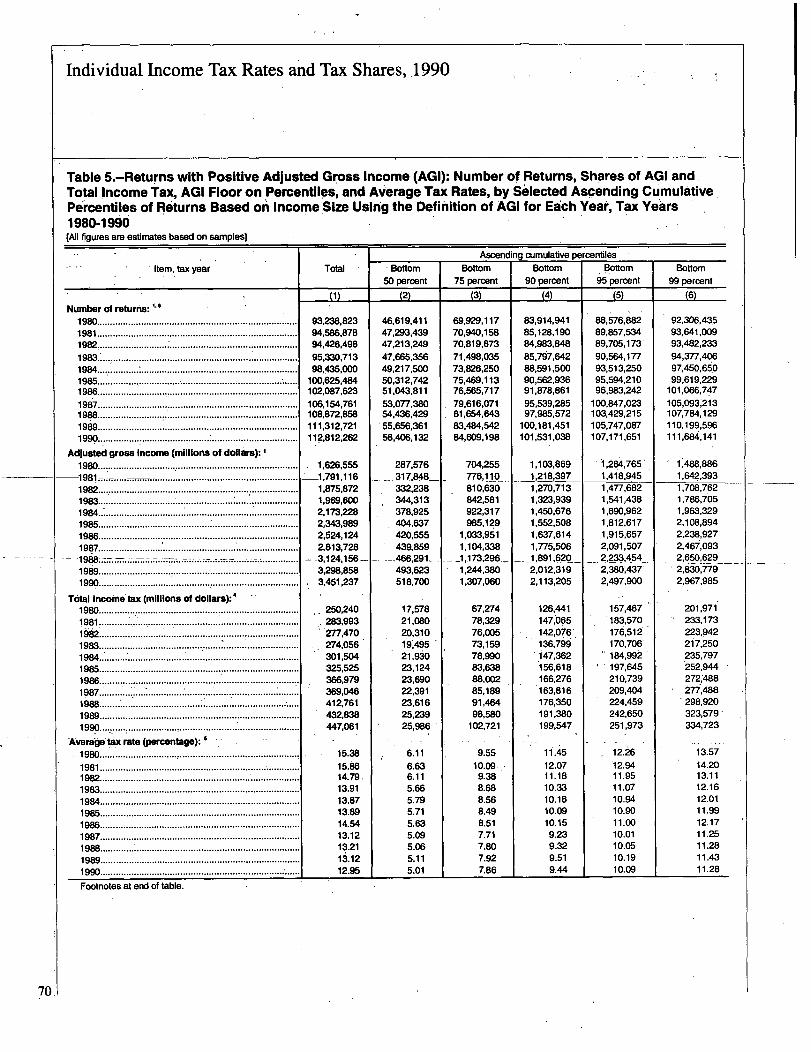
Individual Income Tax Rates and Tax Shares,.1990
Table 5.-Returns with Positive Adjusted Gross Income (AGQ: Number of Returns, Shares of AGI and.Total Income Tax, AGI Floor on Percentiles, and Average Tax Rates, by Selected Ascending CumulativePercentiles of Returns Based on IncomeSize Using the Definition of AGI for Each Year, Tax Years1980-1990[All figures are estimates based on samples]
Item, tax year
Number of returns:1980.............................................................................1981 ...........................1982 ..............................................................................
1983 : .......................................................................1984 ................ : ............................................................1985 ..............................................................................1986.............................................................................
1967.............................................................................1988.............................................................................1969..............................................................................1990................: .......................... : .................................
Adjusted gross Income (millions of dollars):
1980..................................................................................................................................................981 ........-
1982 ..................................................... : .........................1983................................. 7*'**'**
.....................................
1984 .... ...................................... ........................1985 .............................................................................1986 ............................... : ...............................................1987 .............................................................................
..........................1989 .............................................................................1990.............................................................................
Total Income tax (millions of dollars): 41980.............................................. ..............................198,
.............................................................................
1 §62................................................1983.............................................................................
1984...........* .................................................................1985.............................................................................1986........................... 7 ............1987.............................................................................
1988 ................................................................................1989 .............................................................................1990 .............................................................................
Average tax rate (percentage):1980 .............................................................................
1981 .............................................................................1982 .............................................................................1983 .............................................................................1984 .............................................................................1985.............................................................................1986 .............................................................................1987.............................................................................1988.............................................................................
1989.............................................................................1990..............................................................................
Footnotes at end of table.
Total
(1)
93,238,82394,586,87894,426,49895,330,71398,435,000
100,625,484102,087,623106,154,761108,872,&%111,312.721112,812,262
. 1,626,555-1,791,116
1,875,8721,969.6002,173,2282,343,9892,524,1242,813,7283,124,156-3,298,&583,451,237
250,240283,993277,470274,056301,504325,525366,979369.046412,761432,838447,061
15.3815.8614.79.13.9113.8713.8914.5413.1213.216.1212.95
I Bottom50 percent
_L2)
46,619,41147,293,43947,213,24947,665,35649,217,50050,312,74251,043,81153,077,38054,436,42955,656,36156,406,132
287,576
332,238344,313378,925404,637420,555439,859
---466,291-493,623518,700
17,57821,08020,31019,49521,93023,12423,69022,39123,61625,23925,986
6.116.636.115.665.795.715.635.095.065.115.01
Ascending cumulative percentiles -Bottom
75 percent
Bottom90 percent
Bottom
95 percent
M
69,929,11770,940,15870,819,87371,498,03573,826,25075,469,11376,565,71779,616,07181,654,64383,484,54284,609,198
704,255776,110810,630842,581922,317985,12 9
1,033,9511,104,338
-1,173,2961,244,3801,307,060
67,27478,32976,00573,15978,99083,63888,00285,18991,46498,580
102,721
9.5510.09
9.388.688.568.498.517.717.807.927.86
(4)
83,614,94185,128,19084,983,84885,797,64288,591,50090,562,93691,878,86195,539,28597,985,572
100,181,451101,531,038
1,103,8691,2`18,3971,270,7131,323,9391,450,6761,552,5081,637,6141,775,506
-1,89-1,13-20-2,012,3192,113,205
126,441147,065142,076136,799.147,362156,618166,276163,816176,350191,380199,547
11.4512.0711.1810.3310.1610.0910.15
9.239.329.519.44
05
88,576,88289,857,53489,705,173'90,564,17793,513,25095,594,21096,983,242
100,847,023103,429,215105,747,087107,171,651
'1,284,765'1,418,9451,477,6821,541,4381,690,9621,812,6171,915,6572,091,5072,233,4542,380,4372,497,900
183,570176,512170,7016184,992.197,645210,739209,404224,459242,650251,973
12.2612.9411.9511.0710.9410.9011.0010.0110.0510.1910.09
Bottom99 peroent
(6)
92,306,43593M1,00993,482,23394,377,40697,450,65099,619,229
101,066,747105,093,213107,784,129110,199,596111,684,141
1,488,8861,642,3931,708,7621,786,7051,963,3292,108,8942,238,9272,467 0932,650,6292,830,7792,967,985
201,971233,173223,9422i7,250235,797252,944272,'488277~488298,920323,579-334,723
13.5714.2013.1112.1612.0111.9912.1711.2511.2811.4311.28
70.
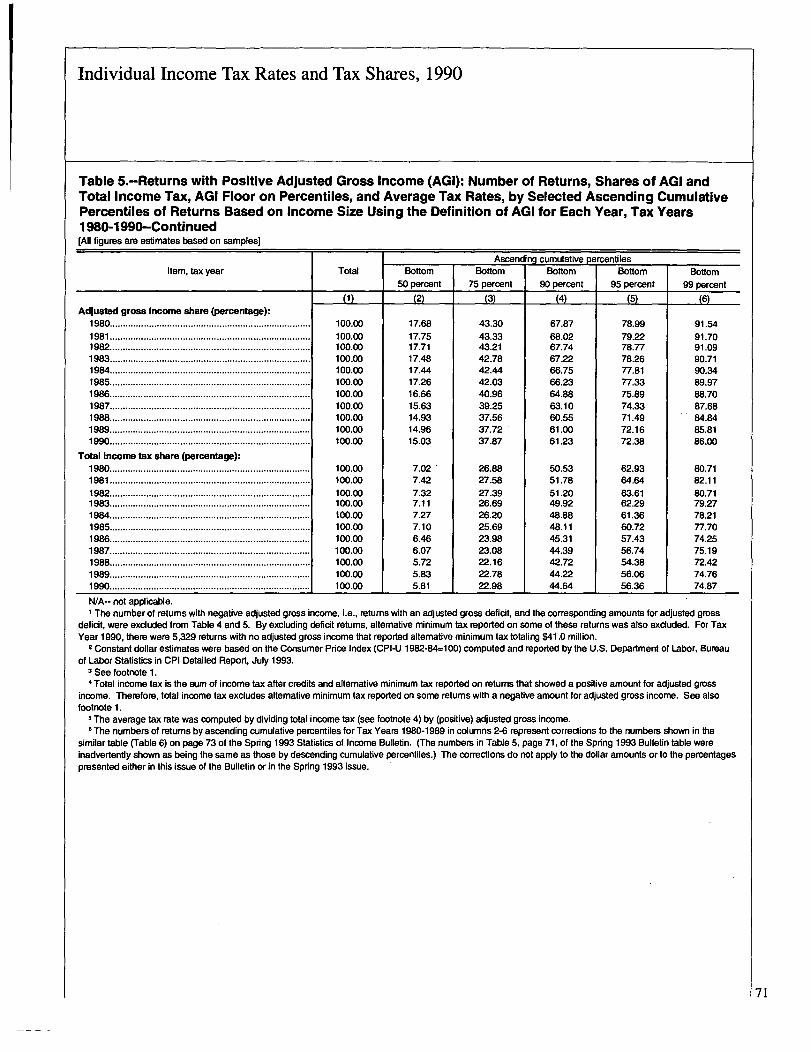
Individual Income Tax Rates and Tax Shares, 1990
Table 5.-Returns with Positive Adjusted Gross Income (AGQ: Number of Returns, Shares of AGI andTotal Income Tax, AGI Floor on Percentiles, and Average Tax Rates, by Selected Ascending CumulativePercentiles of Returns Based on Income Size Using the Definition of AGI for Each Year, Tax Years1980-1990-Continued[All figures are estimates based on samples]
Item, tax year
Adjusted gross Income share (percentage):1980 .............................................................................1981 .............................................................................1982.............................................................................1983 .............................................................................1984 .............................................................................1985.............................................................................1986.............................................................................1987.............................................................................1988.............................................................................1989.............................................................................1990.............................................................................
Total Income tax share (percentage):
Total
V)
100.00100.00100.00100.00100.00100.00100.00100.00100.00100.00100.00
Bottom50 percent
17.6817.7517.7117.4817.4417.2616.6615.6314.9314.9615.03
Ascending cumulative percentilesBottom
75 percentBottom
90 percentBottom
95 percent
131
43.3043.3343.2142.7842.4442.0340.9639.2537.5637.7237.87
_C4)
67.8768.0267.7467.2266.7566.2364.8863.1060.5561.0061.23
78.9979.2278.7778.2677.8177.3375.8974.3371.4972.1672.38
Bottom99 percent
(6)
91.5491.7091.0990.7190.3489.9788.7087.6884.8485.8186.00
1980............................................................................. 100.00 7.02 26.88 50.53 62.93 80.711981 ............................................................................. 100.00 7.42 27.58 51.78 64.64 82.11
1982............................................................................. 100.00 7.32 27.39 51.20 63.61 80.711983............................................................................. 100.00 7.11 26.69 49.92 62.29 79.271984............................................................................. 100.00 7.27 26.20 48.88 61.36 78.211985............................................................................. 100.00 7.10 25.69 48.11 60.72 77.701986............................................................................. 100.00 6.46 23.98 45.31 57.43 74.251987............................................................................. 100.00 6.07 23.08 44.39 56.74 75.191988............................................................................. 100.00 5.72 22.16 42.72 54.38 72.421989............................................................................. 100.00 5.83 22.78 44.22 56.06 74.761990............................................................................. 100.00 5.81 22.98 44.64 56.36 74.87
N/A-- not applicable.I The number of returns with negative adjusted gross income, i.e., returns with an adjusted gross deficit, and the corresponding amounts for adjusted gross
deficit, were excluded from Table 4 and 5. By excluding deficit returns, alternative minimum tax reported on some of these returns was also excluded. ForTaxYear 1990, there were 5,329 returns with no adjusted gross income that reported alternative minimum tax totaling $41.0 million.
2 Constant dollar estimates were based on the Consumer Price Index (CPI-U 1982-84--l 00) computed and reported by the U.S. Department of Labor, Bureauof Labor Statistics in CPI Detailed Report, July 1993.
3 See footnote 1.4 Total income tax is the sum of income tax after credits and alternative minimum tax reported on returns that showed a positive amount for adjusted gross
income. Therefore, total income tax excludes alternative minimum tax reported on some returns with a negative amount for adjusted gross income. See alsofootnote 1.
5 The average tax rate was computed by dividing total income tax (see footnote 4) by (positive) adjusted gross income.I The numbers of returns by ascending cumulative percentiles for Tax Years 1980-1989 in columns 2-6 represent corrections to the numbers shown in the
similar table (Table 6) on page 73 of the Spring 1993 Statistics of Income Bulletin. (The numbers in Table 5, page 71, of the Spring 1993 Bulletin table wereinadvertently shown as being the same as those by descending cumulative percentiles.) The corrections do not apply to the dollar amounts or to the percentagespresented either in this issue of the Bulletin or in the Spring 1993 issue.
71
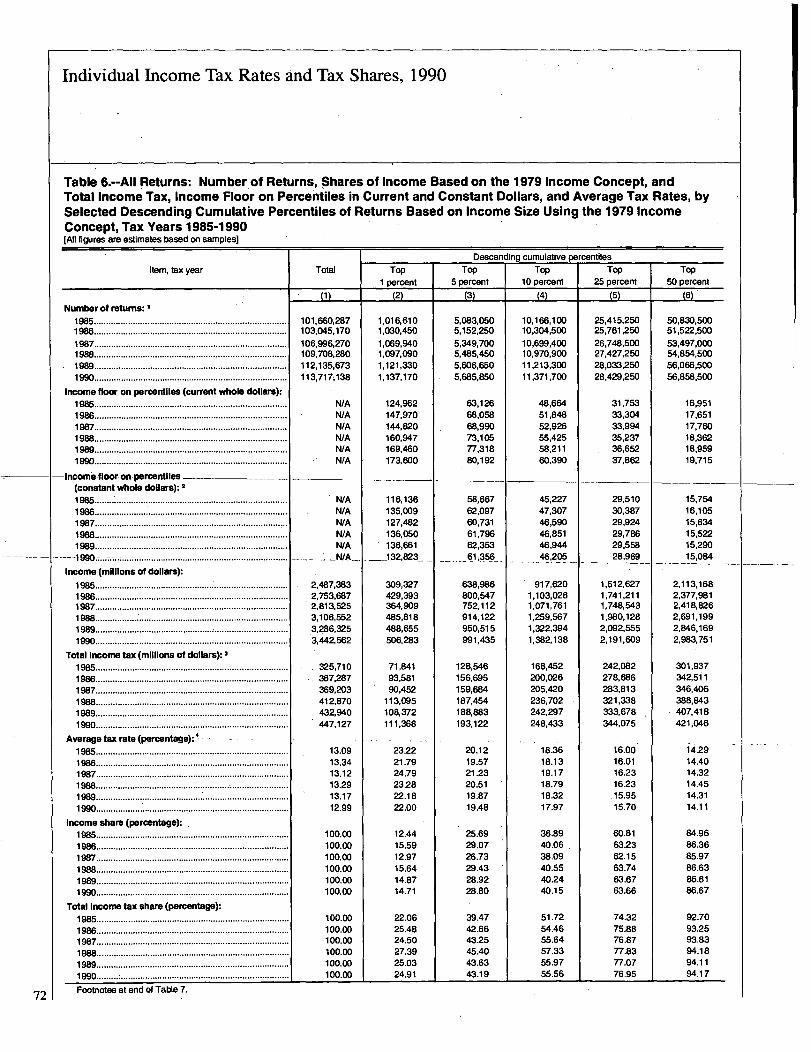
Individual Income Tax Rates and Tax Shares, 1990
Table 6.--All Returns: Number of Returns, Shares of Income Based on the 1,979 Income Concept, andTotal Income Tax, Income Floor on Percentiles in Current and Constant Dollars, and Average Tax Rates, bySelected Descending Cumulative Percentiles of Returns Based on Income Size Using the 1979 IncomeConcept, Tax Years 1985-1990[AJI figures are estimates based on samples]
Item, tax year
Number of returns:19M...............................................................................1986 ...............................................................................
1987 ...............................................................................1988 ...............................................................................1989 ...............................................................................1990 ...............................................................................
Income floor on percentiles (current whole dollars):
1985 ...............................................................................1 9116 ...............................................................................1987 ...............................................................................1988 ...............................................................................1989 ....... . ......................................................................1990...............................................................................
-Incomefloor-on percentiles(constant whole dollars): 2
1985 .....................7 .........................................................1986...............................................................................1987...............................................................................1988...............................................................................1989. ... . ........................................................................
-
-1990 ...............................................................................
income (millions of dollars):
1985 ...............................................................................1986 ...............................................................................1987 ...............................................................................1988 ................................................................................1989 ...............................................................................1990 ...............................................................................
Total Income tax (millions of dollars): 3
1985 ...............................................................................1986 ...............................................................................19B7 ...............................................................................1988 ...............................................................................1989 ...............................................................................1990 ...............................................................................
Average tax rate (percentage):'
1985 ...............................................................................1986 ...............................................................................1987...............................................................................1988 ................................................................................1989 ...............................................................................1990...............................................................................
Income share (percentage): ,
im...............................................................................1986...............................................................................1987...............................................................................1988...............................................................................1989...............................................................................1990...................................... ........................................
Total Incometax share (percentage):
1985...............................................................................1986..................... : .........................................................1987...............................................................................1988...............................................................................1989...............................................................................1990 .....................................................................
Footnotes at end of Table 7.72
Total
(1)
101,660,237103.045,170106,996,270109,708,280112,135,673113,717;138
N/AN/AN/AN/AWAWA
WAN/AN/AWAWA
-N/A---
2,487,3832,753,6872,813,5253,106,5523,286,3253,442,562
325,710367,287369,203412,870432,940447,127
13.0913.3413.1213.2913.1712.99
100.00100.00100.00100.00100.00100.00
100.00100.00100.00100.00100.00100.00
TOP1 percent
t2)
1,016,6101,030,4501,069,9401,097,0901,121,3301,137,170
124.962147,970144,820160,947169,460173,600
116,136135,009127,482136,050136,661
--132,823-,-
309,327429,393364,909485,818488,655506,2133
71,84193,58190,452
113,095108,372111,368
23.2221.7924.7923.2822.1822.00
12.4415.5912.9715.6414.8714.71
22.0625.4824.5027.3925.0324.91
Descending cumulative percentilesTop
5 percentTop
10 percentTOP
25 percentU3
5,083.0505,152,2505,349,7005,485,4505,606,6505,685,850
63,12668,05868,99073,10577,31880,192
58,66762,09760,73161,79662,35361,356.
638,986800,54775Z112914,122950,515991,435
128,546156,695159,684187,454188,883193,122
20.1219.5721.2320.5119.8719.48
25.6929.0726.7329.4328.9228.80
39.4742.6643.2545.4043.6343.19
(4)
10,166,10010,304,50010,699,40010,970,90011,213,30011,371,700
48,66451,84852,92655,42558,21160,390
45,22747,30746,59046,85146,944
__46,205
917,6201,103,0261,071,7611,259,5671,322,3941,382,138
168,452200,026205,420236,702242,297248,433
18.3618.1319.1718.7918.3217.97
36.8940.0638.0940.5540.2440.15
51.7254.4655.6457.3355.9755.56
(5)
25,415,2502-5,761,25026,748,50027,427,25028,033,25028,429,250
31,75333,30433,99435,23736,65237,862
29,51030,38729,92429,78629,55828,969
1,512,6271,741,2111,748,5431,980,1282,092,5552,191,609
242,082278,686283,813321,338333,678344,075
16.0016.0116.2316.23
.15.9515.70
60.8163.2362-1563.7463.6763.66
74.3275.8876.8777.8377.0776.95
TOP50 percent
(6)
50,830,50051,522,50053,497,00054,854,50056,066,50056,858,500
16,95117,65117,76018,36218,95919,715
15,75416,10515,63415,52215,290
- 15,084
2,113,1682,377,9812,418,8262,691,1992,846,1692,983,751
301,937342,511346,406388,843407,418421,046
i4.2914.4014.3214.4514.3114.11
84.9686.3685.9786.6386.6186.67
92.7093.2593.8394.1894.1194.17
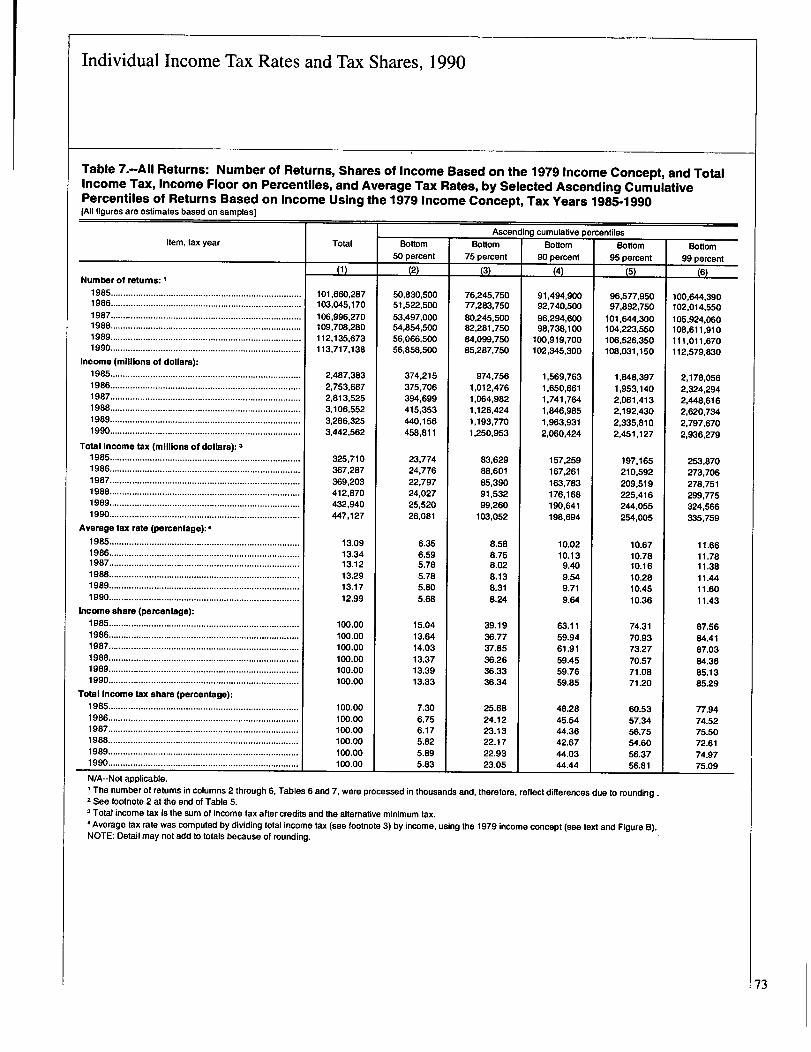
Individual Income Tax Rates and Tax Shares, 1990
Table 7.-All Returns: Number of Returns, Shares of Income Based on the 1979 Income Concept, and TotalIncome Tax, Income Floor on Percentiles, and Average Tax Rates, by Selected Ascending CumulativePercentiles of Returns Based on Income Using the 1979 Income Concept, Tax Years 1985-1990[All figures are estimates based on samples]
Item, tax year
Number of retunns: I
1985............................................................................
1986............................................................................
1987............................................................................
1988............................................................................1989 ............................................................................1990 ............................................................................
Income (millions of dollars):1985 ............................................................................1986 ............................................................................1987 ............................................................................1988 ............................................................................1989 ............................................................................1990 ............................................................................
Total Income tax (millions of dollars): 3
1985 ............................................................................1986............................................................................1987............................................................................1988............................................................................1989............................................................................1990............................................................................
Average tax rate (percentage): 4
1985 ............................................................................1986 ............................................................................1987 ............................................................................1988 ............................................................................1989 ............................................................................1990 ............................................................................
Income share (percentage):1985 ............................................................................1986 ............................................................................1987 ............................................................................1988 ............................................................................1989 ............................................................................1990............................................................................
Total Income tax share (percentage):1985............................................................................1986............................................................................1987 ............................................................................1988 ............................................................................1989 ............................................................................1990 ............................................................................
Total
W
101,660,287103,045,170106,996,270109,708,280112,135,673113,717,138
2,487,3832,753,6872,813,5253,106,5523,286,3253,442,562
325,710367,287369,203412,870432,940447,127
13.0913.3413.1213.2913.1712.99
100.00
100.00
100.00100.00
100.00100.00
100.00100.00
100.00100.00
100.00100.00
Bottom50 percent
M
50,830,50051,522,50053,497,00054,854,50056,066,50056,858,500
374,215375,706394,699415,353440,156458,811
23,77424,77622,79724,02725,52026,081
6.356.595.785.785.805.68
15.0413.6414.0313.3713.3913.33
7.306.756.175.825.895.83
Ascending cumulative percentilesBottom
75 percentBottom
90 percentBottom
95 percentt3)
76,245,75077,283,75080,245,50082,281,75084,099,75085,287,750
974,7561,012,4761,064,9821,126,4241,193,7701,250,953
83,62988,60185,39091,53299,260
103,052
8.588.758.028.138.318.24
39.1936.7737.8536.2636.3336.34
25.6824.1223.1322.1722.9323.05
14)
91,494,90092,740,50096,294,60098,738,100
100,919,700102,345,300
1,569,7631,650,6611,741,7641,846,9851,963,9312,060,424
157,259167,261163,783176,168190,641198,694
10.0210.139.409.549.719.64
63.1159.9461.9159.4559.7659.85
48.2845.5444.3642.6744.0344.44
(5)
96,577,95097,892,750
101,644,300104,223,550106,526,350108,031,150
1,848,3971,953,1402,061,4132,192,4302,335,8102,451,127
197,165210,592209,519225,416244,055254,005
10.6710.7810.1610.2810.4510.36
74.3170.9373.2770.5771.0871.20
60.5357.3456.7554.6056.3756.81
N/A--Not applicable.The number of returns in columns 2 through 6, Tables 6 and 7, were processed in thousands and, therefore, reflect differences due to rounding .
2 See footnote 2 at the end of Table 5.3 Total income tax is the sum of income tax after credits and the alternative minimum tax.4 Average tax rate was computed by dividing total income tax (see footnote 3) by income, using the 1979 income concept (see text and Figure B).NOTE: Detail may not add to totals because of rounding.
Bottom99 percent
(6)
100,644,390102,014,550105,924,060108,611,910111,011,670112,579,830
2,178,0562,324,2942,448,6162,620,7342,797,6702,936,279
253,870273,706278,751299,775324,566335,759
11.6611.7811.3811.4411.6011.43
87.5684.4187.0384.3685.1385.29
77.9474.5275.5072.6174.9775.09
73
Revision to the Statistics of Income--I 990,Individual Income Tax Returns
The following corrections are being published in theStatistics ofIncome Bulletin as a convenience to users ofStatistics
of Income-Individual Income Tax Returns, who are also subscribers to the Bulletin. Statistics ofIncome-I 992, Individual
Income Tax Returns, Publication 1304, in which the corrections would normally appear, will be published by the U.S.
Government Printing Office at a laterldate.
On pages 16-18 of Statistics of- Income-] 990, Individual Income Tax Returns:
Table 1. 1, which presents summary data or! income and tax, classified by cumulative adjusted gross income size
classes, is reproduced in full in order to correct the amounts shown in column 16, pages 16718, for "Total income
tax"; thepercentages in column 15, page 18, for "Income tax after credits" in that part of the table which presents
data cumulated downward from,the largest size of adjusted gross income; and the description on page 18 of that
same part.of the table, which is incorrectly described as presenting data "cumulated from the smallest size of
adjusted gross income" instead of "cumulated from the largest size of adjusted gross income." ("Total income
tax" is the sum of "income tax after credits," column 14, plus the "alternative miminum tax.")
On page 24 of Statistics ofIncome-]090, Individual Inc6me Tax Returns:
In Table 1.4, which presents data on sources of income, statutory adjustments, and tax items, classified by size
of adjusted gross income, the heading above columns 5-6 should read "Taxable interest" instead of "Taxable income."
74
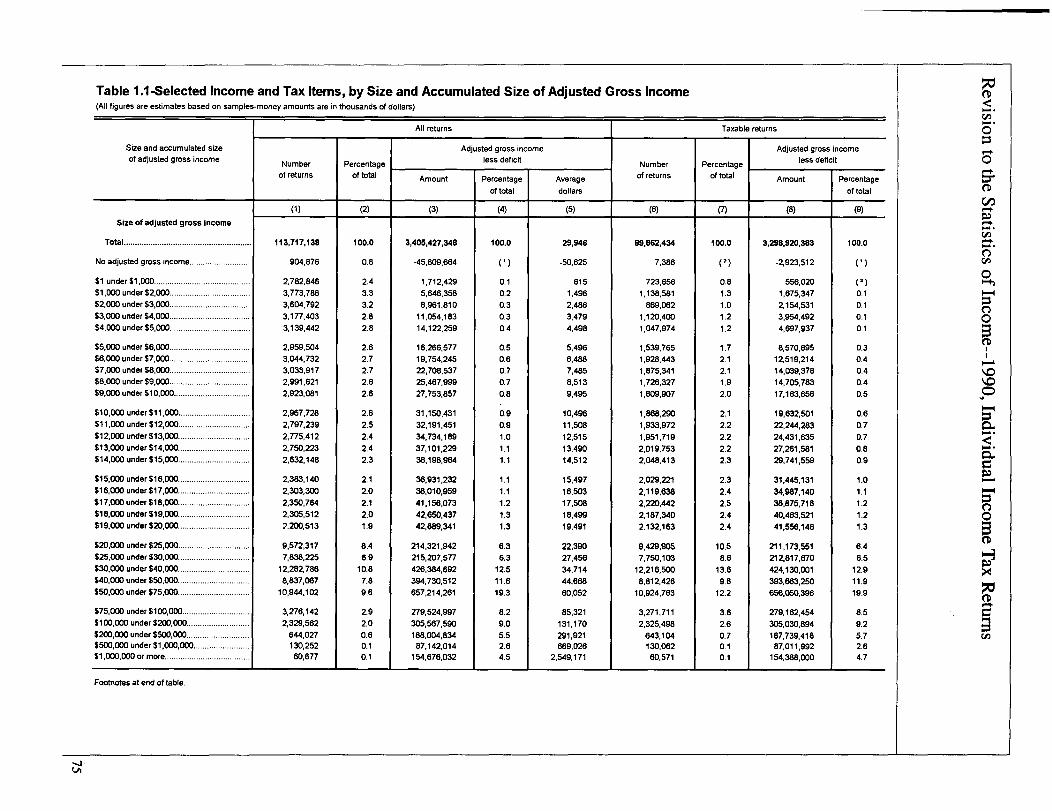
Table 1.1-Selected Income and Tax Items, by Size and Accumulated Size of Adjusted Gross Income(All figures are estimates based on samples-money amounts are in thousands of dollars)
All returns
Size and accumulated sizeof adjusted gross income
Size of adjusted gross income
Total .........................................................
No adjusted gross income...........................
$1 under $1,000 ...........................................
$1,000 under $2,000....................................
$2,000 under $3,000....................................
$3,000 under $4,000. ..................................
$4,000 under $5,000....................................
$5,000 under $6,000....................................
$6,000 under $7,000....................................
$7,000 under $8,000....................................
$8,000 under $9,000....................................
$9,000 under $10,000 ..................................
$10,000 under $1 1,ODD................................
$11,000 under $12,000................................
$1ZOOD under $13,000 ................................
$13,000 under $14,000 ................................
$14,000 under $15,000 ................................
$15,000 under $16,000 ................................
$16,000 under $17,000 ................................
$17,01M under $18,000 ................................
$18,000 under $19,000 ................................
$19.000 under $20,000 ................................
$20,000 under $25,000 ................................
$25,000 under $30,000 ................................
$30,000 under $40,000 ................................
$40,000 under $50,DDO................................
$50,000 under $75,000 ................................
$75,000 under $100,000..............................
$100,000 under $200,000............................
$200,ODO under $500.000............................
$500,000 under $1,000,ODO.........................
$1,000,000 or more ......................................
Numberof returns
1 11 3,717,138
904,876
2,782,8463,773,7118
3,604,792
3,177,403
3.139.442
2,959,504
3,044,7323,033.917
2,991,621
2.923,081
2,967,728
2,797.239
2,775,412
2.750,223
2,632,148
2.383,140
2.303,300
2,350,764
2.305,5122,200,513
9,572,317
7.838,225
12,282,71568,837,067
10.944.102
3.276,142
2,329,562
644.027130,252
60,677
Percentageof total
(2)
100.0
0.8
2.43.3
3.2
2.8
2.8
2.6
2.72.7
2.8
2.6
2.62.5
2.4
2.42.3
2.1
2.0
2.1
2.0
1.9
8.4
6.9
10.87.8
9.6
2.9
2.00.60.1
0.1
Amount
(3)
3,405,427,348
-45.809,664
1,712.4295,646,358
8.961,810
11,054,183
14,122,259
16,266.577
19,754,245
22,708,53725.467,M
27,753.857
31,150,431
32,191,45134,734,189
37,101,229
38,198,964
36,931,23238,010,959
41,156,073
42.650.437
42,889,341
214,321.942
215,207,577
426,384.692
394.730,512
657,214,261
279,524,997
305,567,590
188,004,&3487,142,014
154.676,032
Adjusted gross incomeless deficit
Percentageof total
(4)
100.0
(1)
0.10.2
0.3
0.3
0.4
1.11.1
1.2
1.3
1.3
6.36.3
12.5
11.6
19.3
8.2
9.0
5.52.64.5
Ayerage
dollars
(5)
29,946
-50,625
6151,496
2,486
3.479
4,498
5,496
6.488
7.4858,513
9.495
10.49611,508
12,515
13,490
14,512
15,49716,503
17,508
18,499
19,491
22.39027.456
34,714
44,668
60,052
85,321
131.170
291,921669,026
2,549,171
Number
of returns
(6)
89,862,434
7,386
723,6561.138,581
869,0621,120,400
1.047,974
1,539.765
1,928,443
1.875,3411,726,327
1,809,907
1,868,290
1,933,9721,951.719
2.019,753
2.048.413
2,029,2212,119,638
2,220,442
2,187,340
2.132,163
9,429,MS7,750,103
12.216,5008,812.426
10,924,763
3,271,711
2,325,498
643,104130,08260,571
Taxable returns
Percentage less defic
Percentage
of total
Adjusted gross income
of total
(7)
100.0
(1)
0.81.3
1.0
1.2
1.2
1.7
2.1
2.11.9
2.0
2.1
2.22.2
2.2
2.3
2.32.4
2.5
2.4
2.4
10.5
8.613.6
9.8
12.2
3.6
2.6
0.70.10.1
Amount
(8)
3,298,920,383
-2,923.512
556.0201.675,347
2,154,531
3.954,492
4,697,937
8,570,695
12.519,214
14.039.37814,705,783
17,163,656
19,632,501
22,244,28324,431,635
27,261.581
29,741,559
31,445,13134,987,140
38,875,718
40,463.521
41.556,148
211,173,551212,817,670
424,130.001
393,663,250
656,050,396
279.162,454
305.030,894
187,739.41887,011,992
154,388.000
it
100.0
(1)
(1)0.1
0.1
0.1
0.1
0.3
0.4
0.40.4
0.5
6.4
6.512.9
11.9
19.9
8.5
9.2
5.72.64.7
Footnotes at end of table.
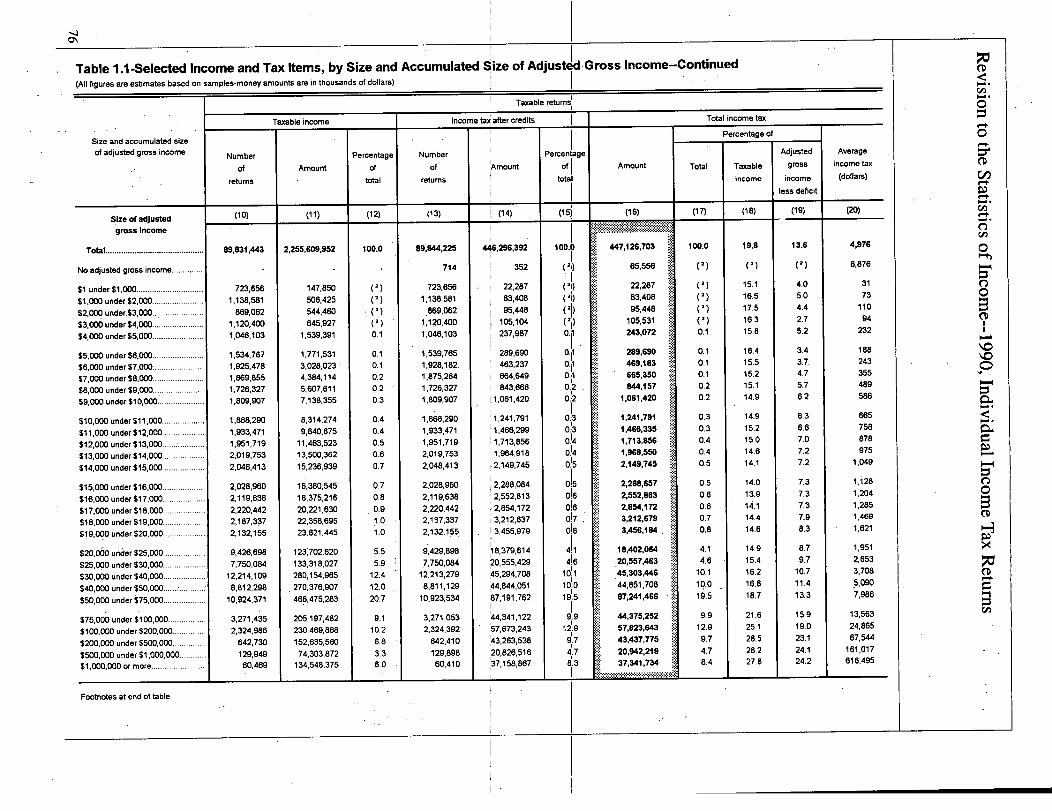
Table 1.1-Selected Income and Tax Items, by Size and Accumulated Size of AdjustIlid-Gross Income--Continued(All figures are estimates based on samples-money amounts are in thousands of dollars)
Taxable income
Size and accumulated size
of adjusted gross income Number
Of
returns
Amount
Size of adjustedgross Income
Total ............................................
No adjusted gross income ..............
$1 under $1,OD0..............................
$1,000 under $2,000.......................
$2,000 under,$3,000..,....................
$3,OD0 under $4,000.......................
$4,000 under $5,000.......................
$5,000 under $6.000.......................
$6,000 under $7,000.......................
$7,000 under $8,000 .......................
$8,000 under $9,000 .......................
$9,000 under $10,000, ....................
$10,000 under $11,000 ...................
$11,000 under $12,000 ...................
$12,000 under $13,000 ...............
$13,000 under $14,000 ...................
$14,000 under $15,000 ...................
$15,000 under $16,000 ...................
$16,000 under $17,000... ................
$17,000 under $18,000...................
$18,000 under $19,000...................
$19,000 under $20,000...................
$20,000 under $25,000. ..................
$25,000 under $30,000...................
$30,000 under $40,000 ...................
$40,000 under $50,000 ...........
$50,000 under $75,000 ...................
$75,000 under $100,000.................
$100,000 under $200,000 ...............
$200,OD0 under $500,000 ...........
$500,000 under $1,000,000 ............
$1,000,000 or more .........................
Footnotes at end of table.
(10)
89,631,443
723.6561,138,581
869,0621.120,400
1,046,103
1,534.7671.925.478
1.869,8551,726.327
1,809,907
1,868.290
1.933,4711,951,719
2,019,753
2,048,413
2,028,960
2,119,6382,220,442
2,187,337
2,132,155
9,426.698
7,750,084
12,214,109
8,812,298
10.924,371
3,271,435
2,324.986
642,730
129.94960.469
2,255,609,952
147,850
506.425
544,460
645,927
1,539.391
1,771,531
3,028,023
4,384.1145,607,611
7,138,355
8,314,274
9.640,675
11,463,523
13.500.362
15,236,939
16,380,545
18,375,216
20.221.630
22,358,69523,621,445
123"702,620
133,318,027280,154.965
270,~76.907
466.475,283
205,197,482
230,469,868
152.635,56074,303,872
134,548,375
Percentage
Of
total
(12)
11 00.0
(1)(2)
(1)
(1)0.1
0.1
0.10.2
0.2
0.3
0.4
0.4
0.50.6
0.7
0.7
U
0.91.0
1.0
5.55.9
12.4
12.0
20.7
9.110.2
6.8
3.3
6.0
Number
of
returns
(1 3)
income tax after credits
'AmountI
89,844,225
714
723.656
1,138,581869.062
1 20.400
1,046,103
1,539,7651,928,182.
1,875,2641.726,327
11,809,907
1,868,290
1.933.471
1,951,7192,019,753
2,048,413
2,028,960
2,119,638
2,220,442
2,157,337
2,132,155
9,429,898
7,750,084
12.213,279
8,811,129
10,923.534
3.271,053
2,324,392
642,410
129,89860,410
41~.6,296,392
3521
22,287
83,408
95,448
105.104
237,987
289,690
463237
664,649843,666
11,061.420111,241,791
; 1,466,299
:1.713.856
:1.964,918
12,149.745
2,288,084
12,552,813
2,854,172
3.212,63713,455,979
118,379,614
20,555,429~5,294.708
44,844,051
87,191,762
44,341,122
57,673,243
'43,263,538'20,826,516
'37,158,867
Taxable returns
Percentage
OfI
total
(15)
0.1101
0 "10.
12
0.'2
0. 3
0. 3
0.140.14
0.15
0!5
0.16
Ole017
d8
4.1
41.6
41
10.0
19'.5
9'.9
12.9
g.7
4' '78
1.3
Amount
(16)
Total income tax
Total
Percentage of
Taxable
income
(17) (1 8)
447,1 26,703
(1)
15.1
16.517.5
16.3
15.8
100.0 19.8
65,556
22.287
83,408
95,448
105,531
243,072
289,690
469,183
665,350
844,1571,061,420
11,2411,7911,466,335
1,713,656
1,968,550
2,149,745
2,288,657
2,552,863
2,854,172
3,212,679
3,456,184
18,402,064
20,557,463
45,303,"G
44,8511,70887,241,466
44,375,252
57,823.643
43,437,77520,942,219
37 11,734.. . . .....................-----------....... .........................................
(1)
(1)
(1)
(1)0.1
0.1
0.10.1
0.2
0.2
0.3
0.3
0.40.4
0.5
0.5
0.6
0.60.7
0.8
4.14.6
10.1
10.0
19.5
9.912.9
9.7
4.7
8.4
16.415.5
15.2
15.114.9
14.9
15.2
15.014.6
14.1
14.013.9
14. 1
14.4
14.6
14.9
15.4
16.2
16.618.7
21.6
25.1
28.5
28.227.8
Adjusted
gross
income
less deficit
(19)
13.6
(1)
4.0
5.0
4.4
2.7
5.2
3.4
3.7.4.7
5.7
6.2
6.36.6
7.0
7.2
7.2
7.3
7.3
7.3
7.98.3
8.7
9.710.7
11.4
13.3
15.9
19.0
23.1
24.124.2
Average
income tax
(dollars)
(20)
4,976
8.876
31
73
11094
232
188
243355
489586
665
758
878
9751,049
1J28
1,204
1,2851,469
1,621
1.951
2,653
3,708
5,090
7,986
13,563
24.86567,544
161,017616,495
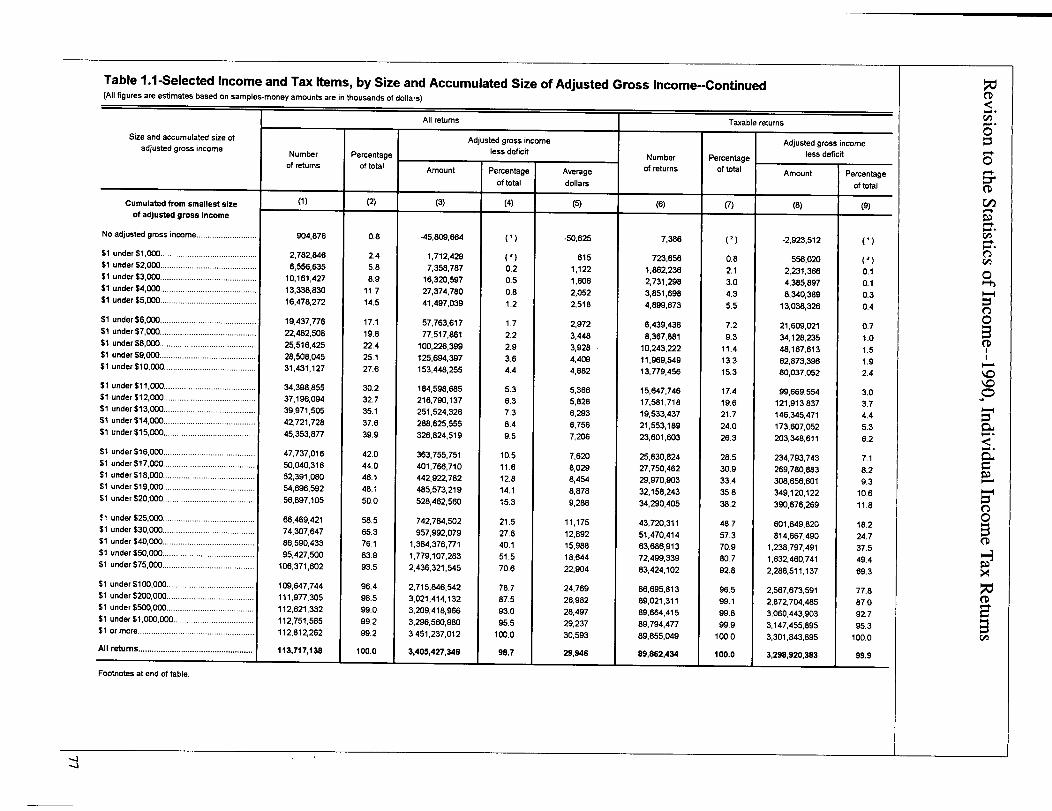
Table 1.1 -Selected Income and Tax Items, by Size and Accumulated Size of Adjusted Gross Income--Continued(All figures are estimates based on samples-money amounts are in thousands of dollars)
Size and accumulated size ofadjusted gross income
Cumulated from smallest sizeof adjusted gross Income
No adjusted gross income ...........................
$1 under $1,000...........................................
$1 under $2,000...........................................
$1 under $3,000.......... ................................
$1 under $4,000...........................................
$1 under $5,000...........................................
$1 under $6,000............ ..............................
$1 under $7,000...........................................
$1 under $8,000...........................................
$1 under $9,000...........................................
$1 under $10,000.........................................
$1 under $11,000.........................................$1 under $12,000 ........... .................. ...........
$1 under $13,000 ........... .............................
$1 under $14,000 .........................................
$1 under $15,000 .........................................
$1 under $16,000 ...................................
$1 under $17,000 ........... .............................
$1 under $18.000.........................................
$1 under $19,000 ....... .................................
$1 under $20,000....... .................... ............
$ 1 under $25,000.........................................
$1 under $30,000.........................................
$1 under $40,000.........................................
$1 under $50,000....... .................................
$1 under $75,000 .........................................
$1 under $100,000......... .............................
$1 under $200,000.......................................
$1 under $500,000.......................................
$1 under $1,000,000... .................................
$1 or more......................................... ..........
All retums ...................................................
Footnotes at end of table.
Numberof returns
(1)
904,876
2,782,8466,556,635
10,161,427
13.338,830
16,478,272
19.437,77622,482.508
25,516,425
28.508,045
31.431.127
34,398,855
37,196.094
39,971,50542,721,728
45.353,877
47,737,016
50.040,31652.391,080
54,696.592
56,897,105
66.469,42174,307.647
86,590.433
95,427,500
106,371,602
109.647,744
111,977.305
112,621,332112.751.585
112,812,262
1113,7117,1138
Percentageof total
(2)
0.8
2.4
5.8
8.9
11.714.5
17.1
19.8
22.425.1
27.6
30.232.7
35.1
37.6
39.9
42.0
44.0
46.1
48.150.0
58.5
65.3
76.183.9
93.5
96.4
98.5
99.099.2
99.2
100.0
All returns I Taxable returns
Amount
(3)
-45,809,664
1,712,4297,358,787
16,320,597
27,374.780
41,497,039
57,763.61777.517,861
100,226,399
125,694,397
153,448.255
184,598,685
216,790,137251,524,326
288.625,555
326,824,519
363,755,751
401,766,710442,922,782
485,573,219
528.462,560
742,784,502957,992,079
1,384.376,771
1,779,107,283
2,436,321.545
2,715,846,542
3,021,414.132
3,209,418,966
3,296,560,980
3,451,237,012
3,405,427,348
Adjusted gross income
less deficit
Percentageof total
(4)
(1)
(1)0.2
0.50.8
1.2
1.7
2.2
2.9
3.64.4
5.36.3
7.3
8.4
9.5
10.5
11.6
12.8
14.115.3
21.5
27.8
40.151.5
70.6
78.7
87.593.0
95.5
100.0
98.7
Average
dollars
Number Percentageof returns of tota I
(5) 1 (6) (7)
-50.625 1 7,386 (1)
615 723 5: 0.822 2:11"1 1,86
23
2.11,606 2.731,298 3.02,052 3,851,698 4.32,518 4,899,673 5.5
7:42 97: 1.4:1 38 7.23:44 8.3
.1
9.33.928 10,243,222 11.44,409 11,969,549 13.34,882 13,779,456 15.3
1:;11: 19.5
15 47 17~4
5::2 117::86,293 19.533,437 21.76,756 21.553.189 24.07,206 23,601,603 26.3
7,620 25,630.824 28.58,029 27,750,462 30.98,454 29,970,903 33.48,878 32,158,243 35.89,288 34,290,405 38.2
11:1875 43 720:431114 471:71
2 g2 51:470 53
15,988 63.686,913 70.918,644 72,499,339 80.72 83,424,102 92.8
24,769 1::0615 132,:831126,982 8 9.128.497 89,664,415 99.829,237 89,794,477 99.930,593 89,855.049 100.0
29,946 1 89,862,434 100.0
Adjusted gross
less defic
Amount
(8)
-2,923.512
556,020
2,231,3664,385,897
8,340,389
13.038,328
21,609,021
34,128.23548,167,613
62,873,396
80,037,052
99.669,554
121.913,837
146,345.471
173,607,052203.348,611
234,793,743
269,780,863
308,656,601349.120,122
390,676,269
601,849,820
814.667,4901,238,797,491
1,632,460,741
2,288,511,137
2.567,673,591
2,872,704.4853,060,443,903
3.147.455,895
3,301,843,895
3,298,920,383
incomeit
Percentage
of total
(9)
(1)
(1)0.1
0.1
0.3
0.4
0.7
1.0
1.5
1.92.4
3.03.7
4.4
5.3
6.2
7.18.2
9.3
10.6
11.8
18.2
24.7
37.5
49.469.3
77.8
87.0
92.7
95.3100.0
99.9
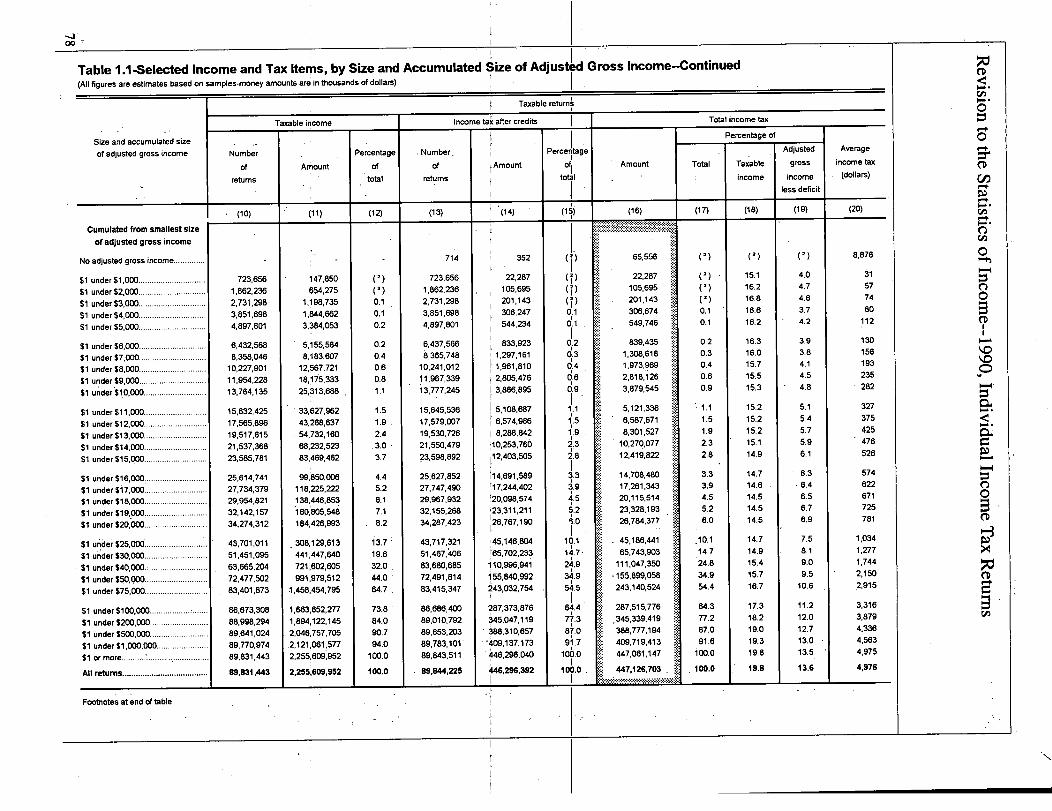
_J00
I
Table 1.1 -Selected Income and Tax Items, by Size and Accumulated Size of Adjusted Gross Income-Continued(All figures are estimates based on samples-money amounts are in thousands of dollars)
Taxable return IsI
Size and accumulated size
of adjusted gross income
Cumulated from smallest size
of adjusted gross income
No adjusted gross income ..............
$1 under $1,000 ..............................
$1 under $2,000..............................
$1 under $3,000..............................
$1 under $4,000..............................
$1 under $5,000..............................
$1 under $6,000..............................
$1 under $7,000........... ..................
$ 1 under $8,000..............................
$ 1 under $9,000........... ..................
$1 under $10,000............................
$1 under $11.000 ..................
$ 1 under $12,000............................
$1 under $13,000............................
$1 under $14,DOO............................
$1 under $15,000............................
$1 under $16,ODO, ...........................
$1 under $17,000 ..................
$1 under $18,000 ..................
$1 under $19,000............................
$1 under $20,000......................... ..
$1 ulldei $25,006 ...........................
$1 under $30,000............................
$1 under $40,000............................
$1 under $50,000............................
$ 1 under $75,000 ............................
$1 under $100.000..................
$1 under $200,000 ....... I..................
$1 under $500,000 ..........................
$1 under $1,000,000 .......................
$1 or more.........................................
All returris ......................................
Number
Of
returns
(10)
723.656
1,862,2362,731,298
3,851.698
4,897,801
6,432,5688,358,046
10.227,90111.954,228
13,764.135
15,632,425
17.565,896
19,517.615
21,537,368
23.585,781
25,614,741
27,734,37929,954,821
32.142,157
34,274,312
43,701,011
51,451,095
63.665,204
72.477,502
83,401,873
86,673.30888.998,294
89,641.024
89,770.974
89,831.443
89.0
Taxable income
Percentage
Amount Of
total
(11) (12)
147,850 (1)654,275 (1)
1,198.735 0.1
1,844,662 0.13,384,053 0.2
5,155,584 0.2
8,183,607 0.4
12,567,721 0.6
18,175,333 0.8
25,~l 3,688 1.1
33.627.962 1.5
43.268,637 1.9
54,732,160 2.4
68,232,523 .3.0
83.469.462 3.7
99,850,0()6 4.4
118.225.222 5.2
138.446.853 6.1
160,805,548 7.1
1184.4126,993 8.2
308.129,613 3.7
441,447.640 19.6
721,602,605 32.0
991,979,512 44.0
1,458,454,795 64.7
1.663,652,277 73.8
1,894,122.145 84.0
2,046:757,705 90.7
2,121,061,577 94.0
2,255,609.952 100.0
2,255:609,952 100.0
Income ta~ after credits
Number,
Of
returns
(13)
714
723,656
1,862.2362,731,298
3,851,698
4,897,801
6,437,566
6,365,748
10,241,012
11,967,33913,777,245
15.645
'
536
117.5791007
19,530,726
21,550.47923,598,892
25,627,852
27.747,49029,967,932
32,155,268
34.287.423
43,717,321
51,467,406
63.680,685
72.491,814
83,415,347
86.686,40089,010,792
89,653,203
89.783,101
89.843,511
89,844,225
'(1 4)
3521 .
22,287
1 105,695
1201,143
1 306,247544,234
833.923
1,297,1611,981,810
2,805,476
3,866,895
5,108.6876.574.986
8,288,842
10,253.76b
12.403.505
~14,691,589'11 7,244.402
f20,098,574
i23,311,211:26.767.190
:45,146,804
;65,702,233
110.996,94155,840,992
~43,032.7541
287.373,876
i45,047,119
i88,310.657'409.137,173
446,296,040
446,296,392
PerceriItage
ofI
tot~l
0.1
0.1
01.2
0. 3
0.4
0'.60.9
1'. 1
1'.5
11.9
2.3
2.8
3.3
i.g
~.s5.2
9.0
101114.7
24.9
34.9
54.5
1
67-77.3
87.0
91.7
100.0
100.0
Amount
(16)
Total income tax
Total
Percentage of
(17)
Taxable
income
(18)
ij~iiHi
65,556
22,287
105,695
201,143
306.674
549,746
839,435
1,308,618
1,973,9692,818,126
3.879,545
5,121,336
6,587,671
8,301,52710,270,077
12.419.822
14,708,48017,261,343
20,115,514
23,328,193
26,784,377
0.20.3
0.4
0.6
0.9
1.1
1.5
1.9
2.3
2.8
3.3
3.9
4.55.2
6.0
(1)
15.1
16.216.8
16.6
16.2
16.3
16.0
15.715.5
15.3
15.2
15.2
15.2
15.114.9
14.7
14.614.5
14.5
14.5
45, 186,441
65.743,903
111,047.350
.155,899,058243,140,524
345,339,419
388.777.194
409,719,413447,061,147
447,1126.703
10.1
14.724.8
34.9
54.4
64.3
77.287.0
91.6
100.0
100.0
14.7
14.9
15.4
15.7
16.7
17.3
18.2
19.0
19.3
19.8
19.8
Adjusted
gross
income
less deficit
(19)
(1)
4.04.7
4.6
3.7
4.2
3.9
3.84.1
4.5
4.8
5.1
5.45.7
5.9
6.1
6.3-6.4
6.56.7
6.9
7.5
8.1
9.09.5
10.6
11.2
12.0
12.713.0
13.5
13.6
Average
income tax
(dollars)
(20)
8,876
31
57
7480
112
130156
193
235
282
327
375
425
476
526
574
622
671725
781
1,0341.277
1.744
2,150
3,316
3.8794,336
4.563
4,975
4,976
Footnotes at end of table.
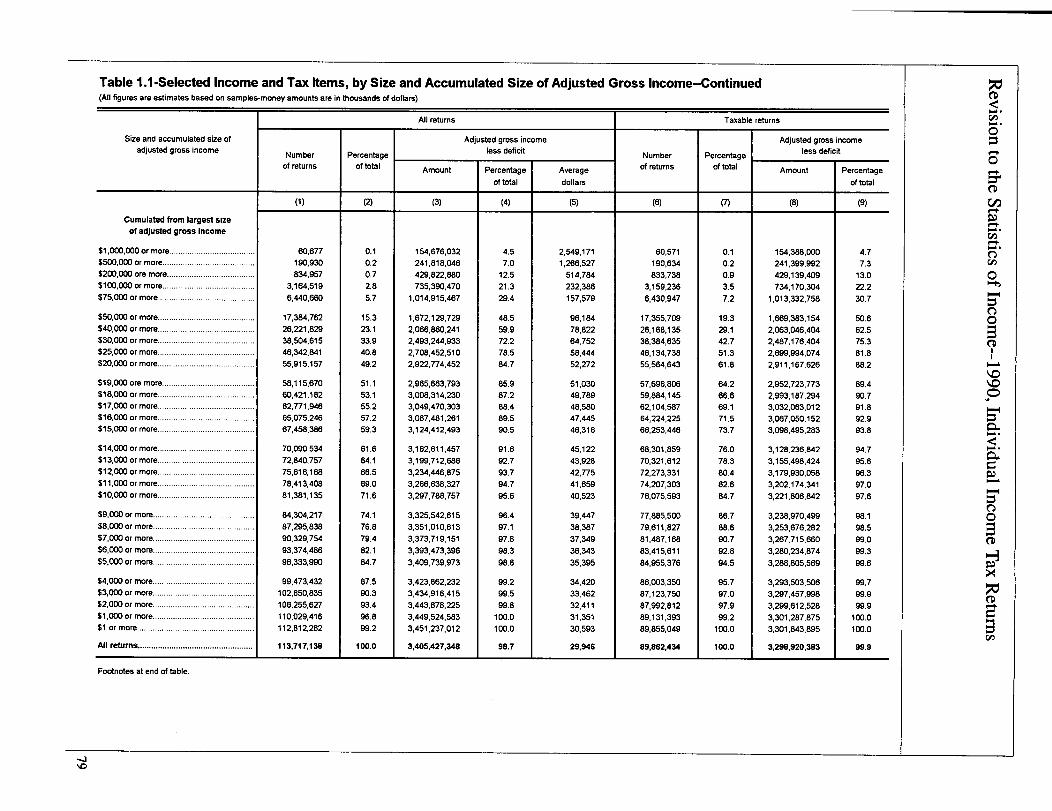
Table 1.1 -Selected Income and Tax Items, by Size and Accumulated Size of Adjusted Gross Income-Continued(All figures are estimates based on samples-money amounts are in thousands of dollars)
Size and accumulated size ofadjusted gross income
Cumulated from largest sizeof adjusted gross income
$1,000,000 or more... ...................................
$500,000 or more .........................................
$200,000 ore more.......................................
$100,000 or more ......... ........................
$75,000 or more ........................... ...............
$50,000 or more ...........................................
$40,000 or more ...........................................
$30,000 or more ...........................................
$25,000 or more ...........................................
$20,000 or more ...........................................
$19,000 ore more ............................ ............
$18,000 or more ...........................................
$17,000 or more... ........................................
$16,000 or more ...........................................
$15,000 or more...........................................
$14,000 or more...........................................
$13,000 or more.......................... ................
$12,000 or more...........................................
$11,000 or more.. ............... .........................
$10,000 or more...........................................
$9,000 or more .......................... . .... ......
$8,000 or more ................................ . ..........
$7,000 or more ..................................... .......
$6,000 or more .............................................
$5,000 or more .............................................
$4,000 or more .............................................
$3,000 or more .............................................
$2,000 or more .............................................
$1,000 or more .............................................
$1 or more ....................................................
All returns...................................................
Number
of returns
(1)
60,677190,930
834.957
3,164,519
6.440.660
17,384,762
26.221.829
38,504,615
46,342,84155,915,157
58,115,670
60,421,18262,771,946
65,075,246
67,458,386
70,090,534
72,840,757
75,616,16878,413,408
81,381,135
84,304,217
87.295.838
90.329.754
93.374.486
96.333,990
99,473,432
102,650,835
106,255,627
110,029,416112,812,262
113,717,138
Percentageof total
(2)
0.10.2
0.7
2.8
5.7
15.323.1
33.9
40.8
49.2
51.1
53.1
55.257.2
59.3
61.6
64.1
66.5
69.071.6
74.1
76.8
79.4
82.1
84.7
87.5
90.3
93.4
96.899.2
100.0
All returns
Amount
(3)
154,676.032
241,818.046
429,822,880735,390,470
1.014,915,467
1,672,129,729
2,066,860,2412,493,244,933
2,708,452,510
2,922.774,452
2,965.663.793
3,008.314.230
3,049,470,3033,087.481,261
3,124.412,493
3,162,611,4573,199,712,686
3,234.446,875
3,266,638,327
3.297,788,757
3,325,542,615
3,351,010,613
3.373,719,151
3.393,473,396
3,409,739,973
3.423,862,232
3,434,916,415
3,443,878.225
3,449,524.5833.451,237,012
3,405,427,348
Adjusted gross incomeless deficit
Percentage
of total
(4)
4.5
7.0
12.521.3
29.4
48.5
59.972.2
78.5
84.7
85.9
87.2
88.4
89.590.5
91.692.7
93.7
94.7
95.6
96.4
97.1
97.8
98.3
98.8
99.299.5
99.8
100.0
100.0
98.7
Average
dollars
(5)
2,549,171
1,266,527
514,784232,386
157.579
96,184
78,82264,752
58,444
52,272
51,03049,789
48,580
47,44546,316
45,12243,928
42,775
41,659
40,523
39,447
38,387
37,349
36,343
35,395
34,42033,462
32,411
31,351
30,593
29,946
Numberof returns
(6)
60,571
190,634
833,7383,159,236
6.430,947
17,355,709
26.168,135
38.384,63546,134,738
55.564,643
57.696,80659,884,145
62,104,587
64,224,22566,253,446
68,301,859
70.321,61272,273,331
74.207,303
76,075,593
77,885,50079,611,827
81.487,168
83.415,611
84,955,376
86.003,350
87,123,75087,992,812
89.131,393
89,855,049
89,862,434
Taxable returns
PercentageOf total
Adjusted grossless defic
Amount
(7)
0.1
0.2
0.93.5
7.2
19.3
29.1
42.751.3
61.8
64.2
66.669.1
71.573.7
76.0
78.380.4
82.6
84.7
86.7
88.690.7
92.8
94.5
95.7
97.097.9
99.2
100.0
100.0
(8)
154.388,000
241.399,992
429,139,409734,170,304
1.013.332,758
1,669,383,154
2,063,046,404
2,487,176,4042,699.994,074
2,911.167,626
2,952.723,7732,993,187,294
3,032,063,012
3,067,050,1523,098,495,283
3.128,236,842
3.155.498,424
3,179,930,0583.202,174,341
3.221,806.842
3.238,970,499
3.253,676.2823.267.715,660
3,280.234,874
3,288,805,569
3,293,503,506
3.297,457,9983.299.612.528
3,301,287,875
3,301,843,895
3,298,920,383
ncome
t
Percentage
Of total
(9)
4.7
7.3
13.0
22.2
30.7
50.6
62.5
75.381.8
88.2
89.490.7
91.8
92.993.8
94.7
95.6
96.397.0
97.6
98.1
98.5
99.099.3
99.6
99.7
99.9
99.9100.0
100.0
99.9
Footnotes at end of table.
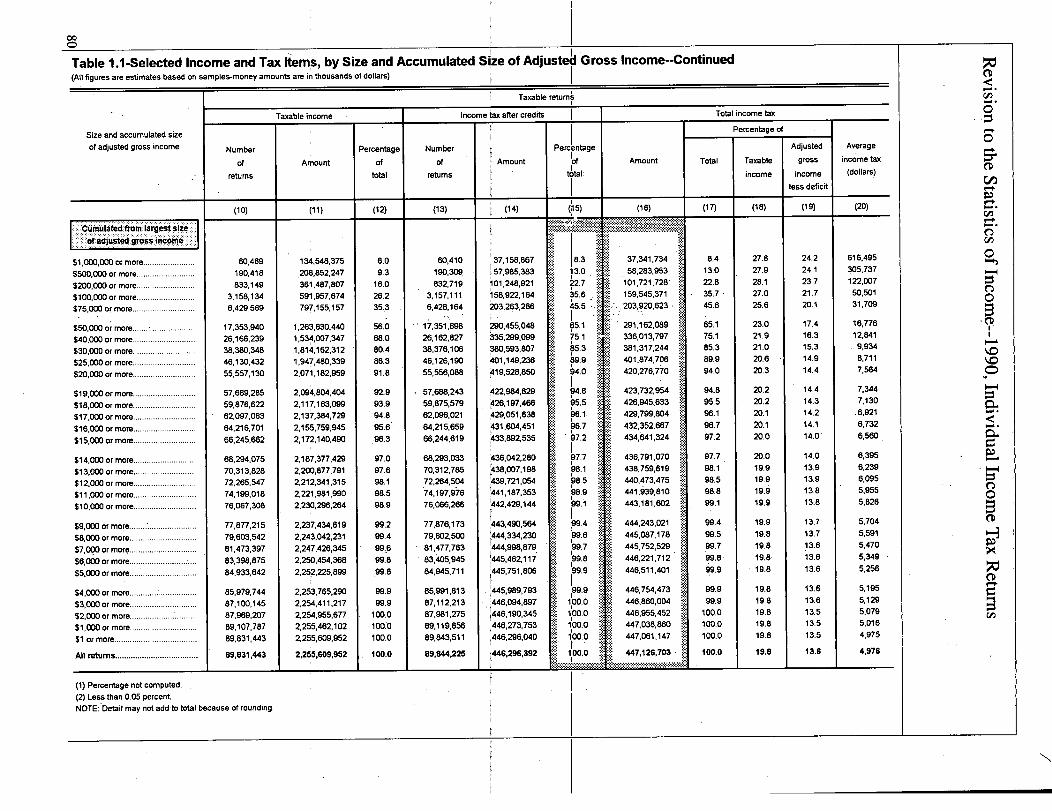
00C>
Table 1.1 -Selected Income and Tax Item by Size and Accumulated M e of Adjusted G ross Income--ContinuedI!z(All figures are estimates based on samples-money amounts are in thousands of dollars)
Taxable income
Size and accumulated size
of adjusted gross income Number
Of
returns
Amount
Cumulated from largest size
of adjusted gross income
V.000,000 or more ......................
$500.000 or more .....................
$200,000 or more.........................
$100,000 or more..........................
..........................$75,000 or more..
$50,000 or more ....................
$40,000 or more ............................
$30,000 or more ............................
$25,000 or more ............................
$20,000 or more ............................
$19,000 or more ............................
$16,000 or more ............................
$17,000 or more ............................
$16,000 or more........... ................
$15,000 or more............................
$14,000 or more............................
$13,000 or more............................
$12,000 or more............................
$11,000 or more............................
$10,000 or more ............................
$9,000 or more .... .....................
$8,000 or more..............................
$7,000 or more..............................
$6,000 or more..............................
$5,000 or more..............................
$4,000 or more... .................
$3,000 or more..............................
$2,000 or more................... .........
$1,000 or more..............................
$1 or more .....................................
All returns.....................................
(10)
60,469
190,418
833,149
3,158,1346,429,569
17,353,940
26,166,23938,380,348
46,130,432
55,557.130
57,689,285
59.876,622
62,097,06364,216,701
66,245,662
68,294,075
70,313.828
72,265,54774.199,018
76,067,308
77,877.215
79.603,54281,473,397
83.398,875
84.933.642
85,979,744
87,100,14587,969,207
89,107,787
89,831.443
89,8311,443
134,548,375
208,852,247
361,487,807
591,957,674797,155.157
1,263,630,4401,534.007,347
1.814.162,312
1,947,480,3392,071.182,959
2.094.804,404
2.117.163,0992,13~,384,729
2,155,759,945
2,172,140.490
2,187,377,429
2,200.877,7912,212.341.315
2,221,981.990
2,230,296,264
2.237,434,6192,243,042,231
2,247,426,345
2,250,454,368
2,252,225,899
2,253,765,2902,254,411,217
2,254.955,677
2.255,462,102
2,255,609.952
2,255,609,952
Percentage
Of
total
(12)
6.0
9.316.0
26.2
35.3
56.0
68.0
80.486.3
91.8
92.993.9
94.8
95.6
.96.3
97.097.6
98.1
98.5
98.9
99.2
99.4
99:6
99. 8
.99.8
99.999.9
100.0
100.0
100.0
100.0
Taxable retums'
Number
Of
returns
Income iax after credits
Amount
(13) 1 (14)
60,410 37,158,867
190,309 1 57,985.383
832.719 ~01,248,921
3.157.111 158,922,164
6,428,164 k3,263,286
17.351,698 290.455.048
~35,299,09926.162.82738,376,106 360,593,807
46,126,190 ~01,149,236
55.556,088 ~119,528,&90
57,688,243 ~22,984,829
59,875,579 026,197.466
62,096.021 .429.051,638
64.215.659 ~131,604,451
66,244,619 ~133,892,535
68.293,033 436.042,280
70.312,785 438,007,198
72,264,504 439,721.05474,197,06 "441.187,353
76.066,266 '442.429,144
77,876,173 443,490,564
79,SD2.500 '444.334,230
81.477.7631444,998,879
83,405,945 445,462,117
84,945,711 445,751,806
85,991.813 ~445,989,793
87.112.213 ~446,094,8971
87,981,275 446,190.345
89,119,856 4,46,273,753
89.843.511 446,296,040
446,296,39289,844,225
Perc
I
bntage
of
total!
(15)
Amount
(16)
3
'
. 1111
2.75.6
5.5
5.1 jij~
5.1
5.3
9.9KO
94.8
95.5196.1
66.7
67.2
7.78.1
8.5
8.99.1
99.4
99*6
99.7
99.8
99.9
34.1:734
:.:2 953
101,721,728'
159.545.371
203.920.623
291,1162,089
336.013,797381.317,244
401,874,706
420,276,770
423,732,954
426,945,633
429,799.804
432,352,667
434,"641,324
436,791.070
438.759,619
440,473,475441,939,810
443.181,602
444,243.021
445,087.178
445.752,529
446,221,712
446.511,401
99.9 446,754,473
00.0 446,860,0041100.0 446,955,452
100.0 ~jijijij 447,038.860
100.0 447,061,147
126703iii 44711 000 ii ,f
Total income tax
Percentage of
Total Taxable
income
(17)
8.4
13.0
22.8
35.7 -45.6
65.175.1
85.3
89.9
94.0
94.8
95.5
96.196.7
97.2
97.7
98.1
98.598.8
99.1
99.4
99.599.7
99.8
9.9.9
99.9
99.9100.0
100.0
100.0
100.0
(18)
27.8
27.9
28.127.0
25.6
23.0
21.9
21.0
20.620.3
20.2
20.220.1
20.1
20.0
20.0
19.919.9
19.9
19.9
19.919.8
19.8
19.8
19.8
19.8
19.819.8
19.8
19.8
19.8
Adjusted
g ross
income
less deficit
(19)
24.2
24.123.7
21.7
20.1
17.4
16.3
15.314.9
14.4
14.414.3
14.2
14.1
14.0'
14.0
13.9
13.9
13.813.8
13.7
'13.7
13.6
13.6
13.6
13.6
13.6
13.5
13.513.5
13.6
Average
income tax
(dollars)
(20)
616,495305,737
122,007
50.501
31,709
16.776
12,8419,934
8,711
7.564
7.344
7.130
.6.921
6,7326.560
6,395
6,239
6.0955,955
5,826
5,704
5,591
5,4705,349
5,256
5,195
5.1295,079
5,016
4.975
41976
(i) Percentage not computed.
(2) Less than 0.05 percent.NOTE: Detail may not add to total because of rounding.


![Volunteer Income Tax Assistance “VITA” Earned Income Tax ... · Volunteer Income Tax Assistance “VITA” Earned Income Tax Credit “EITC” Revised 1/28/19 [DOCUMENT TITLE]](https://img.pdfslide.us/doc/110x75/5fa5a5c85aa0bb13122ce462/volunteer-income-tax-assistance-aoevitaa-earned-income-tax-volunteer-income.jpg)