Embed Size (px)
Citation preview
INDICES DASHBOARD
January 2015 Aureliano Gentilini Head of Research
“The beginning is the most important part of the work." – Plato (428/427 or 424/423 BC-348/347 BC)
INDICES DASHBOARD
JANUARY 2015
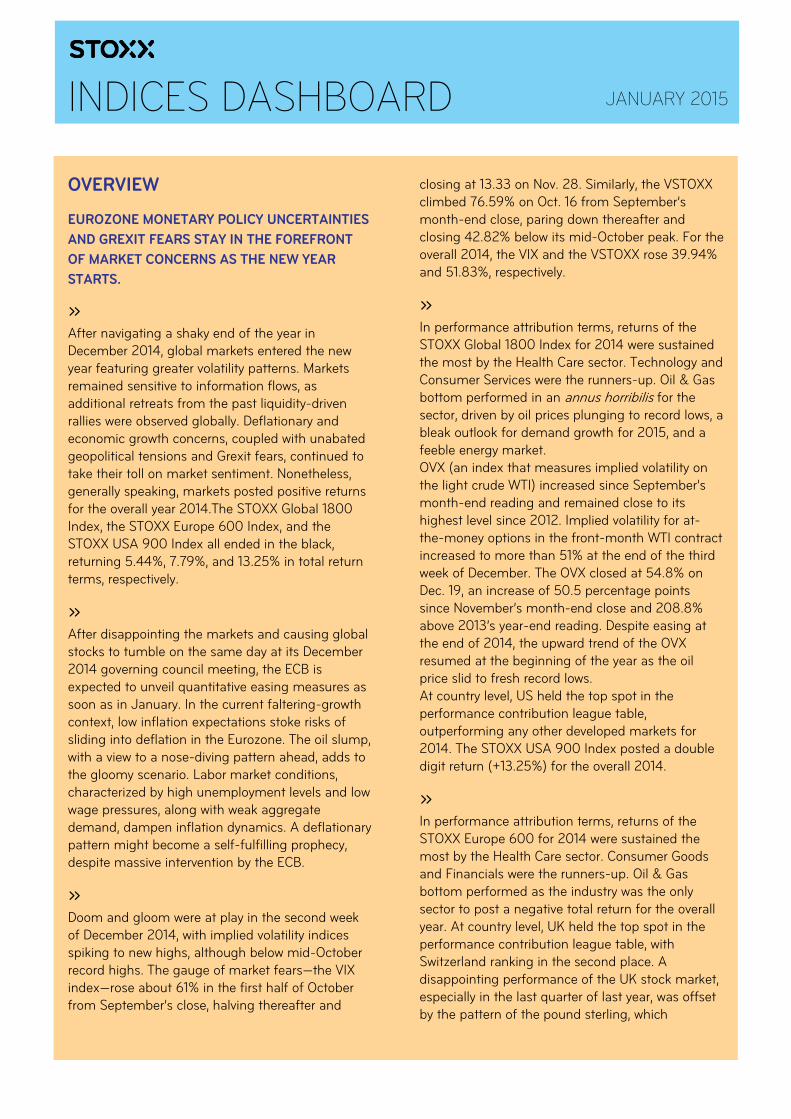
OVERVIEW
EUROZONE MONETARY POLICY UNCERTAINTIES
AND GREXIT FEARS STAY IN THE FOREFRONT
OF MARKET CONCERNS AS THE NEW YEAR
STARTS.
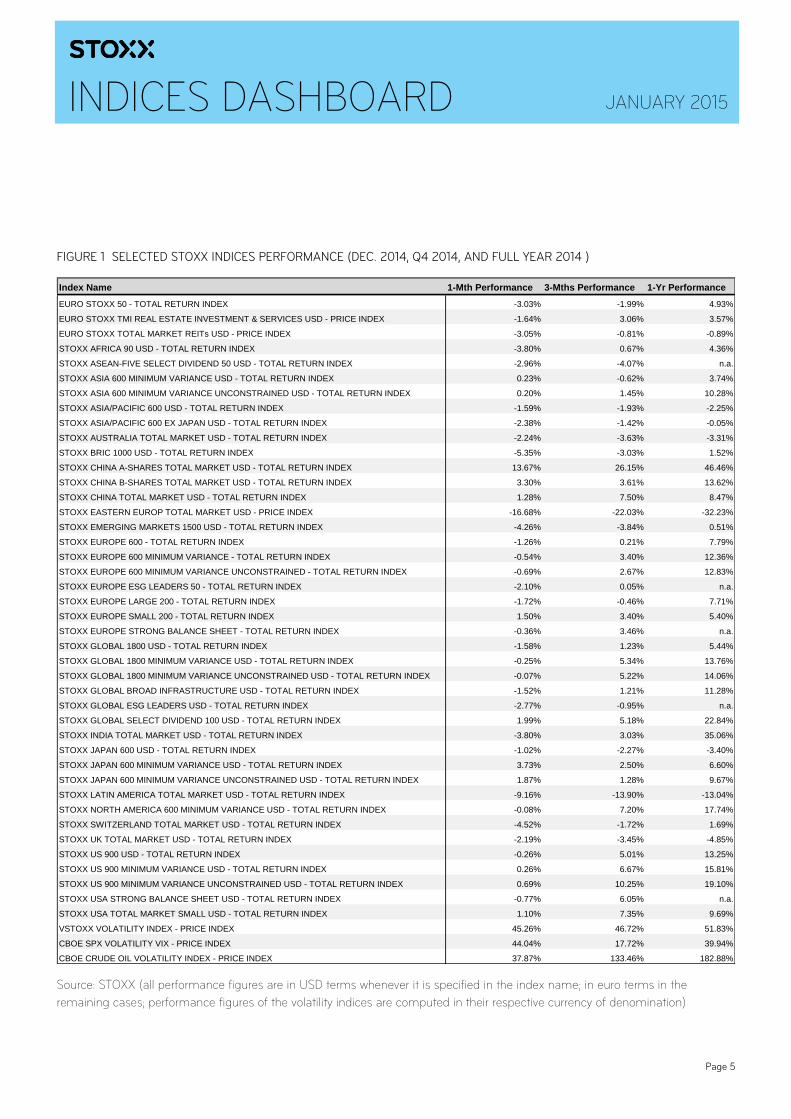
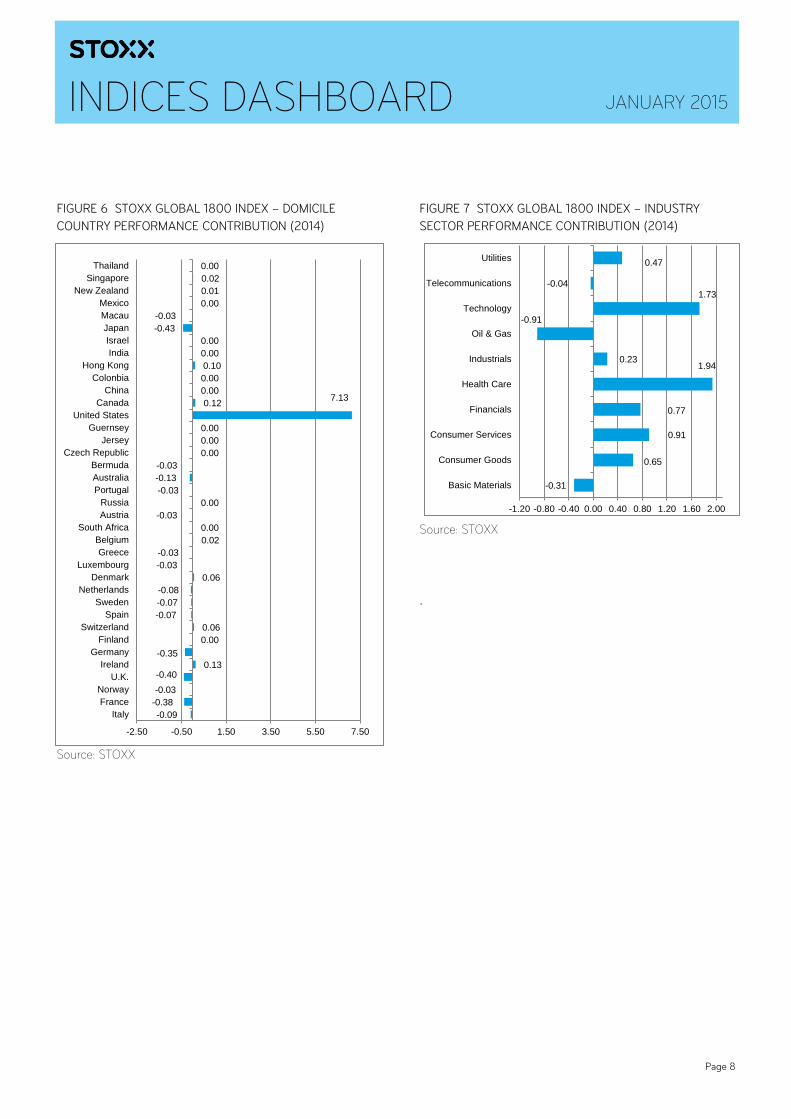
» After navigating a shaky end of the year in December 2014, global markets entered the new year featuring greater volatility patterns. Markets remained sensitive to information flows, as additional retreats from the past liquidity-driven rallies were observed globally. Deflationary and economic growth concerns, coupled with unabated geopolitical tensions and Grexit fears, continued to take their toll on market sentiment. Nonetheless, generally speaking, markets posted positive returns for the overall year 2014.The STOXX Global 1800 Index, the STOXX Europe 600 Index, and the STOXX USA 900 Index all ended in the black, returning 5.44%, 7.79%, and 13.25% in total return terms, respectively. » After disappointing the markets and causing global stocks to tumble on the same day at its December 2014 governing council meeting, the ECB is expected to unveil quantitative easing measures as soon as in January. In the current faltering-growth context, low inflation expectations stoke risks of sliding into deflation in the Eurozone. The oil slump, with a view to a nose-diving pattern ahead, adds to the gloomy scenario. Labor market conditions, characterized by high unemployment levels and low wage pressures, along with weak aggregate demand, dampen inflation dynamics. A deflationary pattern might become a self-fulfilling prophecy, despite massive intervention by the ECB. » Doom and gloom were at play in the second week of December 2014, with implied volatility indices spiking to new highs, although below mid-October record highs. The gauge of market fears—the VIX index—rose about 61% in the first half of October from September’s close, halving thereafter and
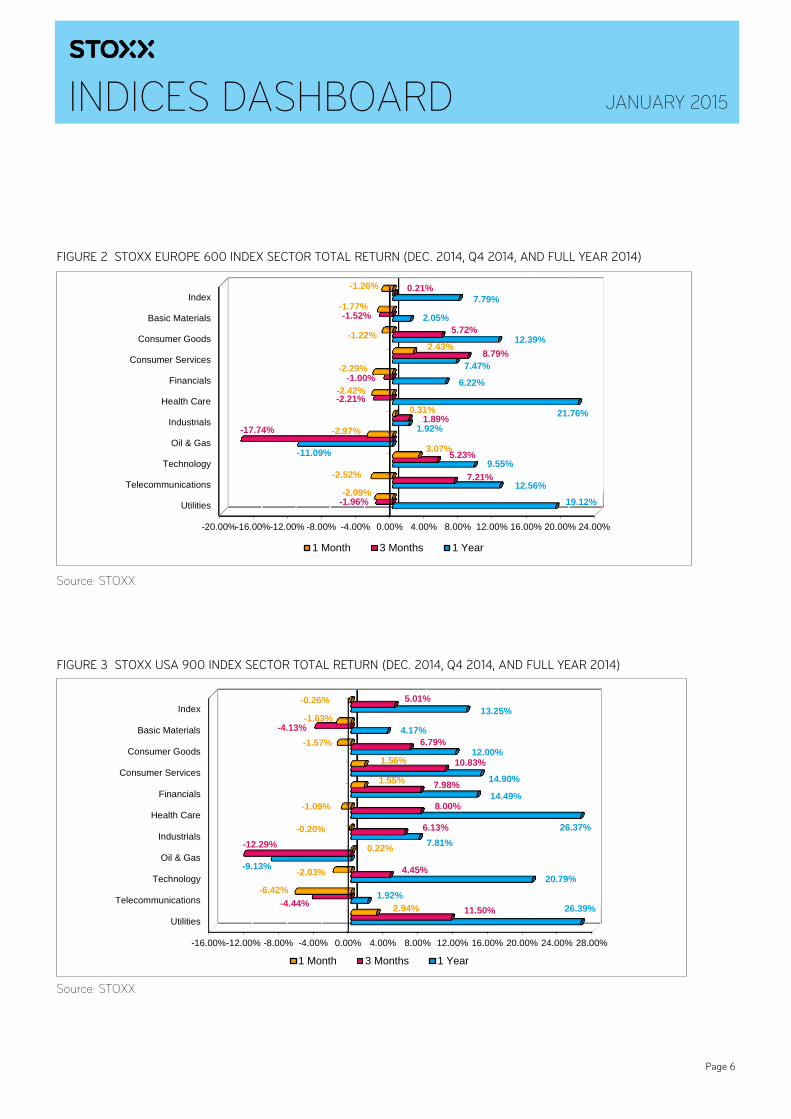
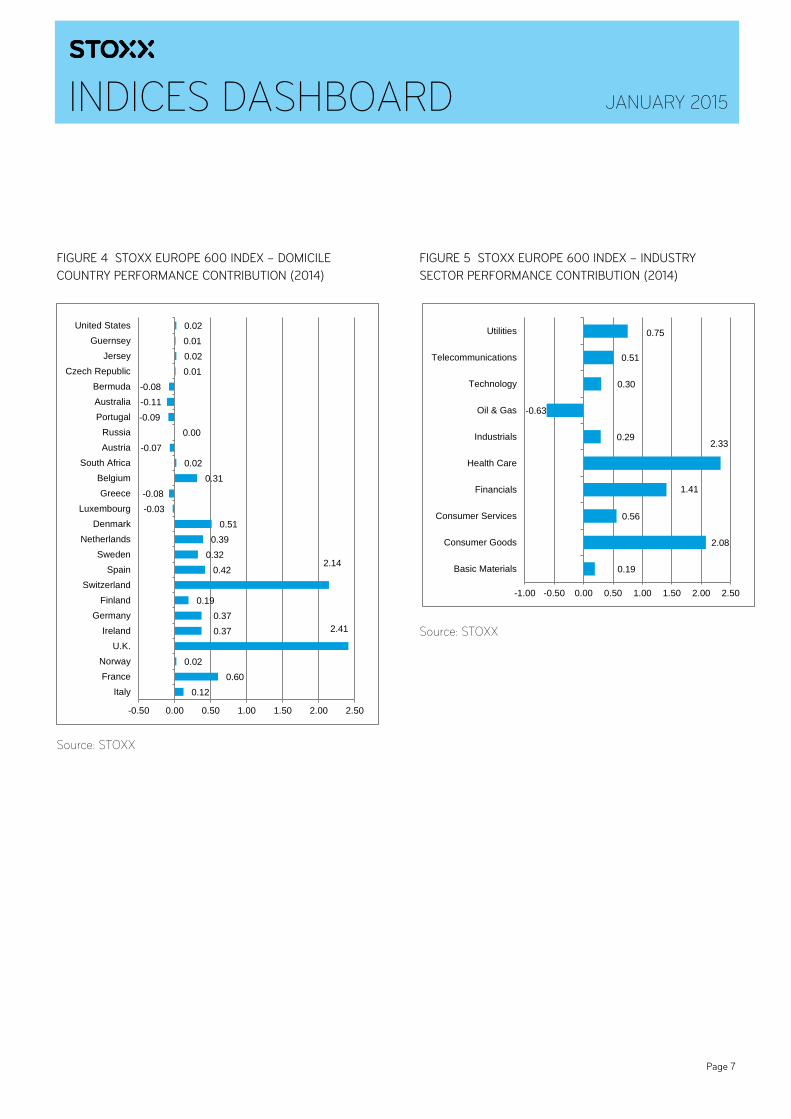
closing at 13.33 on Nov. 28. Similarly, the VSTOXX climbed 76.59% on Oct. 16 from September’s month-end close, paring down thereafter and closing 42.82% below its mid-October peak. For the overall 2014, the VIX and the VSTOXX rose 39.94% and 51.83%, respectively. » In performance attribution terms, returns of the STOXX Global 1800 Index for 2014 were sustained the most by the Health Care sector. Technology and Consumer Services were the runners-up. Oil & Gas bottom performed in an annus horribilis for the sector, driven by oil prices plunging to record lows, a bleak outlook for demand growth for 2015, and a feeble energy market. OVX (an index that measures implied volatility on the light crude WTI) increased since September’s month-end reading and remained close to its highest level since 2012. Implied volatility for at-the-money options in the front-month WTI contract increased to more than 51% at the end of the third week of December. The OVX closed at 54.8% on Dec. 19, an increase of 50.5 percentage points since November’s month-end close and 208.8% above 2013’s year-end reading. Despite easing at the end of 2014, the upward trend of the OVX resumed at the beginning of the year as the oil price slid to fresh record lows. At country level, US held the top spot in the performance contribution league table, outperforming any other developed markets for 2014. The STOXX USA 900 Index posted a double digit return (+13.25%) for the overall 2014. » In performance attribution terms, returns of the STOXX Europe 600 for 2014 were sustained the most by the Health Care sector. Consumer Goods and Financials were the runners-up. Oil & Gas bottom performed as the industry was the only sector to post a negative total return for the overall year. At country level, UK held the top spot in the performance contribution league table, with Switzerland ranking in the second place. A disappointing performance of the UK stock market, especially in the last quarter of last year, was offset by the pattern of the pound sterling, which
INDICES DASHBOARD
JANUARY 2015
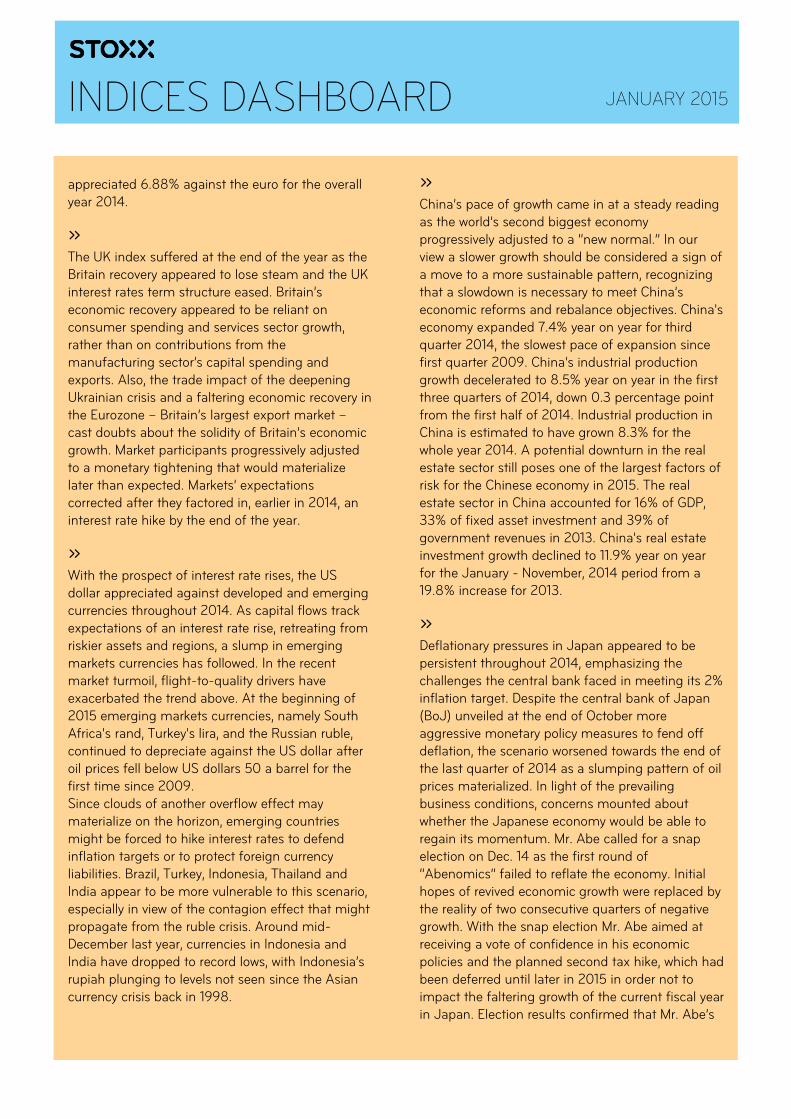
appreciated 6.88% against the euro for the overall year 2014. » The UK index suffered at the end of the year as the Britain recovery appeared to lose steam and the UK interest rates term structure eased. Britain’s economic recovery appeared to be reliant on consumer spending and services sector growth, rather than on contributions from the manufacturing sector’s capital spending and exports. Also, the trade impact of the deepening Ukrainian crisis and a faltering economic recovery in the Eurozone – Britain’s largest export market – cast doubts about the solidity of Britain’s economic growth. Market participants progressively adjusted to a monetary tightening that would materialize later than expected. Markets’ expectations corrected after they factored in, earlier in 2014, an interest rate hike by the end of the year. » With the prospect of interest rate rises, the US dollar appreciated against developed and emerging currencies throughout 2014. As capital flows track expectations of an interest rate rise, retreating from riskier assets and regions, a slump in emerging markets currencies has followed. In the recent market turmoil, flight-to-quality drivers have exacerbated the trend above. At the beginning of 2015 emerging markets currencies, namely South Africa's rand, Turkey's lira, and the Russian ruble, continued to depreciate against the US dollar after oil prices fell below US dollars 50 a barrel for the first time since 2009. Since clouds of another overflow effect may materialize on the horizon, emerging countries might be forced to hike interest rates to defend inflation targets or to protect foreign currency liabilities. Brazil, Turkey, Indonesia, Thailand and India appear to be more vulnerable to this scenario, especially in view of the contagion effect that might propagate from the ruble crisis. Around mid-December last year, currencies in Indonesia and India have dropped to record lows, with Indonesia’s rupiah plunging to levels not seen since the Asian currency crisis back in 1998.
» China’s pace of growth came in at a steady reading as the world’s second biggest economy progressively adjusted to a “new normal.” In our view a slower growth should be considered a sign of a move to a more sustainable pattern, recognizing that a slowdown is necessary to meet China’s economic reforms and rebalance objectives. China's economy expanded 7.4% year on year for third quarter 2014, the slowest pace of expansion since first quarter 2009. China's industrial production growth decelerated to 8.5% year on year in the first three quarters of 2014, down 0.3 percentage point from the first half of 2014. Industrial production in China is estimated to have grown 8.3% for the whole year 2014. A potential downturn in the real estate sector still poses one of the largest factors of risk for the Chinese economy in 2015. The real estate sector in China accounted for 16% of GDP, 33% of fixed asset investment and 39% of government revenues in 2013. China's real estate investment growth declined to 11.9% year on year for the January - November, 2014 period from a 19.8% increase for 2013. » Deflationary pressures in Japan appeared to be persistent throughout 2014, emphasizing the challenges the central bank faced in meeting its 2% inflation target. Despite the central bank of Japan (BoJ) unveiled at the end of October more aggressive monetary policy measures to fend off deflation, the scenario worsened towards the end of the last quarter of 2014 as a slumping pattern of oil prices materialized. In light of the prevailing business conditions, concerns mounted about whether the Japanese economy would be able to regain its momentum. Mr. Abe called for a snap election on Dec. 14 as the first round of “Abenomics” failed to reflate the economy. Initial hopes of revived economic growth were replaced by the reality of two consecutive quarters of negative growth. With the snap election Mr. Abe aimed at receiving a vote of confidence in his economic policies and the planned second tax hike, which had been deferred until later in 2015 in order not to impact the faltering growth of the current fiscal year in Japan. Election results confirmed that Mr. Abe’s
INDICES DASHBOARD
JANUARY 2015
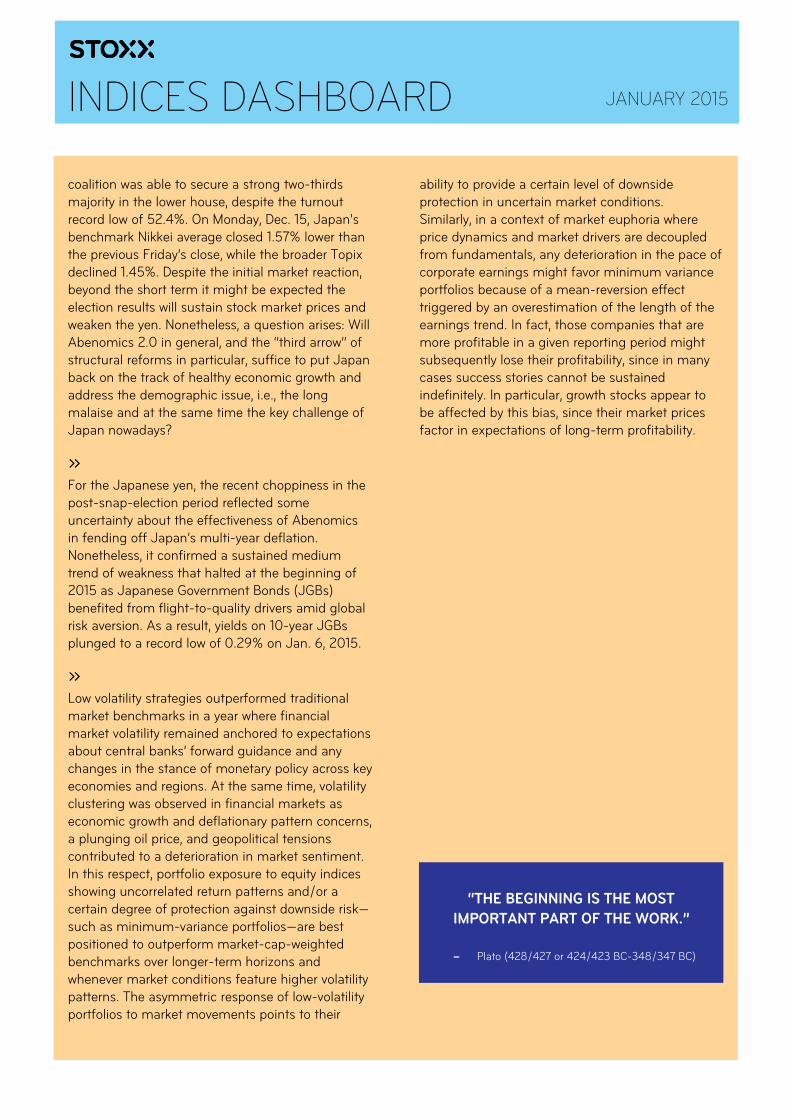
coalition was able to secure a strong two-thirds majority in the lower house, despite the turnout record low of 52.4%. On Monday, Dec. 15, Japan's benchmark Nikkei average closed 1.57% lower than the previous Friday’s close, while the broader Topix declined 1.45%. Despite the initial market reaction, beyond the short term it might be expected the election results will sustain stock market prices and weaken the yen. Nonetheless, a question arises: Will Abenomics 2.0 in general, and the “third arrow” of structural reforms in particular, suffice to put Japan back on the track of healthy economic growth and address the demographic issue, i.e., the long malaise and at the same time the key challenge of Japan nowadays? » For the Japanese yen, the recent choppiness in the post-snap-election period reflected some uncertainty about the effectiveness of Abenomics in fending off Japan’s multi-year deflation. Nonetheless, it confirmed a sustained medium trend of weakness that halted at the beginning of 2015 as Japanese Government Bonds (JGBs) benefited from flight-to-quality drivers amid global risk aversion. As a result, yields on 10-year JGBs plunged to a record low of 0.29% on Jan. 6, 2015. » Low volatility strategies outperformed traditional market benchmarks in a year where financial market volatility remained anchored to expectations about central banks’ forward guidance and any changes in the stance of monetary policy across key economies and regions. At the same time, volatility clustering was observed in financial markets as economic growth and deflationary pattern concerns, a plunging oil price, and geopolitical tensions contributed to a deterioration in market sentiment. In this respect, portfolio exposure to equity indices showing uncorrelated return patterns and/or a certain degree of protection against downside risk—such as minimum-variance portfolios—are best positioned to outperform market-cap-weighted benchmarks over longer-term horizons and whenever market conditions feature higher volatility patterns. The asymmetric response of low-volatility portfolios to market movements points to their
ability to provide a certain level of downside protection in uncertain market conditions. Similarly, in a context of market euphoria where price dynamics and market drivers are decoupled from fundamentals, any deterioration in the pace of corporate earnings might favor minimum variance portfolios because of a mean-reversion effect triggered by an overestimation of the length of the earnings trend. In fact, those companies that are more profitable in a given reporting period might subsequently lose their profitability, since in many cases success stories cannot be sustained indefinitely. In particular, growth stocks appear to be affected by this bias, since their market prices factor in expectations of long-term profitability.
“THE BEGINNING IS THE MOST
IMPORTANT PART OF THE WORK.”
– Plato (428/427 or 424/423 BC-348/347 BC)
INDICES DASHBOARD
Page 5
JANUARY 2015
FIGURE 1 SELECTED STOXX INDICES PERFORMANCE (DEC. 2014, Q4 2014, AND FULL YEAR 2014 )
Source: STOXX (all performance figures are in USD terms whenever it is specified in the index name; in euro terms in the
remaining cases; performance figures of the volatility indices are computed in their respective currency of denomination)
Index Name 1-Mth Performance 3-Mths Performance 1-Yr Performance
EURO STOXX 50 - TOTAL RETURN INDEX -3.03% -1.99% 4.93%
EURO STOXX TMI REAL ESTATE INVESTMENT & SERVICES USD - PRICE INDEX -1.64% 3.06% 3.57%
EURO STOXX TOTAL MARKET REITs USD - PRICE INDEX -3.05% -0.81% -0.89%
STOXX AFRICA 90 USD - TOTAL RETURN INDEX -3.80% 0.67% 4.36%
STOXX ASEAN-FIVE SELECT DIVIDEND 50 USD - TOTAL RETURN INDEX -2.96% -4.07% n.a.
STOXX ASIA 600 MINIMUM VARIANCE USD - TOTAL RETURN INDEX 0.23% -0.62% 3.74%
STOXX ASIA 600 MINIMUM VARIANCE UNCONSTRAINED USD - TOTAL RETURN INDEX 0.20% 1.45% 10.28%
STOXX ASIA/PACIFIC 600 USD - TOTAL RETURN INDEX -1.59% -1.93% -2.25%
STOXX ASIA/PACIFIC 600 EX JAPAN USD - TOTAL RETURN INDEX -2.38% -1.42% -0.05%
STOXX AUSTRALIA TOTAL MARKET USD - TOTAL RETURN INDEX -2.24% -3.63% -3.31%
STOXX BRIC 1000 USD - TOTAL RETURN INDEX -5.35% -3.03% 1.52%
STOXX CHINA A-SHARES TOTAL MARKET USD - TOTAL RETURN INDEX 13.67% 26.15% 46.46%
STOXX CHINA B-SHARES TOTAL MARKET USD - TOTAL RETURN INDEX 3.30% 3.61% 13.62%
STOXX CHINA TOTAL MARKET USD - TOTAL RETURN INDEX 1.28% 7.50% 8.47%
STOXX EASTERN EUROP TOTAL MARKET USD - PRICE INDEX -16.68% -22.03% -32.23%
STOXX EMERGING MARKETS 1500 USD - TOTAL RETURN INDEX -4.26% -3.84% 0.51%
STOXX EUROPE 600 - TOTAL RETURN INDEX -1.26% 0.21% 7.79%
STOXX EUROPE 600 MINIMUM VARIANCE - TOTAL RETURN INDEX -0.54% 3.40% 12.36%
STOXX EUROPE 600 MINIMUM VARIANCE UNCONSTRAINED - TOTAL RETURN INDEX -0.69% 2.67% 12.83%
STOXX EUROPE ESG LEADERS 50 - TOTAL RETURN INDEX -2.10% 0.05% n.a.
STOXX EUROPE LARGE 200 - TOTAL RETURN INDEX -1.72% -0.46% 7.71%
STOXX EUROPE SMALL 200 - TOTAL RETURN INDEX 1.50% 3.40% 5.40%
STOXX EUROPE STRONG BALANCE SHEET - TOTAL RETURN INDEX -0.36% 3.46% n.a.
STOXX GLOBAL 1800 USD - TOTAL RETURN INDEX -1.58% 1.23% 5.44%
STOXX GLOBAL 1800 MINIMUM VARIANCE USD - TOTAL RETURN INDEX -0.25% 5.34% 13.76%
STOXX GLOBAL 1800 MINIMUM VARIANCE UNCONSTRAINED USD - TOTAL RETURN INDEX -0.07% 5.22% 14.06%
STOXX GLOBAL BROAD INFRASTRUCTURE USD - TOTAL RETURN INDEX -1.52% 1.21% 11.28%
STOXX GLOBAL ESG LEADERS USD - TOTAL RETURN INDEX -2.77% -0.95% n.a.
STOXX GLOBAL SELECT DIVIDEND 100 USD - TOTAL RETURN INDEX 1.99% 5.18% 22.84%
STOXX INDIA TOTAL MARKET USD - TOTAL RETURN INDEX -3.80% 3.03% 35.06%
STOXX JAPAN 600 USD - TOTAL RETURN INDEX -1.02% -2.27% -3.40%
STOXX JAPAN 600 MINIMUM VARIANCE USD - TOTAL RETURN INDEX 3.73% 2.50% 6.60%
STOXX JAPAN 600 MINIMUM VARIANCE UNCONSTRAINED USD - TOTAL RETURN INDEX 1.87% 1.28% 9.67%
STOXX LATIN AMERICA TOTAL MARKET USD - TOTAL RETURN INDEX -9.16% -13.90% -13.04%
STOXX NORTH AMERICA 600 MINIMUM VARIANCE USD - TOTAL RETURN INDEX -0.08% 7.20% 17.74%
STOXX SWITZERLAND TOTAL MARKET USD - TOTAL RETURN INDEX -4.52% -1.72% 1.69%
STOXX UK TOTAL MARKET USD - TOTAL RETURN INDEX -2.19% -3.45% -4.85%
STOXX US 900 USD - TOTAL RETURN INDEX -0.26% 5.01% 13.25%
STOXX US 900 MINIMUM VARIANCE USD - TOTAL RETURN INDEX 0.26% 6.67% 15.81%
STOXX US 900 MINIMUM VARIANCE UNCONSTRAINED USD - TOTAL RETURN INDEX 0.69% 10.25% 19.10%
STOXX USA STRONG BALANCE SHEET USD - TOTAL RETURN INDEX -0.77% 6.05% n.a.
STOXX USA TOTAL MARKET SMALL USD - TOTAL RETURN INDEX 1.10% 7.35% 9.69%
VSTOXX VOLATILITY INDEX - PRICE INDEX 45.26% 46.72% 51.83%
CBOE SPX VOLATILITY VIX - PRICE INDEX 44.04% 17.72% 39.94%
CBOE CRUDE OIL VOLATILITY INDEX - PRICE INDEX 37.87% 133.46% 182.88%
INDICES DASHBOARD
Page 6
JANUARY 2015
FIGURE 2 STOXX EUROPE 600 INDEX SECTOR TOTAL RETURN (DEC. 2014, Q4 2014, AND FULL YEAR 2014)
Source: STOXX
FIGURE 3 STOXX USA 900 INDEX SECTOR TOTAL RETURN (DEC. 2014, Q4 2014, AND FULL YEAR 2014)
Source: STOXX
-20.00%-16.00%-12.00% -8.00% -4.00% 0.00% 4.00% 8.00% 12.00% 16.00% 20.00% 24.00%
Index
Basic Materials
Consumer Goods
Consumer Services
Financials
Health Care
Industrials
Oil & Gas
Technology
Telecommunications
Utilities
-1.26%
-1.77%
-1.22%
2.43%
-2.29%
-2.42%
0.31%
-2.97%
3.07%
-2.52%
-2.09%
0.21%
-1.52%
5.72%
8.79%
-1.00%
-2.21%
1.89% -17.74%
5.23%
7.21%
-1.96%
7.79%
2.05%
12.39%
7.47%
6.22%
21.76%
1.92%
-11.09%
9.55%
12.56%
19.12%
1 Month 3 Months 1 Year
-16.00%-12.00% -8.00% -4.00% 0.00% 4.00% 8.00% 12.00% 16.00% 20.00% 24.00% 28.00%
Index
Basic Materials
Consumer Goods
Consumer Services
Financials
Health Care
Industrials
Oil & Gas
Technology
Telecommunications
Utilities
-0.26%
-1.63%
-1.57%
1.56%
1.55%
-1.09%
-0.20%
0.22%
-2.03%
-6.42%
2.94%
5.01%
-4.13%
6.79%
10.83%
7.98%
8.00%
6.13%
-12.29%
4.45%
-4.44% 11.50%
13.25%
4.17%
12.00%
14.90%
14.49%
26.37%
7.81%
-9.13%
20.79%
1.92%
26.39%
1 Month 3 Months 1 Year
INDICES DASHBOARD
Page 7
JANUARY 2015
FIGURE 4 STOXX EUROPE 600 INDEX – DOMICILE
COUNTRY PERFORMANCE CONTRIBUTION (2014)
Source: STOXX
FIGURE 5 STOXX EUROPE 600 INDEX – INDUSTRY
SECTOR PERFORMANCE CONTRIBUTION (2014)
Source: STOXX
0.12
0.60
0.02
2.41 0.37
0.37
0.19
2.14 0.42
0.32
0.39
0.51
-0.03
-0.08
0.31
0.02
-0.07
0.00
-0.09
-0.11
-0.08
0.01
0.02
0.01
0.02
-0.50 0.00 0.50 1.00 1.50 2.00 2.50
Italy
France
Norway
U.K.
Ireland
Germany
Finland
Switzerland
Spain
Sweden
Netherlands
Denmark
Luxembourg
Greece
Belgium
South Africa
Austria
Russia
Portugal
Australia
Bermuda
Czech Republic
Jersey
Guernsey
United States
0.19
2.08
0.56
1.41
2.33 0.29
-0.63
0.30
0.51
0.75
-1.00 -0.50 0.00 0.50 1.00 1.50 2.00 2.50
Basic Materials
Consumer Goods
Consumer Services
Financials
Health Care
Industrials
Oil & Gas
Technology
Telecommunications
Utilities
INDICES DASHBOARD
Page 8
JANUARY 2015
FIGURE 6 STOXX GLOBAL 1800 INDEX – DOMICILE
COUNTRY PERFORMANCE CONTRIBUTION (2014)
Source: STOXX
FIGURE 7 STOXX GLOBAL 1800 INDEX – INDUSTRY
SECTOR PERFORMANCE CONTRIBUTION (2014)
Source: STOXX
.
-0.31
0.65
0.91
0.77
1.94 0.23
-0.91
1.73 -0.04
0.47
-1.20 -0.80 -0.40 0.00 0.40 0.80 1.20 1.60 2.00
Basic Materials
Consumer Goods
Consumer Services
Financials
Health Care
Industrials
Oil & Gas
Technology
Telecommunications
Utilities
-0.09
-0.38
-0.03
-0.40 0.13
-0.35
0.00
0.06
-0.07
-0.07
-0.08
0.06
-0.03
-0.03
0.02
0.00
-0.03
0.00
-0.03
-0.13
-0.03
0.00
0.00
0.00
7.13 0.12
0.00
0.00
0.10
0.00
0.00
-0.43
-0.03
0.00
0.01
0.02
0.00
-2.50 -0.50 1.50 3.50 5.50 7.50
Italy
France
Norway
U.K.
Ireland
Germany
Finland
Switzerland
Spain
Sweden
Netherlands
Denmark
Luxembourg
Greece
Belgium
South Africa
Austria
Russia
Portugal
Australia
Bermuda
Czech Republic
Jersey
Guernsey
United States
Canada
China
Colonbia
Hong Kong
India
Israel
Japan
Macau
Mexico
New Zealand
Singapore
Thailand
INDICES DASHBOARD
Page 9
JANUARY 2015
©STOXX 2015. All Rights Reserved. The report was closed with information available as of the market close on Jan. 7, 2015. STOXX research reports are for informational purposes only, and do not constitute investment advice or an offer to sell or the solicitation of an offer to buy any security of any entity in any jurisdiction. Although the information herein is believed to be reliable and has been obtained from sources believed to be reliable, we make no representation or warranty, express or implied, with respect to the fairness, correctness, accuracy, reasonableness or completeness of such information. No guarantee is made that the information in this report is accurate or complete and no warranties are made with regard to the results to be obtained from its use. STOXX Ltd. will not be liable for any loss or damage resulting from information obtained from this report. Furthermore, past performance is not necessarily indicative of future results.
Exposure to an asset class, a sector, a geography, or a strategy represented by an index can be achieved either through a replication of the list of constituents and their respective weightings, or through investable instruments based on that index. STOXX Ltd. does not sponsor, endorse, sell, promote or manage any investment products that seeks to provide an investment return based on the performance of any index. STOXX Ltd. makes no assurance that investment products based on any of the STOXX index will accurately track the performance of the index itself or return positive performance. The views and opinions expressed in this research report are those of the author and do not necessarily represent the views of STOXX Ltd. This report is for individual and internal use only. It may not be reproduced or transmitted in whole or in part by any means, electronic, mechanical, photocopying, or otherwise, without STOXX's prior written approval.
INNOVATIVE. GLOBAL. INDICES.
STOXX is part of Deutsche Börse and SIX