Embed Size (px)
Citation preview

CAPITAL MARKETS PERSPECTIVES
THIRD QUARTER 2018
TABLE OF CONTENTS
I. PORTFOLIO MANAGERS’ OVERVIEW 1
II. ECONOMIC DASHBOARD AND MARKET INDICES 9
III. CHART OF THE QUARTER 12
IV. INVESTMENT STRATEGIES
Performing Credit 13-14
Middle Market Direct Lending 15
Energy 16-17
Distressed Debt – United States 18
Distressed Debt – Europe 19
Merger & Convertible Arbitrage 20
Liquid Credit 21
Residential and Consumer Debt (RMBS/ABS) 22
Commercial Real Estate Debt (CMBS) 23
Net Lease Real Estate 24
Real Estate – United States 25-26
Real Estate – Europe 27-28
Real Estate – Asia 29-30
Private Equity 31-32
ANGELO GORDON is a privately-held registered investment advisor
dedicated to alternative investing. The firm was founded in 1988 and
currently manages approximately $28 billion. We seek to generate absolute
returns with low volatility by exploiting inefficiencies in selected markets
and capitalizing on situations that are not in the mainstream of investment
opportunities. We creatively seek out new opportunities that allow us to
remain a leader in alternative investments.
We have expertise in a broad range of absolute return strategies for both
institutional and high net worth investors. Our dedicated team of employees
seeks to deliver consistent, positive returns in all market environments. We
have built our name on our breadth of talent, intensive research and risk
averse approach to investing. Our long-term experience gives us the insight
and patience to turn our vision into profitable, stable businesses.

1Return to Table of Contents
PORTFOLIO MANAGERS’ OVERVIEW
PERFORMING CREDITThe leveraged loan market extended its streak of positive performance for a tenth consecutive quarter, as the Credit Suisse Leveraged Loan index returned 0.78% in the second quarter. With year-to-date returns of 2.38%, the loan market continues to meaningfully outperform high yield returns of 0.20%. Last quarter’s macro themes remain relevant, with equity market volatility, an interest rate hike from the U.S. Federal Reserve and the escalating threat of a trade war affecting the markets and investor sentiment. Given the floating rate, secured nature of the loan market, these challenges have been more easily absorbed by loan investors than by high yield investors.
Although gross loan issuance declined roughly 8% over the first two quarters of the year, net supply has resulted in the loan market growing to approximately $1.1 trillion. The quarter ended on a strong note with June’s net institutional loan issuance (ex refi/repricing) exceeding the previous record set in February 2007. On the demand side, gross CLO issuance of $86.4 billion was the highest quarterly total on record. During the first six months of the year the market has absorbed nearly $150 billion of gross supply and although this represents a decline of roughly 3% on last year, it marks a significant increase of over 30% in net supply (approximately $70 billion versus $52 billion in the first half of 2017). As a result, CLO spreads widened in June. Rising interest rates continue to drive investor demand for floating rate assets. Loan fund flows were positive in each month of the quarter and now total nearly $12 billion for the year, which equates to 8.5% of loan fund AUM. The strong levels of inflows are in stark contrast to the significant outflows high yield funds have experienced this year: through the end of the quarter, high yield funds had suffered outflows of nearly $24 billion. This equates to over 7.5% of AUM and exceeds total 2017 outflows of $20.6 billion.
On balance, despite continued positive fund flows and CLO issuance, supply weighed on the market into quarter-end. At $98.40 the average price of the J.P. Morgan index is near its lowest level since late 2017 and, at 20.1%, the percentage of loans trading above par is near its lowest level in close to two years. It is important to note that as loan spreads were repriced lower over the last several quarters, the natural outcome is a decline in loan price as it moves back to par. Therefore, we believe today’s market, with 20% of loans trading above par, represents a healthy, balanced market versus earlier this year when 70+% of loans were trading above par. There should also be less risk of spread tightening in today’s environment, so the average spread investors are earning should remain relatively constant throughout the third quarter of 2018. During the second quarter, investors were sporadically able to take advantage of pockets of softness to garner better pricing and terms. At this stage of the credit cycle we continue to believe that there are attractive opportunities to invest in both the first and second lien loan markets.
MIDDLE MARKET DIRECT LENDINGMiddle market syndicated loan issuance picked up steam in the second quarter, reaching $48 billion and resulting in first half issuance of just over $90 billion, the highest tally since 2014. In a theme reminiscent of the broadly syndicated loan market, refinancings accounted for over 60% of issuance in the first half of the year. Sponsored syndicated issuance of $20.9 billion declined 4% versus the first quarter but first half sponsored issuance was up 14% versus last year. Add-on acquisitions accounted for more than a third of new money sponsored lending in the quarter.
With respect to generic market pricing, while over 90% of first lien middle market loans came to market priced at 99.5 or higher, all-in yields, including LIBOR and spread, have increased over the course of the year, in no small part due to the 60+ basis point increase in three-month LIBOR. Unitranche spreads, however, tightened for the fourth consecutive quarter to 615 basis points. With regard to lender protections, covenant-lite loans, once strictly seen in the broadly syndicated loan market, continue to gain prevalence. According to a Thomson Reuters survey, over 65% of lenders are willing to do cov-lite loans versus last year when 60% of lenders said they would not do cov-lite loans. In both instances, however, lenders want a minimum EBITDA of at least $40 million. EBITDA adjustments have also become more widespread; a majority of lenders indicated that only sometimes do these adjustments come to fruition. Despite the willingness of lenders to give on some protections they are far less willing to go lower in the capital structure or do significantly higher leverage deals.
Given its vast scope, the middle market is far from uniform and we believe lenders can differentiate themselves in numerous fashions, including sourcing, diligence process, industry focus, seniority in the capital structure, and experience in direct lending. Although today’s competitive dynamics may compel lenders to stray from their historical approach we believe that credit discipline will ultimately reign supreme.
Maureen D’AllevaPortfolio Manager
Trevor ClarkPortfolio Manager

2Return to Table of Contents
ENERGYWTI remains above $65, as strong global demand coupled with declining inventories have provided support. Despite concerns regarding tariffs and rising commodity prices, the IEA forecasts continued demand growth through 2019. OPEC has agreed to increase production, however, dysfunction in Venezuela and pending U.S. sanctions against Iran effectively create a ceiling for incremental supply, although it now appears likely that a more measured approach to a full wind-down of Iranian crude purchases may occur. While rising U.S. production – now approaching 11 million barrels/day – will help augment OPEC production, global spare capacity is contracting and the ability to respond to market shocks is limited. These multiple moving parts combine to suggest that volatility in prices may be the new norm.
After a slow start, energy equities benefited from a strong second quarter, with the XOP index now outpacing the broader market year-to-date. Recent performance notwithstanding, oil and gas valuation multiples continue to trade at a two-turn discount to the five-year average and the divergence in energy equities versus oil prices remains severe. Permian producers have been scrutinized by investors, as takeaway capacity constraints are arising amidst accelerating production and should persist through late 2019. Once the beneficiaries of premium valuations, producers within the basin have generally underperformed the XOP. Oil and gas equity issuances are down sequentially and year over year.
During the quarter, the Credit Suisse Energy High Yield Index tightened from 7.2% to 7.0%, following the uptick in crude. The leveraged finance markets priced $19 billion of supply during the quarter, approximately half of which was loan issuance – the highest level since 2014.
Producer capital discipline remains intact. Reinvestment rates have fallen below 100% of free cash flow, resulting in a continuing deleveraging trend across the oil and gas subsector. Such discipline has suppressed public company acquisition appetites, resulting in an historically high backlog of privately held assets seeking buyers. Compounded by an inactive IPO market, energy private equity now has an exit problem as both the sale and IPO paths are blocked.
With a growing need for working capital from oilfield services borrowers and the continued de-risking of oil and gas borrowers, demand for non-bank term debt has increased. We also expect the private equity exit conundrum to further enhance demand for debt financing, including DrillCo’s and dividend recapitalizations. Finally, as the high yield markets are open only to larger deal sizes, we continue to see attractive opportunities to anchor club-syndicated senior secured term loans.
Todd DittmannPortfolio Manager
PORTFOLIO MANAGERS’ OVERVIEW (continued)
DISTRESSED DEBT The second quarter of 2018 was largely benign for large cap stressed and distressed companies as capital markets remained open (at least for loan issuers) and trailing default levels were subdued. In fact, with no defaults in June and the second quarter of 2018 seeing the second lowest quarterly default total in almost five years, it appears that maturity extension is the norm, credit is priced to near-perfection, and creditor protection is a thing of the past. In fact, covenant-lite is so pervasive it is now approaching 80% market share in the U.S. and 75% in Europe. The ravenous appetite for primary loan product among CLOs and other rate-biased buyers is quickly absorbing near-record loan issuance driven by a feverish recent [U.S./global] M&A environment.
However, despite the benign default environment, there are some distinct signs of market cracks and re-pricing. While global year-to-date loan issuance is up a modest 2% from 2017, weak investor demand has dampened the appeal of high yield product, and has notably translated into secondary market re-pricing. Against the backdrop of a receding ECB floor, the European primary market has seen a number of deals hung on dealer balance sheets. In fact, for the first time in more than three years, we are seeing deals either failing to price or pricing with changes to terms with discount. This trend is pushing the secondary market wider and lower in the context of macro concerns related to Brexit, Italy, Germany, Spain and U.S./China trade. What this clarifies for risk market participants is that the secondary market has not been reflecting current demand for risk. While we do not expect near-term severe pain (or liquidation), the primary market is effectively re-pricing the secondary market which has now corrected materially since its fourth quarter 2017 tights.
In the U.S., we are closely monitoring the continued flattening of the Treasury yield curve, the inversion of which typically carries ominous predictions for the global economy. We are also increasingly seeing the rapid negative market pricing behavior to companies that even slightly miss earnings or report unexpected developments. With technology- or behavior-driven change disrupting several sectors, intra-industry dispersion continues to run cyclically high and has been driving single name price volatility. With total debt multiples for large cap names at or near all-time highs (10 years for Europe), there is less and less room for the slightest hiccup.
David KaminCo-Portfolio Manager
Dan PoundCo-Portfolio Manager

3Return to Table of Contents
MERGER ARBITRAGEAnnounced U.S. M&A volume continued its robust pace for 2018 as second quarter deal value was up 69% from 2017 and 16% sequentially. The second quarter figure followed the strongest first quarter for M&A since 2000 and puts the 2007 high within reach. While global regulatory uncertainty and the U.S.-China trade dispute continued to weigh on merger arbitrage trading, it has yet to materially impact corporate growth via M&A. Highlighting this trend was Takeda’s acquisition announcement of Shire plc during the second quarter. Shire would be Takeda’s largest acquisition in its corporate history and one that will re-orient the pharmaceutical company focus from primarily Japan to global. Following on the influence of corporate tax reform on M&A that commenced in the first quarter, the second quarter saw a number of energy MLPs simplify their corporate structures by collapsing their respective GP/LP.
Early in the second quarter merger arbitrage spreads widened in response to the escalating U.S.-China trade dispute. While both countries have made efforts to approve deals during the dispute, there remain a few deals hanging in the balance that are an overhang for investors. This has led arbitragers to rotate money from deals that require Chinese antitrust approval to those that do not. This rotation trade, along with the closing of the Monsanto / Bayer and Time Warner Inc. / AT&T deals, helped merger arbitrage spreads narrow during the quarter from 12% annualized to approximately 9.5%. It remains to be seen how the DOJ will react to its court defeat in its attempt to stop AT&T from acquiring Time Warner Inc., but arbitragers will be watching closely to see if the DOJ will retreat as they have done subsequent to other defeats or if the directive continues to be in active antitrust enforcement.
CONVERTIBLE ARBITRAGEDuring the second quarter global equity markets managed to reverse their first quarter losses, even as trade tensions and geopolitical concerns remained omnipresent. This reversal brought the MSCI World Index to an approximate flat total return for the first half on a local currency basis. Volatility levels initially declined with equity markets recovering, but they finished the quarter well off last year’s lows.
The overall weakness in global credit markets continued during the second quarter. Global convertible bonds returned 1.6% in the second quarter on an outright basis, increasing the year-to-date performance to 3.7%. Convertible bond valuations, however, continued to be pressured with long-only investors reducing exposure to protect gains, meet redemptions and create liquidity to absorb the strong primary market supply. As a result, a delta-hedged convertible index is now down 2.7% for the year.
A conducive market environment of rising interest rates and higher volatility allowed the primary market to accelerate further and the $57.8 billion of new convertibles issued so far this year represents the strongest first half since 2008. The U.S. ($34.2 billion) and Asian ($12.1 billion) markets drove the increase in deal volumes, while Europe ($9.5 billion) and Japan ($2.0 billion) issuance declined. We expect the primary market to remain very active and a source of opportunities throughout the second half of the year. We have also witnessed several brief periods to date in 2018 during which market liquidity was tested by selling pressure from long-only investors. More pronounced and longer episodes of risk reduction will, in our view, lead to meaningful adjustments to currently still lofty valuations and create opportunities for investors.
Gary WolfPortfolio Manager
PORTFOLIO MANAGERS’ OVERVIEW (continued)
David KaminPortfolio Manager

4Return to Table of Contents
LIQUID CREDITAverage investment grade bond spreads widened approximately 25 basis points during the second quarter stemming from both elevated M&A-driven supply and increasingly expensive FX hedging costs. CVS’s $40 billion mid-March financing of the Aetna acquisition kicked off a supply overhang that repriced secondary trading levels to two-year wides. The DOJ’s June approval of the AT&T/Time Warner deal and Comcast/Disney’s debt financed bidding war for Fox’s media portfolio only added to investor concerns around future M&A-related supply. On the hedging front, Italian political risk drove global financial spreads wider and rising FX hedging costs limited overseas demand for U.S. corporates.
High yield bond spreads finished the second quarter relatively unchanged, indicating strong performance relative to investment grade. Spreads tightened substantially in early April due to a quiet primary market and historically low dealer inventories. However, the market began to notice high yield’s outperformance relative to investment grade and spreads widened accordingly into quarter end. New supply continues to expose weak investor demand, consistently repricing secondary spreads wider.
Energy-related credits continued to outperform, as WTI marched higher, closing the quarter north of $74. Retailer bonds struggled with benchmark names like JC Penney and L Brands, Inc. posting weaker than expected earnings. Cable bonds remained under pressure due to cord cutting concerns and Veritas unsecured bonds dropped 10 points following the announcement of an accounting deficiency.
Amidst strong waves of technicals and intra-sector dispersion, we continue to see pockets of volatility in U.S. liquid credit markets.
Michael LiebmanCo-Portfolio Manager
John RudicCo-Portfolio Manager
RESIDENTIAL AND CONSUMER DEBT (RMBS/ABS)During the second quarter, spread performance was mixed across mortgage- and asset-backed sectors. Legacy RMBS spreads, which were already at or near all-time tights coming into the quarter, were relatively flat. The credit-risk transfer (CRT) market saw spread-tiering in the mezzanine and subordinate tranches as investors favored seasoned deals with comparatively better underwritten collateral versus new issue deals. However, the new issue collateral continues to be underwritten under historically tight lending criteria. Asset-backed securities remained well-bid during the quarter, although spreads for some of the highest credit tranches in benchmark sectors were somewhat wider. On the other hand, spreads for esoteric sectors were modestly tighter as investors continued to see attractive relative value for this part of the sector.
Quarterly new issuance of RMBS rose 11% year-over-year to $23.8 billion, while ABS issuance fell by 5.5% year-over-year to an otherwise robust $64.5 billion. The second quarter’s activity brings year-to-date new issuance to $39.2 billion of RMBS and $131.8 billion of ABS, a rise of 12.6% and 2.8%, respectively, compared to the first half of 2017.
Rising home prices and stable collateral fundamentals continued to support and draw interest to the mortgage markets during the quarter. According to the latest reading by CoreLogic Case-Shiller, national home prices rose year-over-year by 6.4% and now sit about 50% above the crisis-era trough set in February 2012. Home prices have recorded year-over-year gains of 5% to 7% over the last several years as persistently tight supply of homes across the nation has put a floor on growth. Rising home prices have also lent support to strong collateral fundamentals as nearly 77% of legacy borrowers have made at least 12 consistent, on-time payments in the prior year. By comparison, this figure stood at 61% at the February 2012 home-price trough.
Agency MBS finished the second quarter flat to marginally tighter versus the swap curve. While the continued reduction of the Federal Reserve’s holdings of agency MBS poses a headwind to the sector, net origination so far in 2018 is running at roughly 70% of 2017’s pace and most forecasts for 2018. Hedged carry remains strong as the curve continues to flatten, and interest rate volatility during the quarter was muted. Banks and overseas investors have been largely absent so far this year, but money managers have supported the sector as they have experienced inflows and increased their portfolio weighting of agency MBS versus other fixed-income products.
TJ DurkinCo-Portfolio Manager
Yong JoeCo-Portfolio Manager
PORTFOLIO MANAGERS’ OVERVIEW (continued)

5Return to Table of Contents
COMMERCIAL REAL ESTATE DEBT (CMBS)The slow and steady positive performance in the CMBS market continued during the second quarter of 2018. One interesting trend in the market has been the flattening of the credit curve this year, with new issue 10-year AAA rated bonds about 10 basis points wider and BBB- securities approximately 60 basis points tighter. We attribute this to two primary factors. At over $47 billion, private label new issue volume exceeded expectations and finished the first half of the year about 34% ahead of 2017 pace. BBB- tranche sizes are significantly smaller than AAA tranche sizes and thus the supply coming to market affects the tranches in different manners. In addition, risk retention structures are reducing the availability of lower rated classes even further.
With respect to new issue, the breakdown by deal type is worth noting. Traditional multi-borrower conduit issuance, typically the largest component of new issue (and the largest component of the overall private label CMBS market) is down slightly from last year. Single asset/single borrower deal volume is up by more than 60%. Issuance of bonds included in the Other category is primarily driven by CRE CLOs. The pace of issuance in this portion of the market has skyrocketed this year and more than doubled first half volumes from 2017.
New issue conduit deals have been challenging. Pricing levels are at the tighter end of the range witnessed over the past three years. These levels may have been attractive if overall loan quality had improved by a commensurate amount, however we believe overall loan quality has actually moved in the opposite direction. Current LTVs, DSCRs and overall debt yields are all marginally worse compared to 2017, although this is not surprising given the increased competition CMBS lenders are facing. Banks have loosened commercial real estate lending standards and insurance companies have been more willing to compete on price (i.e. lower spreads).
Notwithstanding the above, deal level metrics do not always tell the complete story and investors with the ability to analyze the real estate underlying these transactions should continue to be able to source and identify interesting investment opportunities.
NET LEASE REAL ESTATEAs of the second quarter of 2018, the trailing 12-month U.S. single-tenant transaction volume totaled $54 billion, according to Real Capital Analytics. Since the second quarter of 2017, office and retail volumes declined by 30% and 6%, respectively, while industrial volume increased by 18%. The demand for industrial is also exhibited in cap rates, with industrial cap rates compressing 8% since the second quarter of 2017. Public REITs in most property sectors have suffered prolong trading discounts to private market values, according to HFF. This dynamic, coupled with record levels of “dry powder” from private real estate funds and global capital, as well as an attractive financing environment, has resulted in significant M&A levels. The average 10-year interest rate increased from 2.3% in the second quarter of 2017 to 2.9% in the second quarter of 2018. Since the 1990s, the 10-year Treasury has risen by 30+ basis points within a calendar seven times. During these years, private and public real estate indexes (NCREIF and SNL U.S. REIT Index) have delivered positive returns, except for one year in 1999, according to HFF.
Andrew SolomonPortfolio Manager
Gordon J. WhitingPortfolio Manager
PORTFOLIO MANAGERS’ OVERVIEW (continued)

6Return to Table of Contents
REAL ESTATE
United StatesTransaction volume continues at a moderate pace, with year-to-date deal volume roughly in line with the first half of 2017, according to preliminary data from Real Capital Analytics. Given the length of the recovery to date, and uncertainty of its continued duration, it is little surprise that the apartment sector, with its attractive cash flow and aggressive agency debt, bucked the overall trend with a strong increase in transaction volume in May. It appears that interest rate increases have not had a measurable effect on real estate pricing – yet. Broad pricing for the five major property sectors has plateaued, with the Green Street CPPI index roughly flat over the past 12 months and close to 2016 levels.
Hiring, a key driver for real estate demand, has remained strong with an increase of 213,000 in total nonfarm payroll employment in June, and revisions upward for April and May, resulting in job gains averaging 211,000 per month over the last three months. Job growth over the last year has been robust in professional and business services (i.e. 50,000 jobs in June; 521,000 over the year), manufacturing and health care. Real estate fundamentals appear to reflect these gains, with Green Street’s forecasted operating fundamentals index largely unchanged versus the prior quarter. Top-line rent growth is forecast to be at or a step below inflation across sectors, though there are exceptions – with industrial expected to outperform and retail to underperform, based on changing consumer preferences.
Supply growth has been restrained for most product types since 2007, below the 1.3% long-term average of new completions versus existing stock, according to Green Street. General economic uncertainty, lower rates of inflation, and stricter lending standards have contributed; however, lending standards have begun to loosen, according to a recent Federal Reserve Survey. While office and apartment demand appear to be keeping pace generally, significant new supply in some urban markets has dampened rent growth for these property types. On the other hand, active development pipelines in industrial and student housing appear to be manageable per Green Street’s forecasted demand.
The yield for long-term corporate bonds (i.e., Moody’s Baa), has increased significantly year-to-date, reaching 4.8% at the end of June. Green Street’s proprietary valuation model estimates the unleveraged return available on core real estate is approximately 6.0%, indicating a slightly tighter than historical spread, suggesting that private real estate is modestly overvalued relative to investment grade bonds. Moving further out on the risk spectrum, real estate is priced to deliver a return about 47 basis points less than high-yield bonds, in line with historic averages and indicating real estate is fairly-priced relative to high-yield. After a terrible start to the year, REITs rebounded strongly in the second quarter, generating a total return of 1.2% for the first half of 2018, compared to approximately 3.0% for the S&P 500. Despite a better second quarter, REITs have underperformed the broader equity market for more than two years, decoupling from their historic correlation with the S&P. Accommodative equity and debt capital markets, combined with perceived discounts in the public market valuations, has resulted in REIT M&A volume beginning to pick up, mirroring the growth in global M&A activity.
EuropeIn the first half of 2018, €45.9 billion of real estate loans and owned real estate were sold by euro-zone banks. This total surpassed transaction volume in the first half of 2017 by 60%, with the latter period having set the previous record. The trend of banks from continental Europe accelerating efforts to deleverage continued in 2018, and while UK and Irish bank transactions have slowed down, they have not stopped. In the first half of 2018, about 36% of transactions came from Spanish lenders, 27% from Italian lenders and 28% from UK and Ireland-based lenders. In aggregate, portfolios of €33.4 billion are currently being formally marketed and, with a future pipeline of circa €62.5 billion, the deleveraging cycle likely has multiple years to run.
From a direct real estate perspective, new supply remains very limited in the major European cities. The overall vacancy rate has fallen from nearly 10% to 7%, the lowest level since 2003. New office supply was below 1.5% from 2011 until 2017 and although it rose slightly to 1.8% in 2018 (approximately 34 million square feet), much of that is pre-leased. Coupled with the withdrawal of supply of 0.7% per annum between 2013 and 2017, virtually no net new supply has been created. In parallel, office leasing has accelerated, with more than 20 million square feet leased per quarter over the last year. The resulting supply/demand imbalance has led Capital Economics to project 8% rental growth across Western European cities between 2018 and 2020.
Turning away from the continent, although much about the UK’s future relationship with the European Union still remains unknown, the UK property markets continue to appear robust despite the political uncertainty. The Bank of England recently revised downwards their estimates for total financial job relocations to 5,000, which is approximately 1% of the financial sector workforce in London. The level of investment in London real estate was £8.2 billion in the first half of 2018, which is in line with volumes in 2017. Interestingly, international interest has been at all-time highs - over the last 12 months, overseas investors have accounted for 86% of the market, the highest proportion for any 12-month period on record. Occupancy remained strong as well, as office space under offer reached 4.3 million square feet in the second quarter of 2018, up 39% over the quarter. This figure is the highest quarterly level since the third quarter of 2000, suggesting that, for now, occupiers and investors alike are taking Brexit uncertainty in their stride.
Adam SchwartzPortfolio Manager Head of Real Estate
Reid LiffmannCo-Portfolio ManagerU.S. Real Estate
Anuj MittalCo-Portfolio ManagerEurope Real Estate
PORTFOLIO MANAGERS’ OVERVIEW (continued)

7Return to Table of Contents
ASIA REAL ESTATE
JapanIn the first quarter of 2018, Japan’s real GDP contracted slightly at -0.2% quarter-on-quarter which is the first decline since 2015. It is, however, expected to recover towards an annual growth rate of 1.3% in 2018. Aggregate net profit for nonfinancial businesses grew roughly 30% to ¥28.78 trillion ($262 billion), according to full-year earnings releases from 257 companies and forecasts for many other firms. Major Japanese companies agreed to raise monthly employee pay by ¥8,539, or 2.53%, on average for unionized workers in this year’s spring labor-management talks. Average pay increases have topped 2% five years in a row and exceeded ¥8,000 for the first time since 2015. The real consumption activity index rose 2.4% month-on-month in April, the highest level since 2014 when there was a spike in consumption ahead of the impending consumption tax hike. Finally, transaction volume by Japanese REITs (“J-REIT”) recorded a quarterly high as the J-REIT index outperformed the major Japanese index (TOPIX) by 8%.
Offshore, core-focused investors continue to actively pursue investment opportunities in Japan as asset values remain below prior peak levels and financing terms remain very attractive. Strong tenant demand, propelled by a robust economy, has pushed Grade-A office vacancy to 0.2% in Osaka, while in Tokyo vacancy is 2.3% as the result of new supply. Vacancy levels for Class B properties have also declined to 1.2% in Tokyo and 1.7% in Osaka. With large scale Class A office supply scheduled to come on line in Tokyo in 2018, gradually rising Class A office rents may reach a plateau later this year. Strong pre-leasing activities, however, suggest that Tokyo office fundamentals may remain stable in 2018. In Osaka, very limited new office stock is expected over the next few years which should lead to growth in office rents in the coming year.
With regards to the hotel market, inbound tourism hit a record high of 29 million visitors in 2017, a 19% increase from the previous year. The visitor arrivals trend is on track to meet the government’s target of 40 million visitors by 2020 – the year of the Summer Olympics in Tokyo. This should offer a significant boost to the growing hotel industry. The rapidly growing number of inbound tourists has had a positive impact on hotel performance, as measured by revenue per available room (RevPAR). The average daily room rate (ADR) in the Tokyo hotel market reached $242 in 2017, which is the highest among major cities in Asia. Inbound tourists spent a record $40 billion in 2017, a 17.8% increase over the previous year. Year-to-date arrivals of 13.2 million outpace last year’s figures by 16%, presenting a strong growth trajectory for 2018.
ChinaChinese economic growth topped expectations in the first quarter of 2018 at 6.8%, exceeding the 6.5% target set at the beginning of the year. However, in the second quarter, the looming trade war continued to weigh on investor sentiment. The Shanghai Stock Exchange Composite Index finished the quarter down 10.1%, near its lowest level in two years. Hong Kong’s Hang Seng Index finished the quarter down 3.8%. The Chinese RMB lost 5.4% against the dollar and finished the quarter at RMB6.62 per USD, a level not seen since the end of last year.
On the real estate front, the investment market for commercial properties in tier one cities such as Shanghai and Beijing, remained active and liquid. Shanghai has consistently been one of Asia’s most active investment markets with transaction volume of over US$29 billion in the last two years. Real estate fundamentals in large cities remain robust, underpinned by a strong economy and a rapidly growing tertiary sector. We see sustained demand for office space in tier one cities while vacancy remains at healthy levels.
The second quarter was dominated by headlines on the escalating trade war. However, an advisor to the People’s Bank of China was quoted saying that the 25% tariffs on US$50 billion worth of Chinese goods would trim China’s economic growth by 0.2%. While the currently announced tariffs would not affect economic fundamentals significantly, the possibility of further escalation has created uncertainty on economic growth. On the other hand, deleveraging continues in China as debt-laden companies like Hainan Airlines (HNA) sell more assets to repay their loans. We believe that the market volatility and the potential for event-driven special situations may present attractive buying opportunities for investors in the coming months.
Wilson LeungPortfolio ManagerHead of Asia Real Estate
Steven ChaCo-Portfolio Manager
PORTFOLIO MANAGERS’ OVERVIEW (continued)

8Return to Table of Contents
Hong KongThe Hong Kong economy delivered robust growth of 4.7% year-over-year in the first quarter of 2018, beating the full-year target of 3-4%. Unemployment remained at a 20-year low of 2.9%. Due to the scarcity of available land in Hong Kong, a long-term supply shortage has underpinned the property market. On the demand side, mainland Chinese companies are increasingly expanding overseas and have created strong incremental demand for office space, particularly in Central, the city’s CBD. In fact, in 2017 34% of the new office take-up in Central was attributable to mainland Chinese firms. The demand has been driven in part by Chinese banks and financial services firms who look to service clients actively investing in Hong Kong and in overseas markets.
As a result of the supply shortage and increasing demand, office vacancy remains tight at 1.4% in Central as of the first quarter of 2018. Strong office fundamentals have lifted office rents in Central significantly and increased the rental gap between Central and decentralized office areas. The office decentralization trend will continue as cost-conscious tenants are pushed out of Central and are forced to move to less expensive decentralized areas which may present attractive opportunities for investment. That said, price expectations are high and investors should remain cautious as the market appears to be quite late in the investment cycle.
South KoreaIn the past three months, we witnessed two historic summits take place. First, in April, President Moon Jae-in of South Korea met with Chairman Kim Jong Un of North Korea. This was followed in June by U.S. President Donald Trump’s summit with Chairman Kim. While we still maintain our view that it is premature to conclude the end of tension with North Korea at this stage, we believe the summits were important first steps and we will continue to monitor the situation closely.
The South Korean economy grew 1.0% quarter-on-quarter in the first quarter of 2018, on the back of robust exports and capital investments. The Bank of Korea (“BoK”) maintained its 3.0% annual GDP growth forecast for 2018. Furthermore, the BoK kept its benchmark policy rate unchanged at 1.50% in May of this year. The spread between prime office cap rates and the Korean government bond yield (i.e. 5-year treasury bond) contracted 10 basis points to 230 basis points, which is still higher than the prior 10-year average of approximately 215 basis points. Prime office vacancy rate in the major business districts in Seoul rose by 2.2% points to 13.8% in the first quarter of 2018 with the relocation of a number of Korean conglomerates. Analysts expect vacancy rates to drop in 2018 with the positive pick-up in net absorption due to the growth of the financial and IT industries. The residential market in Seoul continues to be robust, with Seoul apartment prices rising 6.6% year-on-year as of June 2018. In certain prime residential submarkets such as Gangnam, apartment prices have experienced an even more significant increase of 13.1% year-on-year as of June 2018.
PRIVATE EQUITY The private equity industry continued to be robust through the first half of the year. Deal volume was significantly higher for the first six months in 2018 versus 2017. In North America, there were $136 billion of transactions through June 30, 2018 as compared to $99 billion from the prior year’s first half. Global deal volume through the first six months increased approximately 25% year-on-year to $214 billion. Notably, the deal volume in the second quarter of 2018 was materially higher compared to the first quarter. In North America, second quarter deal volume was $86 billion compared to $50 billion in the first quarter of 2018. Global deal volume was $124 billion in the second quarter versus $90 billion in the first quarter of 2018. The increased dollar volume was driven by numerous multi-billion-dollar buyouts in the quarter, consistent with first quarter activity. A potentially significant statistic is that dry powder decreased to $621 billion at June 30th which is a decline from the $642 billion all-time record set at March 31st. This bucks the five year quarterly upward trend.
Transaction multiples in the first six months of 2018 were lower than calendar 2017 and on par with calendar 2016. Through the first six months, average multiples paid were 9.8x EBITDA versus the 10.7x paid in 2017 and the 10.0x paid in 2016. As stated previously, while one or two quarters can’t be defined as a trend in the private equity sector, it will be interesting to see if we have seen the peak of dry powder and multiples paid. To provide some context, dry powder is certainly still high by historical standards and multiples paid are within the range of the four-year historical average of 10.2x EBITDA. Average leverage for buyouts in the first six months of 2018 declined to 5.6x multiple of EBITDA from the 5.9x seen in the first quarter of 2018 but well within the range seen over the past few years. Equity contribution as a percentage of total capitalization in the second quarter remained unchanged at 39%. Another metric which reversed trend in the second quarter is the number of exits. The number of exits increased in the first six months of 2018 from the prior year’s first six months by approximately 7%, with a commensurate dollar volume increase of 45% reflecting larger dollar monetizations. The number and dollar volume of exits are both well within ranges from prior years. Time will tell as to whether the first half of 2018 will prove to be a period when stability prevailed in terms of multiples paid and dry powder or was a temporary respite before continuing an upward trajectory.
Arthur PeponisPortfolio Manager
PORTFOLIO MANAGERS’ OVERVIEW (continued)

9Return to Table of Contents
ECONOMIC DASHBOARDMarket Indices: Third Quarter 2018
US -- Unemployment Rate
US – Non-Farm Payroll
US – Labor Participation Rate
US -- U-6 Unemployed & Margin & Part-Time as % of Labor Force & Margin
Eurozone Unemployment Rate
3%
8%
2013 2014 2015 2016 2017 2018
Job Market (5) Inflation (3) GDP Growth (3)
US Consumer Price Index (CPI)
US CPI Goods Less Food and Energy
US Producer Price Index (PPI) Y-o-Y %
US – GDP Y-o-Y %
Eurozone – GDP Y-o-Y %
China – GDP Y-o-Y %
0
350
2013 2014 2015 2016 2017 2018
Thou
sand
s
62%
64%
2013 2014 2015 2016 2017 2018
7.0%
15.0%
2013 2014 2015 2016 2017 2018
7.5%
12.5%
2013 2014 2015 2016 2017 2018
(0.2%)
3.0%
2013 2014 2015 2016 2017 2018
1.0%
2.5%
2013 2014 2015 2016 2017 2018
1.0%
2.5%
2013 2014 2015 2016 2017 2018
0.0%
3.0%
2013 2014 2015 2016 2017 2018
6%
8%
2013 2014 2015 2016 2017 2018
2.0%
6.0%
2013 2014 2015 2016 2017 2018
Housing (4) Economic and Market Confidence (8)
Existing Home Sales
New Home Sales
Housing Starts
Case-Shiller Index of Home Value in 20 Cities
Capacity Utilization as a % of Capacity
Private Fixed Investment Nonresidential SAAR
Residential Fixed Investment as a % of GDP
ISM Manufacturing Index
Manufacturing Inventory Change Q-o-Q $
Exports of Goods/Services
Shipping Rates
Personal Income Level
Michigan Consumer Confidence Sentiment
$2,250
$2,600
2013 2014 2015 2016 2017 2018
$Billi
ons
$13,000
$17,000
2013 2014 2015 2016 2017 2018
$ Billi
ons
4.0
6.0
2013 2014 2015 2016 2017 2018
Millio
ns
325
725
2013 2014 2015 2016 2017 2018
Thou
sand
s
400
1,350
2013 2014 2015 2016 2017 2018
Thou
sand
s
150
215
2013 2014 2015 2016 2017 2018
Leve
l
74%
80%
2013 2014 2015 2016 2017 2018
$2,000
$2,800
2013 2014 2015 2016 2017 2018
$ Billi
ons
2.8%
3.5%
2013 2014 2015 2016 2017 2018
46
62
2013 2014 2015 2016 2017 2018
Leve
l
($20)
$50
2013 2014 2015 2016 2017 2018
$ Billi
ons
300
2,300
2013 2014 2015 2016 2017 2018
Leve
l
70
103
2013 2014 2015 2016 2017 2018
Leve
l
Housing (4) Economic and Market Confidence (8)
Existing Home Sales
New Home Sales
Housing Starts
Case-Shiller Index of Home Value in 20 Cities
Capacity Utilization as a % of Capacity
Private Fixed Investment Nonresidential SAAR
Residential Fixed Investment as a % of GDP
ISM Manufacturing Index
Manufacturing Inventory Change Q-o-Q $
Exports of Goods/Services
Shipping Rates
Personal Income Level
Michigan Consumer Confidence Sentiment
$2,250
$2,600
2013 2014 2015 2016 2017 2018
$Billi
ons
$13,000
$17,000
2013 2014 2015 2016 2017 2018
$ Billi
ons
4.0
6.0
2013 2014 2015 2016 2017 2018
Millio
ns
325
725
2013 2014 2015 2016 2017 2018
Thou
sand
s
400
1,350
2013 2014 2015 2016 2017 2018
Thou
sand
s
150
215
2013 2014 2015 2016 2017 2018
Leve
l
74%
80%
2013 2014 2015 2016 2017 2018
$2,000
$2,800
2013 2014 2015 2016 2017 2018
$ Billi
ons
2.8%
3.5%
2013 2014 2015 2016 2017 2018
46
62
2013 2014 2015 2016 2017 2018
Leve
l($20)
$50
2013 2014 2015 2016 2017 2018
$ Billi
ons
300
2,300
2013 2014 2015 2016 2017 2018
Leve
l
70
103
2013 2014 2015 2016 2017 2018
Leve
l
Housing (4) Economic and Market Confidence (8)
Existing Home Sales
New Home Sales
Housing Starts
Case-Shiller Index of Home Value in 20 Cities
Capacity Utilization as a % of Capacity
Private Fixed Investment Nonresidential SAAR
Residential Fixed Investment as a % of GDP
ISM Manufacturing Index
Manufacturing Inventory Change Q-o-Q $
Exports of Goods/Services
Shipping Rates
Personal Income Level
Michigan Consumer Confidence Sentiment
$2,250
$2,600
2013 2014 2015 2016 2017 2018
$Billi
ons
$13,000
$17,000
2013 2014 2015 2016 2017 2018
$ Billi
ons
4.0
6.0
2013 2014 2015 2016 2017 2018
Millio
ns
325
725
2013 2014 2015 2016 2017 2018
Thou
sand
s
400
1,350
2013 2014 2015 2016 2017 2018
Thou
sand
s
150
215
2013 2014 2015 2016 2017 2018
Leve
l
74%
80%
2013 2014 2015 2016 2017 2018
$2,000
$2,800
2013 2014 2015 2016 2017 2018
$ Billi
ons
2.8%
3.5%
2013 2014 2015 2016 2017 2018
46
62
2013 2014 2015 2016 2017 2018
Leve
l
($20)
$50
2013 2014 2015 2016 2017 2018
$ Billi
ons
300
2,300
2013 2014 2015 2016 2017 2018
Leve
l
70
103
2013 2014 2015 2016 2017 2018
Leve
l
US -- Unemployment Rate
US – Non-Farm Payroll
US – Labor Participation Rate
US -- U-6 Unemployed & Margin & Part-Time as % of Labor Force & Margin
Eurozone Unemployment Rate
3%
8%
2013 2014 2015 2016 2017 2018
Job Market (5) Inflation (3) GDP Growth (3)
US Consumer Price Index (CPI)
US CPI Goods Less Food and Energy
US Producer Price Index (PPI) Y-o-Y %
US – GDP Y-o-Y %
Eurozone – GDP Y-o-Y %
China – GDP Y-o-Y %
0
350
2013 2014 2015 2016 2017 2018Th
ousa
nds
62%
64%
2013 2014 2015 2016 2017 2018
7.0%
15.0%
2013 2014 2015 2016 2017 2018
7.5%
12.5%
2013 2014 2015 2016 2017 2018
(0.2%)
3.0%
2013 2014 2015 2016 2017 2018
1.0%
2.5%
2013 2014 2015 2016 2017 2018
1.0%
2.5%
2013 2014 2015 2016 2017 2018
0.0%
3.0%
2013 2014 2015 2016 2017 2018
6%
8%
2013 2014 2015 2016 2017 2018
2.0%
6.0%
2013 2014 2015 2016 2017 2018
US -- Unemployment Rate
US – Non-Farm Payroll
US – Labor Participation Rate
US -- U-6 Unemployed & Margin & Part-Time as % of Labor Force & Margin
Eurozone Unemployment Rate
3%
8%
2013 2014 2015 2016 2017 2018
Job Market (5) Inflation (3) GDP Growth (3)
US Consumer Price Index (CPI)
US CPI Goods Less Food and Energy
US Producer Price Index (PPI) Y-o-Y %
US – GDP Y-o-Y %
Eurozone – GDP Y-o-Y %
China – GDP Y-o-Y %
0
350
2013 2014 2015 2016 2017 2018
Thou
sand
s
62%
64%
2013 2014 2015 2016 2017 2018
7.0%
15.0%
2013 2014 2015 2016 2017 2018
7.5%
12.5%
2013 2014 2015 2016 2017 2018
(0.2%)
3.0%
2013 2014 2015 2016 2017 2018
1.0%
2.5%
2013 2014 2015 2016 2017 2018
1.0%
2.5%
2013 2014 2015 2016 2017 2018
0.0%
3.0%
2013 2014 2015 2016 2017 2018
6%
8%
2013 2014 2015 2016 2017 2018
2.0%
6.0%
2013 2014 2015 2016 2017 2018
Source: Bloomberg (All).
“Latest Direction” is from the last “Frequency” measurement.
JOB MARKETMacro Economics Five-Year Trend
US – Unemployment Rate As of 6/30/2018
Latest Level 4.0
Change from Prior Month 0.2
Latest Direction Deteriorating
Frequency Monthly
US – Non-Farm Payroll As of 6/30/2018
Latest Level 213.0
Change from Prior Month (31.0)
Latest Direction Deteriorating
Frequency Monthly
US – Labor Participation Rate As of 6/30/2018
Latest Level 62.9
Change from Prior Month 0.2
Latest Direction Improving
Frequency Monthly
US – U-6 Unemployed & Margin & Part-Time as % of Labor Force & Margin
As of 6/30/2018
Latest Level 7.8
Change from Prior Month 0.2
Latest Direction Deteriorating
Frequency Monthly
Eurozone Unemployment Rate As of 6/30/2018
Latest Level 8.3
Change from Prior Month (0.3)
Latest Direction Improving
Frequency Quarterly
INFLATIONMacro Economics Five-Year Trend
US Consumer Price Index (CPI) Y-o-Y % As of 6/30/2018
Latest Level 2.9
Change from Prior Month 0.1
Latest Direction Increasing
Frequency Monthly
US CPI Goods Less Food and Energy Y-o-Y % As of 6/30/2018
Latest Level 2.2
Change from Prior Month 0.0
Latest Direction No Change
Frequency Monthly
US Producer Price Index (PPI) Y-o-Y % As of 6/30/2018
Latest Level 2.2
Change from Prior Month 0.1
Latest Direction Increasing
Frequency Monthly
GDP GROWTHMacro Economics Five-Year Trend
US – GDP Y-o-Y % As of 6/30/2018
Latest Level 5.4
Change from Prior Quarter 0.8
Latest Direction Improving
Frequency Quarterly
Eurozone – GDP Y-o-Y % As of 6/30/2018
Latest Level 2.1
Change from Prior Quarter (0.4)
Latest Direction Deteriorating
Frequency Quarterly
China – GDP Y-o-Y % As of 6/30/2018
Latest Level 6.7
Change from Prior Quarter (0.1)
Latest Direction Deteriorating
Frequency Quarterly
HOUSINGMacro Economics Five-Year Trend
Existing Home Sales As of 6/30/2018
Latest Level 5.4
Change from Prior Month 0.0
Latest Direction No Change
Frequency Monthly
New Home Sales As of 6/30/2018
Latest Level 631.0
Change from Prior Month (10.0)
Latest Direction Deteriorating
Frequency Monthly
Housing Starts As of 6/30/2018
Latest Level 1,173.0
Change from Prior Month (164.0)
Latest Direction Deteriorating
Frequency Monthly
Case-Shiller Index of Home Value in 20 Cities As of 5/31/2018
Latest Level 211.2
Change from Prior Month 0.8
Latest Direction Improving
Frequency Monthly

10Return to Table of Contents
ECONOMIC DASHBOARD (continued)
Housing (4) Economic and Market Confidence (8)
Existing Home Sales
New Home Sales
Housing Starts
Case-Shiller Index of Home Value in 20 Cities
Capacity Utilization as a % of Capacity
Private Fixed Investment Nonresidential SAAR
Residential Fixed Investment as a % of GDP
ISM Manufacturing Index
Manufacturing Inventory Change Q-o-Q $
Exports of Goods/Services
Shipping Rates
Personal Income Level
Michigan Consumer Confidence Sentiment
$2,250
$2,600
2013 2014 2015 2016 2017 2018
$Billi
ons
$13,000
$17,000
2013 2014 2015 2016 2017 2018
$ Billi
ons
4.0
6.0
2013 2014 2015 2016 2017 2018
Millio
ns
325
725
2013 2014 2015 2016 2017 2018
Thou
sand
s
400
1,350
2013 2014 2015 2016 2017 2018
Thou
sand
s
150
215
2013 2014 2015 2016 2017 2018
Leve
l
74%
80%
2013 2014 2015 2016 2017 2018
$2,000
$2,800
2013 2014 2015 2016 2017 2018
$ Billi
ons
2.8%
3.5%
2013 2014 2015 2016 2017 2018
46
62
2013 2014 2015 2016 2017 2018
Leve
l
($20)
$50
2013 2014 2015 2016 2017 2018
$ Billi
ons
300
2,300
2013 2014 2015 2016 2017 2018
Leve
l
70
103
2013 2014 2015 2016 2017 2018
Leve
l
Commodities (3) Rates (4) Equity (9)
WTI Crude Oil Price
Reuters/Jefferies Commodity Index
Gold
LIBOR 3M
Treasury 10 Yr Yield
Swaps 2Y vs 10Y
30 Yr Mortgage and 10 Yr Treasury
US Equity Markets – Russell 3000
US Equity – VIX
S&P 500 Percentage Exceeding Earning Estimates
S&P 500 Historical Valuation Levels
Trailing P/E on S&P 500
$20
$120
2013 2014 2015 2016 2017 2018
Price
0%
3%
2013 2014 2015 2016 2017 2018
1.0%
3.5%
2013 2014 2015 2016 2017 2018
20
275
2013 2014 2015 2016 2017 2018
bps
800
1,700
2013 2014 2015 2016 2017 2018
Leve
l
10
30
2013 2014 2015 2016 2017 2018
Leve
l
1%
4%
Jul '13 Jan '16
30-Year Mortgage
10-Year Treasury
14x
23x
2013 2014 2015 2016 2017 2018
Leve
l
7
16
11
25
2013 2014 2015 2016 2017 2018
S&P 500 P/E (LHS)
Enterprise Value / Trailing12m EBITDA (RHS)
150
330
2013 2014 2015 2016 2017 2018
Leve
l
$1,000
$1,500
2013 2014 2015 2016 2017 2018
Price
60%
80%
2013 2014 2015 2016 2017 2018
Leve
l
Commodities (3) Rates (4) Equity (9)
WTI Crude Oil Price
Reuters/Jefferies Commodity Index
Gold
LIBOR 3M
Treasury 10 Yr Yield
Swaps 2Y vs 10Y
30 Yr Mortgage and 10 Yr Treasury
US Equity Markets – Russell 3000
US Equity – VIX
S&P 500 Percentage Exceeding Earning Estimates
S&P 500 Historical Valuation Levels
Trailing P/E on S&P 500
$20
$120
2013 2014 2015 2016 2017 2018
Price
0%
3%
2013 2014 2015 2016 2017 2018
1.0%
3.5%
2013 2014 2015 2016 2017 2018
20
275
2013 2014 2015 2016 2017 2018
bps
800
1,700
2013 2014 2015 2016 2017 2018
Leve
l
10
30
2013 2014 2015 2016 2017 2018
Leve
l1%
4%
Jul '13 Jan '16
30-Year Mortgage
10-Year Treasury
14x
23x
2013 2014 2015 2016 2017 2018
Leve
l7
16
11
25
2013 2014 2015 2016 2017 2018
S&P 500 P/E (LHS)
Enterprise Value / Trailing12m EBITDA (RHS)
150
330
2013 2014 2015 2016 2017 2018
Leve
l
$1,000
$1,500
2013 2014 2015 2016 2017 2018
Price
60%
80%
2013 2014 2015 2016 2017 2018
Leve
l
Housing (4) Economic and Market Confidence (8)
Existing Home Sales
New Home Sales
Housing Starts
Case-Shiller Index of Home Value in 20 Cities
Capacity Utilization as a % of Capacity
Private Fixed Investment Nonresidential SAAR
Residential Fixed Investment as a % of GDP
ISM Manufacturing Index
Manufacturing Inventory Change Q-o-Q $
Exports of Goods/Services
Shipping Rates
Personal Income Level
Michigan Consumer Confidence Sentiment
$2,250
$2,600
2013 2014 2015 2016 2017 2018
$Billi
ons
$13,000
$17,000
2013 2014 2015 2016 2017 2018
$ Billi
ons
4.0
6.0
2013 2014 2015 2016 2017 2018
Millio
ns
325
725
2013 2014 2015 2016 2017 2018
Thou
sand
s
400
1,350
2013 2014 2015 2016 2017 2018
Thou
sand
s
150
215
2013 2014 2015 2016 2017 2018
Leve
l
74%
80%
2013 2014 2015 2016 2017 2018
$2,000
$2,800
2013 2014 2015 2016 2017 2018
$ Billi
ons
2.8%
3.5%
2013 2014 2015 2016 2017 2018
46
62
2013 2014 2015 2016 2017 2018
Leve
l
($20)
$50
2013 2014 2015 2016 2017 2018
$ Billi
ons
300
2,300
2013 2014 2015 2016 2017 2018
Leve
l70
103
2013 2014 2015 2016 2017 2018Le
vel
Housing (4) Economic and Market Confidence (8)
Existing Home Sales
New Home Sales
Housing Starts
Case-Shiller Index of Home Value in 20 Cities
Capacity Utilization as a % of Capacity
Private Fixed Investment Nonresidential SAAR
Residential Fixed Investment as a % of GDP
ISM Manufacturing Index
Manufacturing Inventory Change Q-o-Q $
Exports of Goods/Services
Shipping Rates
Personal Income Level
Michigan Consumer Confidence Sentiment
$2,250
$2,600
2013 2014 2015 2016 2017 2018
$Billi
ons
$13,000
$17,000
2013 2014 2015 2016 2017 2018
$ Billi
ons
4.0
6.0
2013 2014 2015 2016 2017 2018
Millio
ns
325
725
2013 2014 2015 2016 2017 2018
Thou
sand
s
400
1,350
2013 2014 2015 2016 2017 2018
Thou
sand
s
150
215
2013 2014 2015 2016 2017 2018
Leve
l
74%
80%
2013 2014 2015 2016 2017 2018
$2,000
$2,800
2013 2014 2015 2016 2017 2018
$ Billi
ons
2.8%
3.5%
2013 2014 2015 2016 2017 2018
46
62
2013 2014 2015 2016 2017 2018
Leve
l
($20)
$50
2013 2014 2015 2016 2017 2018
$ Billi
ons
300
2,300
2013 2014 2015 2016 2017 2018
Leve
l
70
103
2013 2014 2015 2016 2017 2018
Leve
l
Housing (4) Economic and Market Confidence (8)
Existing Home Sales
New Home Sales
Housing Starts
Case-Shiller Index of Home Value in 20 Cities
Capacity Utilization as a % of Capacity
Private Fixed Investment Nonresidential SAAR
Residential Fixed Investment as a % of GDP
ISM Manufacturing Index
Manufacturing Inventory Change Q-o-Q $
Exports of Goods/Services
Shipping Rates
Personal Income Level
Michigan Consumer Confidence Sentiment
$2,250
$2,600
2013 2014 2015 2016 2017 2018
$Billi
ons
$13,000
$17,000
2013 2014 2015 2016 2017 2018
$ Billi
ons
4.0
6.0
2013 2014 2015 2016 2017 2018
Millio
ns
325
725
2013 2014 2015 2016 2017 2018
Thou
sand
s
400
1,350
2013 2014 2015 2016 2017 2018
Thou
sand
s
150
215
2013 2014 2015 2016 2017 2018
Leve
l
74%
80%
2013 2014 2015 2016 2017 2018
$2,000
$2,800
2013 2014 2015 2016 2017 2018$ B
illion
s
2.8%
3.5%
2013 2014 2015 2016 2017 2018
46
62
2013 2014 2015 2016 2017 2018
Leve
l
($20)
$50
2013 2014 2015 2016 2017 2018
$ Billi
ons
300
2,300
2013 2014 2015 2016 2017 2018
Leve
l
70
103
2013 2014 2015 2016 2017 2018
Leve
lHousing (4) Economic and Market Confidence (8)
Existing Home Sales
New Home Sales
Housing Starts
Case-Shiller Index of Home Value in 20 Cities
Capacity Utilization as a % of Capacity
Private Fixed Investment Nonresidential SAAR
Residential Fixed Investment as a % of GDP
ISM Manufacturing Index
Manufacturing Inventory Change Q-o-Q $
Exports of Goods/Services
Shipping Rates
Personal Income Level
Michigan Consumer Confidence Sentiment
$2,250
$2,600
2013 2014 2015 2016 2017 2018
$Billi
ons
$13,000
$17,000
2013 2014 2015 2016 2017 2018
$ Billi
ons
4.0
6.0
2013 2014 2015 2016 2017 2018
Millio
ns
325
725
2013 2014 2015 2016 2017 2018
Thou
sand
s
400
1,350
2013 2014 2015 2016 2017 2018
Thou
sand
s
150
215
2013 2014 2015 2016 2017 2018
Leve
l
74%
80%
2013 2014 2015 2016 2017 2018
$2,000
$2,800
2013 2014 2015 2016 2017 2018
$ Billi
ons
2.8%
3.5%
2013 2014 2015 2016 2017 2018
46
62
2013 2014 2015 2016 2017 2018
Leve
l
($20)
$50
2013 2014 2015 2016 2017 2018
$ Billi
ons
300
2,300
2013 2014 2015 2016 2017 2018
Leve
l
70
103
2013 2014 2015 2016 2017 2018
Leve
l
Housing (4) Economic and Market Confidence (8)
Existing Home Sales
New Home Sales
Housing Starts
Case-Shiller Index of Home Value in 20 Cities
Capacity Utilization as a % of Capacity
Private Fixed Investment Nonresidential SAAR
Residential Fixed Investment as a % of GDP
ISM Manufacturing Index
Manufacturing Inventory Change Q-o-Q $
Exports of Goods/Services
Shipping Rates
Personal Income Level
Michigan Consumer Confidence Sentiment
$2,250
$2,600
2013 2014 2015 2016 2017 2018
$Billi
ons
$13,000
$17,000
2013 2014 2015 2016 2017 2018
$ Billi
ons
4.0
6.0
2013 2014 2015 2016 2017 2018
Millio
ns
325
725
2013 2014 2015 2016 2017 2018
Thou
sand
s
400
1,350
2013 2014 2015 2016 2017 2018
Thou
sand
s
150
215
2013 2014 2015 2016 2017 2018
Leve
l
74%
80%
2013 2014 2015 2016 2017 2018
$2,000
$2,800
2013 2014 2015 2016 2017 2018
$ Billi
ons
2.8%
3.5%
2013 2014 2015 2016 2017 2018
46
62
2013 2014 2015 2016 2017 2018
Leve
l
($20)
$50
2013 2014 2015 2016 2017 2018
$ Billi
ons
300
2,300
2013 2014 2015 2016 2017 2018
Leve
l
70
103
2013 2014 2015 2016 2017 2018
Leve
l
ECONOMIC & MARKET CONFIDENCEMacro Economics Five-Year Trend
Capacity Utilization as a % of Capacity As of 6/30/2018
Latest Level 78.0
Change from Prior Month 0.3
Latest Direction Improving
Frequency Monthly
Private Fixed Investment Nonresidential SAAR As of 6/30/2018
Latest Level 2,782.5
Change from Prior Month 62.2
Latest Direction Improving
Frequency Quarterly
Residential Fixed Investment as a % of GDP As of 6/30/2018
Latest Level 3.3
Change from Prior Month 0.0
Latest Direction No Change
Frequency Quarterly
ISM Manufacturing Index As of 6/30/2018
Latest Level 60.2
Change from Prior Month 1.5
Latest Direction Improving
Frequency Monthly
Manufacturing Inventory Change Q-o-Q $ As of 6/30/2018
Latest Level (15.2)
Change from Prior Month (4.4)
Latest Direction Decreasing
Frequency Quarterly
Exports of Goods/Services As of 6/30/2018
Latest Level 2,574
Change from Prior Month 56
Latest Direction Improving
Frequency Quarterly
Shipping Rates As of 6/30/2018
Latest Level 1,385
Change from Prior Month 295
Latest Direction Improving
Frequency Quarterly
Personal Income Level As of 6/30/2018
Latest Level 17,572
Change from Prior Month 138
Latest Direction Improving
Frequency Monthly
Michigan Consumer Confidence Sentiment As of 6/30/2018
Latest Level 98.2
Change from Prior Month 0.2
Latest Direction Improving
Frequency Monthly
COMMODITIESMacro Economics Five-Year Trend
WTI Crude Oil Price As of 6/30/2018
Latest Level 74.2
Change from Prior Quarter 7.1
Latest Direction Increasing
Frequency Monthly
Reuters/Jefferies Commodity Index As of 6/30/2018
Latest Level 200.4
Change from Prior Quarter (2.5)
Latest Direction Decreasing
Frequency Monthly
Gold As of 6/30/2018
Latest Level 1,252.6
Change from Prior Quarter (45.9)
Latest Direction Decreasing
Frequency Monthly
RATESMacro Economics Five-Year Trend
LIBOR 3M As of 6/30/2018
Latest Level 2.34
Change from Prior Quarter 0.01
Latest Direction Increasing
Frequency Monthly
Treasury 10 Yr Yield As of 6/30/2018
Latest Level 2.86
Change from Prior Quarter 0.0
Latest Direction No Change
Frequency Monthly
Swaps 2Y vs. 10Y As of 6/30/2018
Latest Level 14.30
Change from Prior Quarter (7.41)
Latest Direction Flattening
Frequency Monthly
30 Yr Mortgage and 10 Yr Treasury As of 6/30/2018
Source: Bloomberg (All).
“Latest Direction” is from the last “Frequency” measurement.
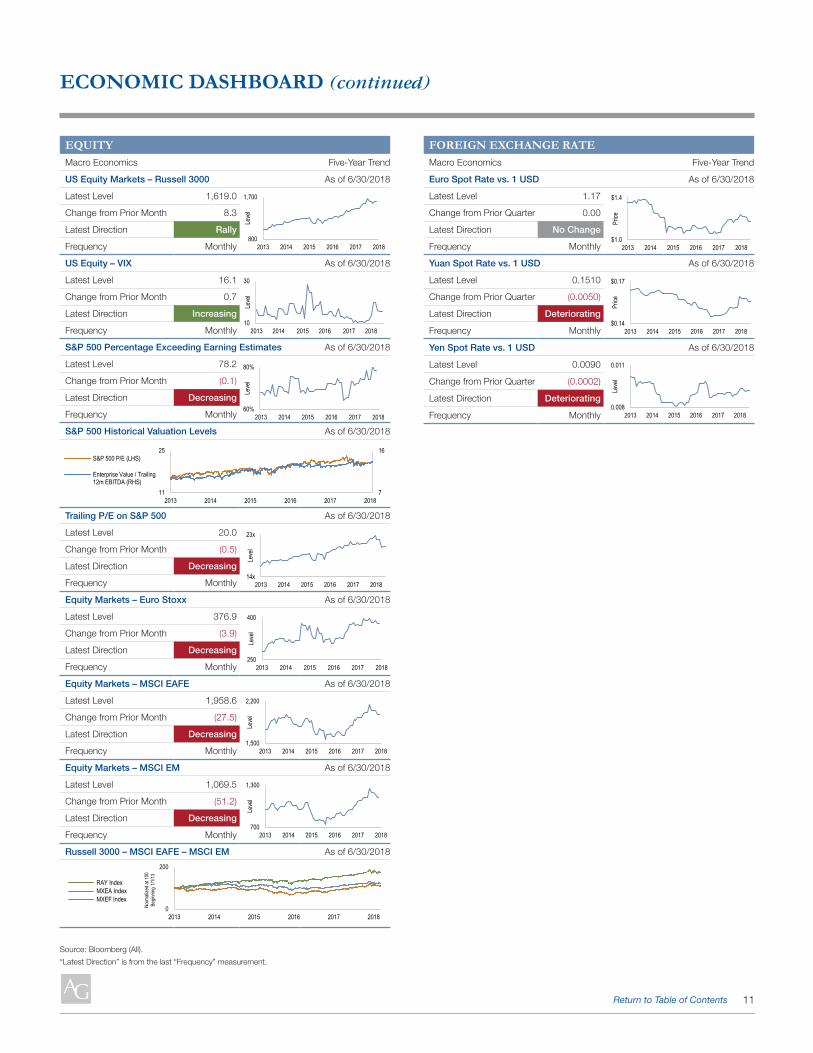
11Return to Table of Contents
Source: Bloomberg (All).
“Latest Direction” is from the last “Frequency” measurement.
ECONOMIC DASHBOARD (continued)
Commodities (3) Rates (4) Equity (9)
WTI Crude Oil Price
Reuters/Jefferies Commodity Index
Gold
LIBOR 3M
Treasury 10 Yr Yield
Swaps 2Y vs 10Y
30 Yr Mortgage and 10 Yr Treasury
US Equity Markets – Russell 3000
US Equity – VIX
S&P 500 Percentage Exceeding Earning Estimates
S&P 500 Historical Valuation Levels
Trailing P/E on S&P 500
$20
$120
2013 2014 2015 2016 2017 2018
Price
0%
3%
2013 2014 2015 2016 2017 2018
1.0%
3.5%
2013 2014 2015 2016 2017 2018
20
275
2013 2014 2015 2016 2017 2018
bps
800
1,700
2013 2014 2015 2016 2017 2018Le
vel
10
30
2013 2014 2015 2016 2017 2018
Leve
l
1%
4%
Jul '13 Jan '16
30-Year Mortgage
10-Year Treasury
14x
23x
2013 2014 2015 2016 2017 2018
Leve
l
7
16
11
25
2013 2014 2015 2016 2017 2018
S&P 500 P/E (LHS)
Enterprise Value / Trailing12m EBITDA (RHS)
150
330
2013 2014 2015 2016 2017 2018
Leve
l
$1,000
$1,500
2013 2014 2015 2016 2017 2018
Price
60%
80%
2013 2014 2015 2016 2017 2018
Leve
l
Commodities (3) Rates (4) Equity (9)
WTI Crude Oil Price
Reuters/Jefferies Commodity Index
Gold
LIBOR 3M
Treasury 10 Yr Yield
Swaps 2Y vs 10Y
30 Yr Mortgage and 10 Yr Treasury
US Equity Markets – Russell 3000
US Equity – VIX
S&P 500 Percentage Exceeding Earning Estimates
S&P 500 Historical Valuation Levels
Trailing P/E on S&P 500
$20
$120
2013 2014 2015 2016 2017 2018
Price
0%
3%
2013 2014 2015 2016 2017 2018
1.0%
3.5%
2013 2014 2015 2016 2017 2018
20
275
2013 2014 2015 2016 2017 2018
bps
800
1,700
2013 2014 2015 2016 2017 2018
Leve
l
10
30
2013 2014 2015 2016 2017 2018
Leve
l
1%
4%
Jul '13 Jan '16
30-Year Mortgage
10-Year Treasury
14x
23x
2013 2014 2015 2016 2017 2018
Leve
l
7
16
11
25
2013 2014 2015 2016 2017 2018
S&P 500 P/E (LHS)
Enterprise Value / Trailing12m EBITDA (RHS)
150
330
2013 2014 2015 2016 2017 2018
Leve
l
$1,000
$1,500
2013 2014 2015 2016 2017 2018
Price
60%
80%
2013 2014 2015 2016 2017 2018
Leve
l
Commodities (3) Rates (4) Equity (9)
WTI Crude Oil Price
Reuters/Jefferies Commodity Index
Gold
LIBOR 3M
Treasury 10 Yr Yield
Swaps 2Y vs 10Y
30 Yr Mortgage and 10 Yr Treasury
US Equity Markets – Russell 3000
US Equity – VIX
S&P 500 Percentage Exceeding Earning Estimates
S&P 500 Historical Valuation Levels
Trailing P/E on S&P 500
$20
$120
2013 2014 2015 2016 2017 2018
Price
0%
3%
2013 2014 2015 2016 2017 2018
1.0%
3.5%
2013 2014 2015 2016 2017 2018
20
275
2013 2014 2015 2016 2017 2018
bps
800
1,700
2013 2014 2015 2016 2017 2018
Leve
l10
30
2013 2014 2015 2016 2017 2018Le
vel
1%
4%
Jul '13 Jan '16
30-Year Mortgage
10-Year Treasury
14x
23x
2013 2014 2015 2016 2017 2018
Leve
l
7
16
11
25
2013 2014 2015 2016 2017 2018
S&P 500 P/E (LHS)
Enterprise Value / Trailing12m EBITDA (RHS)
150
330
2013 2014 2015 2016 2017 2018
Leve
l
$1,000
$1,500
2013 2014 2015 2016 2017 2018
Price
60%
80%
2013 2014 2015 2016 2017 2018
Leve
l
Equity (9) Foreign Exchange Rate (3)
Equity Markets – Euro Stoxx
Equity Markets – MSCI EAFE
Equity Markets – MSCI EM
Russell 3000 – MSCI EAFE – MSCI EM
Euro Spot Rate vs. 1 USD
Yuan Spot Rate vs. 1 USD
Yen Spot Rate vs. 1 USD
250
400
2013 2014 2015 2016 2017 2018
Leve
l
$1.0
$1.4
2013 2014 2015 2016 2017 2018
Price
0
200
2013 2014 2015 2016 2017 2018
Norm
alize
d at
100
Begin
ning
1/1/
13
RAY IndexMXEA IndexMXEF Index
700
1,300
2013 2014 2015 2016 2017 2018
Leve
l
1,500
2,200
2013 2014 2015 2016 2017 2018
Leve
l
$0.14
$0.17
2013 2014 2015 2016 2017 2018
Price
0.008
0.011
2013 2014 2015 2016 2017 2018
Leve
l
Equity (9) Foreign Exchange Rate (3)
Equity Markets – Euro Stoxx
Equity Markets – MSCI EAFE
Equity Markets – MSCI EM
Russell 3000 – MSCI EAFE – MSCI EM
Euro Spot Rate vs. 1 USD
Yuan Spot Rate vs. 1 USD
Yen Spot Rate vs. 1 USD
250
400
2013 2014 2015 2016 2017 2018
Leve
l
$1.0
$1.4
2013 2014 2015 2016 2017 2018
Price
0
200
2013 2014 2015 2016 2017 2018
Norm
alize
d at
100
Begin
ning
1/1/
13
RAY IndexMXEA IndexMXEF Index
700
1,300
2013 2014 2015 2016 2017 2018
Leve
l1,500
2,200
2013 2014 2015 2016 2017 2018
Leve
l
$0.14
$0.17
2013 2014 2015 2016 2017 2018
Price
0.008
0.011
2013 2014 2015 2016 2017 2018
Leve
l
Equity (9) Foreign Exchange Rate (3)
Equity Markets – Euro Stoxx
Equity Markets – MSCI EAFE
Equity Markets – MSCI EM
Russell 3000 – MSCI EAFE – MSCI EM
Euro Spot Rate vs. 1 USD
Yuan Spot Rate vs. 1 USD
Yen Spot Rate vs. 1 USD
250
400
2013 2014 2015 2016 2017 2018
Leve
l
$1.0
$1.4
2013 2014 2015 2016 2017 2018
Price
0
200
2013 2014 2015 2016 2017 2018
Norm
alize
d at
100
Begin
ning
1/1/
13
RAY IndexMXEA IndexMXEF Index
700
1,300
2013 2014 2015 2016 2017 2018
Leve
l
1,500
2,200
2013 2014 2015 2016 2017 2018Le
vel
$0.14
$0.17
2013 2014 2015 2016 2017 2018
Price
0.008
0.011
2013 2014 2015 2016 2017 2018
Leve
l
Equity (9) Foreign Exchange Rate (3)
Equity Markets – Euro Stoxx
Equity Markets – MSCI EAFE
Equity Markets – MSCI EM
Russell 3000 – MSCI EAFE – MSCI EM
Euro Spot Rate vs. 1 USD
Yuan Spot Rate vs. 1 USD
Yen Spot Rate vs. 1 USD
250
400
2013 2014 2015 2016 2017 2018
Leve
l
$1.0
$1.4
2013 2014 2015 2016 2017 2018
Price
0
200
2013 2014 2015 2016 2017 2018
Norm
alize
d at
100
Begin
ning
1/1/
13
RAY IndexMXEA IndexMXEF Index
700
1,300
2013 2014 2015 2016 2017 2018
Leve
l
1,500
2,200
2013 2014 2015 2016 2017 2018
Leve
l
$0.14
$0.17
2013 2014 2015 2016 2017 2018
Price
0.008
0.011
2013 2014 2015 2016 2017 2018
Leve
l
Commodities (3) Rates (4) Equity (9)
WTI Crude Oil Price
Reuters/Jefferies Commodity Index
Gold
LIBOR 3M
Treasury 10 Yr Yield
Swaps 2Y vs 10Y
30 Yr Mortgage and 10 Yr Treasury
US Equity Markets – Russell 3000
US Equity – VIX
S&P 500 Percentage Exceeding Earning Estimates
S&P 500 Historical Valuation Levels
Trailing P/E on S&P 500
$20
$120
2013 2014 2015 2016 2017 2018
Price
0%
3%
2013 2014 2015 2016 2017 2018
1.0%
3.5%
2013 2014 2015 2016 2017 2018
20
275
2013 2014 2015 2016 2017 2018
bps
800
1,700
2013 2014 2015 2016 2017 2018
Leve
l
10
30
2013 2014 2015 2016 2017 2018
Leve
l
1%
4%
Jul '13 Jan '16
30-Year Mortgage
10-Year Treasury
14x
23x
2013 2014 2015 2016 2017 2018
Leve
l
7
16
11
25
2013 2014 2015 2016 2017 2018
S&P 500 P/E (LHS)
Enterprise Value / Trailing12m EBITDA (RHS)
150
330
2013 2014 2015 2016 2017 2018
Leve
l
$1,000
$1,500
2013 2014 2015 2016 2017 2018
Price
60%
80%
2013 2014 2015 2016 2017 2018
Leve
l
EQUITYMacro Economics Five-Year Trend
US Equity Markets – Russell 3000 As of 6/30/2018
Latest Level 1,619.0
Change from Prior Month 8.3
Latest Direction Rally
Frequency Monthly
US Equity – VIX As of 6/30/2018
Latest Level 16.1
Change from Prior Month 0.7
Latest Direction Increasing
Frequency Monthly
S&P 500 Percentage Exceeding Earning Estimates As of 6/30/2018
Latest Level 78.2
Change from Prior Month (0.1)
Latest Direction Decreasing
Frequency Monthly
S&P 500 Historical Valuation Levels As of 6/30/2018
Trailing P/E on S&P 500 As of 6/30/2018
Latest Level 20.0
Change from Prior Month (0.5)
Latest Direction Decreasing
Frequency Monthly
Equity Markets – Euro Stoxx As of 6/30/2018
Latest Level 376.9
Change from Prior Month (3.9)
Latest Direction Decreasing
Frequency Monthly
Equity Markets – MSCI EAFE As of 6/30/2018
Latest Level 1,958.6
Change from Prior Month (27.5)
Latest Direction Decreasing
Frequency Monthly
Equity Markets – MSCI EM As of 6/30/2018
Latest Level 1,069.5
Change from Prior Month (51.2)
Latest Direction Decreasing
Frequency Monthly
Russell 3000 – MSCI EAFE – MSCI EM As of 6/30/2018
FOREIGN EXCHANGE RATEMacro Economics Five-Year Trend
Euro Spot Rate vs. 1 USD As of 6/30/2018
Latest Level 1.17
Change from Prior Quarter 0.00
Latest Direction No Change
Frequency Monthly
Yuan Spot Rate vs. 1 USD As of 6/30/2018
Latest Level 0.1510
Change from Prior Quarter (0.0050)
Latest Direction Deteriorating
Frequency Monthly
Yen Spot Rate vs. 1 USD As of 6/30/2018
Latest Level 0.0090
Change from Prior Quarter (0.0002)
Latest Direction Deteriorating
Frequency Monthly
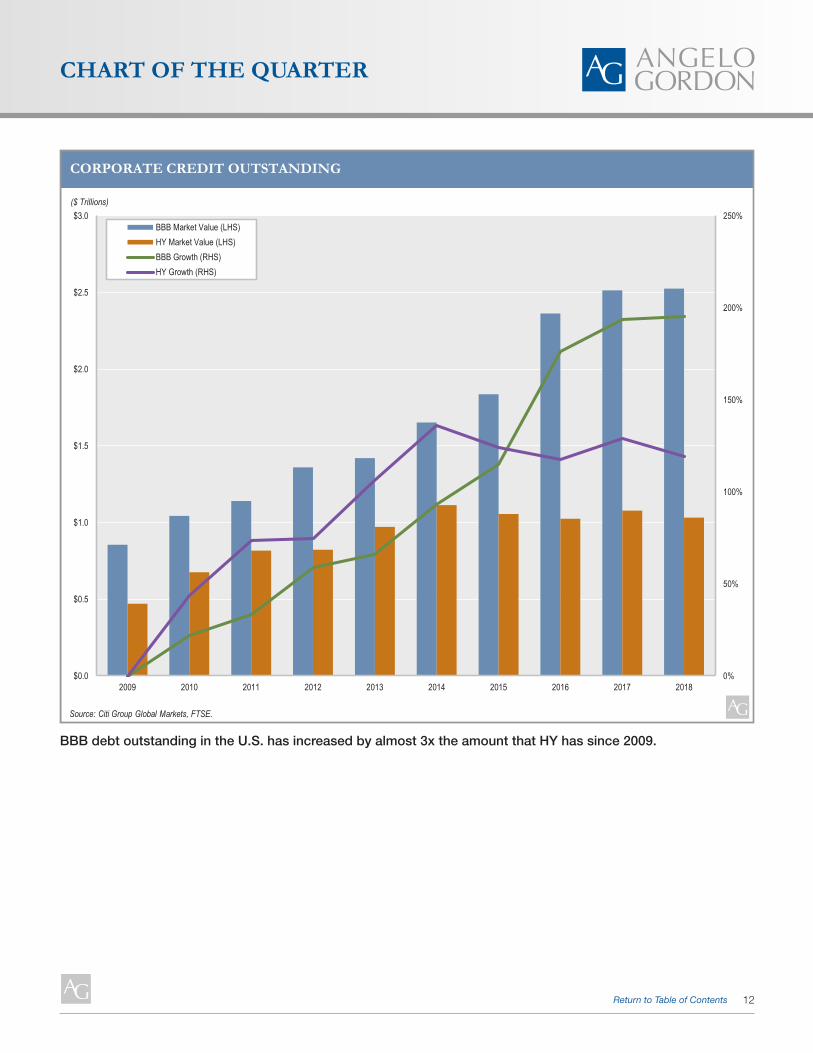
12Return to Table of Contents
BBB debt outstanding in the U.S. has increased by almost 3x the amount that HY has since 2009.
Source: Citi Group Global Markets, FTSE.
0%
50%
100%
150%
200%
250%
$0.0
$0.5
$1.0
$1.5
$2.0
$2.5
$3.0
2009 2010 2011 2012 2013 2014 2015 2016 2017 2018
BBB Market Value (LHS)HY Market Value (LHS)BBB Growth (RHS)HY Growth (RHS)
CORPORATE CREDIT OUTSTANDING
($ Trillions)
CHART OF THE QUARTER

13Return to Table of Contents
INVESTMENT STRATEGIES
PERFORMING CREDIT
Positive flows into loan funds continued in the second quarter; inflows YTD have reached nearly $12 billion.
1403Approved
($8)
($6)
($4)
($2)
$0
$2
$4
$6
$8
2015 2016 2017 2018
ETF Flows
Actively Managed
LEVERAGED LOAN FUND FLOWS
($ Billions)
Source: J.P. Morgan.
Although gross issuance declined in the first six months of the year net issuance has been strong, with June marking the highest month on record.
0%
20%
40%
60%
80%
100%
120%
$0
$25
$50
$75
$100
$125
2011 2012 2013 2014 2015 2016 2017 2018
Refinancing (LHS) New Money (LHS) New Money Share (RHS)
U.S. INSTITUTIONAL LOAN ISSUANCE
1409Approved
Source: Thomson Reuters LPC.
Share of New MoneyIssuance ($ Billions)

14Return to Table of Contents
PERFORMING CREDIT (continued)
The percent of loans trading above par dropped significantly during the quarter.
Despite the aforementioned drop in loans trading above par, 75% of the loan market still trades at or above $99.5.
45%
50%
55%
60%
65%
70%
75%
80%
85%
90%
98.0
98.2
98.4
98.6
98.8
99.0
99.2
99.4
99.6
Jun '17 Sep '17 Dec '17 Mar '18 Jun '18
Leveraged loan index (LHS)% of Loan index trading $100 or higher (RHS)
LOANS TRADING ABOVE PAR
1416Approved
Source: J.P. Morgan.
1.1% 2.1%
7.8%5.5%
8.4%
29.8%
45.2%
0%
5%
10%
15%
20%
25%
30%
35%
40%
45%
50%
JPM
Leve
rage
d Lo
an In
dex
LEVERAGED LOAN PRICE BUCKETS
1417Approved
Source: J.P. Morgan.
Gross CLO issuance in Q2 of over $86 billion was the highest on record.
$0
$5
$10
$15
$20
$25
$30
$35
Jun '14 Dec '14 Jun '15 Dec '15 Jun '16 Dec '16 Jun '17 Dec '17 Jun '18
Refinancing US CLO Volume
US CLO Volume ex. Refinancings
MONTHLY CLO ISSUANCE
1412Approved
Source: J.P. Morgan and S&P LCD.
($ Billions)
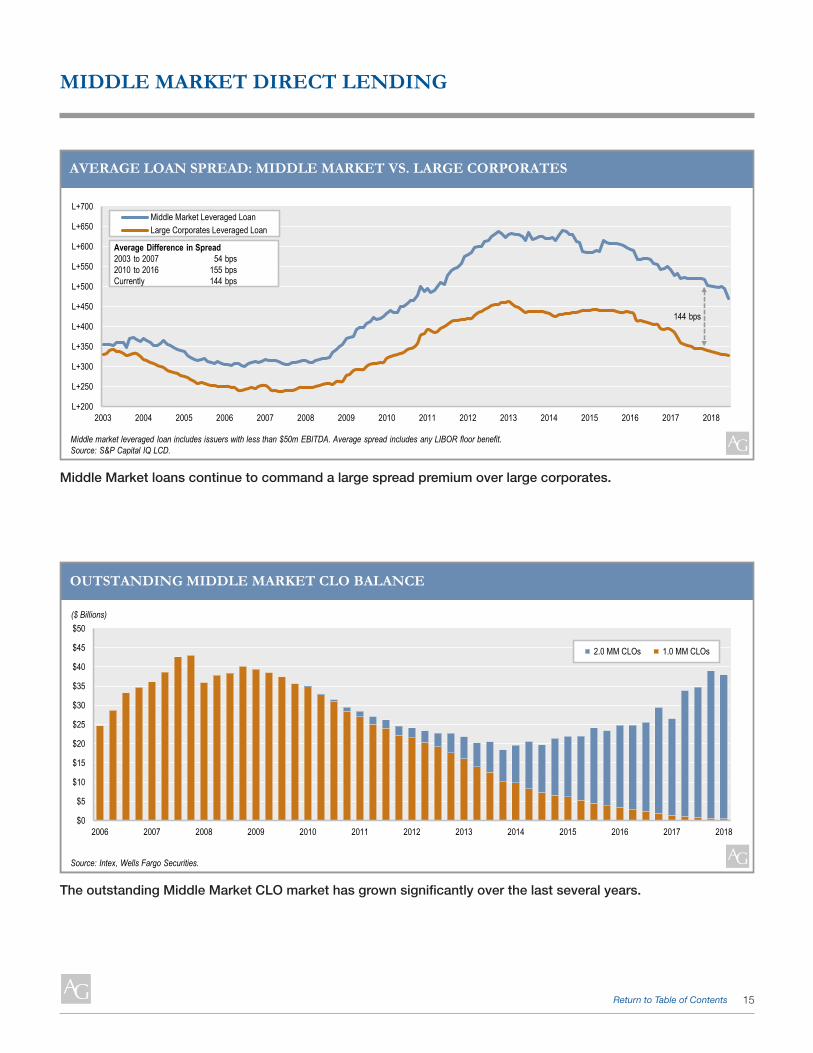
15Return to Table of Contents
MIDDLE MARKET DIRECT LENDING
Middle Market loans continue to command a large spread premium over large corporates.
L+200
L+250
L+300
L+350
L+400
L+450
L+500
L+550
L+600
L+650
L+700
2003 2004 2005 2006 2007 2008 2009 2010 2011 2012 2013 2014 2015 2016 2017 2018
Middle Market Leveraged LoanLarge Corporates Leveraged Loan
AVERAGE LOAN SPREAD: MIDDLE MARKET VS. LARGE CORPORATES
Average Difference in Spread 2003 to 2007 54 bps 2010 to 2016 155 bps Currently 144 bps
144 bps
600Approved
Middle market leveraged loan includes issuers with less than $50m EBITDA. Average spread includes any LIBOR floor benefit.Source: S&P Capital IQ LCD.
The outstanding Middle Market CLO market has grown significantly over the last several years.
604Approved
$0
$5
$10
$15
$20
$25
$30
$35
$40
$45
$50
2006 2007 2008 2009 2010 2011 2012 2013 2014 2015 2016 2017 2018
2.0 MM CLOs 1.0 MM CLOs
OUTSTANDING MIDDLE MARKET CLO BALANCE
($ Billions)
Source: Intex, Wells Fargo Securities.
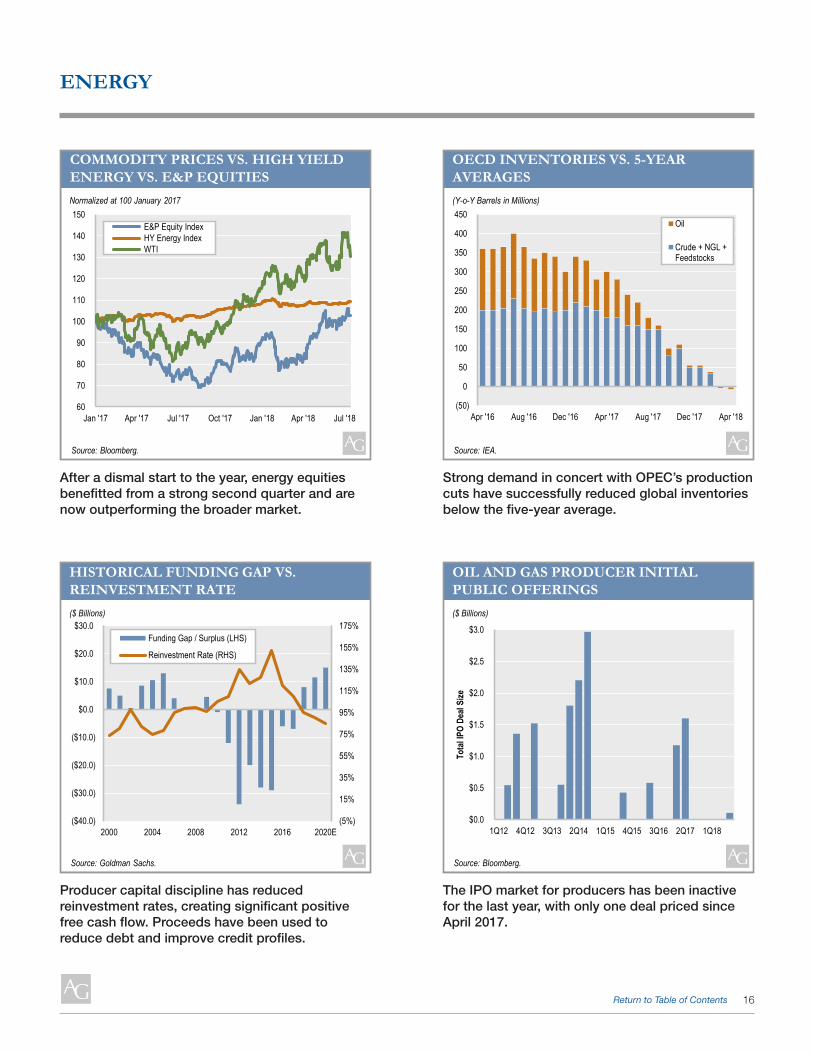
16Return to Table of Contents
Producer capital discipline has reduced reinvestment rates, creating significant positive free cash flow. Proceeds have been used to reduce debt and improve credit profiles.
The IPO market for producers has been inactive for the last year, with only one deal priced since April 2017.
(5%)
15%
35%
55%
75%
95%
115%
135%
155%
175%
($40.0)
($30.0)
($20.0)
($10.0)
$0.0
$10.0
$20.0
$30.0
2000 2004 2008 2012 2016 2020E
Funding Gap / Surplus (LHS)
Reinvestment Rate (RHS)
HISTORICAL FUNDING GAP VS. REINVESTMENT RATE
1333Approved
Source: Goldman Sachs.
($ Billions)
1336Approved
$0.0
$0.5
$1.0
$1.5
$2.0
$2.5
$3.0
1Q12 4Q12 3Q13 2Q14 1Q15 4Q15 3Q16 2Q17 1Q18
Tota
l IPO
Deal
Size
OIL AND GAS PRODUCER INITIAL PUBLIC OFFERINGS
Source: Bloomberg.
($ Billions)
ENERGY
After a dismal start to the year, energy equities benefitted from a strong second quarter and are now outperforming the broader market.
Strong demand in concert with OPEC’s production cuts have successfully reduced global inventories below the five-year average.
60
70
80
90
100
110
120
130
140
150
Jan '17 Apr '17 Jul '17 Oct '17 Jan '18 Apr '18 Jul '18
E&P Equity Index HY Energy Index WTI
COMMODITY PRICES VS. HIGH YIELD ENERGY VS. E&P EQUITIES
1008Approved
Source: Bloomberg.
Normalized at 100 January 2017
(50)
0
50
100
150
200
250
300
350
400
450
Apr '16 Aug '16 Dec '16 Apr '17 Aug '17 Dec '17 Apr '18
Oil
Crude + NGL +Feedstocks
OECD INVENTORIES VS. 5-YEAR AVERAGES
1330Approved
Source: IEA.
(Y-o-Y Barrels in Millions)
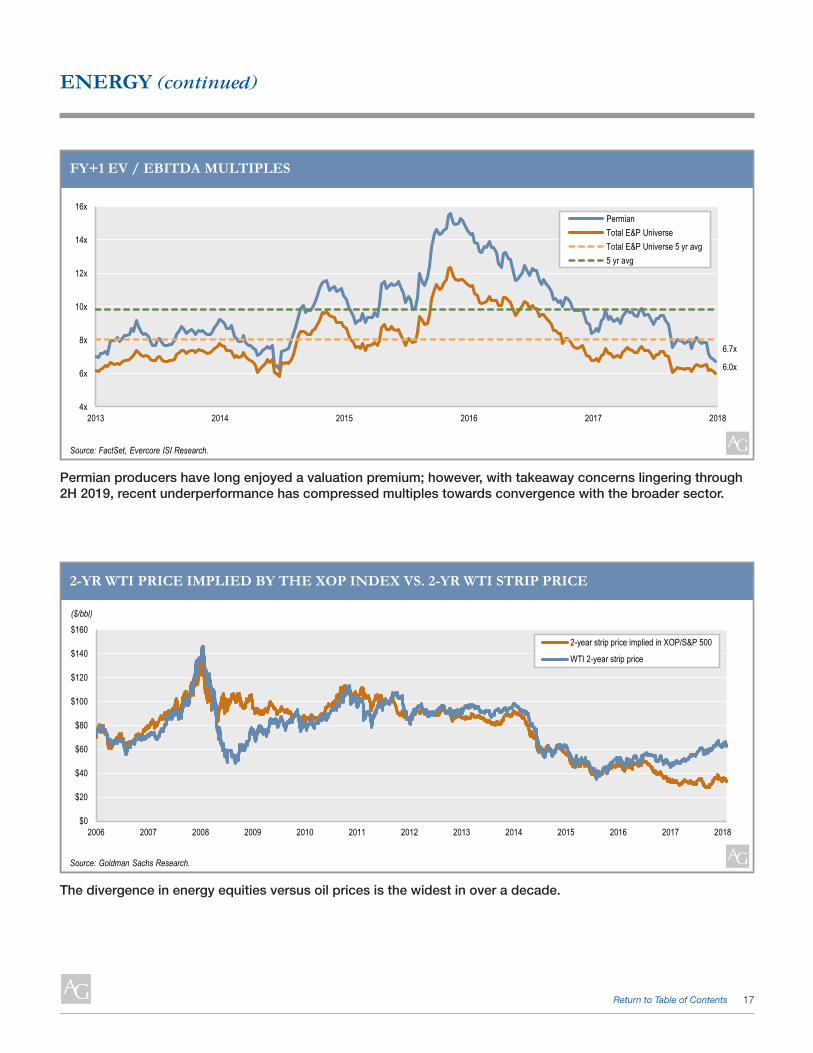
17Return to Table of Contents
ENERGY (continued)
4x
6x
8x
10x
12x
14x
16x
2013 2014 2015 2016 2017 2018
PermianTotal E&P UniverseTotal E&P Universe 5 yr avg5 yr avg
FY+1 EV / EBITDA MULTIPLES
1335Approved
Source: FactSet, Evercore ISI Research.
6.7x
6.0x
The divergence in energy equities versus oil prices is the widest in over a decade.
$0
$20
$40
$60
$80
$100
$120
$140
$160
2006 2007 2008 2009 2010 2011 2012 2013 2014 2015 2016 2017 2018
2-year strip price implied in XOP/S&P 500
WTI 2-year strip price
1337Approved
2-YR WTI PRICE IMPLIED BY THE XOP INDEX VS. 2-YR WTI STRIP PRICE
Source: Goldman Sachs Research.
($/bbl)
Permian producers have long enjoyed a valuation premium; however, with takeaway concerns lingering through 2H 2019, recent underperformance has compressed multiples towards convergence with the broader sector.

18Return to Table of Contents
Capital structure seniority appears to be incorrectly compensated.
Rate-conscious buyers have an insatiable appetite for floating risk.
6001Approved
(150)
(50)
50
150
250
350
2008 2010 2012 2014 2016 2018
HY Cash vs. Leveraged Loan Spreads
STRUCTURAL SENIORITY IS MISPRICED
Source: Bloomberg, S&P Capital IQ LCD.
Differential (bps)
6002Approved
$750
$1,000
$1,250
$1,500
$1,750
$2,000
$2,250
$2,500
$2,750
$200
$300
$400
$500
$600
$700
$800
$900
2010 2012 2014 2016 2018
High Yield (LHS)Investment Grade (RHS)
U.S. DEBT OUTSTANDING
Source: Goldman Sachs Securities Division.
($ Billions) ($ Billions)
DISTRESSED DEBT – UNITED STATES
Covenant quality is worsening by the year. Interest coverage will seemingly continue to deteriorate as rates rise and debt remains outstanding.
6003Approved
3.263.55
3.68 3.69 3.794.07
0%
10%
20%
30%
40%
50%
60%
70%
80%
90%
100%1.0
1.5
2.0
2.5
3.0
3.5
4.0
4.5
5.0
2012 2013 2014 2015 2016 2017
Overal Loan Covenant Quality Scores (LHS)
Cov-Lite % (RHS)
COVENANT QUALITY IS WORSENING
Source: Moody’s Investors Service, Thomson Reuters LPC.
6004Approved
1.0x
1.2x
1.4x
1.6x
1.8x
2.0x
2.2x
2.4x
2.6x2.4x
2.6x
2.8x
3.0x
3.2x
3.4x
3.6x
3.8x
4.0x
1998 2002 2006 2010 2014 2018
High Yield Net Leverage (LHS)HY Interest Coverage Ratio (RHS)
NET LEVERAGE ON HIGHS; INTEREST RATE COVERAGE WILL DETERIORATE
Source: Goldman Sachs.
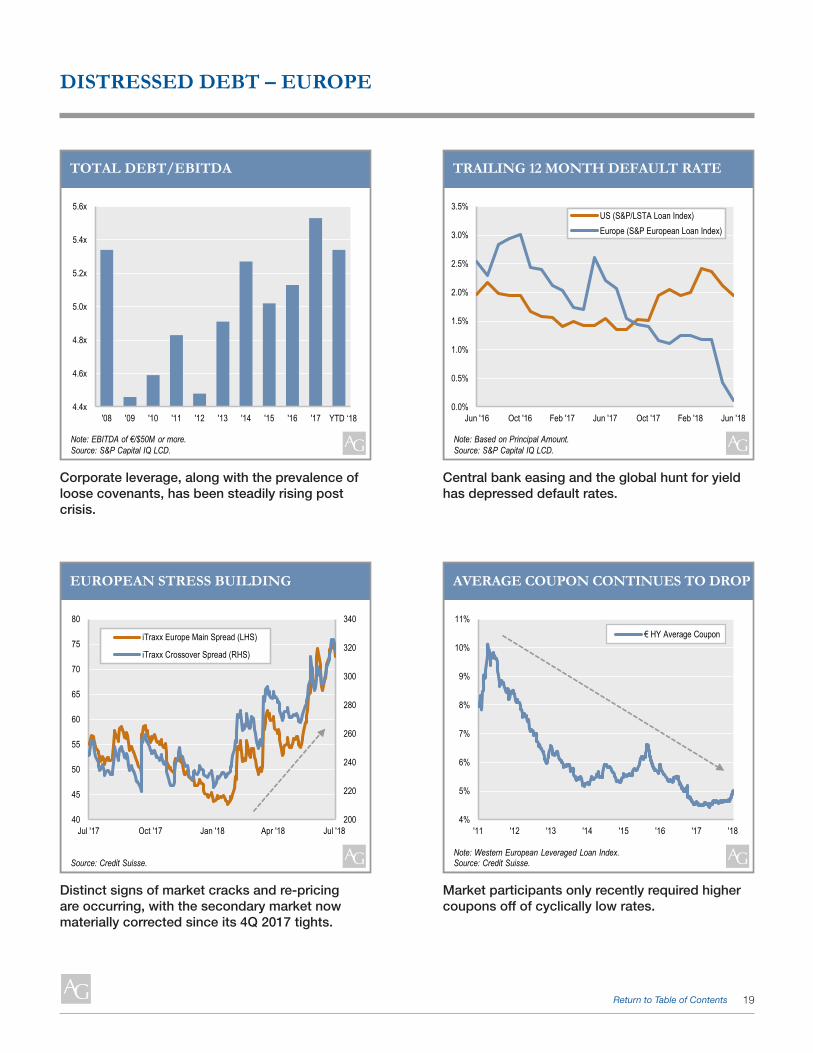
19Return to Table of Contents
Corporate leverage, along with the prevalence of loose covenants, has been steadily rising post crisis.
Central bank easing and the global hunt for yield has depressed default rates.
5001
4.4x
4.6x
4.8x
5.0x
5.2x
5.4x
5.6x
'08 '09 '10 '11 '12 '13 '14 '15 '16 '17 '18
TOTAL DEBT/EBITDA
Note: EBITDA of €/$50M or more.Source: S&P Capital IQ LCD.
YTD ‘18
Approved5002
Approved
0.0%
0.5%
1.0%
1.5%
2.0%
2.5%
3.0%
3.5%
Jun '16 Oct '16 Feb '17 Jun '17 Oct '17 Feb '18 Jun '18
US (S&P/LSTA Loan Index)Europe (S&P European Loan Index)
TRAILING 12 MONTH DEFAULT RATE
Note: Based on Principal Amount.Source: S&P Capital IQ LCD.
DISTRESSED DEBT – EUROPE
Distinct signs of market cracks and re-pricing are occurring, with the secondary market now materially corrected since its 4Q 2017 tights.
Market participants only recently required higher coupons off of cyclically low rates.
5003Approved
200
220
240
260
280
300
320
340
40
45
50
55
60
65
70
75
80
Jul '17 Oct '17 Jan '18 Apr '18 Jul '18
iTraxx Europe Main Spread (LHS)
iTraxx Crossover Spread (RHS)
EUROPEAN STRESS BUILDING
Source: Credit Suisse.
5004Approved
4%
5%
6%
7%
8%
9%
10%
11%
'11 '12 '13 '14 '15 '16 '17 '18
€ HY Average Coupon
Note: Western European Leveraged Loan Index.
AVERAGE COUPON CONTINUES TO DROP
Source: Credit Suisse.
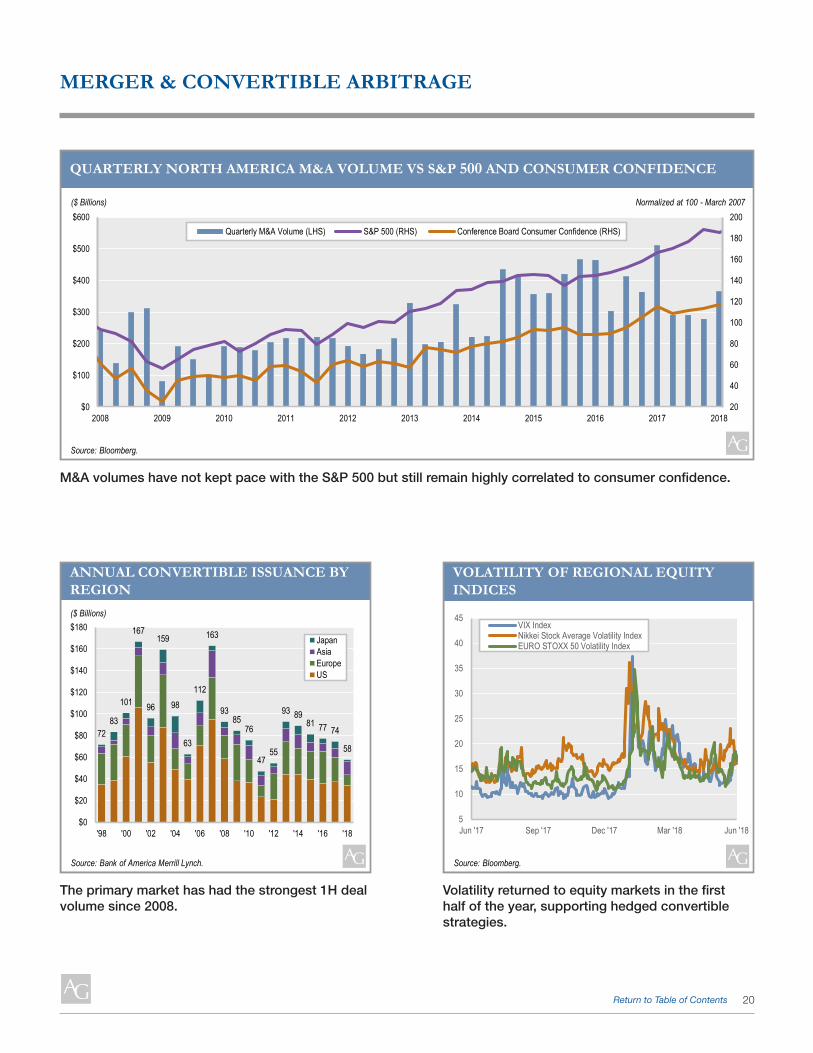
20Return to Table of Contents
MERGER & CONVERTIBLE ARBITRAGE
M&A volumes have not kept pace with the S&P 500 but still remain highly correlated to consumer confidence.
20
40
60
80
100
120
140
160
180
200
2008 2009 2010 2011 2012 2013 2014 2015 2016 2017 2018$0
$100
$200
$300
$400
$500
$600Quarterly M&A Volume (LHS) S&P 500 (RHS) Conference Board Consumer Confidence (RHS)
QUARTERLY NORTH AMERICA M&A VOLUME VS S&P 500 AND CONSUMER CONFIDENCE
Normalized at 100 - March 2007
59Approved
Source: Bloomberg.
($ Billions)
The primary market has had the strongest 1H deal volume since 2008.
Volatility returned to equity markets in the first half of the year, supporting hedged convertible strategies.
7283
101
167
96
159
98
63
112
163
9385
76
4755
93 8981 77 74
58
$0
$20
$40
$60
$80
$100
$120
$140
$160
$180
'98 '00 '02 '04 '06 '08 '10 '12 '14 '16 '18
JapanAsiaEuropeUS
ANNUAL CONVERTIBLE ISSUANCE BY REGION($ Billions)
515Approved
Source: Bank of America Merrill Lynch.
5
10
15
20
25
30
35
40
45
Jun '17 Sep '17 Dec '17 Mar '18 Jun '18
VIX IndexNikkei Stock Average Volatility IndexEURO STOXX 50 Volatility Index
VOLATILITY OF REGIONAL EQUITY INDICES
518Approved
Source: Bloomberg.
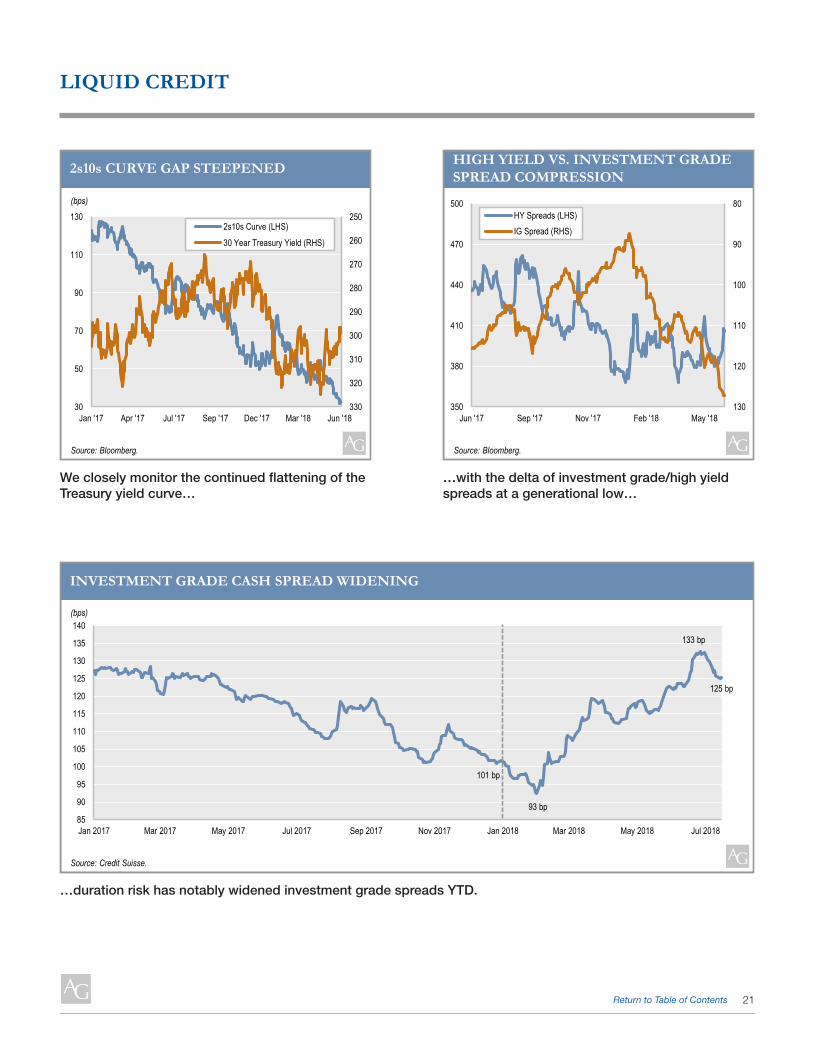
21Return to Table of Contents
LIQUID CREDIT
…duration risk has notably widened investment grade spreads YTD.
4008Approved
101 bp
93 bp
133 bp
125 bp
85
90
95
100
105
110
115
120
125
130
135
140
Jan 2017 Mar 2017 May 2017 Jul 2017 Sep 2017 Nov 2017 Jan 2018 Mar 2018 May 2018 Jul 2018
INVESTMENT GRADE CASH SPREAD WIDENING
Source: Credit Suisse.
(bps)
We closely monitor the continued flattening of the Treasury yield curve…
…with the delta of investment grade/high yield spreads at a generational low…
4007Approved
250
260
270
280
290
300
310
320
33030
50
70
90
110
130
Jan '17 Apr '17 Jul '17 Sep '17 Dec '17 Mar '18 Jun '18
2s10s Curve (LHS)
30 Year Treasury Yield (RHS)
2s10s CURVE GAP STEEPENED
Source: Bloomberg.
(bps)
4009Approved
80
90
100
110
120
130350
380
410
440
470
500
Jun '17 Sep '17 Nov '17 Feb '18 May '18
HY Spreads (LHS)IG Spread (RHS)
HIGH YIELD VS. INVESTMENT GRADE SPREAD COMPRESSION
Source: Bloomberg.

22Return to Table of Contents
The availability of riskier mortgage products, like negative amortization loans and interest only loans, has all but disappeared.
Although mortgage credit availability has picked up in recent years, it remains very tight by historical standards.
0
2
4
6
8
10
12
14
16
18
1998 2001 2004 2007 2011 2014 2017
Borrower RiskProduct Risk
3015Approved
LENDER RISK AT HISTORIC LOWS
Source: Urban Institute.
3016Approved
MBA MORTGAGE CREDIT AVAILABILITY INDEX
0
100
200
300
400
500
600
700
800
900
1,000
'04 '06 '08 '10 '12 '14 '16 '18
Tight
Left chart March 2012 = 100.Source: Bloomberg.
80
100
120
140
160
180
200
'11 '12 '14 '16 '18
RESIDENTIAL AND CONSUMER DEBT (RMBS/ABS)
Tight supply supports higher home prices. New issue is on track to meet or exceed 2017 levels.
0
2
4
6
8
10
12
14
16'05 '06 '07 '08 '09 '10 '11 '12 '13 '14 '15 '16 '17 '18
(16)
(12)
(8)
(4)
0
4
8
12
16
Case-Shiller YoY (%, 6mo lag, RHS)Months Supply (inv, LHS)
THE HOUSING MARKET
3010Approved
Source: 1010data, CoreLogic, Case Shiller, Zillow, Urban Institute, Bloomberg, National Association of Realtors.
$0
$50
$100
$150
$200
$250
$300
Jan Feb Mar Apr May Jun Jul Aug Sep Oct Nov Dec
2017 ABS 2018 ABS
RMBS AND ABS NEW ISSUE
3014Approved
Source: BofA Merrill Lynch Global Research, Intex, Bloomberg.
($ Billions)
2017 ABS
2017 RMBS
2018 ABS
2018 RMBS

23Return to Table of Contents
The overall CMBS market is over $1 trillion in size. Non-conduit refinancings and acquisition loans represent the majority of loans securitized in CMBS deals.
2019Approved
Legacy Conduit $31bn
Conduit 2.0/3.0 $309bn
SASB$122bn
Other Private Label $5bn
FNMA $268bn
Freddie $221bn
GNMA $100bn
Agency Other $38bn
Source: BofA Merrill Lynch Global Research, Intex.
U.S. CMBS OUTSTANDING
1H '13 1H '14 1H '15 1H '16 1H '17 1H '180%
10%20%30%40%50%60%70%80%90%
100%
% Non-conduit Refi% Previously Securitized% Acquisition
SOURCES OF COLLATERAL
2020Approved
Source: BofA Merrill Lynch Global Research, Intex, deal documents
CMBS supply in 2018 is expected to meet or exceed last year’s total.
CMBS issuance remained strong in Q2, with single borrower deals continuing to represent a large share of issuance for the fourth consecutive quarter.
2018
$0
$50
$100
$150
$200
$250
$300
2000 2003 2006 2009 2012 2015 2018E
OtherSASBConduitAgency CMBS
CMBS SUPPLY
Source: BofA Merrill Lynch Global Research, Intex.
Approved
($ Billions)
$0
$5
$10
$15
$20
$25
$30
$35
Q1 '14 Q1 '15 Q1 '16 Q1 '17 Q1 '18
OtherFloaterSingle borrowerConduit
QUARTERLY PRIVATE LABEL ISSUANCE
2017Approved
Source: Credit Suisse, Commercial Mortgage Alert.
($ Billions)
COMMERCIAL REAL ESTATE DEBT (CMBS)

24Return to Table of Contents
NET LEASE REAL ESTATE
Office cap rates have started to flatten and retail cap rates have increased, while industrial continues to compress.
5.5%
6.0%
6.5%
7.0%
7.5%
8.0%
8.5%
9.0%
Q2 '06 Q2 '07 Q2 '08 Q2 '09 Q2 '10 Q2 '11 Q2 '12 Q2 '13 Q2 '14 Q2 '15 Q2 '16 Q2 '17 Q2 '18
U.S. Single-Tenant OfficeU.S. Single-Tenant IndustrialU.S. Single-Tenant Retail
AVERAGE SINGLE-TENANT CAP RATES
66Approved
Source: Real Capital Analytics.
Office and retail volumes declined.
$0
$5
$10
$15
$20
$25
$30
Q2 '06 Q2 '07 Q2 '08 Q2 '09 Q2 '10 Q2 '11 Q2 '12 Q2 '13 Q2 '14 Q2 '15 Q2 '16 Q2 '17 Q2 '18
U.S. Single-Tenant OfficeU.S. Single-Tenant IndustrialU.S. Single-Tenant Retail
12-MONTH ROLLING SINGLE-TENANT DEAL VOLUME
($ Billions)
67Approved
Source: Real Capital Analytics.

25Return to Table of Contents
REAL ESTATE – UNITED STATES
Price indices show differing results, with core asset values remaining flat while broader market values continue to increase; the performance of property sectors continues to diverge as well, as industrial and apartment assets continue to increase, while office and retail property values stagnate or fall.
20
40
60
80
100
120
140
160
180
2001 2002 2003 2004 2005 2006 2007 2008 2009 2010 2011 2012 2014 2015 2016 2017 2018
Moody's/RCA CPPI - Major Markets (all trades over $2.5M)Moody's/RCA CPPI - Non-Major Markets (all trades over $2.5M)Green Street CPPI (proxy for core assets)
COMMERCIAL REAL ESTATE PRICE INDICES
32Approved
Source: Moody’s CPPI = Moody’s/RCA All Property Types.Green Street CPPI = Major Sectors.Sources: Moody’s – Commercial Property Price Index (Moody’s CPPI) (data through April ’15), Green Street Advisors – Commercial Property Price Index (Green St CPPI)(data through May ’15). Note: For this chart, Green St CPPI was indexed to 100 at it's 2007 peak (Aug 2007) and Moody’s CPPI was indexed at 100 in Dec 2006.Note: Major markets include Boston, Chicago, Washington D.C. Metro, Los Angeles Metro, New York City Metro and San Francisco Metro.
(Index)
Real estate remains fairly-priced relative to high yield bonds; real estate’s spread to investment grade bonds has narrowed as yields for Baa Corporates increased significantly year-to-date. A reversion to the historical spread between real estate returns and Baa Corporate yields would require a decrease in property prices.
22%
406Approved
Real Estate IRRs is an equal-weighted average of the asset-weighted averages for the five major property sectors (apartment, industrial, mall, office, and strip center.Source: Green Street Advisors (Mar’ 17), Moody’s (Baa Corporates), BAML (High-Yield Bonds).
0%
2%
4%
6%
8%
10%
12%
14%
2001 2002 2003 2004 2005 2006 2007 2008 2009 2010 2011 2012 2013 2014 2015 2016 2017 2018
Real Estate IRRs
Baa Corporates
High Yield Bond
UNLEVERED TOTAL RETURN EXPECTATIONS ON REAL ESTATE VS. CORPORATE BOND YIELDS

26Return to Table of Contents
Office completions projected to peak in 2018, with new deliveries providing a wider range of options for tenants; positive absorption will maintain a stable overall vacancy rate. Rising labor and materials costs may call into question the feasibility of some of the out-year deliveries.
-100
-80
-60
-40
-20
0
20
40
60
80
'05 '06 '07 '08 '09 '10 '11 '12 '13 '14 '15 '16 17 '18E '19E '20E '21E
Completion Absorption
926Approved
Source: REIS, J.P. Morgan.
OFFICE COMPLETIONS OUTPACING ABSORPTION
(mm sq. ft.)
REAL ESTATE – UNITED STATES (continued)
Forecasts for vacancy rates remain largely unchanged, with continued strong demand for industrial due to changing consumer preferences and slight expansion of apartment vacancy due to new supply.
Rental growth remains largely steady and positive for all property types, reflecting moderate new supply on an overall basis.
4%
6%
8%
10%
12%
14%
16%
18%
20%
'01 '04 '07 '10 '13 '16 '19E '22E
Industrial OfficeApartments Retail
VACANCY RATES STEADY
923Approved
Source: REIS, J.P. Morgan.
(10%)
(5%)
0%
5%
10%
15%
'07 '10 '13 '16 '19E '22E
Industrial OfficeApartments Retail
RENTAL GROWTH STEADY
924Approved
Source: REIS, J.P. Morgan.

27Return to Table of Contents
REAL ESTATE – EUROPE
Eurozone unemployment rate at 8.4%, its lowest since December 2008.
521Approved
7%
8%
9%
10%
11%
12%
13%
2008 2009 2010 2011 2012 2013 2014 2015 2016 2017 2018(500)
(300)
(100)
100
300
500EZ Change in unemployment (RHS)EZ Unemployment Rate (LHS)
EUROZONE UNEMPLOYMENT
(Thousands)
Source: Thomson Reuters, Markit, Capital Economics.
Outlook for consumption remains bright, though household spending growth slowed in Q2.
Gap in bond yields expected to widen as U.S. continues tightening and Treasury yield rises.
(3.0)
(2.0)
(1.0)
0.0
1.0
2.0
3.0
4.0
(30)
(25)
(20)
(15)
(10)
(5)
0
5
2010 2011 2012 2013 2014 2015 2016 2017 2018
EC ConsumerConfidence (LHS)HouseholdSpending (RHS)
520Approved
EUROZONE CONSUMER CONFIDENCE AND SPENDING
Source: Thomson Reuters, Capital Economics.
(% Y-o-Y)
526Approved
(0.5%)
0.0%
0.5%
1.0%
1.5%
2.0%
2.5%
3.0%
3.5%
4.0%
2011 2012 2013 2014 2015 2016 2017 2018
U.S. 10 Year Yield
10 Year Bund Yield
GOVERNMENT BOND YIELDS IN GERMANY AND THE U.S.
Source: Bloomberg.
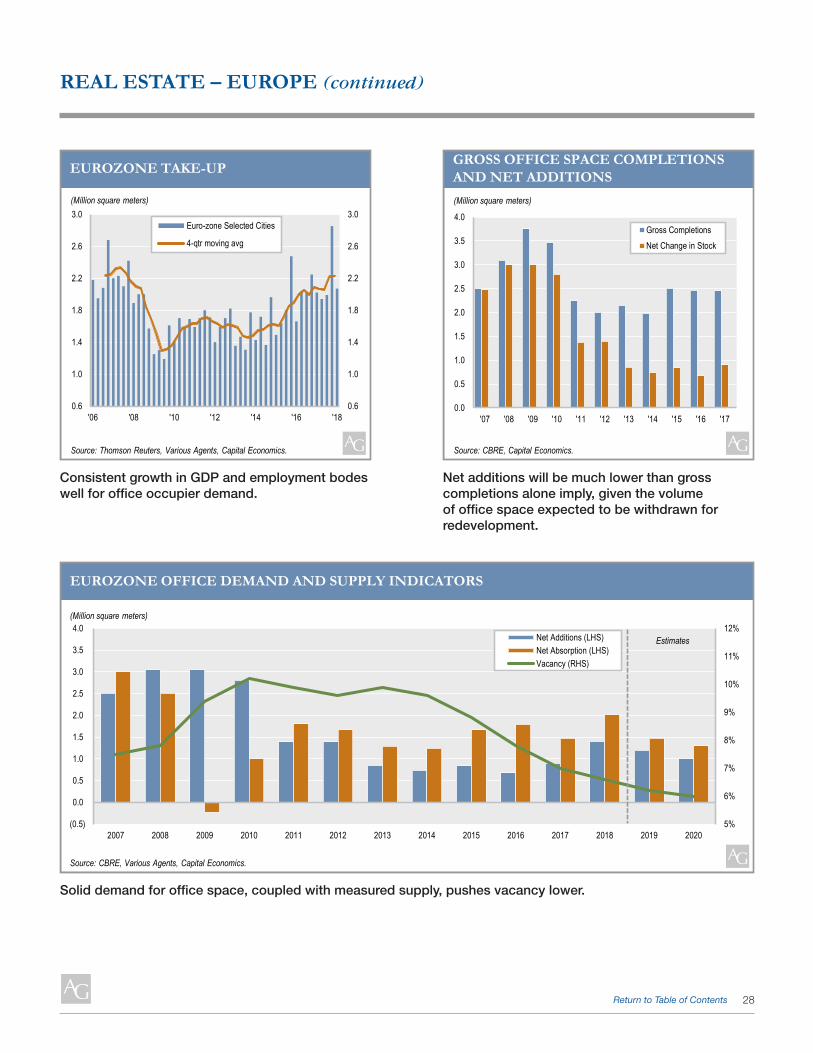
28Return to Table of Contents
Consistent growth in GDP and employment bodes well for office occupier demand.
Net additions will be much lower than gross completions alone imply, given the volume of office space expected to be withdrawn for redevelopment.
525Approved
0.6
1.0
1.4
1.8
2.2
2.6
3.0
0.6
1.0
1.4
1.8
2.2
2.6
3.0
'06 '08 '10 '12 '14 '16 '18
Euro-zone Selected Cities
4-qtr moving avg
Source: Thomson Reuters, Various Agents, Capital Economics.
(Million square meters)
EUROZONE TAKE-UP
523Approved
0.0
0.5
1.0
1.5
2.0
2.5
3.0
3.5
4.0
'07 '08 '09 '10 '11 '12 '13 '14 '15 '16 '17
Gross CompletionsNet Change in Stock
Source: CBRE, Capital Economics.
(Million square meters)
GROSS OFFICE SPACE COMPLETIONS AND NET ADDITIONS
REAL ESTATE – EUROPE (continued)
Solid demand for office space, coupled with measured supply, pushes vacancy lower.
524Approved
5%
6%
7%
8%
9%
10%
11%
12%
(0.5)
0.0
0.5
1.0
1.5
2.0
2.5
3.0
3.5
4.0
2007 2008 2009 2010 2011 2012 2013 2014 2015 2016 2017 2018 2019 2020
Net Additions (LHS)Net Absorption (LHS)Vacancy (RHS)
EUROZONE OFFICE DEMAND AND SUPPLY INDICATORS
Source: CBRE, Various Agents, Capital Economics.
(Million square meters)
Estimates
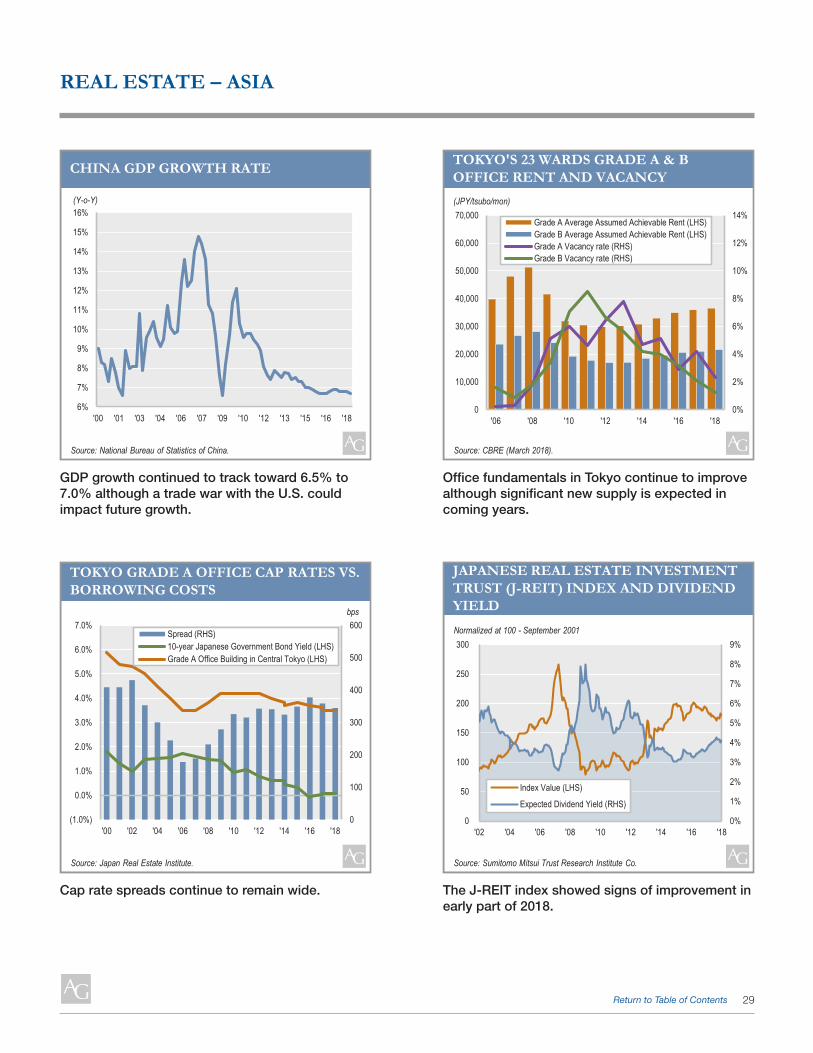
29Return to Table of Contents
REAL ESTATE – ASIA
Cap rate spreads continue to remain wide. The J-REIT index showed signs of improvement in early part of 2018.
0
100
200
300
400
500
600
(1.0%)
0.0%
1.0%
2.0%
3.0%
4.0%
5.0%
6.0%
7.0%
'00 '02 '04 '06 '08 '10 '12 '14 '16 '18
Spread (RHS)10-year Japanese Government Bond Yield (LHS)Grade A Office Building in Central Tokyo (LHS)
TOKYO GRADE A OFFICE CAP RATES VS. BORROWING COSTS
bps
43Approved
Source: Japan Real Estate Institute.
0%
1%
2%
3%
4%
5%
6%
7%
8%
9%
0
50
100
150
200
250
300
'02 '04 '06 '08 '10 '12 '14 '16 '18
Index Value (LHS)
Expected Dividend Yield (RHS)
JAPANESE REAL ESTATE INVESTMENT TRUST (J-REIT) INDEX AND DIVIDEND YIELD Normalized at 100 - September 2001
44Approved
Source: Sumitomo Mitsui Trust Research Institute Co.
GDP growth continued to track toward 6.5% to 7.0% although a trade war with the U.S. could impact future growth.
Office fundamentals in Tokyo continue to improve although significant new supply is expected in coming years.
6%
7%
8%
9%
10%
11%
12%
13%
14%
15%
16%
'00 '01 '03 '04 '06 '07 '09 '10 '12 '13 '15 '16 '18
CHINA GDP GROWTH RATE
(Y-o-Y)
39Approved
Source: National Bureau of Statistics of China.
0%
2%
4%
6%
8%
10%
12%
14%
0
10,000
20,000
30,000
40,000
50,000
60,000
70,000
'06 '08 '10 '12 '14 '16 '18
Grade A Average Assumed Achievable Rent (LHS)Grade B Average Assumed Achievable Rent (LHS)Grade A Vacancy rate (RHS)Grade B Vacancy rate (RHS)
TOKYO'S 23 WARDS GRADE A & B OFFICE RENT AND VACANCY
41Ready for Review
Source: CBRE (March 2018).
(JPY/tsubo/mon)
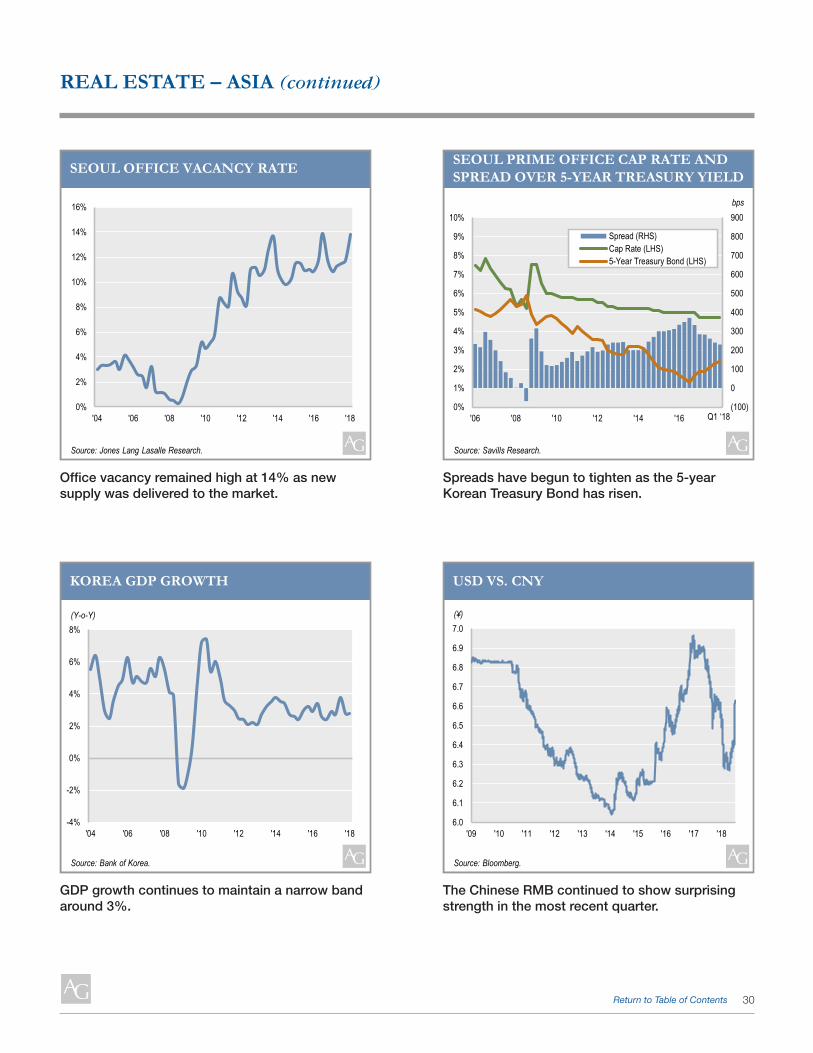
30Return to Table of Contents
REAL ESTATE – ASIA (continued)
GDP growth continues to maintain a narrow band around 3%.
The Chinese RMB continued to show surprising strength in the most recent quarter.
-4%
-2%
0%
2%
4%
6%
8%
'04 '06 '08 '10 '12 '14 '16 '18
KOREA GDP GROWTH
(Y-o-Y)
48Approved
Source: Bank of Korea.
6.0
6.1
6.2
6.3
6.4
6.5
6.6
6.7
6.8
6.9
7.0
'09 '10 '11 '12 '13 '14 '15 '16 '17 '18
USD VS. CNY
Source: Bloomberg.
(¥)
103ApprovedOffice vacancy remained high at 14% as new
supply was delivered to the market.Spreads have begun to tighten as the 5-year Korean Treasury Bond has risen.
0%
2%
4%
6%
8%
10%
12%
14%
16%
'04 '06 '08 '10 '12 '14 '16 '18
SEOUL OFFICE VACANCY RATE
45Approved
Source: Jones Lang Lasalle Research.
(100)
0
100
200
300
400
500
600
700
800
900
0%
1%
2%
3%
4%
5%
6%
7%
8%
9%
10%
'06 '08 '10 '12 '14 '16
Spread (RHS)Cap Rate (LHS)5-Year Treasury Bond (LHS)
SEOUL PRIME OFFICE CAP RATE AND SPREAD OVER 5-YEAR TREASURY YIELD
bps
Q1 ‘18
46Approved
Source: Savills Research.
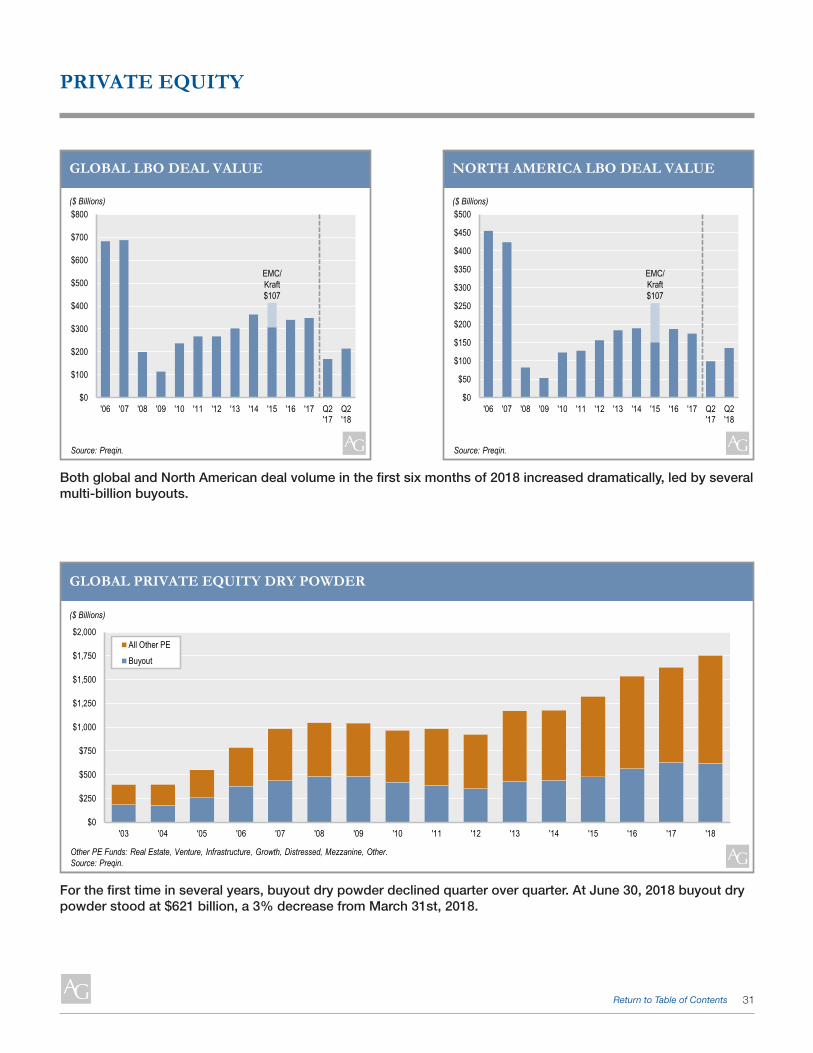
31Return to Table of Contents
Both global and North American deal volume in the first six months of 2018 increased dramatically, led by several multi-billion buyouts.
$0
$100
$200
$300
$400
$500
$600
$700
$800
'06 '07 '08 '09 '10 '11 '12 '13 '14 '15 '16 '17 Q2'17
Q2'18
GLOBAL LBO DEAL VALUE
28Approved
Source: Preqin.
($ Billions)
EMC/Kraft $107
$0
$50
$100
$150
$200
$250
$300
$350
$400
$450
$500
'06 '07 '08 '09 '10 '11 '12 '13 '14 '15 '16 '17 Q2'17
Q2'18
NORTH AMERICA LBO DEAL VALUE
EMC/Kraft $107
28BApproved
Source: Preqin.
($ Billions)
PRIVATE EQUITY
For the first time in several years, buyout dry powder declined quarter over quarter. At June 30, 2018 buyout dry powder stood at $621 billion, a 3% decrease from March 31st, 2018.
$0
$250
$500
$750
$1,000
$1,250
$1,500
$1,750
$2,000
'03 '04 '05 '06 '07 '08 '09 '10 '11 '12 '13 '14 '15 '16 '17 '18
All Other PEBuyout
GLOBAL PRIVATE EQUITY DRY POWDER
($ Billions)
29Approved
Other PE Funds: Real Estate, Venture, Infrastructure, Growth, Distressed, Mezzanine, Other.Source: Preqin.
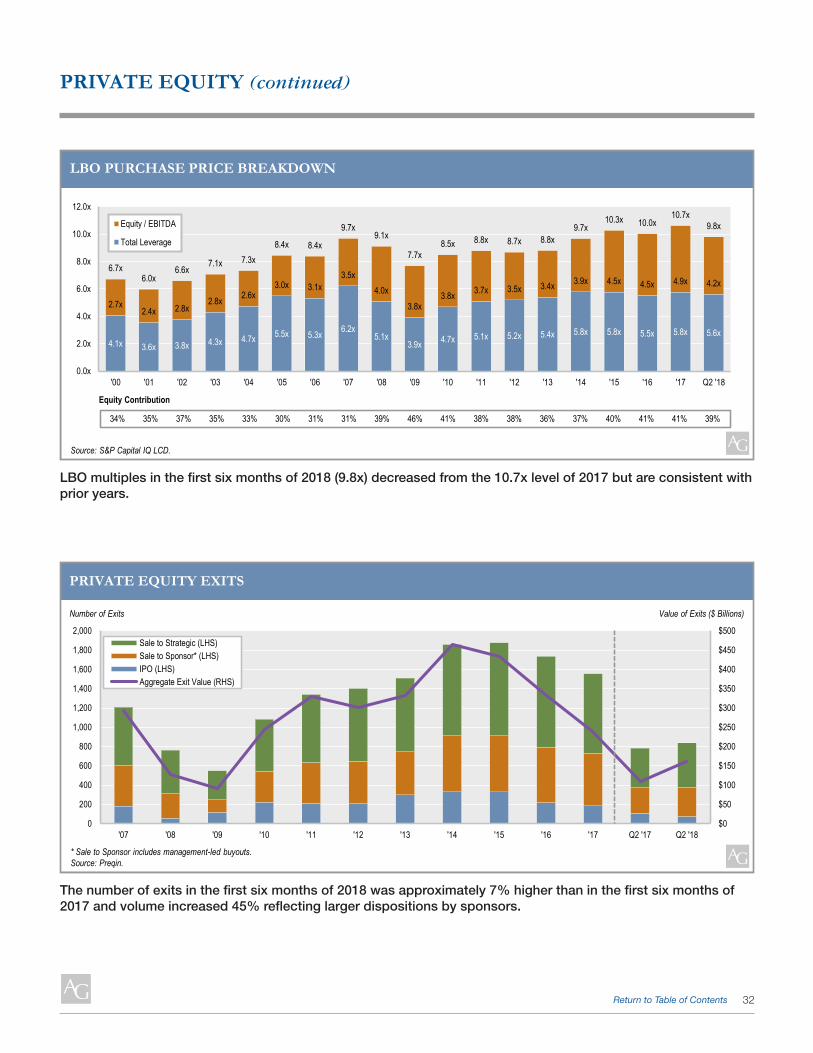
32Return to Table of Contents
PRIVATE EQUITY (continued)
LBO multiples in the first six months of 2018 (9.8x) decreased from the 10.7x level of 2017 but are consistent with prior years.
4.1x 3.6x 3.8x 4.3x 4.7x 5.5x 5.3x 6.2x5.1x
3.9x 4.7x 5.1x 5.2x 5.4x 5.8x 5.8x 5.5x 5.8x 5.6x
2.7x2.4x 2.8x
2.8x 2.6x3.0x 3.1x
3.5x4.0x
3.8x3.8x 3.7x 3.5x 3.4x 3.9x 4.5x 4.5x 4.9x 4.2x
6.7x6.0x
6.6x7.1x 7.3x
8.4x 8.4x
9.7x9.1x
7.7x8.5x 8.8x 8.7x 8.8x
9.7x10.3x 10.0x
10.7x9.8x
0.0x
2.0x
4.0x
6.0x
8.0x
10.0x
12.0x
'00 '01 '02 '03 '04 '05 '06 '07 '08 '09 '10 '11 '12 '13 '14 '15 '16 '17 Q2 '18
Equity / EBITDA
Total Leverage
LBO PURCHASE PRICE BREAKDOWN
Equity Contribution
30Approved
34% 35% 37% 35% 33% 30% 31% 31% 39% 46% 41% 38% 38% 36% 37% 40% 41% 41% 39%
Source: S&P Capital IQ LCD.
The number of exits in the first six months of 2018 was approximately 7% higher than in the first six months of 2017 and volume increased 45% reflecting larger dispositions by sponsors.
$0
$50
$100
$150
$200
$250
$300
$350
$400
$450
$500
0
200
400
600
800
1,000
1,200
1,400
1,600
1,800
2,000
'07 '08 '09 '10 '11 '12 '13 '14 '15 '16 '17 Q2 '17 Q2 '18
Sale to Strategic (LHS)Sale to Sponsor* (LHS)IPO (LHS)Aggregate Exit Value (RHS)
PRIVATE EQUITY EXITS
Number of Exits Value of Exits ($ Billions)
105Approved
* Sale to Sponsor includes management-led buyouts.Source: Preqin.

This book is for informational purposes only and should not be construed as an offer to sell, a solicitation of an offer to buy, or a recommendation for any security. The information contained herein (A) is subject to change without notice, (B) is not, and may not be relied on in any manner as legal, tax or investment advice, and (C) may include “forward-looking statements,” which can be identified by the use of forward looking terminology such as “may,” “will,” “should,” “expect,” “anticipate,” “target,” “project,” “estimate,” “intend,” “continue” or “believe,” or the negatives thereof or other comparable terminology. Due to various risks and uncertainties, actual events or results may differ materially from those reflected or contemplated in such forward-looking statements.

www.angelogordon.com
NEW YORK • LOS ANGELES • SAN FRANCISCO • CHICAGO • HOUSTON • WASHINGTON, DC
LONDON • AMSTERDAM • FRANKFURT • MILAN
HONG KONG • TOKYO • SEOUL