Embed Size (px)
DESCRIPTION
Citation preview

thE hayS global SkIllS IndEx 2013a barometer of factors impacting the global skills landscape
In partnership with:
PLC-6962-1 Hays GSI 2013_Report-2.indd 1 27/09/2013 15:09

2 | The Hays Global Skills Index 2013 The Hays Global Skills Index 2013 | 1
Contents
IntroduCtIon 1
ExECutIvE Summary 2
rECommEndatIonS for aCtIon 3
CrEatIng thE hayS global SkIllS IndEx 4
mappIng thE SkIllS landSCapE 5
SourCES 15
thE rEgIonal pICturE 16
The Americas 17
Asia Pacific 22
Europe 29
ContrIbutorS 48
alistair Cox Chief Executive, hays plc
I am pleased to introduce the Hays Global Skills Index 2013, our second annual in-depth review of the global professional labour market. The objective of our report is to highlight the efficiency of the skilled labour market around the world, seeking to identify imbalances between the supply of skilled labour and the demand for those skills among employers.
Having placed more than 230,000 people across 33 countries in jobs in the last year, we are acutely aware of how important it is to businesses that the pool of talent offers the skills they need to grow and flourish.
The report is rich in information that will be of interest to employers, employees, and policy makers across the 30 countries we have analysed. In my view, the most critical point this year is that the Hays Global Skills Index demonstrates that the efficiency of labour markets is not directly related to the current state of the economy. Our Index shows structural factors have the greatest impact on the efficiency of the labour market. This finding clearly demonstrates to governments and employers that real improvements to labour markets can be achieved through policy change and action to alter the structures that create the inefficiency in the first place.
Economic conditions alone do not explain why employers find it hard to recruit the right talent despite high unemployment in local labour markets. We are all stakeholders in the global labour market and must encourage action to ensure job markets deliver the talent necessary for businesses and ultimately societies to thrive.
This year’s report reveals a strong correlation between the flexibility of wages and the ability of individual labour markets to provide employers with people who have the right skills. In the short and medium term, it’s clear that countries with the most flexible labour markets are those which stand the best chance of weathering an unfavourable economic shock without suffering long-term and structural unemployment. This should serve as a strong incentive to governments to reduce restrictions on employers to ensure labour markets are as resilient as possible.
The Index also underlines the huge importance of education to the development of an efficient labour market. Although the globalisation of labour markets helps wealthier countries address their skills imbalances, it’s critical for education authorities and businesses to work closely to ensure educational systems are designed to provide students with the skills that their future employers require. This interplay between the worlds of work and education is, in the long-term, fundamental to the efficiency of the global labour market.
Using the findings of our report, we have established three key recommendations which we believe will help governments fix the structural failings in their labour markets. These recommendations directly address the importance of allowing labour markets to operate flexibly, establishing a clear link between education and employment, and ensuring the widest possible group of skilled workers are participating in the labour market.
Today there are chronic and serious failures in labour markets across the world and there are no easy fixes. Without action, these mismatches and shortages will become worse, thereby restricting economic growth and slowing the creation of further new jobs. However, we believe that the principles outlined in our recommendations will make a positive impact on these inefficiencies. These principles are relevant worldwide and, if enacted, we believe will pay significant dividends. The supply of people with the right skills is the foundation for every successful organisation and finding the right person for a job makes businesses, economies and societies stronger. This is fundamental to what we do at Hays. It’s been a pleasure to put together a report that espouses these principles through clear and practical action.
IntroduCtIon
PLC-6962-1 Hays GSI 2013_Report-2.indd 2-1 27/09/2013 15:09

2 | The Hays Global Skills Index 2013 The Hays Global Skills Index 2013 | 3
ExECutIvE Summary
this is the second year that we have collaborated with oxford Economics to publish the hays global Skills Index (the ‘Index’), a comprehensive indicator of the state of the market for skilled labour. this year we include austria, Chile and luxembourg, so that the Index now covers 30 key economies.
Last year we reported that there was little evidence that the global economic downturn and the sharp rises in unemployment around the world had led to an easing in skills shortages. Indeed, at the time evidence seemed to point to a worsening of the situation.
Straws in the wind Since then there have been some encouraging signs that the worst of the economic storm may be behind us, with the Eurozone exiting recession, upward revisions for growth in Japan and continuing US growth. While it is too early to pronounce the global financial crisis over, the modest recovery we are witnessing among many of the developed economies may signal a turning point. However, the most dynamic emerging economies that have powered through the global turbulence are now showing clear signs of slowing down. The past year has therefore offered some hope that the global economy may finally have started on the road towards more balanced growth. Indeed, the Index points to convergence, revealed by the narrowing spread of Index scores across the 30 countries.
Of course, the situation on the ground can sometimes look quite different from the high-level narrative sketched from the unfolding economic events. Local factors have a part to play, sometimes decisively so. For this reason we asked our country specialists to provide their own perspectives on the state of the market for talent. These are highlighted in the country dashboards (see ‘The Regional Picture’ p16), providing a truly global picture of the market for talent in each country.
Where labour markets are in disarray, governments need to have policies to put things rightFew countries escaped the turbulence that followed in the wake of the banking crisis of 2008-09, but some have since fared better than others. Five years on, the crisis has laid bare the underlying strength or fragility of labour markets. The Index not only provides a succinct measure of the overall performance of the labour market, it also offers many insights into the reasons why countries have had such divergent experiences of late.
A careful look at the sub-components of the Index reveals the importance of education systems, legal frameworks and government policy in explaining labour market dynamics in recent years. A pattern that comes out strongly is that almost all the 30 countries fall into one of two camps. In one camp, labour market dynamics are mediated through wage adjustments: in
the other camp, wages play a secondary role. It is in the second camp where we see the largest rises in unemployment. We also find many examples of countries where this large rise in unemployment goes hand-in-hand with a rise in unfilled vacancies: a tell-tale sign of a mismatch between the skills on offer and the skills employers are looking for.
These insights lead us to the conclusion that government labour market policy really matters. While one might blame high unemployment or skill shortages on the state of the economy, the Index makes it clear that where labour markets are unstable, having the right policies is a prerequisite to correcting downward trends.
prospects looking forwardWe may have reached a cross roads. One road leads to a rebalancing in the global economy with the big emerging markets continuing to grow, but not at the blistering rates achieved in recent years, while the slump in the economies of North America and Europe is finally turned around. This road promises to lead to a more favourable realignment in the global labour market, where more evenly balanced growth brings down unemployment while also alleviating localised skills gaps. But of course, it is quite possible that things may not turn out so favourably. In the current dual-track global economy the dynamics of the labour market could continue to follow a trajectory towards twin-deficits: a worsening skills deficit among the leading emerging economies brought about by economies overheating, and a skills deficit among the developed economies, driven by unfavourable demographics, educational imbalances and a crisis of youth unemployment.
At this crucial juncture governments and business can make a real difference by pursing the right policies. Governments need to be ever vigilant that labour market legislation does not act to deter firms from hiring new workers. Much of the blame for Europe’s high youth unemployment, after all, deserves to be laid at the doorstep of laws intended to protect jobs.
Finally, education systems need the capacity, quality and focus to deliver the skills necessary for our current and future industries. Too frequently we see inadequate linkages between business and higher education establishments to train the resources that business needs. Similarly, few countries have developed the sort of apprenticeship programmes that can address the technology skills shortages that are so evident.
rECommEndatIonS for aCtIonlabour markets across the globe are increasingly suffering from chronic and serious skills shortages. there are no quick fixes but it is clear in all cases that businesses, educational establishments and governments need to work together to build the right skills pipeline and, ultimately, a sustainable global economic recovery.
Based on the Hays Global Skills Index 2013 and our daily experience placing people in more than 30 countries in their next career role, Hays proposes a series of recommendations for policy makers, employers and international organisations.
hays’ three recommendations for action 1. governments must demonstrate real financial and political
commitment to improving the flexibility of labour markets.
Our report demonstrates that countries where businesses can be agile in reacting to labour market dynamics by using mechanisms such as flexible contracts, wage adjustments and targeted skilled immigration, significantly decrease their chances of talent mismatch and long-term unemployment. However, more still needs to be done in this area. In order to create an environment that allows business greater control over workforce dynamics we recommend:
• A review of employment legislation and regulation to ensure that businesses have the flexibility to manage their workforce and react to labour market shifts
• Legislative provisions to make it easier for businesses to use short-term contracts and allow staff to work overtime to meet changing workflow needs
• That governments promote and endorse the use of skilled contract and temporary workers to supplement permanent workforces where workforce flexibility is needed
• Implementation of immigration policies and processes that are geared toward attracting those highly skilled workers which are in short supply locally
2. Education reform must be developed through close collaboration between governments and the business community.
The Hays Global Skills Index 2013 underlines that countries with a strong tradition of vocational training to ease the transition from school into employment exhibit the lowest levels of youth unemployment globally. However, in many countries there is still a serious disconnect between employers, secondary education institutions and young people when it comes to filling the skills pipeline for the industries of tomorrow. We recommend:
• Businesses take a longer-term view of the skills they are lacking in their organisations and commit to investment in education on a national basis in those areas
• Governments ensure funding is available and targeted specifically at those areas where there are skills shortages, investing in developing the skills needed for key industries of the future
• Secondary education institutions must adopt a joined-up approach to helping students acquire the life skills and technical skills to find long-term employment, including partnerships with a range of businesses and regular consultation with government
3. businesses need to develop and implement tailored policies for their youngest and oldest staff.
In a world where we see the paradox of youth unemployment alongside ageing workforces and increasing retirement ages, businesses need a strategy to manage the different needs of older workers while retaining their experience and imparting it to the younger generation. We recommend:
• Development of training and apprenticeship programmes to attract and nurture talent among the youngest high-potential employees – the so-called Millennial generation
• Businesses review their HR strategies to adapt to the ageing demographics of their workforces. As more employees are working beyond the traditional retirement age, there is a need to implement programmes targeted at retraining and up-skilling older workers, as well as developing policies that meet the changing needs of older workers
• Businesses work in closer collaboration with representative bodies for the different age groups that make up their workforces
We recognise that different governments, companies and institutions pursue a combination of all three of these initiatives to some degree. however, the overall picture shows these measures are not sufficient and activity needs to be increased and be better co-ordinated.
PLC-6962-1 Hays GSI 2013_Report-2.indd 2-3 27/09/2013 15:09

4 | The Hays Global Skills Index 2013 The Hays Global Skills Index 2013 | 5
CrEatIng thE hayS global SkIllS IndEx the hays global Skills Index is designed to assess the degree to which employers will have difficulty recruiting skilled labour across 30 countries.
There are seven components that contribute to the Index score for each country, each focusing on a different aspect of how easy or difficult it will be for employers to recruit skilled labour. The indicators are as follows:
• Education flexibility
• Labour market participation
• Labour market flexibility
• Talent mismatch
• Overall wage pressure
• Wage pressure in high-skill industries
• Wage pressure in high-skill occupations
The first four can be considered ‘structural indicators’ while the last three are compensation-based indicators. Each indicator is given a score from 0 to 10.0 and the overall Hays Index score is a simple average of the seven indicator scores.
The Hays Global Skills Index ranges from 0 to 10.0 where a score of 5.0 indicates a generally balanced picture for labour markets. This suggests firms are able to recruit, retain or replace their key talent at generally prevailing wage rates. A score close to 0 indicates, on average, less intense competition for key vacancies. A score close to 10.0 indicates severe difficulty in finding the right skills to fill key vacancies.
Seven components make up the hays global Skills Index
Education flexibilityMeasures whether the education system can adapt to meet
organisations’ future talent needs, particularly in the fields of mathematics, science and literacy. A high score means there is limited potential or capacity to increase education performance and output. A low score indicates there is considerable scope to expand the output and quality of the local educational system.
labour market participationMeasures the degree to which a country’s talent pool is fully
utilised. A high score means that the proportion of working age people that are employed (or are available for immediate work) is not increasing, indicating constraints on the availability of additional resource. A low score means that the participation rate reflects the increasing availability of talent to join the workforce.
labour market flexibilityAssesses the legal and regulatory environment faced by
businesses. A high score means the labour market legislation is judged to be inflexible and there are constraints on the ability of inward migrants to fill talent gaps. A low score means the labour market legislation is judged to be flexible, with an openness to immigration.
talent mismatchMeasures the mismatch between the skills needed by
businesses and skills possessed by the labour force. A high score means that the numbers of long-term unemployed and vacancies are both increasing suggesting the available labour does not have the skills employers want. A low score implies that employers are having an easier time finding the talent they need.
overall wage pressureWhether wages are keeping pace with historic trends, which
is a measure of overall labour market tightness. A high score means real wages are increasing quickly relative to the longer term. A low score means real wages are not rising quickly (or are even declining) relative to the longer term.
Wage pressure in high-skill industriesThe rate at which wages in high-skill industries outpace those
in others. A high score means wages in high-skill industries are rising much faster than in low-skill industries. A low score means wages in high-skill industries are not rising faster than in low-skill industries.
Wage pressure in high-skill occupationsA measure of wage premium paid in high-skill occupations,
which is an indicator of shortages of key talent. A high score means wages in high-skill occupations are rising faster than in low-skill occupations. A low score means wages in high-skill occupations are not rising faster than in low-skill occupations.
these seven criteria are all given equal weightingEach country’s Index is accompanied by a thermometer indicating the score range for each indicator (see page 16, The Regional Picture).
0
2.5
5
7.5
10
5.0
4.4
4.0
7.1
8.0
6.0
5 7.52.50 10
4.3
the analysis on which the hays global Skills Index was based utilised data as of Q2 2013. developments subsequent to this date are not reflected in the 2013 findings.
mappIng thE SkIllS landSCapEby looking at a comprehensive and detailed set of macroeconomic and labour market indicators across 30 countries, the hays global Skills Index puts into context the challenges employers will face as they compete for the most sought-after skills. the Index, combined with the unique insights of hays executives operating on the ground, places a spotlight on the specific pressures faced by employers and policy makers as they adapt to the rapidly changing demands of today’s unique economic environment.
PLC-6962-1 Hays GSI 2013_Report-2.indd 4-5 27/09/2013 15:09

6 | The Hays Global Skills Index 2013 The Hays Global Skills Index 2013 | 7
Japan
United States
Germany
Sweden
Hungary
Russia
Portugal
Mexico
Canada
Spain
Brazil
Australia
Ireland
Luxembourg
United Kingdom
France
Poland
Austria
China
Chile
Singapore
Czech Republic
Switzerland
New Zealand
Netherland
India
Denmark
Hong Kong
Belgium
Italy
3.53.0 4.0 4.5 5.0 5.5 6.0 6.5 7.0
Hays Global Skills Index scoreLast year’s score
the current economic landscape In Europe and North America there are finally signs that the worst might be behind us. Recent data for the UK suggests that a sustained recovery is underway. The global growth outlook is also looking firmer, with the Eurozone moving out of recession and the United States continuing to gather momentum. Incoming data for Japan, the world’s third largest economy, has also been upbeat. While straws in the wind, these signs offer hope that the developed economies are at last pulling themselves out of the mire into which they were dragged by the banking crisis.
The banking crisis exposed a twin-track global economy as the leading emerging economies powered through the global turbulence. Yet China, which achieved blistering rates growth for well over a decade, is now showing signs that its economy is cooling off. Other emerging economies are showing a similar cooling. India, for example, should see Gross Domestic Product (GDP) rise by just 5.1%, markedly below its 2000-08 average of 7.3%.
local perspective
“ Securing a Temporary Foreign Worker permit has become difficult. This was in response to some employers bringing low paid or unskilled workers into the country and thereby taking away roles from local candidates. While protecting lower level opportunities for local workers this will adversely affect companies who cannot find highly-skilled workers and have no choice but to recruit from overseas.”
rowan o’grady, managing director, hays Canada
Economic growth matters, but so does policy The Hays Global Skills Index weighs a wide variety of factors that reflect the relative ease or difficultly of recruiting highly-skilled labour in different countries. The results for this year are shown in Figure 1, where this year’s scores are also compared with those for last year.
This reveals a number of interesting facts:
• 18 countries are experiencing skill shortages (scores greater than 5), while only 12 countries are experiencing few if any signs of skills shortages (scores of 5 or less)
• In most countries, skilled labour markets have tightened
• Interestingly, no one region clearly outperforms the rest. For example, European countries appear near the top (Germany, Sweden) and the bottom (Belgium, Italy) of the ranking. Similarly, while Japan has the highest score among the 30 countries, other Asian countries have low scores, such as India and Hong Kong
• Despite their rapid growth, the leading emerging economies have just as mixed a record as the developed economies when it comes to their skilled labour markets. For instance, while Russia, Mexico and Brazil show signs of skills gaps, other fast growing economies, such as Singapore, India and Hong Kong, have so far not faced widespread problems
figure 1: hays global Skills Index 2013
PLC-6962-1 Hays GSI 2013_Report-2.indd 6-7 27/09/2013 15:09

8 | The Hays Global Skills Index 2013 The Hays Global Skills Index 2013 | 9
the talent landscapeFigure 2 looks at overall labour market performance (measured by overall Index scores) from a different angle. The top group of four countries shown have either avoided a deep recession or have begun on the road to recovery. The bottom group all remain in recession. It is striking that there is as much variation in the Index scores within each group as there is between the two groups.
In other words, the skilled labour markets of countries facing a similar economic issue can nonetheless perform very differently. For example, both Chile and Mexico recovered quickly from recession in 2009. While Chile’s growth has been the higher of the two, both have seen similar recovery profiles since 2010. Yet, according to the Index Mexico is experiencing some notable labour market pressures (with a score of 5.9), while Chile’s labour market is experiencing appreciably fewer pressures (with a score of 4.7).
To take another example, the Czech Republic is not facing serious skill shortages, as one would expect given that it is struggling through a deep recession. Portugal, Russia, and Spain, on the other hand, have recessions just as deep and yet have to confront skills shortages nonetheless.
Of course, Figure 2 does not imply that there is no relationship between growth and skill shortages; instead it shows that in explaining skills shortages, the level of demand in an economy is only part of the equation. Just as important is the supply of skills and the cultural and legislative backdrop that helps or hinders firms and talented workers to find the right matches.
the supply of skills – the other half of the skills equationWhile it is easy to blame skill shortages on the state of the economy, we have seen that some economies sustain rapid growth without running up against skills shortages, while others run up against skills shortages even as they are facing economic difficulties.
Why does the talent equation work favourably for some countries while not for others? The Index not only provides a succinct measure of the overall performance of the labour market, it also offers many insights into the reasons why countries have had such divergent experiences of late.
We look at both sides of the talent equation: both demand indicators (wages, unemployment, vacancies etc) and supply indicators. Three components of the Index measure the supply-side of the talent equation. These are:
• Education flexibility
• Labour market participation
• Labour market flexibility
Education obviously plays a crucial role in determining a country’s supply for talent, whether the basic literacy and numeracy skills needed from almost all jobs, or the advanced qualifications leading to careers in areas such as engineering, medicine or science. Education may also benefit the economy in less obvious ways. It is sometimes argued that education makes people more adaptable and able to cope when the demands placed on them in the workplace change rapidly. Such flexibility will have been especially valuable over the past decade or so, as computers have revolutionised many industries, transforming many jobs beyond all recognition.
local perspective
“ The education system struggles to produce an adequate number of specialists across industries and functions while wage pressure in high-skill industries, which is already at a dangerously high level, continues to rise. It is not surprising therefore that only a half of university graduates pursue a professional career in their relevant field of study.”
alexey Shteingardt, managing director, hays russia
The market for skills also reflects the underlying choices of individuals across the economy. The Hays Global Skills Index measures the extent to which one important element of this – labour market participation – changes and thereby increases or decreases the pool of talent available. Economic theory suggests that increasing or steady long-term unemployment could drive down participation, as people just give up, ironically reducing the ability of struggling economies to fill skilled positions. This seems to be happening in some countries: those countries with the highest rating in this area – and therefore the biggest shift towards a decline in participation – include struggling European economies such as Spain, Ireland, and Portugal. China, meanwhile, is seeing more of its population brought into its growing economy. A closer look, however, reveals a muddier picture. Italy, for example, is still seeing a marked increase in its internationally very low participation rate. More generally, labour market participation – like many elements of the Index – is often tied to specific national factors rather than easily defined trends. A detailed understanding of any economy always requires a look at the whole picture.
local perspective
“ It is essential to create policies that attract and retain these young professionals. It is also very important to establish better communications between educational institutions and the labour market to fix this lack of skills and thus reduce wage pressure.”
paula baptista, managing director, hays portugal
By enhancing or diminishing labour market flexibility, changes in employment policy can have a more immediate effect than education related ones. Government choices, such as low overall employment regulation, are able to give employers the flexibility they need to react to labour market shifts. Here international differences reflect political tradition more than geography. Historically low regulation jurisdictions, such as Singapore and Hong Kong, have low pressure scores, indicating substantial flexibility. Those where governments tend to be more active in setting economic policy, including the BRIC countries but also France and Japan, are more restrictive and have higher pressure scores.
figure 2: overall hays global Skills Index scores – global recession is only part of the story
New Zealand
Chile
Mexico
Japan
Czech Republic
Spain
Portugal
Russia
4.0 4.5 5.0 5.5 6.0 6.5
Still in recession
Avoiding recession / on the road to recovery
Hays Global Skills Index score
PLC-6962-1 Hays GSI 2013_Report-2.indd 8-9 27/09/2013 15:09

10 | The Hays Global Skills Index 2013 The Hays Global Skills Index 2013 | 11
Brazil
Chile
Denmark
Italy
Ireland
Portugal
United States
Spain
600 10010 20 30 40 50 70 80 90
Percentage
talent mismatch and wage adjustment – two paths which few countries depart fromApart from our three supply-side indicators, the Index is comprised of an indicator which we call talent mismatch and three indicators that measure wage pressures. The talent mismatch indicator combines three quantitative metrics that provide a litmus test for the existence of widespread skill shortages. The metrics are:
• Long-term unemployment (those unemployed over one year)
• Structural unemployment (the rate at which it proves difficult to lower unemployment below, even when the economy recovers)
• Number of unfilled job vacancies
Of course, skill gaps can also manifest themselves through wage pressures. The Index includes three wage indicators. Whether wages or vacancies and unemployment are the more powerful diagnostic says a lot about the way local labour markets work.
Indeed it is a striking finding that in the wake of the global recession either wages took the strain or else the full force impacted on unemployment and vacancies. In very few cases did they adjust together. In Figure 3 the average score for the three mismatch indicators and the average score for the three wage indicators have been added together, and the relative importance of each expressed as a percentage of the total (which sum to 100%). The figure illustrates the either-or dilemma which countries face. In the eight countries shown, the recession has triggered large wage adjustment or else unemployment and unfilled vacancies have risen markedly.
Of course, mismatch – in focusing on long-term unemployment – is just the tip of a much larger iceberg. To understand the full extent of the dislocation in the global labour markets, one needs to look at unemployment in all its forms.
the global economic downturn has spurred regulatory adjustmentsThe Hays Global Skills Index in 2013 features a number of countries where labour market flexibility issues contribute to measured labour market pressures. Brazil, China, and France, for example, have labour market flexibility scores of 8.0 or higher – a score which suggests significant stresses. Another four countries – India, Japan, Mexico, and Russia – have scores of 7.0 or higher, again suggesting elevated stresses related to labour market flexibility.
Other countries, however, have been spurred by their current economic and labour market challenges (worsening long-term unemployment rates, for instance) to implement regulatory reforms. One such reform, undertaken by countries like Spain and Portugal, involves employment protection legislation which can affect the amount of severance pay and advance notice employers must give employees when dismissing them, as well as the potential penalties for wrongful dismissal. The legislation was often implemented in better times with the goal of protecting jobs and increasing job
stability, but large scale economic transitions can change that calculus. There may be a growing sense that the legislation acts to discourage employers from hiring new people, thereby reducing the opportunities for workers to seek out positions that best match their skills.
Specific measures of the extent of employment protection legislation are tracked in 43 countries by the OECD2, and the organisation’s index indicates that several countries in the Hays Global Skills Index implemented reforms in 2012 and 2013. Among those that have made attempts to reduce the impact of employment protection legislation are Hungary, Italy, Portugal, and Spain, all of which have been particularly badly affected by the global recession. Spain and Portugal, for example, currently have the highest unemployment rates among the countries featured in this report; all four countries currently have economies that are smaller than they were five years ago. Labour market reforms have the potential to provide a much needed boost.
Many countries could benefit from comprehensive labour market reforms [see box below], but those considering ways to enhance the pool of skilled employees available for employers should also look beyond national borders. Switzerland’s rating for labour market flexibility fell from an already low 4.2 in 2012 to 2.3 in 2013, indicating very little pressure in this area. The reason is an expected increase of immigration. Already, according to the OECD’s latest International Migration Outlook, some 20% of the Swiss population is foreign born, most coming from surrounding EU states. The country appears to be gaining from this: the OECD estimates that migrants increased net annual tax revenue in Switzerland – after deducting social payments – by roughly $7 billion, or just under 2% of total GDP. Many of these immigrants are skilled professionals, which is a recurring theme among OECD countries. According to OECD data, in 2011 30% of new hires of foreigners in its member states were highly skilled1.
local perspective
“ Continued federal monetary policy, reduced global economic concerns and continued economic expansion will create jobs and reduce the unemployment rate. However, this could potentially take between one to three years of progress and will preferentially benefit workers who have skills that are short in supply such as mid to senior-level sales, IT and engineering.”
John faraguna, president, hays north america
local perspective
“ It remains tough for employers to find top talent. The high talent mismatch levels are due to on-going skill shortages and a reduced talent pool because candidate confidence to move jobs is low and employers have largely remained focused on recruiting to replace leavers. However, more positive sentiment is starting to gain momentum throughout the UK.”
nigel heap, managing director, hays uk & Ireland
By covering both sides of the talent equation, the Index is able to capture an important feature of markets for skilled labour. While these supply-side indicators, being ultimately determined by legal frameworks, local attitudes and culture – typically do not record dramatic changes from one year to the next, they nonetheless play a decisive role in determining the dynamics of the labour market. Figure 3 makes this point powerfully.
figure 3: talent mismatch and wage adjustment – two paths from which few countries depart
1. OECD, (2013), ‘International Migration Outlook 2013’, June. 2. OECD, International Migration Outlook, 2013, “Immigration leads to a healthier state”, Swiss Broadcasting Corporation.
Talent mismatch Wage adjustment
PLC-6962-1 Hays GSI 2013_Report-2.indd 10-11 27/09/2013 15:09

12 | The Hays Global Skills Index 2013 The Hays Global Skills Index 2013 | 13
60 101 2 3 4 5 7 8 9
Talent mismatch score
Ireland
USA
Portugal
Spain
The Netherlands
Poland
Belgium
Czech Republic
figure 4: four worst and best performing countries for mismatch
Figure 4 shows the four countries with the highest and lowest scores for talent mismatch. Ireland, the USA, Portugal and Spain all have a score of 10, the maximum possible, indicating that problems of talent mismatch are especially severe. These four countries clearly stand out for their high scores. The situation is much less serious in most of the 30 countries covered by the Index. For instance, ten countries have a score of 5 or less, indicating that talent mismatch is not a systemic problem. The four countries with the lowest scores for talent mismatch are shown in Figure 4. These are the Netherlands (3.5), Poland (3.3), Belgium (2.2) and the Czech Republic (0.7).
One might expect that a country that is in the early stage of an economic recovery can run up against serious talent mismatch. Unemployment – especially long-term unemployment can erode peoples skills. Moreover, industry-specific skills previously sought after; can quickly become redundant should an industry fall victim to a deep recession. This may well explain why the USA, which is pulling itself out of recession, has a high talent mismatch score. Similarly, the four countries with low scores for talent mismatch are currently still in recession and these may go a long way to explain why skill mismatches are not widespread. But much more worrying is the high scores for Ireland, Portugal and Spain, three countries facing severe economic problems. For these three, the existence of widespread skill mismatch in the midst of a recession is symptomatic of deep structural problems with their labour markets.
addressing youth unemployment Young people have borne a disproportionate share of the world’s recent economic troubles. Worldwide, the International Labor Organization estimates the number of unemployed youth in 2013 will reach 73.4 million, up from 72.9 million last year.
Hanan Morsy, an IMF economist, noted recently that “young people have suffered a much sharper rise in joblessness than older workers, and structural issues, especially in Europe, have exacerbated youth employment problems.” Among the 30 countries in the Hays Global Skills Index 2013, the average youth unemployment rate in 2012 was just over 20%, 2.6 times the rate of unemployment in those populations overall.
The damage is not merely to current pay packets. As IMF research shows, employment scarring is a long term result. Those who experience unemployment while young are more likely to do so again later in their careers and to earn less over the course of a lifetime as the loss of potential skills and experience have an impact.*
The average level of youth unemployment, however, hides substantial variation between countries. In Spain by the end of 2012 the figure was an astounding 56%, in Portugal 39% and in Italy 37%. In Austria and Germany, meanwhile, the figures were just 9% and 8% respectively. Germany in particular is interesting in that it had the lowest ratio of youth to overall unemployment (just 1.5).
What sets Germany apart? One possibility is that it, like Austria, Denmark, and the Netherlands – three other countries with low ratios of youth to overall unemployment – has a strong tradition of vocational education at the secondary level which can ease the transition from school to employment. Integrated in this education are apprenticeship opportunities with local companies that provide, almost by definition, the skills that employers need.
* Hanan Morsy “Scarred Generation”, Finance & Development, March 2012, Vol. 49, No. 1
unemployment remains a huge concern Five years after the economic storm broke, labour markets still remain out of kilter. No other statistic shows this better than the number of unemployed. Worldwide, an estimated 202 million people will be unemployed in 20133, or 6% of the global labour force. This figure represents an increase from last year of 7 million people who are looking for work and cannot find it. In the 30 countries of the Hays Global Skills Index the aggregate unemployment rate is 7.3%.
local perspective
“ The unemployment rate remains above the critical mark of ten per cent, showing a depressed labour market. Those affected the most are young and seniors workers, while the access to the employment market is increasingly dependent on unstable labour contracts.”
tina ling, managing director, hays france & luxembourg
This is a problem with many faces, none pleasant. Youth unemployment is a particular challenge currently [see box below]. Similarly, high levels of long-term unemployment continue to plague a variety of developed economies. Potentially devastating personally for those unable to find work, unemployment also has worrying societal impacts. Moreover, the impact of unemployment does not disappear when a job is finally found as research shows that those who experience unemployment while young also tend to earn less when they are older.
Jobs, jobs, everywhere, but not the talent to fill them? Unemployment does not arise merely from a lack of positions. Indeed, it too often co-exists with a high number of unfilled vacancies. As of early 2013, for example, 12 European countries4 collectively had nearly 2 million unfilled vacancies at the same time as almost 17 million unemployed people were seeking employment. Many of the latter had been looking for at least a year (in Greece, 59% of the unemployed were in this state; in Germany, 45%; and in the UK, 35%).
It is not uncommon in a buoyant economy that job vacancies go unfilled, while in a prolonged slump many workers find themselves out of a job for a long time. What is less common, and a sure sign of a malfunctioning labour market, is to find both the numbers of unfilled vacancies and long-term unemployed rising at the same time. Very often the reason is a mismatch between the demand and supply for skills, whereby employers’ expectations for skills and experience cannot be met by the available candidates.
local perspective
“ Brazil is currently experiencing a shortage of qualified professionals, especially in areas where demand is at a high level such as infrastructure and oil and gas. Overall the most sought after skills are English language skills and strategic thinking.”
Carla rebelo, managing director, hays brazil
3. ILO, (2013) ‘World of Work Report 2013’, June 2013.4. Austria, Bulgaria, Czech Republic, Germany, Greece, The Netherlands, Norway, Poland, Romania,
Spain, Sweden, UK
PLC-6962-1 Hays GSI 2013_Report-2.indd 12-13 27/09/2013 15:09

14 | The Hays Global Skills Index 2013 The Hays Global Skills Index 2013 | 15
data sources for indicator scoresThe analysis on which the Hays Global Skills Index was based utilised data as of Q2 2013. Developments subsequent to this date are not reflected in the 2013 findings.
varIablE SourCE
Labour freedom Heritage Foundation, 2011-2012 Index of Economic Freedom
Improvements in education levels Barro, Robert and Jong-Wha Lee, April 2010, "A New Data Set of Educational Attainment in the World, 1950-2010." NBER Working Paper No. 15902.
Change in economic participation rate (overall) Oxford Economics Global Macro Model
Change in economic participation (15-24 year olds) International Labour Organizaton (ILO)
Change in economic participation (55-64 year olds) International Labour Organizaton (ILO)
Economic participation rate rank International Labour Organizaton (ILO)
Output gap, % GDP International Monetary Fund (IMF)
Long term unemployment rate Organization for Economic Cooperation and Development (OECD), National statistical agencies
Vacancies (000s) Organization for Economic Cooperation and Development (OECD), Eurostat, National statistical agencies
GDP (LC, real, billion) Oxford Economics Global Macro Model
GDP growth (real) Oxford Economics Global Macro Model
Population (mn) Oxford Economics Global Macro Model
Unemployment rate (2011) Oxford Economics Global Macro Model
GDP/head (LC, real) Oxford Economics Global Macro Model
Government balance Oxford Economics Global Macro Model
Current account Oxford Economics Global Macro Model
Non-Accelerating Inflation Rate of Unemployment (NAIRU) Oxford Economics Global Macro Model
CPI inflation Oxford Economics Global Macro Model
PPI inflation Oxford Economics Global Macro Model
Imports + Exports, %GDP Oxford Economics Global Macro Model
PISA reading scores PISA 2009 Results: What Students Know and Can Do (OECD)
PISA math scores PISA 2009 Results: What Students Know and Can Do (OECD)
PISA science scores PISA 2009 Results: What Students Know and Can Do (OECD)
Average PISA rank PISA 2009 Results: What Students Know and Can Do (OECD)
Net migration US Government
SourCES
the crisis continues to dampen wagesThe economic shockwave in the wake of the global banking crisis left few markets untouched, the market for skilled labour being no exception. Given the tremendous force with which the crisis broke, it was inevitable that something had to give. A widespread increase in unemployment was inescapable. But while no panacea, where wages have been able to adjust they have acted as a shock absorber. We have already seen that countries where wages have adjusted, have also avoided the worse increases in long-term unemployment and skills mismatch.
In this final section, we take a closer look at our three wage indicators to fully appreciate the imprint the shock wave left on wage differentials.
Our three wage indicators are:
• The average growth in wages across the whole economy, after allowing for inflation
• The pay differential between high-skill and low-skill industries
• The pay differential between high-skill and low-skill occupations
local perspective
“ The immigration reforms have hindered the attraction of qualified talent, having a direct impact on highly specialised positions and the wage pressure of industries in general.”
giordano righi, managing director, hays Chile
Overall wage pressures are low in 18 of the 30 countries. Not surprisingly, Europe is heavily represented among the countries where wage pressures are weakest. Europe accounts for 12 of the 18 countries experiencing low wage pressures (a score below 5). The European countries experiencing the weakest overall wage growth are Spain, Ireland, Italy, the Netherlands, and the UK. Outside Europe, in New Zealand and Singapore for example, wage pressures are also muted. At the other end of the scale, Japan, Hong Kong and China are all expected to face overall wage pressures above their historic norms.
Industry pay differentials tell a somewhat different story. The countries outside Europe dominate both the high and low end of the scores. Those experiencing the sharpest widening in pay differentials are Russia, Australia, Mexico and New Zealand; at the other end of the scale, Brazil, Chile, China, and India are seeing a compression of pay differentials. As all these countries are important trading nations, these movements in pay are almost certainly reacting to the big shifts in demand for traded goods that have followed in the wake of the economic turbulence.
Much like developments in industry pay, the largest movements in occupational pay differentials are happening outside Europe for the most part. Outside Europe, pay pressures are increasing in Australia, Canada, Japan, Singapore, and worryingly, given the weakness of the recovery, the United States. In Europe, Germany and Ireland (another cause of concern) have also seen occupational pay differentials widen.
PLC-6962-1 Hays GSI 2013_Report-2.indd 14-15 27/09/2013 15:09

16 | The Hays Global Skills Index 2013 The Hays Global Skills Index 2013 | 17NOTE: The analysis on which the Hays Global Skills Index was based utilised data as of Q2 2013. Developments subsequent to this date are not reflected in the 2013 findings.
View from the groundAustralia’s Hays Global Skills’ Index Score is 5.6 in 2013, slightly down from last year. The relative relaxation of labour market pressures is helped by a number of indicators, including those for labour market participation and talent mismatch. These forces are working in the same direction as a downshift in economic growth, which is expected to fall to 2.6% in 2013 (down from 3.6% in
2012). Hays MD
the A
meriCA
S
†Forecast figures for 2013
thE rEgIonal pICturEthe country dashboards present a detailed breakdown of labour market pressures for each of the 30 countries (spanning the americas, asia-pacific and Europe) featured in the hays global Skills Index. Seven indicators contribute equally to the hays global Skills Index score for each country, providing insights into the state of the economy, the makeup of the labour market and education, talent and wage pressures, and shortages by industry and occupation. the data provides a detailed look at the challenges and opportunities facing employers and policy makers in today’s rapidly evolving talent landscape.
6.0
6.0
8.8
5.5
3.9
4.4
4.7
baCkground EConomIC data
kEy fIndIngBrazil ranks among the worst of the 30 countries in the Hays Global Skills Index in terms of secondary school education quality. A history of subpar educational performance at the secondary level has likely impacted the supply of skills available to employers today and will continue to do so in future if not remedied.
doWnWard prESSurE from• Increase in education levels• Overall wage pressure• Wage pressure in high-skill industries
upWard prESSurE from• International PISA rank• Net in-migration• Labour market regulations
4,711
198.6m
n/a
0.9%
5.5%
23,700 24,100
4,824
200.3m
n/a
2.4%
5.5%0
2.5
5
7.5
10
5.6ovErall SCorECountry profIlE
Brazil’s score for 2013 has fallen marginally to 5.6 from 5.7 in 2012. Some employers will have considerable difficulty attracting and retaining highly-skilled labour in the current environment.
GDP is expected to grow by 2.4% in 2013, below the country’s potential. However, it is an improvement on 0.9% growth from 2012 and a further improvement is expected in 2014, when growth is forecast at 4.1%. When economic growth picks up once again, we expect labour market pressures to increase as well.
Indicators
brEakdoWn of SEvEn IndICator SCorESIndicators
Education flexibility
talent mismatch
overall wage pressure
labour market participation
labour market flexibility
Wage pressure in high-skill industries
Wage pressure in high-skill occupations
Scores 50 102.5 7.5
unEmploymEnt
gdp
long-term unempl. rate
unemployment rate
*2013 prices
gdp/head (brl*)
gdp (billion brl*)
gdp growth
populatIon
2012 2013†
5.7 in 2012
vIEW from thE groundBrazil is currently experiencing a shortage of qualified professionals, especially in areas where demand is at a high level such as; infrastructure and oil and gas. Overall the most sought after skills are English language skills and strategic thinking. Due to a mild economy companies are now focusing on productivity and talent retention. The main challenges in Brazil are the inflexible labour market and the high costs associated with doing business. However, Brazil is considered as the natural hub for companies’ Latin American platforms, which supplies a variety of opportunities for professionals. Carla Rebelo, Managing Director, Hays Brazil
brazIl
PLC-6962-1 Hays GSI 2013_Report-2.indd 16-17 27/09/2013 15:10

18 | The Hays Global Skills Index 2013 The Hays Global Skills Index 2013 | 19
THE
AM
ERIC
AS
VIEw fRoM THE gRoundAustralia’s Hays Global Skills’ Index Score is 5.6 in 2013, slightly down from last year. The relative relaxation of labour market pressures is helped by a number of indicators, including those for labour market participation and talent mismatch. These forces are working in the same direction as a downshift in economic growth, which is expected to fall to 2.6% in 2013 (down from 3.6% in
2012). Hays MD
NOTE: The analysis on which the Hays Global Skills Index was based utilised data as of Q2 2013. Developments subsequent to this date are not reflected in the 2013 findings.
NOTE: The analysis on which the Hays Global Skills Index was based utilised data as of Q2 2013. Developments subsequent to this date are not reflected in the 2013 findings.
VIEw fRoM THE gRoundAustralia’s Hays Global Skills’ Index Score is 5.6 in 2013, slightly down from last year. The relative relaxation of labour market pressures is helped by a number of indicators, including those for labour market participation and talent mismatch. These forces are working in the same direction as a downshift in economic growth, which is expected to fall to 2.6% in 2013 (down from 3.6% in
2012). Hays MD
THE A
MERICA
S
†Forecast figures for 2013 †Forecast figures for 2013
5.6
5.1
3.9
8.0
5.6
6.5
6.7
baCkground EConomIC data
kEy fIndIngThe uptick in long-term unemployment since 2008 suggests a talent mismatch issue for employers and provides significant upward pressure on Canada’s Index score. A countervailing and positive influence comes from significant inward migration, a benefit to employers prepared to take advantage of it.
doWnWard prESSurE from• International PISA rank• Net in-migration• Structural unemployment
upWard prESSurE from• Long-term unemployment• Wage pressure in high-skill industries• Increase in education levels
1,846
34.7m
1.0%
1.7%
7.3%
53,200 53,600
1,877
35.0m
1.0%
1.7%
7.2%0
2.5
5
7.5
10
5.9ovErall SCorECountry profIlE
Canada’s score of 5.9 suggests an intermediate degree of elevated wage pressures.
Along with a small handful of other countries in the Hays Global Skills Index (including Australia), Canada’s economy has fared relatively well during the global economic downturn beginning in 2008. Canada’s economy is expected to grow by 1.7% in 2013, unchanged from last year although still below the 2000-08 average. The rate of unemployment is expected to fall from 7.3% to 7.2%.
Indicators
brEakdoWn of SEvEn IndICator SCorESIndicators
Education flexibility
talent mismatch
overall wage pressure
labour market participation
labour market flexibility
Wage pressure in high-skill industries
Wage pressure in high-skill occupations
Scores 50 102.5 7.5
unEmploymEnt
gdp
long-term unempl. rate
unemployment rate
*2013 prices
gdp/head (Cad*)
gdp (billion Cad*)
gdp growth
populatIon
2012 2013†
5.6 in 2012
vIEW from thE groundThe skills shortage has continued to cause significant challenges to employers in some sectors, namely natural resources, the construction industry and technology sectors. Pressure on the government remains to facilitate the import of skill-sets that aren’t available locally. However, securing a Temporary Foreign Worker permit has been made more difficult recently. This was in response to some employers bringing low paid or unskilled workers into the country and thereby taking away opportunities from local, suitable candidates. While protecting lower level opportunities for local workers, this may well adversely affect companies who cannot find highly-skilled workers and have no choice but to recruit from overseas. Rowan O’Grady, President, Hays Canada
6.0
5.2
5.9
6.0
6.7
2.4
1.1
baCkground EConomIC data
kEy fIndIngThe most recent available data shows skills premiums in high-skill occupations and industries declining. However, this data lags wage data for the country overall, and real wages are forecast to increase at a healthy 3.8% in 2013. Time will tell if this is an economy-wide phenomenon or associated with particular skills or sectors.
doWnWard prESSurE from• Wage pressure in high-skill occupations• Wage pressure in high-skill industries• Increase in education levels
upWard prESSurE from• International PISA rank• Net in-migration• Overall wage pressure
133,337
17.4m
n/a
5.6%
6.4%
7,644,300 7,919,800
139,338
17.6m
n/a
4.5%
6.4%0
2.5
5
7.5
10
4.8ovErall SCorECountry profIlE
Chile’s overall score is 4.8, indicative of slightly more relaxed labour market conditions than the norm. An expected decline in economic growth, from 5.6% last year to 4.5% this year is a contributing factor. Total employment has held up reasonably well since 2008, growing at an average annual rate of 3.5%. This growth is expected to moderate to 1.9% in 2013.
Indicators
brEakdoWn of SEvEn IndICator SCorESIndicators
Education flexibility
talent mismatch
overall wage pressure
labour market participation
labour market flexibility
Wage pressure in high-skill industries
Wage pressure in high-skill occupations
Scores 50 102.5 7.5
unEmploymEnt
gdp
long-term unempl. rate
unemployment rate
*2013 prices
gdp/head (Clp*)
gdp (billion Clp*)
gdp growth
populatIon
2012 2013†
n/a in 2012
vIEW from thE groundThe Chilean economy is experiencing a shortage of specialist candidates. Demand within the mining sector for an experienced labour force is exceeding the number of available candidates; many organisations are resorting to recruiting talent from abroad. The shortage of talent is being felt by other sectors too and to overcome the problem Chile needs to find solutions to a number of issues. These include immigration law, which needs to be modified to attract even more qualified candidates to Chile and education reforms to ensure the skills coming through are what is required. Giordano Righi, Managing Director, Hays Chile
Canada ChIlE
PLC-6962-1 Hays GSI 2013_Report-2.indd 18-19 27/09/2013 15:10

20 | The Hays Global Skills Index 2013 The Hays Global Skills Index 2013 | 21
THE
AM
ERIC
AS
VIEw fRoM THE gRoundAustralia’s Hays Global Skills’ Index Score is 5.6 in 2013, slightly down from last year. The relative relaxation of labour market pressures is helped by a number of indicators, including those for labour market participation and talent mismatch. These forces are working in the same direction as a downshift in economic growth, which is expected to fall to 2.6% in 2013 (down from 3.6% in
2012). Hays MD
NOTE: The analysis on which the Hays Global Skills Index was based utilised data as of Q2 2013. Developments subsequent to this date are not reflected in the 2013 findings.
NOTE: The analysis on which the Hays Global Skills Index was based utilised data as of Q2 2013. Developments subsequent to this date are not reflected in the 2013 findings.
VIEw fRoM THE gRoundAustralia’s Hays Global Skills’ Index Score is 5.6 in 2013, slightly down from last year. The relative relaxation of labour market pressures is helped by a number of indicators, including those for labour market participation and talent mismatch. These forces are working in the same direction as a downshift in economic growth, which is expected to fall to 2.6% in 2013 (down from 3.6% in
2012). Hays MD
THE A
MERICA
S
†Forecast figures for 2013 †Forecast figures for 2013
4.8
5.8
7.4
5.7
4.7
10.0
3.0
baCkground EConomIC data
kEy fIndIngMexico’s secondary education quality is a serious concern, as the country ranks among the worst in the Index. A history of subpar educational opportunities has likely had an important impact on the supply of skilled workers available to Mexican employers today.
doWnWard prESSurE from• Increase in education levels• Wage pressure in high-skill occupations• Overall wage pressure
upWard prESSurE from• Wage pressure in high-skill industries• Net in-migration• International PISA rank
15,932
116.3m
0.1%
3.9%
5.0%
137,000 139,200
16,373
117.6m
0.1%
2.8%
4.9%0
2.5
5
7.5
10
5.9ovErall SCorECountry profIlE
Mexico’s score in 2013 is 5.9, reflecting an intermediate degree of labour market pressures. In particular, our indicators for labour market flexibility and wages in high-skill industries point to the presence of skills gaps.
Mexico’s economy is expected to slow in 2013, with GDP growth falling from 3.9% in 2012 to 2.8% in 2013. That still makes it one of the few countries whose growth this year will be higher than the pre-recession average and is indicative of the Mexican economy’s resilience and strength.
Indicators
brEakdoWn of SEvEn IndICator SCorESIndicators
Education flexibility
talent mismatch
overall wage pressure
labour market participation
labour market flexibility
Wage pressure in high-skill industries
Wage pressure in high-skill occupations
Scores 50 102.5 7.5
unEmploymEnt
gdp
long-term unempl. rate
unemployment rate
gdp/head (mxn*)
gdp (billion mxn*)
gdp growth
populatIon
2012 2013†
*2013 prices
5.9 in 2012
vIEW from thE groundAccording to the OECD data, Mexico’s projected unemployment rate, compared to the major economies, is low. In order to create confidence amongst organisations and new investors to encourage the creation of new employment, it is important for Mexico to generate the structural reforms required to support the legal, political, economic and educational frameworks that the current labour market needs. The immigration reforms have hindered the attraction of qualified talent, having a direct impact on highly specialised positions and the wage pressure of industries in general. Gerardo Kanahuati, Country Manager, Hays Mexico
6.6
5.8
4.3
10.0
4.2
7.8
6.4
baCkground EConomIC data
kEy fIndIngThe most recent measure of long-term unemployment shows that 29% of all unemployed individuals have been unemployed for a year or more. This rate is more than three times the average between 2000 and 2008, and represents a serious concern for the US labour market.
doWnWard prESSurE from• Labour market regulations• Net in-migration• Overall wage pressure
upWard prESSurE from• Long-term unemployment• Structural unemployment• Increase in education levels
15,926
313.9m
2.5%
2.2%
8.1%
50,700 51,300
16,239
316.4m
2.4%
2.0%
7.7%0
2.5
5
7.5
10
6.4ovErall SCorECountry profIlE
The overall score for the US is 6.4. Noticeable labour market pressures are being felt in the economy overall, and in high-skill industries in particular.
The ongoing labour force recovery in the US is showing signs of sustainability, with six-month average employment growth presently at 194,000. The economy is expected to grow by 2% in 2013, just slightly down from 2.2% last year and 2.3% during the 2000-08 period, on average.
Indicators
brEakdoWn of SEvEn IndICator SCorESIndicators
Education flexibility
talent mismatch
overall wage pressure
labour market participation
labour market flexibility
Wage pressure in high-skill industries
Wage pressure in high-skill occupations
Scores 50 102.5 7.5
unEmploymEnt
gdp
long-term unempl. rate
unemployment rate
gdp/head (uSd*)
gdp (billion uSd*)
gdp growth
populatIon
2012 2013†
*2013 prices
6.4 in 2012
vIEW from thE groundWhile the US economy continues to recover from the deep recession at a lacklustre pace there continues to be a dichotomy in the labour market – skills shortages and unfilled positions at the same time as long-term unemployment. Continued federal monetary policy, reduced global economic concerns and continued economic expansion will create jobs and reduce the unemployment rate. However, this could potentially take between one to three years of progress and will preferentially benefit workers who have skills that are short in supply such as mid to senior-level sales, IT and engineering. John Faraguna, President, Hays North America
mExICo unItEd StatES
PLC-6962-1 Hays GSI 2013_Report-2.indd 20-21 27/09/2013 15:10

22 | The Hays Global Skills Index 2013 The Hays Global Skills Index 2013 | 23
ASI
A P
ACI
FIC
VIew From the groundAustralia’s Hays Global Skills’ Index Score is 5.6 in 2013, slightly down from last year. The relative relaxation of labour market pressures is helped by a number of indicators, including those for labour market participation and talent mismatch. These forces are working in the same direction as a downshift in economic growth, which is expected to fall to 2.6% in 2013 (down from 3.6% in
2012). Hays MD
ASIA
PACIFIC
†Forecast figures for 2013 †Forecast figures for 2013
NOTE: The analysis on which the Hays Global Skills Index was based utilised data as of Q2 2013. Developments subsequent to this date are not reflected in the 2013 findings.
NOTE: The analysis on which the Hays Global Skills Index was based utilised data as of Q2 2013. Developments subsequent to this date are not reflected in the 2013 findings.
5.0
4.0
4.4
7.1
8.0
6.0
baCkground EConomIC data
kEy fIndIngWhile overall real wage growth is expected to be down slightly from last year, this indicator continues to add upward pressure to the Index score for the country in 2013.
doWnWard prESSurE from• Structural unemployment• Net in-migration• International PISA rank
upWard prESSurE from• Wage pressure in high-skill industries • Overall wage pressure• Job vacancies
1,518
22.0m
1.0%
3.6%
5.2%
69,100 70,200
1,588
22.2m
1.0%
2.6%
5.5%0
2.5
5
7.5
10
5.5ovErall SCorECountry profIlE
Australia’s score is 5.5 in 2013, a moderate decrease from last year. The relative relaxation of labour market pressures is helped by a number of indicators, including those for labour market participation and talent mismatch. These forces are working in the same direction as a downshift in economic growth, which is expected to fall to 2.6% in 2013 (down from 3.6% in 2012).
4.3
Indicators
brEakdoWn of SEvEn IndICator SCorESIndicators
Education flexibility
talent mismatch
overall wage pressure
labour market participation
labour market flexibility
Wage pressure in high-skill industries
Wage pressure in high-skill occupations
Scores 50 102.5 7.5
unEmploymEnt
gdp
long-term unempl. rate
unemployment rate
*2013 prices
gdp/head (aud*)
gdp (billion aud*)
gdp growth
populatIon
2012 2013†
5.9 in 2012
vIEW from thE groundAs the score of 5.5 suggests, we are witnessing a degree of skill shortages in Australia. Our recruitment landscape has shifted from mining-led to a system of micro-economies. While demand is not evident in every function in every region, we are seeing sustained demand for specific skills in the more traditional disciplines such as accountancy and finance, IT and sales and marketing. A factor behind much of the demand is the focus of organisations on structural change to drive improved productivity levels. Salary growth will be modest in 2013-14 despite the expected growth in confidence in the economy. Nick Deligiannis, Managing Director, Hays Australia
kEy fIndIngAs Chinese companies move up the value chain and the country’s productivity continues to catch up to that of other countries, real wages will rise (as they are expected to do in 2013). In this environment, employers seeking to attract high-skill workers must be prepared to pay for it.
doWnWard prESSurE from• Increase in education levels• Labour market participation, ages 55-64• Labour market participation, ages 15-24
upWard prESSurE from• Overall wage pressure• Talent mismatch• Labour market inflexibility
52,605
1,372.3m
n/a
7.8%
4.1%
38,300 41,000
56,567
1,380.8m
n/a
7.5%
4.0%
5.0ovErall SCorECountry profIlE
China’s 2013 score of 5.0 reflects a mixed environment. While the country’s rapid achievements in education and high rates of labour market participation contribute to downward pressures, upward pressures exist as well (as indicated by our talent mismatch and labour market flexibility indicators).
China’s GDP is expected to grow by 7.5% in 2013. While this is down on recent years, it is still an impressive figure by international standards, suggesting that China’s economy remains buoyant and its labour market is active.
0
2.5
5
7.5
10
baCkground EConomIC data
1.3
3.0
8.0
6.0
8.6
3.0
5.0
Indicators
brEakdoWn of SEvEn IndICator SCorESIndicators
Education flexibility
talent mismatch
overall wage pressure
labour market participation
labour market flexibility
Wage pressure in high-skill industries
Wage pressure in high-skill occupations
Scores 50 102.5 7.5
unEmploymEnt
gdp
long-term unempl. rate
unemployment rate
*2013 prices
gdp/head (Cny*)
gdp (billion Cny*)
gdp growth
populatIon
2012 2013†
5.5 in 2012
vIEW from thE groundAs the 5.0 score suggests, China’s labour market is balanced but also incredibly active. Turnover is an issue for employers in China, particularly around the one to two-year mark of employment. Once restricted to tier-one cities, more multinational corporations and other investors are entering tier-two and three cities where skilled candidates can now look for and find more job opportunities. While most sectors can replace departing staff, others such as manufacturing and operations face skills shortages, as the talent mismatch score implies. Employers are finding it difficult to source engineering, sales and technical candidates. Simon Lance, Regional Director, Hays China
auStralIa ChIna
PLC-6962-1 Hays GSI 2013_Report-2.indd 22-23 27/09/2013 15:10

24 | The Hays Global Skills Index 2013 The Hays Global Skills Index 2013 | 25
ASI
A P
ACI
FIC
VIew From the groundAustralia’s Hays Global Skills’ Index Score is 5.6 in 2013, slightly down from last year. The relative relaxation of labour market pressures is helped by a number of indicators, including those for labour market participation and talent mismatch. These forces are working in the same direction as a downshift in economic growth, which is expected to fall to 2.6% in 2013 (down from 3.6% in
2012). Hays MD
VIew From the groundAustralia’s Hays Global Skills’ Index Score is 5.6 in 2013, slightly down from last year. The relative relaxation of labour market pressures is helped by a number of indicators, including those for labour market participation and talent mismatch. These forces are working in the same direction as a downshift in economic growth, which is expected to fall to 2.6% in 2013 (down from 3.6% in
2012). Hays MD
ASIA
PACIFIC
†Forecast figures for 2013 †Forecast figures for 2013
NOTE: The analysis on which the Hays Global Skills Index was based utilised data as of Q2 2013. Developments subsequent to this date are not reflected in the 2013 findings.
NOTE: The analysis on which the Hays Global Skills Index was based utilised data as of Q2 2013. Developments subsequent to this date are not reflected in the 2013 findings.
1.7
4.9
1.7
4.8
8.7
5.6
1.0
kEy fIndIngThe primary driver of a higher score is overall wage pressure in Hong Kong. Real wages economy-wide are anticipated to rise by 3.9% in 2013, an increase over last year’s 2% increase and likely in recognition of increasing productivity among employees.
doWnWard prESSurE from• International PISA rank• Wage pressure in high-skill occupations• Labour market regulations
upWard prESSurE from• Overall wage pressure• Labour market participation, ages 15-24• Wage pressure in high-skill industries
2,165
7.2m
n/a
1.5%
3.3%
300,700 306,200
2,226
7.3m
n/a
2.8%
3.5%
4.1ovErall SCorECountry profIlE
Hong Kong’s overall score is 4.1, a moderate increase from last year. An uptick in demand as a result of an increase in GDP growth will reinforce that trend. Hong Kong’s economy is forecast to grow by 2.8% in 2013, up from 1.5% in 2012. Expectations for employment growth are more meagre, at 1.7%, and are indicative of rising productivity among employees.
0
2.5
5
7.5
10
baCkground EConomIC data
Indicators
brEakdoWn of SEvEn IndICator SCorESIndicators
Education flexibility
talent mismatch
overall wage pressure
labour market participation
labour market flexibility
Wage pressure in high-skill industries
Wage pressure in high-skill occupations
Scores 50 102.5 7.5
unEmploymEnt
gdp
long-term unempl. rate
unemployment rate
*2013 prices
gdp/head (hkd*)
gdp (billion hkd*)
gdp growth
populatIon
2012 2013†
3.7 in 2012
vIEW from thE groundWhile demand is not evident in every function there are pockets of specific recruitment activity in Hong Kong. For instance the retail, IT and telecommunications sectors are recruiting, building developers are active, the insurance industry remains strong as key players target Asia for growth and Hong Kong continues to offer great opportunities for legal professionals. For those areas where employers are recruiting, temporary, contract and part-time employees are popular choices. But employers have high expectations when they recruit. They will only make job offers to the top tier candidates with specific skills and backgrounds that match their industry. Marc Burrage, Regional Director, Hays Hong Kong
0.2
4.6
7.0
5.0
4.1
3.6
5.0
baCkground EConomIC data
kEy fIndIngIndia’s strong year-on-year increases in the tertiary educated population contribute significantly to downward pressure of the Index score. Employers may find this eases difficulties recruiting and retaining high-skill workers.
doWnWard prESSurE from• Increase in education levels• Wage pressure in high-skill industries• Labour market participation, ages 15-24
upWard prESSurE from• Net in-migration• Labour market participation, ages 55-64• Structural unemployment
1,249.0m
n/a
12.5%
79,200 82,200
98,911 103,992
1,265.0m
n/a
5.1% 5.1%
12.5%
4.2ovErall SCorECountry profIlE
India’s score of 4.2 suggests labour market pressures that are more moderate than the historical norm. In part, this is a function of India’s slowing economy.
The economy is expected to grow by 5.1% in 2013, the same rate achieved in 2012 but down from the 7.3% average the country experienced in 2000-08. The unemployment rate, which is forecast to remain at 12.5% in 2013, is one of the highest among the countries in the Hays Global Skills Index.
0
2.5
5
7.5
10
Indicators
brEakdoWn of SEvEn IndICator SCorESIndicators
Education flexibility
talent mismatch
overall wage pressure
labour market participation
labour market flexibility
Wage pressure in high-skill industries
Wage pressure in high-skill occupations
Scores 50 102.5 7.5
unEmploymEnt
gdp
long-term unempl. rate
unemployment rate
*2013 prices
gdp/head (Inr*)
gdp (billion Inr*)
gdp growth
populatIon
2012 2013†
4.2 in 2012
vIEW from thE groundIndia recorded its worst GDP growth in a decade amid continuing concerns over high inflation, poor infrastructure development and a weak political scenario. The figures released by the government were met with disappointment and Indian business leaders commented that this marked a significant decline from the optimism of the last six years when growth appeared set to move into double digits. Organisations are cautious when hiring and are instead resorting to other means of recruiting new employees such as social media or improving their brand positioning rather than hiring. Chris Greaves, Managing Director, Hays Gulf Region & India
hong kong IndIa
PLC-6962-1 Hays GSI 2013_Report-2.indd 24-25 27/09/2013 15:10

26 | The Hays Global Skills Index 2013 The Hays Global Skills Index 2013 | 27
ASI
A P
ACI
FIC
VIew From the groundAustralia’s Hays Global Skills’ Index Score is 5.6 in 2013, slightly down from last year. The relative relaxation of labour market pressures is helped by a number of indicators, including those for labour market participation and talent mismatch. These forces are working in the same direction as a downshift in economic growth, which is expected to fall to 2.6% in 2013 (down from 3.6% in
2012). Hays MD
VIew From the groundAustralia’s Hays Global Skills’ Index Score is 5.6 in 2013, slightly down from last year. The relative relaxation of labour market pressures is helped by a number of indicators, including those for labour market participation and talent mismatch. These forces are working in the same direction as a downshift in economic growth, which is expected to fall to 2.6% in 2013 (down from 3.6% in
2012). Hays MD
ASIA
PACIFIC
†Forecast figures for 2013 †Forecast figures for 2013
NOTE: The analysis on which the Hays Global Skills Index was based utilised data as of Q2 2013. Developments subsequent to this date are not reflected in the 2013 findings.
NOTE: The analysis on which the Hays Global Skills Index was based utilised data as of Q2 2013. Developments subsequent to this date are not reflected in the 2013 findings.
3.0
5.4
7.1
9.1
9.5
6.1
5.9
kEy fIndIngThe indicator pointing to the most severe skills gaps issues this year is that for overall wage pressures. Real wages have declined for 11 of the last 12 years and the forecast of a 1.8% increase in 2013 marks a significant departure from this trend.
doWnWard prESSurE from• International PISA rank• Labour market participation• Labour market regulations
upWard prESSurE from• Long-term unemployment• Overall wage pressure• Net in-migration
473,625
126.6m
1.7%
1.9%
4.4%
3,741,600 3,801,900
480,346
126.3m
1.6%
1.4%
4.1%
6.6ovErall SCorECountry profIlE
Japan’s score for 2013 is 6.6, indicative of several notable labour market pressures.
Japan’s economy grew by an average of 1.2% per year during 2000-08. Growth in 2013 is forecast to be 1.4%, making Japan one of the few countries expected to improve upon its pre-recession average. The unemployment rate, already low, is expected to fall further in 2013 to 4.1% (down from 4.4% in 2012). This macroeconomic picture reflects optimism surrounding the Japanese economy on the back of “Abenomics”.
0
2.5
5
7.5
10
baCkground EConomIC data
Indicators
brEakdoWn of SEvEn IndICator SCorESIndicators
Education flexibility
talent mismatch
overall wage pressure
labour market participation
labour market flexibility
Wage pressure in high-skill industries
Wage pressure in high-skill occupations
Scores 50 102.5 7.5
unEmploymEnt
gdp
long-term unempl. rate
unemployment rate
*2013 prices
gdp/head (Jpy*)
gdp (billion Jpy*)
gdp growth
populatIon
2012 2013†
5.3 in 2012
vIEW from thE groundA substantial talent mismatch remains a big challenge in Japan and has led to further tightening of the labour market. Japan’s Index score rose over the past 12 months to 6.6; over this time the demand for talented professionals continued to grow but appropriately skilled candidates remain in short supply. Key factors such as educational framework and workforce participation restrict the ability for Japan to resolve these challenges in the short-term and also restrict the ability to build appropriate skill sets in the long-term. This will only be heightened by the increasing positivity surrounding Japan’s economic outlook. Jonathan Sampson, Regional Director, Hays Japan
3.8
6.1
4.4
3.7
1.2
10.0
0.9
kEy fIndIngNew Zealand received the highest score possible for wage pressure in high-skill industries. A premium is paid for those in technology, residential construction and engineering.
doWnWard prESSurE from• Wage pressure in high-skill occupations• Overall wage pressure• Labour market regulations
upWard prESSurE from• Wage pressure in high-skill industries• Labour market participation, ages 55-64• Increase in education levels
211
4.5m
0.6%
3.0%
6.9%
47,300 48,100
217
4.5m
0.6%
2.8%
6.2%
ovErall SCorECountry profIlEIt is anticipated that New Zealand’s GDP will grow by 2.8% in 2013, slightly below its growth of 3% last year. In keeping with a slight cooling of the economy, the country’s labour market is not expected to exhibit symptoms of severe skills gaps. This will largely depend, however, on the industry in question, as wage pressures from the highest skilled within industries is less severe than the differences between different industries.
baCkground EConomIC data
4.3
0
2.5
5
7.5
10
Indicators
brEakdoWn of SEvEn IndICator SCorESIndicators
Education flexibility
talent mismatch
overall wage pressure
labour market participation
labour market flexibility
Wage pressure in high-skill industries
Wage pressure in high-skill occupations
Scores 50 102.5 7.5
unEmploymEnt
gdp
long-term unempl. rate
unemployment rate
*2013 prices
gdp/head (nzd*)
gdp (billion nzd*)
gdp growth
populatIon
2012 2013†
4.8 in 2012
vIEW from thE groundMany New Zealand employers are cautiously optimistic and are making strategic hires into roles that offer long-term benefits. Although delays in the commencement of commercial construction projects in Christchurch are causing frustrations, the re-build continues to be a major driver. Residential construction work elsewhere and new commercial and seismic strengthening work are also creating jobs. Following a Royal Commission investigation, over the next 20 years 193,000 commercial buildings will be assessed for earthquake risk and, if necessary, strengthened. Ultra-Fast Broadband, e-mobile developments and ERP projects are also driving the acquisition of talent. Jason Walker, Managing Director, Hays New Zealand
Japan nEW zEaland
PLC-6962-1 Hays GSI 2013_Report-2.indd 26-27 27/09/2013 15:10

28 | The Hays Global Skills Index 2013 The Hays Global Skills Index 2013 | 29
EURO
PE
ViEw fROm thE gROUndAustralia’s Hays Global Skills’ Index Score is 5.6 in 2013, slightly down from last year. The relative relaxation of labour market pressures is helped by a number of indicators, including those for labour market participation and talent mismatch. These forces are working in the same direction as a downshift in economic growth, which is expected to fall to 2.6% in 2013 (down from 3.6% in
2012). Hays MD
†Forecast figures for 2013
NOTE: The analysis on which the Hays Global Skills Index was based utilised data as of Q2 2013. Developments subsequent to this date are not reflected in the 2013 findings.
ASi
A P
ACi
fiC
ViEw fROm thE gROUndAustralia’s Hays Global Skills’ Index Score is 5.6 in 2013, slightly down from last year. The relative relaxation of labour market pressures is helped by a number of indicators, including those for labour market participation and talent mismatch. These forces are working in the same direction as a downshift in economic growth, which is expected to fall to 2.6% in 2013 (down from 3.6% in
2012). Hays MD
†Forecast figures for 2013
NOTE: The analysis on which the Hays Global Skills Index was based utilised data as of Q2 2013. Developments subsequent to this date are not reflected in the 2013 findings.
0.8
5.6
0.6
5.9
2.6
8.5
8.5
kEy fIndIngThe two indicators contributing the greatest source of pressures include the wage premium in high-skill industries and high-skill occupations; this is despite real wage growth in the economy overall flatlining in 2013.
doWnWard prESSurE from• Net in-migration• International PISA rank• Labour market regulations
upWard prESSurE from• Wage pressure in high-skill occupations• Wage pressure in high-skill industries• Labour market participation, ages 55-64
358
5.3m
0.0%
1.3%
1.9%
67,500 68,100
367
5.4m
0.0%
2.3%
1.9%
4.6ovErall SCorECountry profIlE
Singapore’s overall score of 4.6 is indicative of a mixed labour market environment, where wages in high-skill industries and occupations are indicative of significant skills shortages; however, low scores for education flexibility and labour market flexibility mitigate the impact on the score overall.
Singapore’s economy is expected to grow by 2.3% in real terms this year, a full percentage point increase over 2012. Real wages, in contrast, are expected to hold constant in 2013, although this is an improvement over the 1.8% decline recorded last year.
0
2.5
5
7.5
10
baCkground EConomIC data
Indicators
brEakdoWn of SEvEn IndICator SCorESIndicators
Education flexibility
talent mismatch
overall wage pressure
labour market participation
labour market flexibility
Wage pressure in high-skill industries
Wage pressure in high-skill occupations
Scores 50 102.5 7.5
unEmploymEnt
gdp
long-term unempl. rate
unemployment rate
*2013 prices
gdp/head (Sgd*)
gdp (billion Sgd*)
gdp growth
populatIon
2012 2013†
5.1 in 2012
vIEW from thE groundMany employers in Singapore tell us that skill shortages remain an issue. Organisations are looking for people who can help them make informed business decisions and grow their business. So while demand is not evident across the board, specific skills are sought after as employers replace departing staff and make selective investments in roles that can add immediate value. Many employers in Singapore are using a flexible approach to staffing, either temporary or contract employees or the employment of part-time staff. Those candidates in demand are those with not only the required technical capability but also cultural fit. Chris Mead, Regional Director, Hays Singapore
vIEW from thE groundThe past year has shown some marked changes in the Austrian labour market. The second half of 2012 showed stark drops in new positions being posted due to companies waiting to see what happened in the primary Austrian export countries. As certain aspects of stability returned in those countries, the Austrian companies commenced increasing their hiring in the first half of 2013. Austria has a large amount of banking and high-tech companies carrying out research and development, these sectors have at least shown a strong resilience to world trends. Mark Frost, Managing Director, Hays Austria
6.0
5.0
3.9
4.0
5.2
7.6
3.6
baCkground EConomIC data
kEy fIndIngWhile wage pressures in high-skill industries and the number of vacancies in Austria are contributing to upward pressures, countervailing forces include some improvements in the labour market regulatory environment.
doWnWard prESSurE from• Structural unemployment• Labour market regulations• Wage pressure in high-skill occupations
upWard prESSurE from• Wage pressure in high-skill industries• Job vacancies• International PISA rank
2012
8.5m
1.1%
4.4%
37,400 37,400
316 317
8.5m
1.3%
0.8% 0.4%
5.2%
2013†5.0ovErall SCorECountry profIlE
Austria’s score of 5.0 represents a balanced labour market environment overall, although there is some variation across indicators.
Like many of its European counterparts, Austria’s economy is expected to slow in 2013. GDP growth is forecast at 0.4% this year, down from 0.8% last year. At the same time, the country’s unemployment rate is expected to rise to 5.2% (up from 4.4% in 2012).
0
2.5
5
7.5
10
brEakdoWn of SEvEn IndICator SCorESIndicators Scores
Education flexibility
talent mismatch
overall wage pressure
labour market participation
labour market flexibility
Wage pressure in high-skill industries
Wage pressure in high-skill occupations
50 102.5 7.5
unEmploymEnt
gdp
long-term unempl. rate
unemplyoment rate
*2013 prices
gdp/head (Eur*)
gdp (billion Eur*)
gdp growth
populatIonn/a in 2012
SIngaporE auStrIa
PLC-6962-1 Hays GSI 2013_Report-2.indd 28-29 27/09/2013 15:10

30 | The Hays Global Skills Index 2013 The Hays Global Skills Index 2013 | 31
EURO
PEEURO
PE
ViEw fROm thE gROUndAustralia’s Hays Global Skills’ Index Score is 5.6 in 2013, slightly down from last year. The relative relaxation of labour market pressures is helped by a number of indicators, including those for labour market participation and talent mismatch. These forces are working in the same direction as a downshift in economic growth, which is expected to fall to 2.6% in 2013 (down from 3.6% in
2012). Hays MD
†Forecast figures for 2013 †Forecast figures for 2013
NOTE: The analysis on which the Hays Global Skills Index was based utilised data as of Q2 2013. Developments subsequent to this date are not reflected in the 2013 findings.
NOTE: The analysis on which the Hays Global Skills Index was based utilised data as of Q2 2013. Developments subsequent to this date are not reflected in the 2013 findings.
vIEW from thE groundDespite a highly educated workforce, Belgium is experiencing critical skill shortages for niche positions, particularly in the life sciences, engineering and IT sectors. This has led to a war for talent among employers. High employment costs are a major issue while the considerable tax burden on employee salaries has led to a brain drain and organisations having to look overseas to plug their skill gaps. This scenario has narrowed the wage gap between more senior or niche profiles and less-skilled jobs. Organisations are having to outsource their activities to remain competitive.Wilfrid de Brouwer, Managing Director, Hays Belgium
5.9
5.0
4.7
2.2
5.9
0.0
4.3
11.1m
3.7%
7.6%
34,600 34,400
384 383
11.1m
4.0%
-0.3% -0.1%
8.4%
4.0ovErall SCorECountry profIlE
Belgium’s score for 2013, at 4.0, is representative of an economy still mired in recession (GDP is forecast to contract by 0.1% in 2013) and a labour force struggling to adjust (the unemployment rate is forecast to rise to 8.4% in 2013).
One outpost of pressure observed in the Index is that for overall wages, but this is likely misleading. In fact, in recent years Belgium has lost export competitiveness compared to its primary economic partners (Germany, France, and the Netherlands), as sticky inflation and wage indexation have pushed labour costs up.
0
2.5
5
7.5
10
brEakdoWn of SEvEn IndICator SCorESIndicators
Education flexibility
talent mismatch
overall wage pressure
labour market participation
labour market flexibility
Wage pressure in high-skill industries
Wage pressure in high-skill occupations
kEy fIndIngWages in high-skill industries have suffered during the global economic downturn, as indicated by a score of 0.0 for this indicator. Employers in sectors like finance and insurance and information and communications should find it easier to attract and retain high-skill workers than has historically been the case.
doWnWard prESSurE from• Wage pressure in high-skill industries• Structural unemployment• International PISA rank
upWard prESSurE from• Increase in education levels• Net in-migration• Overall wage pressure
Scores 50 102.5 7.5
baCkground EConomIC data
2012 2013†
unEmploymEnt
gdp
long-term unempl. rate
unemployment rate
*2013 prices
gdp/head (Eur*)
gdp (billion Eur*)
gdp growth
populatIon3.3
in 2012
vIEW from thE groundA combination of political instability, continued austerity measures and uncompetitive investment incentives has stifled any potential growth for the Czech Republic’s economy. However, with the recent upturn in Western Europe, and specifically Germany, it could be seen as a positive indicator for the coming year. Any positive change would be dependent on the local economy being able to react and accommodate to such a change in conditions. Jon Hill, Country Manager, Hays Czech Republic
8.0
4.6
4.1
0.7
1.7
5.5
6.3
baCkground EConomIC data
kEy fIndIngThe Czech Republic saw a significant increase in labour market participation last year, and another expected increase this year (from 72.8% to 74.5%) contributes significantly to downward pressures.
doWnWard prESSurE from• Long-term unemployment• Overall wage pressure• Labour market participation
upWard prESSurE from• Increase in education levels• Net in-migration• Structural unemployment
10.5m
2.9%
7.0%
370,800 367,200
1,530 1,543
10.5m
3.0%
-1.2% -1.0%
7.3%
4.4ovErall SCorECountry profIlE
The score for the Czech Republic is 4.4, down slightly from last year. This is indicative of weaker than normal labour market conditions in the country.
The Czech economy remains in recession: it is forecast to shrink by 1% in 2013, following a 1.2% contraction in 2012. The rate of unemployment is also expected to increase from 7% in 2012 to 7.3% in 2013.
0
2.5
5
7.5
10
brEakdoWn of SEvEn IndICator SCorESIndicators
Education flexibility
talent mismatch
overall wage pressure
labour market participation
labour market flexibility
Wage pressure in high-skill industries
Wage pressure in high-skill occupations
Scores 50 102.5 7.5
2012 2013†
unEmploymEnt
gdp
long-term unempl. rate
unemployment rate
*2013 prices
gdp/head (Czk*)
gdp (billion Czk*)
gdp growth
populatIon4.6
in 2012
bElgIum CzECh rEpublIC
PLC-6962-1 Hays GSI 2013_Report-2.indd 30-31 27/09/2013 15:10

32 | The Hays Global Skills Index 2013 The Hays Global Skills Index 2013 | 33
EURO
PEEURO
PE
ViEw fROm thE gROUndAustralia’s Hays Global Skills’ Index Score is 5.6 in 2013, slightly down from last year. The relative relaxation of labour market pressures is helped by a number of indicators, including those for labour market participation and talent mismatch. These forces are working in the same direction as a downshift in economic growth, which is expected to fall to 2.6% in 2013 (down from 3.6% in
2012). Hays MD
ViEw fROm thE gROUndAustralia’s Hays Global Skills’ Index Score is 5.6 in 2013, slightly down from last year. The relative relaxation of labour market pressures is helped by a number of indicators, including those for labour market participation and talent mismatch. These forces are working in the same direction as a downshift in economic growth, which is expected to fall to 2.6% in 2013 (down from 3.6% in
2012). Hays MD
†Forecast figures for 2013 †Forecast figures for 2013
NOTE: The analysis on which the Hays Global Skills Index was based utilised data as of Q2 2013. Developments subsequent to this date are not reflected in the 2013 findings.
NOTE: The analysis on which the Hays Global Skills Index was based utilised data as of Q2 2013. Developments subsequent to this date are not reflected in the 2013 findings.
vIEW from thE groundThe unemployment rate was at an all-time low in the autumn of 2008, with unemployment at less than two per cent. The current unemployment rate is at more than seven per cent and is the result of the economic downturn. The economy is still suffering under the crisis, the gross domestic product has not recovered and is below 2008 levels. Although we expect no significant change in the employment market in 2013, we have seen an increase in the number of job postings which is a positive sign. Matthias Ruff, Managing Director, Hays Denmark
6.3
5.6
2.9
6.1
2.5
0.0
5.8
baCkground EConomIC data
kEy fIndIngDenmark has seen a worrying uptick in the rate of long-term unemployment (those that have been unemployed for over a year). The latest figure, which contributes significantly to Denmark’s talent mismatch score, stands at 24%, up five percentage points from the previous year, and 2.5 times the rate in 2009.
doWnWard prESSurE from• Wage pressure in high-skill industries• Labour market regulations• Overall wage pressure
upWard prESSurE from• Long-term unemployment • Increase in education levels• Labour market participation
5.6m
1.8%
7.5%
330,100 329,800
1,844 1,846
5.6m
1.8%
-0.5% 0.1%
7.4%
4.2ovErall SCorECountry profIlE
Denmark’s overall score of 4.2 suggests labour market pressures are weak. In part, this reflects poor economic growth, with GDP expected to grow by just 0.1% in 2013. Denmark’s slow growth predates the current economic crisis and employers have struggled with wages rising faster than productivity. In part, this may be related to the idiosyncratic mix of wage bargaining at the sectoral level as well as at the level of the firm.
0
2.5
5
7.5
10
brEakdoWn of SEvEn IndICator SCorESIndicators
Education flexibility
talent mismatch
overall wage pressure
labour market participation
labour market flexibility
Wage pressure in high-skill industries
Wage pressure in high-skill occupations
Scores 50 102.5 7.5
2012 2013†
unEmploymEnt
gdp
long-term unempl. rate
unemployment rate
*2013 prices
gdp/head (dkk*)
gdp (billion dkk*)
gdp growth
populatIon4.3
in 2012
vIEW from thE groundThe French government recently unveiled reform plans in an effort to boost employment and preserve the pension system. Despite these steps the unemployment rate remains above the critical mark of 10 per cent, showing a depressed labour market. Those affected the most are young and senior workers, while the access to the employment market is increasingly dependent on unstable labour contracts. On the other hand, the employment of executives seems to be less affected by weak market conditions and employers are able to take advantage of the high-level skilled and rare profiles strongly sought by recruiters. Tina Ling, Managing Director, Hays France & Luxembourg
3.5
4.2
8.0
6.9
4.7
5.2
4.0
baCkground EConomIC data
kEy fIndIngLabour market rigidities in France, reflected in our high score for our labour market flexibility indicator, continue to contribute upward pressure to the Index score for France.
doWnWard prESSurE from• Increase in education levels • Labour market participation• Wage pressure in high-skill occupations
upWard prESSurE from• Labour market regulations • Job vacancies• Long-term unemployment
65.5m
4.2%
10.2%
31,500 31,300
2,066 2,062
65.8m
4.6%
0.0% -0.2%
11.2%
5.2ovErall SCorECountry profIlE
France’s score in 2013 is 5.2, which is indicative of very mild labour market pressures largely due to the country’s labour market rigidities rather than a booming economy.
Indeed, the French economy continues to struggle and in 2013 the economy is expected to contract by 0.2%. In line with worsening macroeconomic conditions, the rate of unemployment is forecasted to rise from 10.2% to 11.2%. Another worrying sign is the increasing number of the unemployed who remain so for one year or longer. 0
2.5
5
7.5
10
brEakdoWn of SEvEn IndICator SCorESIndicators
Education flexibility
talent mismatch
overall wage pressure
labour market participation
labour market flexibility
Wage pressure in high-skill industries
Wage pressure in high-skill occupations
Scores 50 102.5 7.5
unEmploymEnt
gdp
long-term unempl. rate
unemployment rate
*2013 prices
gdp/head (Eur*)
gdp (billion Eur*)
gdp growth
populatIon
2012 2013†
4.5 in 2012
dEnmark franCE
PLC-6962-1 Hays GSI 2013_Report-2.indd 32-33 27/09/2013 15:10

34 | The Hays Global Skills Index 2013 The Hays Global Skills Index 2013 | 35
EURO
PEEURO
PE
ViEw fROm thE gROUndAustralia’s Hays Global Skills’ Index Score is 5.6 in 2013, slightly down from last year. The relative relaxation of labour market pressures is helped by a number of indicators, including those for labour market participation and talent mismatch. These forces are working in the same direction as a downshift in economic growth, which is expected to fall to 2.6% in 2013 (down from 3.6% in
2012). Hays MD
ViEw fROm thE gROUndAustralia’s Hays Global Skills’ Index Score is 5.6 in 2013, slightly down from last year. The relative relaxation of labour market pressures is helped by a number of indicators, including those for labour market participation and talent mismatch. These forces are working in the same direction as a downshift in economic growth, which is expected to fall to 2.6% in 2013 (down from 3.6% in
2012). Hays MD
†Forecast figures for 2013 †Forecast figures for 2013
NOTE: The analysis on which the Hays Global Skills Index was based utilised data as of Q2 2013. Developments subsequent to this date are not reflected in the 2013 findings.
NOTE: The analysis on which the Hays Global Skills Index was based utilised data as of Q2 2013. Developments subsequent to this date are not reflected in the 2013 findings.
vIEW from thE groundOver the past year German companies have increased their hiring across all industries. At present the employment rate is the highest the German economy has ever seen. On the other hand, many people are in part-time employment. In order to answer the demographic shift, Germany needs more full-time employees as well as the immigration of highly-skilled workers from other countries and a comprehensive strategy for education so less-qualified people have better access to the labour market. Klaus Breitschopf, Managing Director, Hays Germany
6.4
4.7
6.9
4.1
5.7
10.0
6.6
kEy fIndIngThe latest data for registered job vacancies shows that they are alarmingly high, and this is a significant contributor along with wages in high-skill industries to labour market pressures in Germany.
doWnWard prESSurE from• Long-term unemployment• Structural unemployment• Labour market participation
upWard prESSurE from• Wage pressure in high-skill industries• Job vacancies• Increase in education levels
81.7m
2.6%
5.5%
32,800 33,000
2,684 2,691
81.6m
2.6%
0.9% 0.3%
5.4%
6.3ovErall SCorECountry profIlE
Germany’s score is 6.3 for 2013. The country’s labour market continues last year’s trend of relatively strong labour market pressures.
In many respects, German workers have fared relatively well during the global economic downturn, with an average unemployment rate of 6.8% in 2008-12. This is expected to decline to a mere 5.4% in 2013. The country’s economy may not fare as well, however, as GDP growth is forecast to fall to 0.3% (down from 0.9% in 2012).
0
2.5
5
7.5
10
brEakdoWn of SEvEn IndICator SCorESIndicators
Education flexibility
talent mismatch
overall wage pressure
labour market participation
labour market flexibility
Wage pressure in high-skill industries
Wage pressure in high-skill occupations
Scores 50 102.5 7.5
2012 2013†
unEmploymEnt
gdp
long-term unempl. rate
unemployment rate
*2013 prices
gdp/head (Eur*)
gdp (billion Eur*)
gdp growth
populatIon
baCkground EConomIC data
6.4 in 2012
vIEW from thE groundThe moderate increase in the overall score from 6.1 in 2012 to 6.3 is mainly due to increased wage pressure in high-skilled industries, particularly in IT and Engineering. While these sectors are becoming more and more candidate driven, in other areas there is generally an excessive supply of talent. Hungary is still considered to be a country with very attractive labour costs and a number of global companies have decided to set up operations in the country, enabling them to take advantage of the talent pool of young well-qualified professionals. Tammy Nagy-Stellini, Country Manager, Hays Hungary
6.9
4.8
4.6
9.0
3.8
10.0
4.8
baCkground EConomIC data
kEy fIndIngAlong with a premium for workers in high-skill industries, a confluence of job vacancies (50% higher today than the 2000-08 average) and long-term unemployment are pushing Hungary’s score higher than it otherwise would be.
doWnWard prESSurE from• Labour market participation • Overall wage pressure• Labour market participation, ages 15-24
upWard prESSurE from• Job vacancies• Wage pressure in high-skill industries• Long-term unemployment
9.9m
5.4%
10.9%
2,919,700 2,941,400
29,033 29,189
9.9m
5.4%
-1.8% 0.5%
10.9%
6.3ovErall SCorECountry profIlE
Hungary’s score for 2013 is 6.3, up from last year and representative of a moderate degree of labour market pressure.
After a 1.8% decline last year, Hungary’s economy is expected to grow in real terms by just 0.5% in 2013. Total output remains well below trend output based on pre-recession growth rates.
A defining feature of Hungary’s labour market is low overall rates of economic participation. Just 65% of the working age population is either in a job or looking for one.
0
2.5
5
7.5
10
brEakdoWn of SEvEn IndICator SCorESIndicators
Education flexibility
talent mismatch
overall wage pressure
labour market participation
labour market flexibility
Wage pressure in high-skill industries
Wage pressure in high-skill occupations
Scores 50 102.5 7.5
unEmploymEnt
gdp
long-term unempl. rate
unemployment rate
*2013 prices
gdp/head (huf*)
gdp (billion huf*)
gdp growth
populatIon
2012 2013†
6.1 in 2012
gErmany hungary
PLC-6962-1 Hays GSI 2013_Report-2.indd 34-35 27/09/2013 15:10

36 | The Hays Global Skills Index 2013 The Hays Global Skills Index 2013 | 37
EURO
PEEURO
PE
ViEw fROm thE gROUndAustralia’s Hays Global Skills’ Index Score is 5.6 in 2013, slightly down from last year. The relative relaxation of labour market pressures is helped by a number of indicators, including those for labour market participation and talent mismatch. These forces are working in the same direction as a downshift in economic growth, which is expected to fall to 2.6% in 2013 (down from 3.6% in
2012). Hays MD
ViEw fROm thE gROUndAustralia’s Hays Global Skills’ Index Score is 5.6 in 2013, slightly down from last year. The relative relaxation of labour market pressures is helped by a number of indicators, including those for labour market participation and talent mismatch. These forces are working in the same direction as a downshift in economic growth, which is expected to fall to 2.6% in 2013 (down from 3.6% in
2012). Hays MD
†Forecast figures for 2013 †Forecast figures for 2013
NOTE: The analysis on which the Hays Global Skills Index was based utilised data as of Q2 2013. Developments subsequent to this date are not reflected in the 2013 findings.
NOTE: The analysis on which the Hays Global Skills Index was based utilised data as of Q2 2013. Developments subsequent to this date are not reflected in the 2013 findings.
vIEW from thE groundIt is a mixed picture for Ireland. While there are definite reasons for optimism there are still areas of economic weakness, including high unemployment, which is keeping confidence levels down. The talent mismatch indicator is still very high and action needs to be taken to develop the skills employers need and ensure candidates have the confidence to move roles. The increase in labour market flexibility is welcome and will help overall competitiveness. However, the stark skills shortages in areas such as IT are still apparent and causing upward wage pressure in those sectors. Richard Eardley, Managing Director, Hays Ireland
4.8
6.6
3.1
10.0
1.3
6.1
6.5
baCkground EConomIC data
kEy fIndIngLong-term unemployment in Ireland is proving to be one of the most pressing problems for the country. Of the 13.4% of the labour force that is unemployed, the latest data indicate that 62% have been unemployed for a year or longer.
doWnWard prESSurE from• Overall wage pressure• Labour market regulations• Increase in education levels
upWard prESSurE from• Long-term unemployment • Labour market participation• Wage pressure in high-skill occupations
4.6m
8.8%
14.7%
36,100 36,300
166 167
4.6m
8.0%
0.9% 0.8%
13.4%
5.5ovErall SCorECountry profIlE
Ireland’s score in 2013 is 5.5, representing a mixed labour market picture. While some indicators point to high stress points, others point to weakness in the labour market and an economy in transition.
Ireland suffered a sharp contraction in 2008-09 as a result of the global economic downturn and trend growth has yet to return. The economy is scheduled to grow by just 0.8% in 2013. While the unemployment rate is forecast to fall slightly, there is some evidence that this is due to workers leaving the labour force.
0
2.5
5
7.5
10
brEakdoWn of SEvEn IndICator SCorESIndicators
Education flexibility
talent mismatch
overall wage pressure
labour market participation
labour market flexibility
Wage pressure in high-skill industries
Wage pressure in high-skill occupations
Scores 50 102.5 7.5
unEmploymEnt
gdp
long-term unempl. rate
unemployment rate
*2013 prices
gdp/head (Eur*)
gdp (billion Eur*)
gdp growth
populatIon
2012 2013†
4.4 in 2012
vIEW from thE groundPolitical instability, difficulties attracting foreign investment and the country’s worsening international reputation are just three of the key factors contributing to Italy’s on-going recessionary battles. Reforms from previous and current governments, as well as a lack of available credit from banks, are preventing the necessary injection needed to stimulate economic growth. Spiralling costs and high levels of bureaucracy in the public sector are compounding the debt situation. The labour market, manufacturing and services as well as the public sector are all in need of medium-term reform if the current situation is to be rectified. Carlos Soave, Managing Director, Hays Italy
5.7
3.8
6.0
6.6
1.2
0.0
2.0
baCkground EConomIC data
kEy fIndIngIn line with economic conditions, wages in high-skill occupations, high-skill industries, and in the economy overall are expected to be subdued in 2013. Real wages are forecast to fall by 0.4%, pushing the overall score for the country down.
doWnWard prESSurE from• Wage pressure in high-skill industries• Overall wage pressure• Wage pressure in high-skill occupations
upWard prESSurE from• Structural unemployment• Labour market regulations• International PISA rank
60.8m
5.5%
10.7%
26,100 25,600
1,587 1,557
60.8m
6.3%
-2.4% -1.9%
12.2%
3.6ovErall SCorECountry profIlE
Italy’s score is 3.6 in 2013, which is largely a function of weak demand in the economy overall. Italy’s economy has been badly damaged by the global economic downturn. Total output in 2013 will remain below its level in 2000. Meanwhile, the unemployment rate is expected to rise from 10.7% in 2012 to 12.2% in 2013.
A key factor impacting Italy’s labour market is a low rate of labour market participation - those working or looking for work comprise 65% of the working age population and just 50% for women.
0
2.5
5
7.5
10
brEakdoWn of SEvEn IndICator SCorESIndicators
Education flexibility
talent mismatch
overall wage pressure
labour market participation
labour market flexibility
Wage pressure in high-skill industries
Wage pressure in high-skill occupations
Scores 50 102.5 7.5
unEmploymEnt
gdp
long-term unempl. rate
unemployment rate
*2013 prices
gdp/head (Eur*)
gdp (billion Eur*)
gdp growth
populatIon
2012 2013†
3.3 in 2012
IrEland Italy
PLC-6962-1 Hays GSI 2013_Report-2.indd 36-37 27/09/2013 15:10

38 | The Hays Global Skills Index 2013 The Hays Global Skills Index 2013 | 39
EURO
PEEURO
PE
ViEw fROm thE gROUndAustralia’s Hays Global Skills’ Index Score is 5.6 in 2013, slightly down from last year. The relative relaxation of labour market pressures is helped by a number of indicators, including those for labour market participation and talent mismatch. These forces are working in the same direction as a downshift in economic growth, which is expected to fall to 2.6% in 2013 (down from 3.6% in
2012). Hays MD
ViEw fROm thE gROUndAustralia’s Hays Global Skills’ Index Score is 5.6 in 2013, slightly down from last year. The relative relaxation of labour market pressures is helped by a number of indicators, including those for labour market participation and talent mismatch. These forces are working in the same direction as a downshift in economic growth, which is expected to fall to 2.6% in 2013 (down from 3.6% in
2012). Hays MD
†Forecast figures for 2013 †Forecast figures for 2013
NOTE: The analysis on which the Hays Global Skills Index was based utilised data as of Q2 2013. Developments subsequent to this date are not reflected in the 2013 findings.
NOTE: The analysis on which the Hays Global Skills Index was based utilised data as of Q2 2013. Developments subsequent to this date are not reflected in the 2013 findings.
vIEW from thE groundDespite a weak economic environment, Luxembourg has benefited from an attractive situation in Europe, particularly with regard to cross-border workers. Indeed, salaries are globally higher than in France and lots of French living in border-regions work in the country. Thanks to a dynamic GDP growth (1.1 per cent forecast in 2013), the unemployment rate is one of the lowest in the EU and the labour market still offers job opportunities in a various range of sectors. Candidate profiles in construction and property, management controllers in finance and expert profiles in human resources are strongly sought by Luxembourg companies. Tina Ling, Managing Director, Hays France & Luxembourg
6.2
5.5
3.8
8.4
3.8
4.8
5.4
baCkground EConomIC data
kEy fIndIngThe current number of unfilled job vacancies is nearly double the 2000-08 average. In conjunction with a high rate of long-term unemployment, this suggests significant skills mismatch issues in Luxembourg.
doWnWard prESSurE from• Net in-migration• Overall wage pressure• Wage pressure in high-skill industries
upWard prESSurE from• Job vacancies• Labour market regulations• Structural unemployment
0.5m
1.5%
5.1%
85,900 85,900
45 46
0.5m
1.7%
0.3% 1.1%
5.8%
5.4ovErall SCorECountry profIlE
The score for Luxembourg in 2013 is 5.4, suggesting moderate labour market pressures. Pressure from our talent mismatch variable is the primary source.
Like many European countries, Luxembourg’s economic growth in 2013 (1.1%) is expected to be considerably below its 2000-08 average (4.1%). More favourably, the country’s rate of unemployment is low expected to be just 5.8% in 2013. Among those who are unemployed, however, 30% have been so for a year or longer.
0
2.5
5
7.5
10
brEakdoWn of SEvEn IndICator SCorESIndicators
Education flexibility
talent mismatch
overall wage pressure
labour market participation
labour market flexibility
Wage pressure in high-skill industries
Wage pressure in high-skill occupations
Scores 50 102.5 7.5
unEmploymEnt
gdp
long-term unempl. rate
unemployment rate
*2013 prices
gdp/head (Eur*)
gdp (billion Eur*)
gdp growth
populatIon
2012 2013†
n/a in 2012
vIEW from thE groundThe Netherlands’ economy has been in recession since 2008 and this has impacted confidence within the labour market and employers are hesitant to hire. Overall there is low demand and high supply, which takes away the pressure of recruiting for most employers. Specialist skills are in high demand and talented international candidates find they are able to work for their employer of choice. The Netherlands is recognised as an attractive place to work for cross border professionals, this works as a short-term solution, but when the economy picks up the domestic supply of highly-skilled workers needs to be increased. Robert van Veggel, Managing Director, Hays Netherlands
4.6
6.2
4.8
3.5
0.0
6.1
4.6
baCkground EConomIC data
kEy fIndIngWhile participation in the labour market is high, improvements are expected to slow in 2013. Paradoxically, this contributes the most to upward pressures in the Netherlands (insofar as they exist at all). Employers accustomed to a flood of additional labour coming on-line annually may find a mere trickle this year.
doWnWard prESSurE from• Overall wage pressure• International PISA rank• Structural unemployment
upWard prESSurE from• Wage pressure in high-skill industries• Increase in education levels• Labour market regulations
16.8m
1.8%
5.3%
36,400 36,000
611 605
16.8m
2.3%
-0.1% -0.9%
6.8%
4.3ovErall SCorECountry profIlE
The Netherlands, with a score of 4.3, is going through a period of adjustment. Oxford Economics forecasts a 0.9% contraction this year, which follows a 1% contraction in 2012. In this environment, employers may have a relatively easy time of attracting and retaining the skilled labour they require. The Netherlands seems to be weathering this adjustment successfully, considering its unemployment rate is expected to reach just 6.8% in 2013 (up from last year’s 5.3%) and participation in the labour market is expected to reach a high not seen in at least two decades.
0
2.5
5
7.5
10
brEakdoWn of SEvEn IndICator SCorESIndicators
Education flexibility
talent mismatch
overall wage pressure
labour market participation
labour market flexibility
Wage pressure in high-skill industries
Wage pressure in high-skill occupations
Scores 50 102.5 7.5
unEmploymEnt
gdp
long-term unempl. rate
unemployment rate
*2013 prices
gdp/head (Eur*)
gdp (billion Eur*)
gdp growth
populatIon
2012 2013†
4.2 in 2012
luxEmbourg thE nEthErlandS
PLC-6962-1 Hays GSI 2013_Report-2.indd 38-39 27/09/2013 15:10

40 | The Hays Global Skills Index 2013 The Hays Global Skills Index 2013 | 41
EURO
PEEURO
PE
ViEw fROm thE gROUndAustralia’s Hays Global Skills’ Index Score is 5.6 in 2013, slightly down from last year. The relative relaxation of labour market pressures is helped by a number of indicators, including those for labour market participation and talent mismatch. These forces are working in the same direction as a downshift in economic growth, which is expected to fall to 2.6% in 2013 (down from 3.6% in
2012). Hays MD
ViEw fROm thE gROUndAustralia’s Hays Global Skills’ Index Score is 5.6 in 2013, slightly down from last year. The relative relaxation of labour market pressures is helped by a number of indicators, including those for labour market participation and talent mismatch. These forces are working in the same direction as a downshift in economic growth, which is expected to fall to 2.6% in 2013 (down from 3.6% in
2012). Hays MD
†Forecast figures for 2013 †Forecast figures for 2013
NOTE: The analysis on which the Hays Global Skills Index was based utilised data as of Q2 2013. Developments subsequent to this date are not reflected in the 2013 findings.
NOTE: The analysis on which the Hays Global Skills Index was based utilised data as of Q2 2013. Developments subsequent to this date are not reflected in the 2013 findings.
vIEW from thE groundIT specialists and engineers are in the highest demand in Poland, therefore their salary level exceeds those of other professions. In some cases, due to an insufficient number of specialists, candidates have been attracted from outside of Poland. Multilingual specialists also find themselves in demand, mainly in the booming business services sector. Employers are also signalling changes are needed in the education system to bring it closer to business needs. Some changes have already begun to take place but it is likely to take some time until the first results are visible on the labour market. Michal Mlynarczyk, Managing Director, Hays Poland
5.6
4.6
6.6
3.3
3.9
7.3
4.9
baCkground EConomIC data
kEy fIndIngThe indicator providing the greatest upward pressure is wages in high-skill industries. In the first quarter of 2013, the premium paid to those in the highest-skill industries increased relative to those in lower-skill industries. This increase came on top of an increase in the same direction in 2012.
doWnWard prESSurE from• Long-term unemployment• Overall wage pressure• International PISA rank
upWard prESSurE from• Net in-migration• Increase in education levels• Wage pressure in high-skill industries
38.6m
3.2%
10.1%
42,000 42,300
1,618 1,633
38.6m
3.4%
2.0% 0.9%
10.7%
5.2ovErall SCorECountry profIlE
Poland’s overall score is 5.2, indicative of a labour market close to balance relative to the historical norm.
Poland is one of the few European countries that did not experience negative economic growth during the global economic downturn. Growth is expected to remain positive in 2013, but at just 0.9% it will be significantly below trend. This reflects strong economic headwinds in Europe, which will also contribute to a slight rise in Poland’s unemployment rate (forecast at 10.7% in 2013, up from 10.1% in 2012). 0
2.5
5
7.5
10
brEakdoWn of SEvEn IndICator SCorESIndicators
Education flexibility
talent mismatch
overall wage pressure
labour market participation
labour market flexibility
Wage pressure in high-skill industries
Wage pressure in high-skill occupations
Scores 50 102.5 7.5
unEmploymEnt
gdp
long-term unempl. rate
unemployment rate
*2013 prices
gdp/head (pln*)
gdp (billion pln*)
gdp growth
populatIon
2012 2013†
5.2 in 2012
vIEW from thE groundThe period of economic instability recently experienced in Portugal has highlighted old issues within the labour market, as well as creating new challenges. The talent mismatch has been one of the most serious issues to face the Portuguese labour market and the issue continues to worsen as thousands of young job seekers are now leaving the country. It is essential to create policies that attract and retain these young professionals. It is also very important to establish better communications between educational institutions and the labour market to fix this lack of skills and thus reduce wage pressure. Paula Baptista, Managing Director, Hays Portugal
4.6
6.4
6.1
10.0
4.7
10.0
0.0
baCkground EConomIC data
kEy fIndIngWages in high-skill industries are expected to push the Index score higher in 2013 than it was in 2012. Employers are having to pay an increasingly high premium to attract talent in select industries.
doWnWard prESSurE from• Wage pressure in high-skill occupations • Increase in education levels• Net in-migration
upWard prESSurE from• Structural unemployment • Wage pressure in high-skill industries• Labour market regulations
10.5m
7.7%
15.9%
15,800 15,400
167 162
10.5m
8.7%
-3.2% -2.8%
18.0%
6.0ovErall SCorECountry profIlE
Portugal’s overall score is 6.0, which is indicative of medium strength labour market pressures. While Portugal has suffered a deep economic contraction, the adjustment process in the labour markets is proving to be a slow one. This combination means that some employers, particularly in high-skill industries, may face difficult economic circumstances at the same time as they struggle to attract and retain the key talent they need. 0
2.5
5
7.5
10
brEakdoWn of SEvEn IndICator SCorESIndicators
Education flexibility
talent mismatch
overall wage pressure
labour market participation
labour market flexibility
Wage pressure in high-skill industries
Wage pressure in high-skill occupations
Scores 50 102.5 7.5
unEmploymEnt
gdp
long-term unempl. rate
unemployment rate
*2013 prices
gdp/head (Eur*)
gdp (billion Eur*)
gdp growth
populatIon
2012 2013†
5.3 in 2012
poland portugal
PLC-6962-1 Hays GSI 2013_Report-2.indd 40-41 27/09/2013 15:10
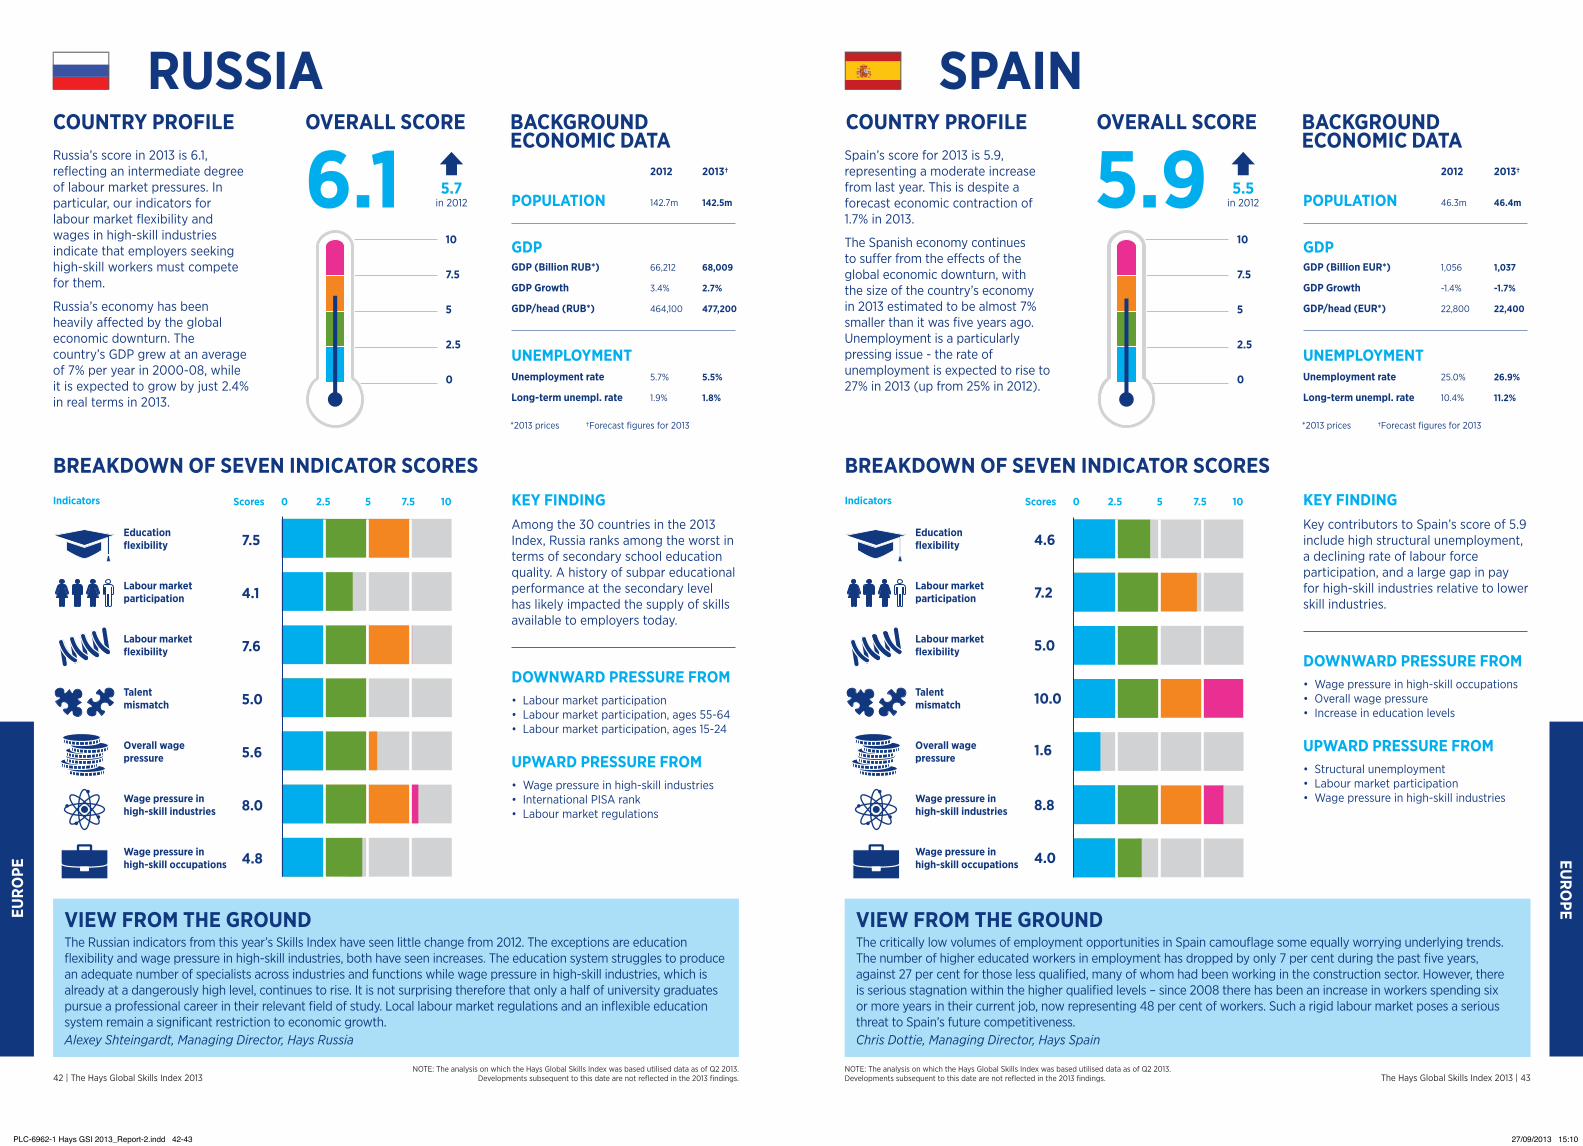
42 | The Hays Global Skills Index 2013 The Hays Global Skills Index 2013 | 43
EURO
PEEURO
PE
ViEw fROm thE gROUndAustralia’s Hays Global Skills’ Index Score is 5.6 in 2013, slightly down from last year. The relative relaxation of labour market pressures is helped by a number of indicators, including those for labour market participation and talent mismatch. These forces are working in the same direction as a downshift in economic growth, which is expected to fall to 2.6% in 2013 (down from 3.6% in
2012). Hays MD
ViEw fROm thE gROUndAustralia’s Hays Global Skills’ Index Score is 5.6 in 2013, slightly down from last year. The relative relaxation of labour market pressures is helped by a number of indicators, including those for labour market participation and talent mismatch. These forces are working in the same direction as a downshift in economic growth, which is expected to fall to 2.6% in 2013 (down from 3.6% in
2012). Hays MD
†Forecast figures for 2013 †Forecast figures for 2013
NOTE: The analysis on which the Hays Global Skills Index was based utilised data as of Q2 2013. Developments subsequent to this date are not reflected in the 2013 findings.
NOTE: The analysis on which the Hays Global Skills Index was based utilised data as of Q2 2013. Developments subsequent to this date are not reflected in the 2013 findings.
vIEW from thE groundThe Russian indicators from this year’s Skills Index have seen little change from 2012. The exceptions are education flexibility and wage pressure in high-skill industries, both have seen increases. The education system struggles to produce an adequate number of specialists across industries and functions while wage pressure in high-skill industries, which is already at a dangerously high level, continues to rise. It is not surprising therefore that only a half of university graduates pursue a professional career in their relevant field of study. Local labour market regulations and an inflexible education system remain a significant restriction to economic growth. Alexey Shteingardt, Managing Director, Hays Russia
7.5
4.1
7.6
5.0
5.6
8.0
4.8
baCkground EConomIC data
kEy fIndIngAmong the 30 countries in the 2013 Index, Russia ranks among the worst in terms of secondary school education quality. A history of subpar educational performance at the secondary level has likely impacted the supply of skills available to employers today.
doWnWard prESSurE from• Labour market participation• Labour market participation, ages 55-64• Labour market participation, ages 15-24
upWard prESSurE from• Wage pressure in high-skill industries• International PISA rank• Labour market regulations
142.7m
1.9%
5.7%
464,100 477,200
66,212 68,009
142.5m
1.8%
3.4% 2.7%
5.5%
6.1ovErall SCorECountry profIlE
Russia’s score in 2013 is 6.1, reflecting an intermediate degree of labour market pressures. In particular, our indicators for labour market flexibility and wages in high-skill industries indicate that employers seeking high-skill workers must compete for them.
Russia’s economy has been heavily affected by the global economic downturn. The country’s GDP grew at an average of 7% per year in 2000-08, while it is expected to grow by just 2.4% in real terms in 2013.
0
2.5
5
7.5
10
brEakdoWn of SEvEn IndICator SCorESIndicators
Education flexibility
talent mismatch
overall wage pressure
labour market participation
labour market flexibility
Wage pressure in high-skill industries
Wage pressure in high-skill occupations
Scores 50 102.5 7.5
unEmploymEnt
gdp
long-term unempl. rate
unemployment rate
*2013 prices
gdp/head (rub*)
gdp (billion rub*)
gdp growth
populatIon
2012 2013†
5.7 in 2012
vIEW from thE groundThe critically low volumes of employment opportunities in Spain camouflage some equally worrying underlying trends. The number of higher educated workers in employment has dropped by only 7 per cent during the past five years, against 27 per cent for those less qualified, many of whom had been working in the construction sector. However, there is serious stagnation within the higher qualified levels – since 2008 there has been an increase in workers spending six or more years in their current job, now representing 48 per cent of workers. Such a rigid labour market poses a serious threat to Spain’s future competitiveness. Chris Dottie, Managing Director, Hays Spain
4.6
7.2
5.0
10.0
1.6
8.8
4.0
baCkground EConomIC data
kEy fIndIngKey contributors to Spain’s score of 5.9 include high structural unemployment, a declining rate of labour force participation, and a large gap in pay for high-skill industries relative to lower skill industries.
doWnWard prESSurE from• Wage pressure in high-skill occupations• Overall wage pressure• Increase in education levels
upWard prESSurE from• Structural unemployment• Labour market participation• Wage pressure in high-skill industries
46.3m
10.4%
25.0%
22,800 22,400
1,056 1,037
46.4m
11.2%
-1.4% -1.7%
26.9%
5.9ovErall SCorECountry profIlE
Spain’s score for 2013 is 5.9, representing a moderate increase from last year. This is despite a forecast economic contraction of 1.7% in 2013.
The Spanish economy continues to suffer from the effects of the global economic downturn, with the size of the country’s economy in 2013 estimated to be almost 7% smaller than it was five years ago. Unemployment is a particularly pressing issue - the rate of unemployment is expected to rise to 27% in 2013 (up from 25% in 2012). 0
2.5
5
7.5
10
brEakdoWn of SEvEn IndICator SCorESIndicators
Education flexibility
talent mismatch
overall wage pressure
labour market participation
labour market flexibility
Wage pressure in high-skill industries
Wage pressure in high-skill occupations
Scores 50 102.5 7.5
unEmploymEnt
gdp
long-term unempl. rate
unemployment rate
*2013 prices
gdp/head (Eur*)
gdp (billion Eur*)
gdp growth
populatIon
2012 2013†
5.5 in 2012
ruSSIa SpaIn
PLC-6962-1 Hays GSI 2013_Report-2.indd 42-43 27/09/2013 15:10

44 | The Hays Global Skills Index 2013 The Hays Global Skills Index 2013 | 45
EURO
PEEURO
PE
ViEw fROm thE gROUndAustralia’s Hays Global Skills’ Index Score is 5.6 in 2013, slightly down from last year. The relative relaxation of labour market pressures is helped by a number of indicators, including those for labour market participation and talent mismatch. These forces are working in the same direction as a downshift in economic growth, which is expected to fall to 2.6% in 2013 (down from 3.6% in
2012). Hays MD
ViEw fROm thE gROUndAustralia’s Hays Global Skills’ Index Score is 5.6 in 2013, slightly down from last year. The relative relaxation of labour market pressures is helped by a number of indicators, including those for labour market participation and talent mismatch. These forces are working in the same direction as a downshift in economic growth, which is expected to fall to 2.6% in 2013 (down from 3.6% in
2012). Hays MD
†Forecast figures for 2013 †Forecast figures for 2013
NOTE: The analysis on which the Hays Global Skills Index was based utilised data as of Q2 2013. Developments subsequent to this date are not reflected in the 2013 findings.
NOTE: The analysis on which the Hays Global Skills Index was based utilised data as of Q2 2013. Developments subsequent to this date are not reflected in the 2013 findings.
vIEW from thE groundSweden is very much a service-orientated society, nearly 75 per cent of the economically active population works with the provision of services, either in the private or public sector. The Swedish labour market is known for combining business innovation, generous employment benefits and long-term job security. A recent law has made it easier for people outside of Europe to move to Sweden for work, this is to attract workers to industries that are unable to find enough qualified employees. Receiving an offer of employment from a Swedish company or organisation then enables the jobseeker to apply for a work permit. Marie Svard, Managing Director, Hays Sweden
7.1
3.7
6.2
6.4
6.1
10.0
4.7
baCkground EConomIC data
kEy fIndIngSignificant wage pressure in high-skill industries and unfilled job vacancies of more than 49,000 suggest some employers are struggling to find the skilled labour they need.
doWnWard prESSurE from• Labour market participation • Structural unemployment• Long-term unemployment
upWard prESSurE from• Wage pressure in high-skill industries• Job vacancies• Increase in education levels
9.5m
1.4%
8.0%
373,200 375,900
3,556 3,610
9.6m
1.4%
1.2% 1.5%
8.3%
6.3ovErall SCorECountry profIlE
Sweden’s 2013 score is 6.3, suggesting some significant labour market pressures exist. At least some of this will be accounted for by economic growth in the country: Sweden is expected to see the highest rate of economic growth in Europe in 2013, with GDP forecast to rise by 1.5% (up from 1.2% in 2012). Like Germany, but unlike several other European countries, Sweden’s downturn was sharp and the recovery quick, with economic growth having returned to its pre-crisis trend.
0
2.5
5
7.5
10
brEakdoWn of SEvEn IndICator SCorESIndicators
Education flexibility
talent mismatch
overall wage pressure
labour market participation
labour market flexibility
Wage pressure in high-skill industries
Wage pressure in high-skill occupations
Scores 50 102.5 7.5
unEmploymEnt
gdp
long-term unempl. rate
unemployment rate
*2013 prices
gdp/head (SEk*)
gdp (billion SEk*)
gdp growth
populatIon
2012 2013†
6.1 in 2012
vIEW from thE groundThe Swiss government has tightened measures against increasing immigration from the European Union. As a result, the number of type B permits issued to people from the EU-17 nations will be capped at 53,700 over the next 12 months. We expect that this measurement will increase skill shortages in IT, engineering and life sciences; but as the cap is on a high level, the impact is likely to be moderate. The Swiss government now needs to work with employers and education authorities to implement incentives to persuade young people to acquire the skills that are most needed. Marc Lutz, Managing Director, Hays Switzerland
3.8
4.8
2.3
5.7
6.4
5.6
2.2
baCkground EConomIC data
kEy fIndIngSwitzerland’s foreign born population as a share of the total, at 26%, is higher than for any other European country. The country is expected to continue to attract significant numbers of migrants, which contributes to downward pressures in the labour market.
doWnWard prESSurE from• Net in-migration• Labour market regulations• Wage pressure in high-skill occupations
upWard prESSurE from• Long-term unemployment• Overall wage pressure• Wage pressure in high-skill industries
8.0m
1.1%
2.9%
73,600 73,800
593 601
8.1m
1.2%
1.0% 1.4%
3.2%
4.4ovErall SCorECountry profIlE
Switzerland’s score for 2013 is 4.4, indicative of mild downward pressure in the labour market relative to the historical norm.
Switzerland’s economy is expected to stage a cautious recovery in 2013, with GDP growth climbing to 1.4% (up from 1% last year). This is the second fastest economic growth rate in Europe (behind only Sweden). On the downside, the country’s unemployment rate is forecast to climb moderately, but it remains remarkably low at just 3.2%. 0
2.5
5
7.5
10
Indicators Scores 50 102.5 7.5
brEakdoWn of SEvEn IndICator SCorESIndicators
Education flexibility
talent mismatch
overall wage pressure
labour market participation
labour market flexibility
Wage pressure in high-skill industries
Wage pressure in high-skill occupations
unEmploymEnt
gdp
long-term unempl. rate
unemployment rate
*2013 prices
gdp/head (Chf*)
gdp (billion Chf*)
gdp growth
populatIon
2012 2013†
5.4 in 2012
SWEdEn SWItzErland
PLC-6962-1 Hays GSI 2013_Report-2.indd 44-45 27/09/2013 15:10

46 | The Hays Global Skills Index 2013 The Hays Global Skills Index 2013 | 47
EURO
PE
ViEw fROm thE gROUndAustralia’s Hays Global Skills’ Index Score is 5.6 in 2013, slightly down from last year. The relative relaxation of labour market pressures is helped by a number of indicators, including those for labour market participation and talent mismatch. These forces are working in the same direction as a downshift in economic growth, which is expected to fall to 2.6% in 2013 (down from 3.6% in
2012). Hays MD
†Forecast figures for 2013
NOTE: The analysis on which the Hays Global Skills Index was based utilised data as of Q2 2013. Developments subsequent to this date are not reflected in the 2013 findings.
vIEW from thE groundIt remains tough for employers to find top talent. The high talent mismatch levels are due to on-going skill shortages and a reduced talent pool because candidate confidence to move jobs is low and employers have largely remained focused on recruiting to replace leavers. However, more positive sentiment is starting to gain momentum throughout the UK. Industries such as oil and gas are performing well, which is leading to some wage pressure and this is mirrored in professions, such as IT, finance and even construction, where niche skills are in high demand. Nigel Heap, Managing Director, Hays UK & Ireland
brEakdoWn of SEvEn IndICator SCorES
Indicators Scores
Education flexibility
talent mismatch
overall wage pressure
labour market participation
labour market flexibility
Wage pressure in high-skill industries
Wage pressure in high-skill occupations
4.3
6.6
4.9
9.0
1.2
5.8
4.5
50 102.5 7.5
baCkground EConomIC data
unEmploymEnt
kEy fIndIngWhile long-term unemployment continues to be a pressing issue for the UK (contributing to a high talent mismatch score), healthy rates of improvement in education levels and positive net in-migration are important counterweights helping to reduce measured labour market pressures.
doWnWard prESSurE from• Overall wage pressure• Increase in education levels• Net in-migration
upWard prESSurE from• Long-term unemployment• Labour market participation• Wage pressure in high-skill industries
gdp
2012
long-term unempl. rate
unemployment rate
63.2m
2.7%
*2013 prices †Forecast figures for 2013.
8.0%
gdp/head (gbp*) 24,400 24,500
gdp (billion gbp*) 1,543 1,558
63.7m
2.7%
gdp growth
5.0 in 2012
0.3% 1.0%
8.1%
2013†
populatIon5.2ovErall SCorECountry profIlE
At 5.2, the UK’s overall score suggests slightly greater labour market pressures than in normal economic times. An expected decline in labour market participation and upward pressure on wages in high-skill industries will contribute to this pressure in 2013.
The UK economy is still emerging from recession, but there is some evidence that the recovery is gaining momentum. However, headwinds from the current government’s austerity plan and ongoing deleveraging suggest caution.
0
2.5
5
7.5
10
“ The supply of people with the right skills is the foundation for every successful organisation and finding the right person for a job makes businesses, economies and societies stronger”
alistair Cox, Chief Executive, hays plc
unItEd kIngdom
PLC-6962-1 Hays GSI 2013_Report-2.indd 46-47 27/09/2013 15:10

48 | The Hays Global Skills Index 2013 The Hays Global Skills Index 2013 | 49
thE hayS global SkIllS IndEx 2013
In partnership with:
The Hays Global Skills Index 2013 | 49
thE hayS global SkIllS IndEx 2013
haysHays has more than 40 years’ experience in helping organisations and businesses fi ll permanent positions, contract roles and temporary assignments, across the private and public sectors. As the world’s largest specialist recruitment agency, last year alone Hays helped around a quarter of a million professional people worldwide fi nd their next career role. With nearly 8,000 staff operating from 239 offi ces across 33 countries, Hays is a market leader in the UK, Continental Europe, Asia Pacifi c, Latin America and has a growing presence in North America.
Hays works across 20 specialist areas, from healthcare to energy, fi nance to construction and education to IT. Its recruiting experts deal with 150,000 CVs every month and more than 50,000 live jobs globally at any one time.
Every day Hays helps clients simultaneously dealing with talent shortages in certain markets, while having to reshape workforces in others. The nature of employment is also changing fast, with technological advances driving evolutions in the way people work. Hays understands these complexities and is uniquely positioned across its markets to solve them.
The depth and breadth of Hays’ expertise ensures that it understands the impact the right individual can have on an organisation and how the right job can transform a person’s life.
to fi nd out more about hays, visit hays.com
oxford EconomicsOxford Economics is one of the world’s foremost independent global forecasting and research consultancies, renowned for its econometric-based consulting and extensive research services. Founded in 1981, Oxford Economics was originally formed as a joint, commercial venture with the business college of Oxford University, Templeton College. Since its foundation, Oxford Economics has grown into an independent provider of global economic, industry and business analysis, headquartered in Oxford, UK.
Oxford Economics is a world leader in quantitative analysis, going deeper and further than other economic advisory fi rms, in helping its clients to fully assess the opportunities and challenges they face for future strategy and direction. It specialises in global quantitative analysis and evidence based business and public-policy advice, underpinned by a sophisticated portfolio of business forecasting services consisting of regularly updated reports, databases and models on countries, cities and industries.
for more information, visit www.oxfordeconomics.com
ContrIbutorS
PLC-6962-1 Hays GSI 2013_Report-2.indd 48-49 27/09/2013 15:10

hays.com
© Copyright Hays plc 2013. HAYS, the Corporate and Sector H devices, Recruiting experts worldwide, the HAYS Recruiting experts worldwide logo and Powering the World of Work are trade marks of Hays plc. The Corporate and Sector H devices are original designs protected by registration in many countries. All rights are reserved. The reproduction or transmission of all or part of this work, whether by photocopying or storing in any medium by electronic means or otherwise, without the written permission of the owner, is restricted. The commission of any unauthorised act in relation to the work may result in civil and/or criminal action. PLC-6962
Hays plc 250 Euston Road London NW1 2AF
thE brEadth of hayS’ ExpErtISE WorldWIdElisted below are the main offices for each of our countries of operation. to find your local office, please visit hays.com
australia T: +61 (0)2 8226 9600 F: +61 (0)2 9233 1110 Level 11, Chifley Tower 2 Chifley Square Sydney NSW 2000 [email protected] hays.com.au
austria T: +43 1 535 34 43 0 F: +43 1 535 34 43 299 Europaplatz 3/5 1150 Vienna [email protected] hays.at
belgium T: +32 (0)56 653600 F: +32 (0)56 228761 Harelbeeksestraat 81 B-8520 Kuurne [email protected] hays.be
brazil T: +55 11 3046 9800 F: +55 11 3046 9820 Rua Pequetita 215 – 13° andar Sao Paulo, SP 04552-060 [email protected] hays.com.br
Canada T: +1 416 367 4297 F: +1 416 203 1923 6 Adelaide Street East Suite 600, Toronto, Ontario M5C 1H6 [email protected] hays.ca
Chile T: +56 (2) 449 1340 F: +56 (2) 449 1340 Cerro El Plomo 5630 Of. 1701 P.O. 7560742, Las Condes Santiago [email protected] hays.cl
China T: +86 (0)21 2322 9600 F: +86 (0)21 5382 4947 Unit 3001 Wheelock Square No. 1717 West Nan Jing Road Shanghai 200040 [email protected] hays.cn
Colombia T: +57 (1) 742 25 02 F: +57 (1) 742 00 28 Paralelo 108 Autopista Norte # 108-27 Torre 2 – Oficina 1105 Bogotá D.C. [email protected] hays.com.co
Czech republic T: +420 225 001 711 F: +420 225 001 723 Olivova 4/2096 110 00 Praha 1 [email protected] hays.cz
denmark T: +45 3315 5600 F: +45 3315 5601 Kongens Nytorv 8 DK-1050 København K [email protected] hays.dk
france T: +33 (0)1 42 99 16 99 F: +33 (0)1 42 99 16 93 Building Gaveau 11, avenue Delcassé 75008 Paris [email protected] hays.fr
germany T: +49 (0)621 1788 0 F: +49 (0)621 1788 1299 Willy-Brandt-Platz 1-3 68161 Mannheim [email protected] hays.de
hong kong T: +852 2521 8884 F: +852 2521 8499 Unit 5803-07, 58th Floor The Center 99 Queen’s Road Central [email protected] hays.com.hk
hungary T: +36 1 501 2400 F: +36 1 501 2402 Bank Center 1054 Budapest Szabadság tér 7. Gránit torony 10. emelet [email protected] hays.hu
India T: +91 124 475 2500 11th Floor, Building 9b DLF Cyber City Gurgaon 122002 hays.com
Ireland T: +353 (0)1 897 2481 F: +353 (0)1 670 4738 2 Dawson Street Dublin 2 [email protected] hays.ie
Italy T: +39 (0)2 888 931 F: +39 (0)2 888 93 41 Corso Italia, 13 20122 Milano [email protected] hays.it
Japan T: +81 (0)3 3560 1188 F: +81 (0)3 3560 1189 Akasaka Twin Tower Main Tower 7F 2-17-22 Akasaka Minato-Ku Tokyo, 107-0052 [email protected] hays.co.jp
luxembourg T: +352 268 654 F: +352 268 654 10 Boulevard Royal 26b 2449 Luxembourg [email protected] hays.lu
malaysia T: +603 2786 8600 F: +603 2786 8601 Level 23 Menara 3 Petronas KLCC 50088 Kuala Lumpur [email protected] hays.com.my
mexico T: +52 (55) 52 49 25 00 F: +52 (55) 52 02 76 01 Paseo de las Palmas 405 Torre Optima 1 Piso 10 Lomas de Chapultepec 11 000 Mexico DF [email protected] hays.com.mx
the netherlands T: +31 (0)20 3630 310 F: +31 (0)20 3630 316 H.J.E. Wenckebachweg 210 1096 AS Amsterdam [email protected] hays.nl
new zealand T: +64 (0)9 377 4774 F: +64 (0)9 377 5855 Level 12, PWC Tower 188 Quay Street Auckland 1010 [email protected] hays.net.nz
poland T: +48 (0)22 584 56 50 F: +48 (0)22 584 56 51 Ul. Złota 59 00-120 Warszawa [email protected] hays.pl
portugal T: +351 21 782 6560 F: +351 21 782 6566 Avenida da República 90 – 1º Fracção 4, 1600-206 Lisboa [email protected] hays.pt
russia T: +7 495 228 2208 F: +7 495 228 2500 Citydel Business Center 9, Zemlyanoy Val 105 064 Moscow [email protected] hays.ru
Singapore T: +65 (0) 6223 4535 F: +65 (0) 6223 6235 80 Raffles Place #27-20 UOB Plaza 2 Singapore 048624 [email protected] hays.com.sg
Spain T: +34 91 443 0750 F: +34 91 443 0770 Plaza de Colón 2 Torre 2, Planta 3 28046 Madrid [email protected] hays.es
Sweden T: +46 (0)8 588 043 00 F: +46 (0)8 588 043 99 Stureplan 4C 11435 Stockholm [email protected] hays.se
Switzerland T: +41 (0)44 2255 000 F: +41 (0)44 2255 299 Nüschelerstr. 32 8001 Zürich [email protected] hays.ch
united arab Emirates T: +971 (0)4 361 2882 F: +971 (0)4 368 6794 Block 19, 1st Floor Office F-02 Knowledge Village P.O. Box 500340, Dubai [email protected] hays.ae
united kingdom T: +44 (0)20 3465 0000 F: +44 (0)20 7510 5050 4th Floor 107 Cheapside London EC2V 6DB [email protected] hays.co.uk
uSa T: +1 201 209 2870 F: +1 201 433 3358 30 Montgomery Street Suite 680 Jersey City, NJ 07302 [email protected] hays-us.com
PLC-6962-1 Hays GSI 2013_Report-2.indd 50 27/09/2013 15:10