Embed Size (px)
Citation preview

Indiana Healthcare Leadership Conference: Improving Nutrition
NextPrevious
Review of Quality of Care Initiatives

NextPrevious
Nursing HomeQuality Status: 2007
High number of immediate jeopardy violations (5th highest)
High number of deficiencies per standard survey (7.6 compared with national average of 6.9)
Above average number of deficiency free surveys (11.7% compared with national rate of 8.3%)

NextPrevious
Quality Improvement Efforts: Studies
Medical error reporting system (2005)
Staffing study (2009)
Bladder scanner study (2009)

NextPrevious
Quality Improvement Efforts: Education Programs
Alzheimer’s and dementia care training programs (2005)
Leadership Conference (2007)
Consultant program (2004)
Healthcare Quality Resource Center (2009)

NextPrevious
Quality Improvement Efforts: Communications
ISDH LTC Newsletter (2008)
Monthly meetings of provider associations and ISDH (2008)
Regular meetings with consumer organizations to discuss quality of care concerns (2005)

NextPrevious
Quality Improvement Efforts: Survey Process
Implemented MDS 3.0 (2010)
Implemented CMS Special Focus Facility Program (2008)
CMS and ISDH consistency workgroups (2008)
Review of immediate jeopardy surveys with provider associations (2008)

NextPrevious
Quality Improvement Efforts: Collaborative Initiatives
Indiana Pressure Ulcer Initiative (2008 – 2010)
Indiana Healthcare Associated Infection Initiative (2009 – 2011)

NextPrevious
Quality Improvement Efforts: Regional Projects
Health Care Excel (QIO) statewide support of CMS GPRA goals (2004)
Health Care Excel pilot of CMS care coordination project in Evansville (2009)
CMS Critical Need Nursing Home Project Pilot in northwest Indiana (2010) coordinated by Health Care Excel

NextPrevious
Quality Improvement Efforts: New in 2011
Community Foundation of St. Joseph County Regional Nursing Home Collaborative (2011)
ISDH Survey Report System (2011)
ISDH Posting of Surveys (2011)

NextPrevious
OUTCOMES TO QUALITY IMPROVEMENT EFFORTS

NextPrevious
Indiana Pressure Ulcer Initiative
CMS GPRA Initiative – 2005 – 2007
Indiana Healthcare Leadership Conference on Preventing Pressure Ulcers – October 2008
Indiana Pressure Ulcer Initiative – August 2008 – November 2010
Quality Improvement Organization ongoing projects with providers
NextPrevious
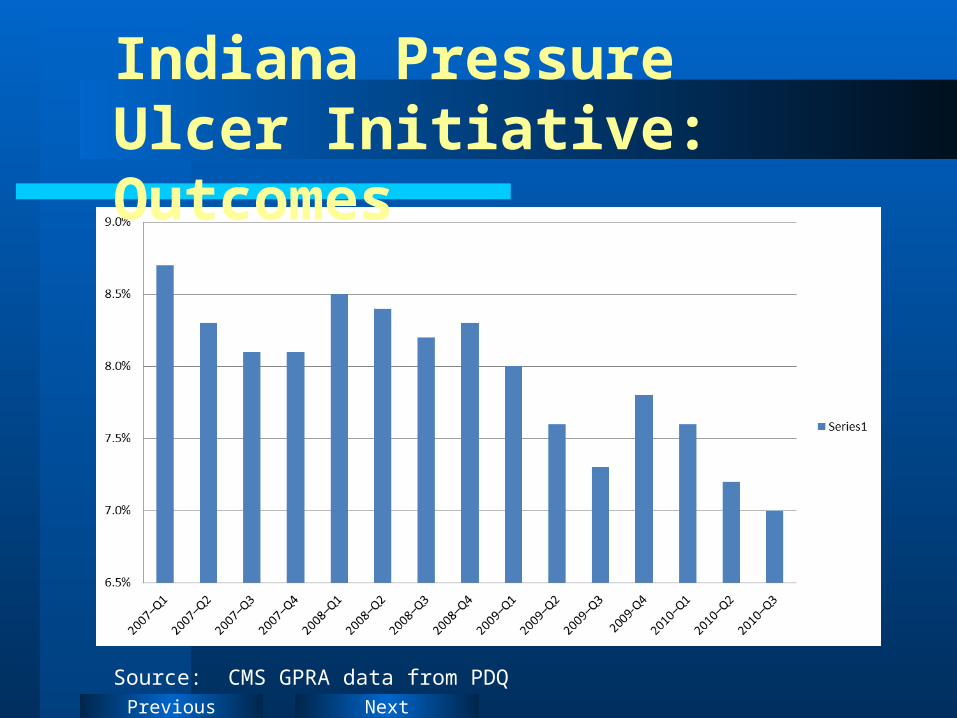
Indiana Pressure Ulcer Initiative: Outcomes
Source: CMS GPRA data from PDQ

NextPrevious
Indiana Restraint Reduction Initiative
CMS GPRA Initiative: 2005 –2007
Indiana Healthcare Leadership Conference on Restraints and Behavior Management: March 2008
Quality Improvement Organization ongoing projects with providers
Focus by provider associations

NextPrevious
Indiana Restraint Reduction Initiative: Outcomes
Source: CMS GPRA data from PDQ

NextPrevious
Indiana Healthcare Associated Infection Initiative
Overview– Collaborative initiative – Two-year initiative from Sept 2009 – Dec 2011– 130 participating facilities (80 nursing homes)
Priorities – Catheter associated urinary tract infections
(CAUTI) – Clostridium difficile (CDI)

NextPrevious

NextPrevious

NextPrevious
Indiana Nursing Homes: Deficiency Free Surveys
2006: 33 facilities - 7.0% 2007: 47 facilities - 9.6% 2008: 55 facilities - 11.0% 2009: 56 facilities – 10.7% 2010: 51 facilities - 10.3%
Source: ISDH QAMIS

NextPrevious
Outcomes: Average Number of Deficiencies per Standard Survey
Indiana National Region V (fewest is 1st)
Fed FY 2007 7.6 6.9 4th Fed FY 2008 8.0 6.9 5th Fed FY 2009 7.2 6.8 4th Fed FY 2010 7.1 6.3 4th
Source: CMS data from CASPER 11/8/2010

NextPrevious
Outcomes: Percent of LTC with a “J” or Higher on Standard Surveys
Indiana National Region V (lowest is 1st)
Fed FY 2007 5.0 2.1 4th Fed FY 2008 4.6 2.9 5th Fed FY 2009 1.8 2.7 2nd Fed FY 2010 2.9 2.5 2nd
Source: CMS data from CASPER 11/8/2010

NextPrevious
Outcomes: Number of Immediate Jeopardy Findings on all LTC Surveys
Indiana Region V (lowest is 1st)
Fed FY 2007 68 5th Fed FY 2008 50 5th Fed FY 2009 35 3rd Fed FY 2010 33 3rd
Source: CMS data from CASPER 11/8/2010

NextPrevious
Outcomes: Average Number of Onsite Survey Hours on Standard Surveys
Indiana National Region V (lowest is 1st)
Fed FY 2010 83.7 105.6 1st
Source: CMS data from CASPER 11/8/2010

NextPrevious
COMING QUALITY IMPROVEMENT PROJECTS

NextPrevious
Coming Initiatives for 2011
Healthcare Associated Infections
Three online learning modules designed for staff and consumers
Consumer brochure
In-service programs

NextPrevious
Coming Initiatives for 2011
Education programs for wound care and infection prevention leading to increased staff certification
Updated aide curriculum
Long Term Care Bed Tracking System

NextPrevious
Coming Initiatives for 2011
Leadership Conference on care coordination and transition
Complete 50% of training for Quality Indicator Survey (QIS) Process
Develop a care coordination and transition initiative for 2012 implementation

NextPrevious
Improving Nutrition
Conference Checklist
Provide an in-service on information and resources provided at today’s conference
Develop a plan for improving nutrition
Identify and implement 3 activities for improving nutrition