Embed Size (px)
Citation preview
50
th
IG
C
50th
INDIAN GEOTECHNICAL CONFERENCE
17th
– 19th
DECEMBER 2015, Pune, Maharashtra, India
Venue: College of Engineering (Estd. 1854), Pune, India
[IMPROVEMENT OF BEARING CAPACITY OF MODEL FOOTING WITH
STRUCTURAL SKIRTS ON SOFT GROUND]
Author1:[Dr.(Mrs) Nayanmoni Chetia][Asstt Prof, Civil Engineering Department, Jorhat Engineering College. Assam, India][
Author2:[Prof. Dr. Bibha Das Saikia][Prof and HOD, Civil Engineering Department. Royal School of Engineering and
Technology, Guwahati, Assam, India (IGS LM 0569)][[email protected]]
ABSTRACT
Improvement of bearing capacity and reduction in settlement are two important aspects while the
performance of a shallow foundation is taken into consideration. Both can be achieved by providing a
structural skirt to a conventional shallow foundation. A structural skirt essentially consists of a shell
beneath the footing and may have any shape. The footing slab may be circular, square or rectangular in
shape and accordingly the skirt wall will have the same shape in section as that of the footing slab. The
improvement in bearing capacity depends on the geometrical and structural properties of the skirt and
footing such as shape and depth of the footing, skirt geometry etc; soil characteristics namely index
properties of soil and the interface conditions of the soil-skirt-foundation systems such as roughness and
material of the skirt etc. An attempt was made to determine the bearing capacity of shallow foundations
and skirted foundations using both analytical and experimental methods on both cohesive ground, loose
sand and medium sand . At first experiments were conducted on model footings (MF) in a test tank
without skirt at different depths on cohesive soil, loose sand and medium sand. The experimental results
of ultimate bearing capacity for model footing were compared to analytically found results of Terzaghi,
Meyehof, Hansen and Vesic equations from literature. The clay was collected from Titabor region of
Assam and belongs to CL type. Attempt was made to maintain near field condition throughout all the load
tests. For that purpose precalibrated uniform consolidating energy was supplied in layers in the test tank.
For the preparation of the sand bed, sand raining technique was used. The height of free fall was
calibrated from a number of trials. The proximity of the experimental and analytical results confirm that
the test set up provides reproducible data within the expected experimental error range. The pressure
settlement characteristic was then studied for Model Skirted Foundations (MSF) of different shape ratio
(L/B), depth (Df/B) ratio and skirt ratios (Ds/B). Improvement in the performance in terms of increase in
the Bearing Capacity corresponding to each case was calculated from the graph. Ultimate bearing
capacity was increased by an improvement factor of maximum 2.0 in case of soft clay, 3.49 in loose sand
of relative density 35% and 2.28 in medium sand of relative density 65%. From the available literature,
the value of improvement factor in cohesionless soil of different relative densities varies from 1.5 to 3.9.
For cohesive ground, no previous data was found on the performance of skirted foundation on soft clay.
From the experimental results skirt adhesion factors corresponding to various variable parameters (L/B,

Dr.(Mrs)Nayanmoni Chetia, Dr.(Mrs)Bibha Das Saikia
Df/B and Ds/B) were calculated out for soft clay. Reduction in the settlement for providing skirt was also
noted. Settlement reduction factors were 16%-68% in soft clay, 44%-98% in loose sand and 37%-93% in
medium sand. Settlement reduction factors are observed to be mostly dependent upon the skirt factor
(Ds/B).
Keywords: skirted foundation, shape factor, depth factor, skirt factor, improvement factor.
50
th
IG
C
50th
INDIAN GEOTECHNICAL CONFERENCE
17th
– 19th
DECEMBER 2015, Pune, Maharashtra, India
Venue: College of Engineering (Estd. 1854), Pune, India
IMPROVEMENT OF BEARING CAPACITY OF MODEL FOOTING WITH
STRUCTURAL SKIRT ON SOFT GROUND
Dr.(Mrs) Nayanmoni Chetia, Asstt Prof. Jorhat Engineering College.Assam. [email protected]
Dr.(Mrs) Bibha Das Saikia. Prof and H.O.D, Civil Engg Deptt. RSET. Assam [email protected]
ABSTRACT: Improvement of bearing capacity and reduction in settlement are two important aspects while the
performance of a shallow foundation is considered and both can be achieved by providing a structural skirt to it.
The improvement in bearing capacity depends on the geometrical and structural properties of the skirt and footing
such as shape and depth of the footing, skirt geometry etc; soil characteristics namely index properties of soil and
the interface conditions of the soil-skirt-foundation systems such as roughness and material of the skirt etc. An
attempt was made to determine the bearing capacity of model footing (MF) and model skirted foundations (MSF)
using analytical and experimental methods on cohesive ground, loose sand and medium sand. The proximity of the
experimental and analytical results for MF confirms that the test set-up provides reproducible data within the
expected experimental error range. The pressure settlement characteristic of MF and MSF were studied for
different shape ratio (L/B), depth ratio (Df/B) and skirt ratios (Ds/B). Ultimate bearing capacity was increased by an
improvement factor of maximum 2.0 in case of soft clay, 3.49 in case of loose sand and 2.28 in case of medium
sand .
INTRODUCTION
A structural skirt essentially consists of a slab and
a shell and may have any shape. The skirt shape
may be circular, square or rectangular depending
upon the shape of the footing slab and the wall
angle with the vertical may vary from zero to a
value less than 90 degree. It is recommended by
researchers that the proposed foundation can be
used as foundation for small buildings, industrial
floors, storage tank, grain silos, industrial
chimneys etc. Moreover single skirt can be
provided under footing resting on soil bed where
the soil underneath is having variation in its
properties in horizontal direction. Sometimes the
architectural requirements of a structure need some
portion of the structure to be on weak or filled up
soil. In such cases if a skirt is provided on one side
of the footing, the soil particles near the skirt will
be prevented from lateral movement. Bearing
capacity of the foundation is increased and the tilt
of the footing can be reduced by providing skirted
foundation partially under the structure when needed.
In 1993, Rao and Jain[1] studied performance of
various ground treatment approaches through full
scale installation and insitu testing in deep deposits
by using various materials like RCC skirt using
mild steel bars, ferrocement shells, GI sheet
reinforcement, prefabricated brick panel skirting,
interlocking pipe unit skirting, steel or hume pipes
etc. The field study has indicated the best
assurance of safety, speed and economy. In 2004,
Aghbari and Mohamedzein[2]performed laboratory
model test on skirted strip foundation on dense
sand and found that the use of structural skirts can
improve the bearing capacity by a factor of 1.5 to
3.9 depending on the geometrical and structural
properties of the skirts and foundations, soil
characteristics and interface condition of soil skirt
foundation system. In 2006, Aghbari and
Mohamedzein[3]carried out tests on skirted
circular footing models resting on sand. The results
showed that the use of structural skirts improved
the bearing capacity by a factor up to 3. In 2007,
Singh, Prasad and Agarwal[4] studied the effect the
soil confinement on ultimate bearing capacity on
square footing under eccentric inclined load. The ultimate bearing capacity is found to increase by a
factor of 6.75 as compared to the unconfined case.
The bearing capacity ratio was highly dependent
Dr.(Mrs)Nayanmoni Chetia, Dr.(Mrs)Bibha Das Saikia
on the geometrical ratio of Bs/B (skirt width /
footing width). The optimum ratio was 1.5 beyond
which the improvement decreases as the ratio
increases. In 2010, Wakil[5] studied on the
horizontal capacity of skirted circular shallow
footings on sand. The effects of skirt length and the
relative density of sand on the performance of the
footing were investigated through laboratory
testing program. A comparative experimental study
between ultimate horizontal loads attained by
skirted and unskirted footings with the same
properties was conducted and it was found that the
skirts changed the failure mode of circular shallow
footings from sliding mechanism into rotational
mechanism and appreciably increased the ultimate
horizontal capacity of shallow footings.
RESEARCH METHODOLOGY
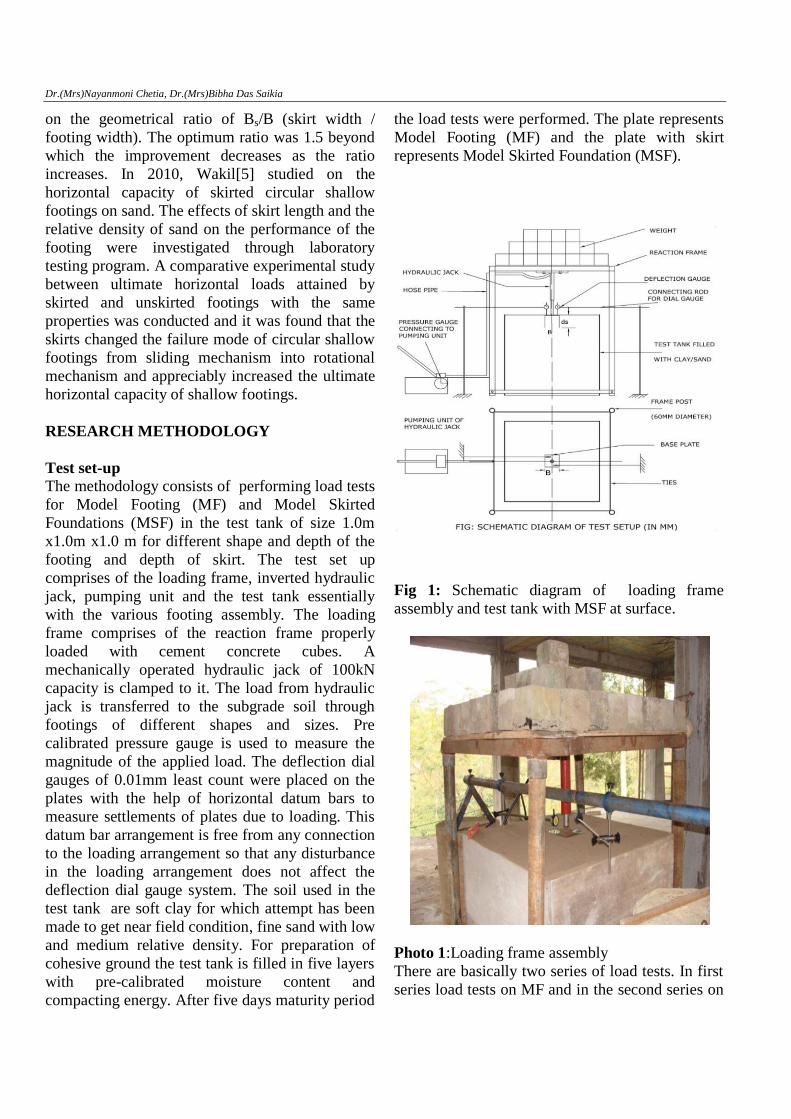
Test set-up
The methodology consists of performing load tests
for Model Footing (MF) and Model Skirted
Foundations (MSF) in the test tank of size 1.0m
x1.0m x1.0 m for different shape and depth of the
footing and depth of skirt. The test set up
comprises of the loading frame, inverted hydraulic
jack, pumping unit and the test tank essentially
with the various footing assembly. The loading
frame comprises of the reaction frame properly
loaded with cement concrete cubes. A
mechanically operated hydraulic jack of 100kN
capacity is clamped to it. The load from hydraulic
jack is transferred to the subgrade soil through
footings of different shapes and sizes. Pre
calibrated pressure gauge is used to measure the
magnitude of the applied load. The deflection dial
gauges of 0.01mm least count were placed on the
plates with the help of horizontal datum bars to
measure settlements of plates due to loading. This
datum bar arrangement is free from any connection
to the loading arrangement so that any disturbance
in the loading arrangement does not affect the
deflection dial gauge system. The soil used in the
test tank are soft clay for which attempt has been
made to get near field condition, fine sand with low
and medium relative density. For preparation of
cohesive ground the test tank is filled in five layers
with pre-calibrated moisture content and
compacting energy. After five days maturity period
the load tests were performed. The plate represents
Model Footing (MF) and the plate with skirt
represents Model Skirted Foundation (MSF).
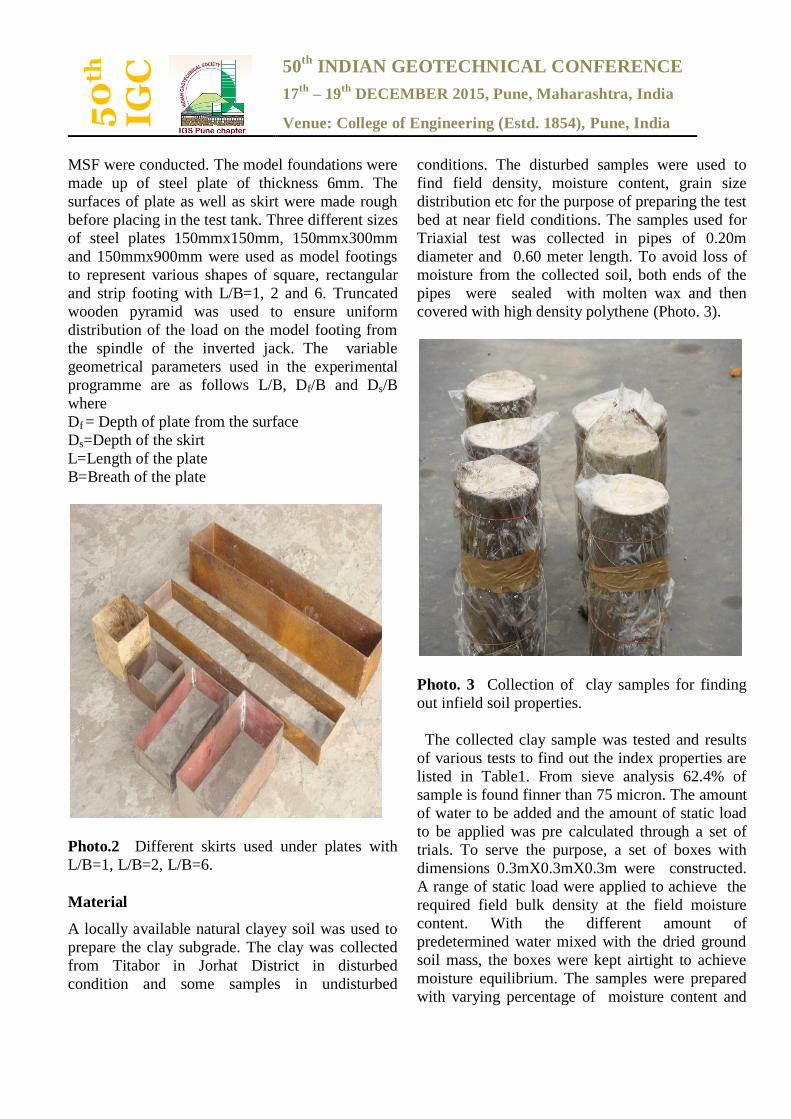
Fig 1: Schematic diagram of loading frame
assembly and test tank with MSF at surface.
Photo 1:Loading frame assembly
There are basically two series of load tests. In first
series load tests on MF and in the second series on
50
th
IG
C
50th
INDIAN GEOTECHNICAL CONFERENCE
17th
– 19th
DECEMBER 2015, Pune, Maharashtra, India
Venue: College of Engineering (Estd. 1854), Pune, India
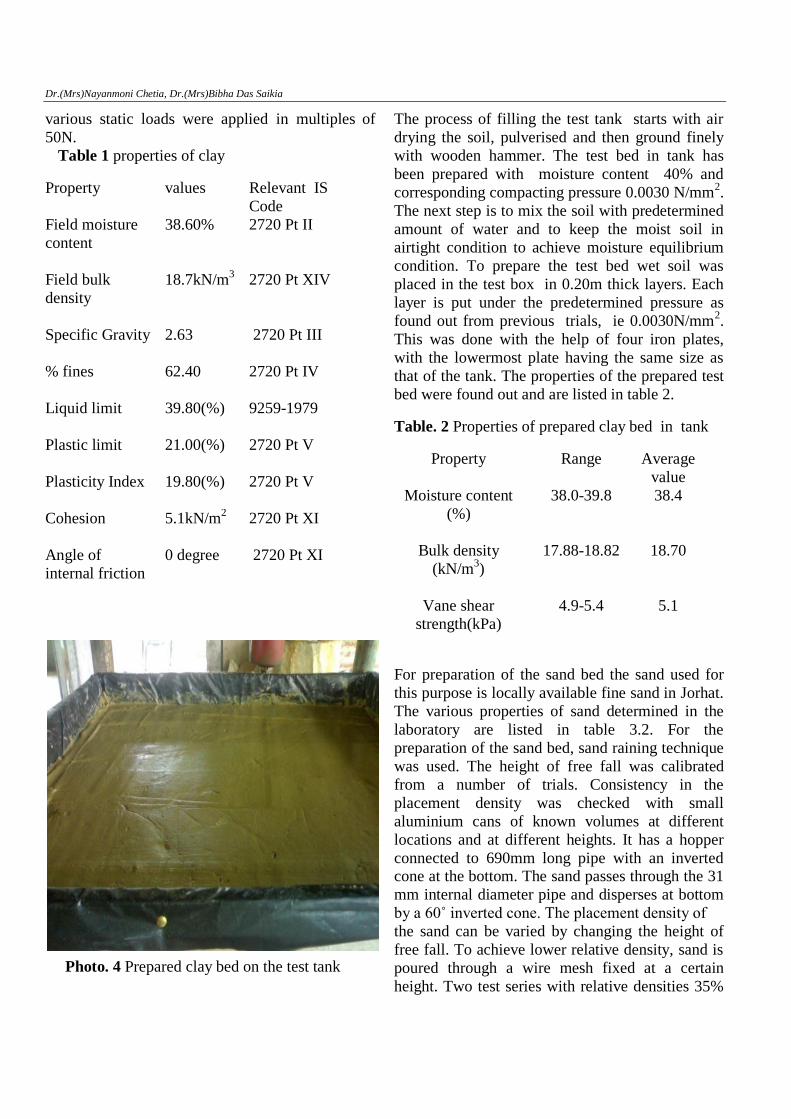
MSF were conducted. The model foundations were
made up of steel plate of thickness 6mm. The
surfaces of plate as well as skirt were made rough
before placing in the test tank. Three different sizes
of steel plates 150mmx150mm, 150mmx300mm
and 150mmx900mm were used as model footings
to represent various shapes of square, rectangular
and strip footing with L/B=1, 2 and 6. Truncated
wooden pyramid was used to ensure uniform
distribution of the load on the model footing from
the spindle of the inverted jack. The variable
geometrical parameters used in the experimental
programme are as follows L/B, Df/B and Ds/B
where
Df = Depth of plate from the surface
Ds=Depth of the skirt
L=Length of the plate
B=Breath of the plate
Photo.2 Different skirts used under plates with
L/B=1, L/B=2, L/B=6.
Material
A locally available natural clayey soil was used to
prepare the clay subgrade. The clay was collected
from Titabor in Jorhat District in disturbed
condition and some samples in undisturbed
conditions. The disturbed samples were used to
find field density, moisture content, grain size
distribution etc for the purpose of preparing the test
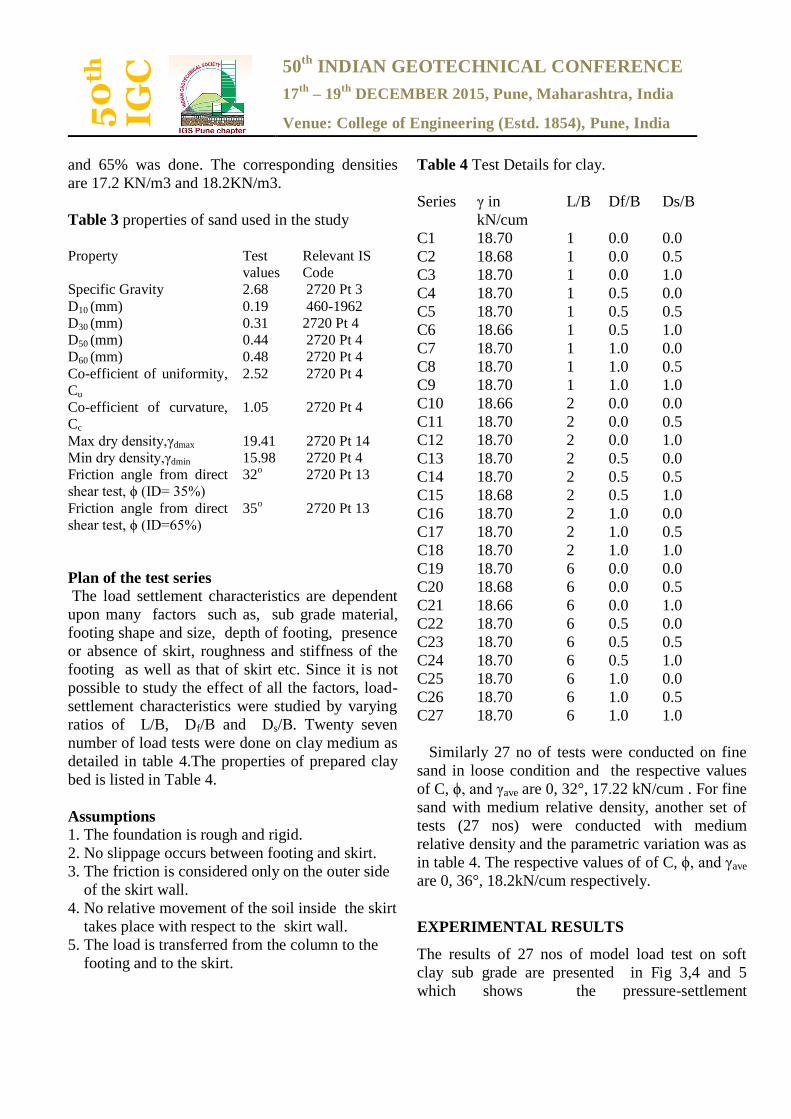
bed at near field conditions. The samples used for
Triaxial test was collected in pipes of 0.20m
diameter and 0.60 meter length. To avoid loss of
moisture from the collected soil, both ends of the
pipes were sealed with molten wax and then
covered with high density polythene (Photo. 3).
Photo. 3 Collection of clay samples for finding
out infield soil properties.
The collected clay sample was tested and results
of various tests to find out the index properties are
listed in Table1. From sieve analysis 62.4% of
sample is found finner than 75 micron. The amount
of water to be added and the amount of static load
to be applied was pre calculated through a set of
trials. To serve the purpose, a set of boxes with
dimensions 0.3mX0.3mX0.3m were constructed.
A range of static load were applied to achieve the
required field bulk density at the field moisture
content. With the different amount of
predetermined water mixed with the dried ground
soil mass, the boxes were kept airtight to achieve
moisture equilibrium. The samples were prepared
with varying percentage of moisture content and
Dr.(Mrs)Nayanmoni Chetia, Dr.(Mrs)Bibha Das Saikia
various static loads were applied in multiples of
50N.
Table 1 properties of clay
Property
values Relevant IS
Code
Field moisture
content
38.60% 2720 Pt II
Field bulk
density
18.7kN/m3
2720 Pt XIV
Specific Gravity
2.63 2720 Pt III
% fines
62.40 2720 Pt IV
Liquid limit
39.80(%)
9259-1979
Plastic limit
21.00(%)
2720 Pt V
Plasticity Index
19.80(%)
2720 Pt V
Cohesion
5.1kN/m2
2720 Pt XI
Angle of
internal friction
0 degree 2720 Pt XI
Photo. 4 Prepared clay bed on the test tank
The process of filling the test tank starts with air
drying the soil, pulverised and then ground finely
with wooden hammer. The test bed in tank has
been prepared with moisture content 40% and
corresponding compacting pressure 0.0030 N/mm2.
The next step is to mix the soil with predetermined
amount of water and to keep the moist soil in
airtight condition to achieve moisture equilibrium
condition. To prepare the test bed wet soil was
placed in the test box in 0.20m thick layers. Each
layer is put under the predetermined pressure as
found out from previous trials, ie 0.0030N/mm2.
This was done with the help of four iron plates,
with the lowermost plate having the same size as
that of the tank. The properties of the prepared test
bed were found out and are listed in table 2.
Table. 2 Properties of prepared clay bed in tank
Property Range Average
value
Moisture content
(%)
38.0-39.8 38.4
Bulk density
(kN/m3)
17.88-18.82 18.70
Vane shear
strength(kPa)
4.9-5.4 5.1
For preparation of the sand bed the sand used for
this purpose is locally available fine sand in Jorhat.
The various properties of sand determined in the
laboratory are listed in table 3.2. For the
preparation of the sand bed, sand raining technique
was used. The height of free fall was calibrated
from a number of trials. Consistency in the
placement density was checked with small
aluminium cans of known volumes at different
locations and at different heights. It has a hopper
connected to 690mm long pipe with an inverted cone at the bottom. The sand passes through the 31
mm internal diameter pipe and disperses at bottom
by a 60˚ inverted cone. The placement density of
the sand can be varied by changing the height of
free fall. To achieve lower relative density, sand is
poured through a wire mesh fixed at a certain
height. Two test series with relative densities 35%
50
th
IG
C
50th
INDIAN GEOTECHNICAL CONFERENCE
17th
– 19th
DECEMBER 2015, Pune, Maharashtra, India
Venue: College of Engineering (Estd. 1854), Pune, India
and 65% was done. The corresponding densities
are 17.2 KN/m3 and 18.2KN/m3.
Table 3 properties of sand used in the study
Property Test
values
Relevant IS
Code
Specific Gravity 2.68 2720 Pt 3
D10 (mm) 0.19 460-1962
D30 (mm) 0.31 2720 Pt 4
D50 (mm) 0.44 2720 Pt 4
D60 (mm) 0.48 2720 Pt 4
Co-efficient of uniformity,
Cu
2.52 2720 Pt 4
Co-efficient of curvature,
Cc
1.05 2720 Pt 4
Max dry density,γdmax
19.41 2720 Pt 14
Min dry density,γdmin 15.98 2720 Pt 4
Friction angle from direct
shear test, ϕ (ID= 35%)
32o 2720 Pt 13
Friction angle from direct
shear test, ϕ (ID=65%)
35o
2720 Pt 13
Plan of the test series
The load settlement characteristics are dependent
upon many factors such as, sub grade material,
footing shape and size, depth of footing, presence
or absence of skirt, roughness and stiffness of the
footing as well as that of skirt etc. Since it is not
possible to study the effect of all the factors, load-
settlement characteristics were studied by varying
ratios of L/B, Df/B and Ds/B. Twenty seven
number of load tests were done on clay medium as
detailed in table 4.The properties of prepared clay
bed is listed in Table 4.
Assumptions
1. The foundation is rough and rigid.
2. No slippage occurs between footing and skirt.
3. The friction is considered only on the outer side
of the skirt wall.
4. No relative movement of the soil inside the skirt
takes place with respect to the skirt wall.
5. The load is transferred from the column to the
footing and to the skirt.
Table 4 Test Details for clay.
Series γ in
kN/cum
L/B Df/B Ds/B
C1 18.70 1 0.0 0.0
C2 18.68 1 0.0 0.5
C3 18.70 1 0.0 1.0
C4 18.70 1 0.5 0.0
C5 18.70 1 0.5 0.5
C6 18.66 1 0.5 1.0
C7 18.70 1 1.0 0.0
C8 18.70 1 1.0 0.5
C9 18.70 1 1.0 1.0
C10 18.66 2 0.0 0.0
C11 18.70 2 0.0 0.5
C12 18.70 2 0.0 1.0
C13 18.70 2 0.5 0.0
C14 18.70 2 0.5 0.5
C15 18.68 2 0.5 1.0
C16 18.70 2 1.0 0.0
C17 18.70 2 1.0 0.5
C18 18.70 2 1.0 1.0
C19 18.70 6 0.0 0.0
C20 18.68 6 0.0 0.5
C21 18.66 6 0.0 1.0
C22 18.70 6 0.5 0.0
C23 18.70 6 0.5 0.5
C24 18.70 6 0.5 1.0
C25 18.70 6 1.0 0.0
C26 18.70 6 1.0 0.5
C27 18.70 6 1.0 1.0
Similarly 27 no of tests were conducted on fine
sand in loose condition and the respective values
of C, ϕ, and γave are 0, 32°, 17.22 kN/cum . For fine
sand with medium relative density, another set of
tests (27 nos) were conducted with medium
relative density and the parametric variation was as
in table 4. The respective values of of C, ϕ, and γave
are 0, 36°, 18.2kN/cum respectively.
EXPERIMENTAL RESULTS
The results of 27 nos of model load test on soft
clay sub grade are presented in Fig 3,4 and 5
which shows the pressure-settlement
Dr.(Mrs)Nayanmoni Chetia, Dr.(Mrs)Bibha Das Saikia
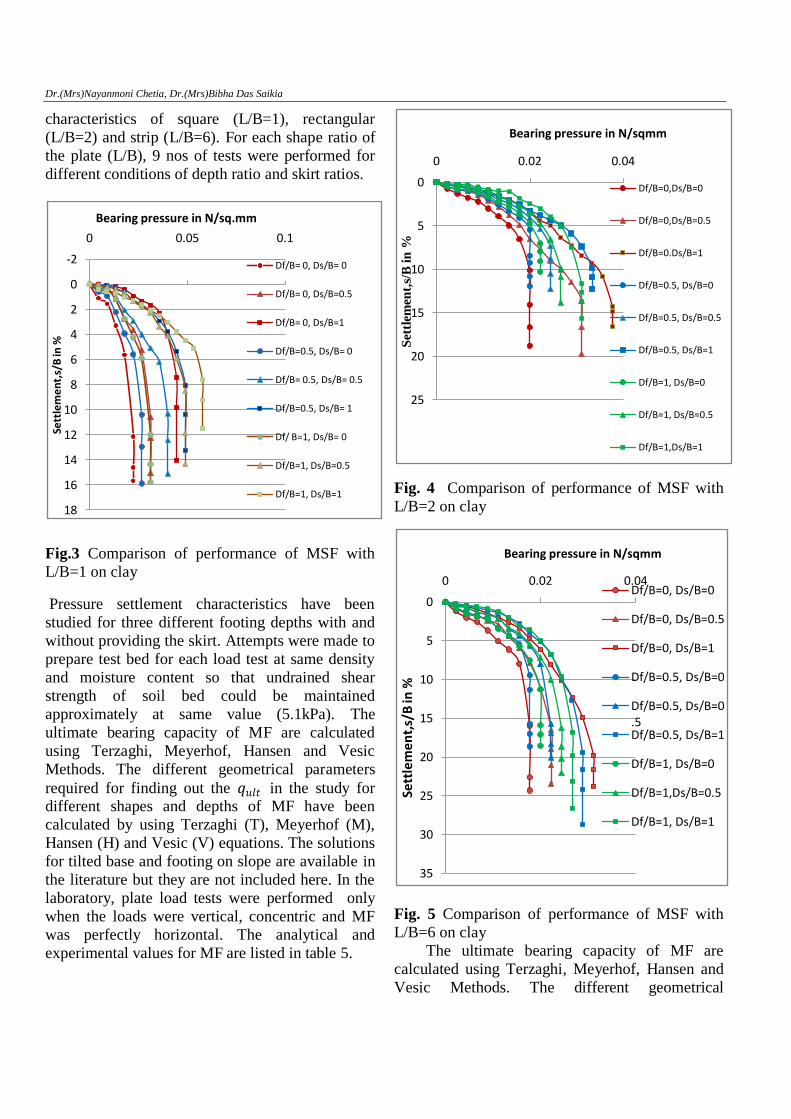
characteristics of square (L/B=1), rectangular
(L/B=2) and strip (L/B=6). For each shape ratio of
the plate (L/B), 9 nos of tests were performed for
different conditions of depth ratio and skirt ratios.
Fig.3 Comparison of performance of MSF with
L/B=1 on clay
Pressure settlement characteristics have been
studied for three different footing depths with and
without providing the skirt. Attempts were made to
prepare test bed for each load test at same density
and moisture content so that undrained shear
strength of soil bed could be maintained
approximately at same value (5.1kPa). The
ultimate bearing capacity of MF are calculated
using Terzaghi, Meyerhof, Hansen and Vesic
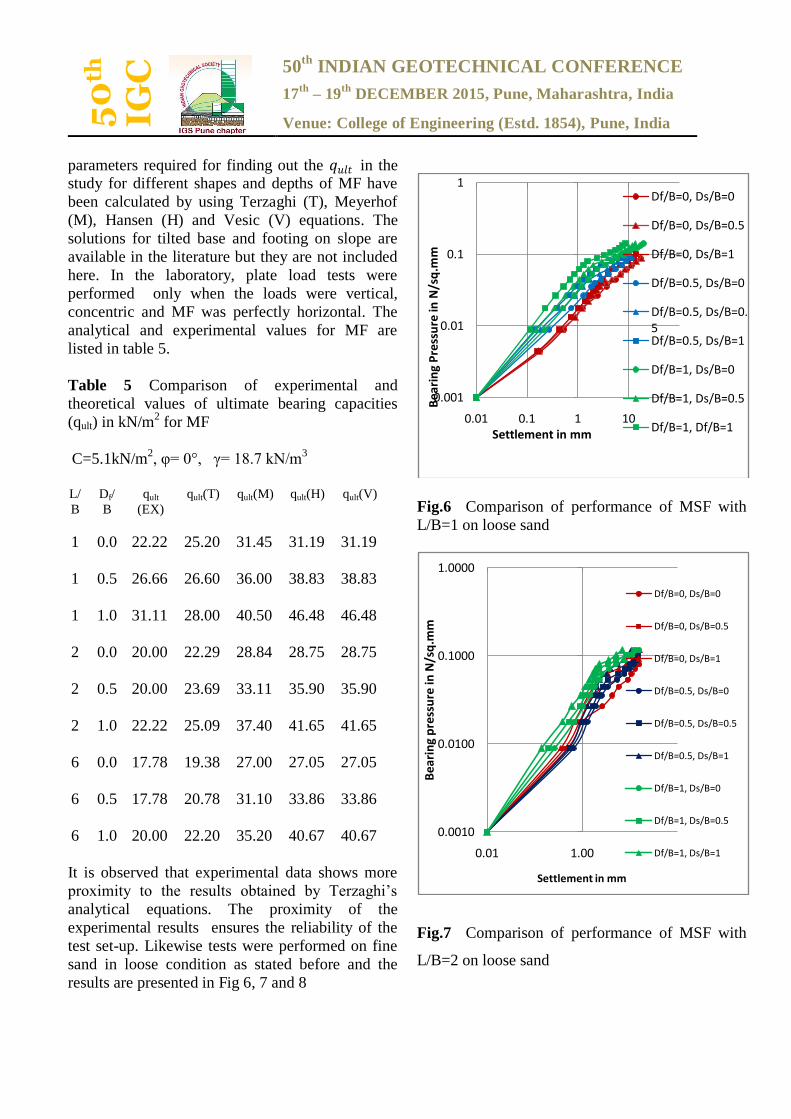
Methods. The different geometrical parameters
required for finding out the 𝑞𝑢𝑙𝑡 in the study for different shapes and depths of MF have been
calculated by using Terzaghi (T), Meyerhof (M),
Hansen (H) and Vesic (V) equations. The solutions
for tilted base and footing on slope are available in
the literature but they are not included here. In the
laboratory, plate load tests were performed only
when the loads were vertical, concentric and MF
was perfectly horizontal. The analytical and
experimental values for MF are listed in table 5.
Fig. 4 Comparison of performance of MSF with
L/B=2 on clay
Fig. 5 Comparison of performance of MSF with
L/B=6 on clay
The ultimate bearing capacity of MF are
calculated using Terzaghi, Meyerhof, Hansen and
Vesic Methods. The different geometrical
-2
0
2
4
6
8
10
12
14
16
18
0 0.05 0.1
Sett
lem
en
t,s/
B in
%
Bearing pressure in N/sq.mm
Df/B= 0, Ds/B= 0
Df/B= 0, Ds/B=0.5
Df/B= 0, Ds/B=1
Df/B=0.5, Ds/B= 0
Df/B= 0.5, Ds/B= 0.5
Df/B=0.5, Ds/B= 1
Df/ B=1, Ds/B= 0
Df/B=1, Ds/B=0.5
Df/B=1, Ds/B=1
0
5
10
15
20
25
0 0.02 0.04
Set
tlem
ent,
s/B
in
%
Bearing pressure in N/sqmm
Df/B=0,Ds/B=0
Df/B=0,Ds/B=0.5
Df/B=0.Ds/B=1
Df/B=0.5, Ds/B=0
Df/B=0.5, Ds/B=0.5
Df/B=0.5, Ds/B=1
Df/B=1, Ds/B=0
Df/B=1, Ds/B=0.5
Df/B=1,Ds/B=1
0
5
10
15
20
25
30
35
0 0.02 0.04
Sett
lem
en
t,s/
B in
%
Bearing pressure in N/sqmm
Df/B=0, Ds/B=0
Df/B=0, Ds/B=0.5
Df/B=0, Ds/B=1
Df/B=0.5, Ds/B=0
Df/B=0.5, Ds/B=0.5Df/B=0.5, Ds/B=1
Df/B=1, Ds/B=0
Df/B=1,Ds/B=0.5
Df/B=1, Ds/B=1
50
th
IG
C
50th
INDIAN GEOTECHNICAL CONFERENCE
17th
– 19th
DECEMBER 2015, Pune, Maharashtra, India
Venue: College of Engineering (Estd. 1854), Pune, India
parameters required for finding out the 𝑞𝑢𝑙𝑡 in the study for different shapes and depths of MF have
been calculated by using Terzaghi (T), Meyerhof
(M), Hansen (H) and Vesic (V) equations. The
solutions for tilted base and footing on slope are
available in the literature but they are not included
here. In the laboratory, plate load tests were
performed only when the loads were vertical,
concentric and MF was perfectly horizontal. The
analytical and experimental values for MF are
listed in table 5.
Table 5 Comparison of experimental and
theoretical values of ultimate bearing capacities
(qult) in kN/m2 for MF
C=5.1kN/m2, φ= 0°, γ= 18.7 kN/m
3
L/
B
Df/
B
qult
(EX)
qult(T) qult(M) qult(H) qult(V)
1 0.0
22.22 25.20 31.45 31.19 31.19
1 0.5
26.66 26.60 36.00 38.83 38.83
1 1.0
31.11 28.00 40.50 46.48 46.48
2 0.0
20.00 22.29 28.84 28.75 28.75
2 0.5
20.00 23.69 33.11 35.90 35.90
2 1.0
22.22 25.09 37.40 41.65 41.65
6 0.0
17.78 19.38 27.00 27.05 27.05
6 0.5
17.78 20.78 31.10 33.86 33.86
6 1.0
20.00 22.20 35.20 40.67 40.67
It is observed that experimental data shows more
proximity to the results obtained by Terzaghi’s
analytical equations. The proximity of the
experimental results ensures the reliability of the
test set-up. Likewise tests were performed on fine
sand in loose condition as stated before and the
results are presented in Fig 6, 7 and 8
Fig.6 Comparison of performance of MSF with
L/B=1 on loose sand
Fig.7 Comparison of performance of MSF with
L/B=2 on loose sand
0.001
0.01
0.1
1
0.01 0.1 1 10B
eari
ng
Pre
ssu
re in
N/s
q.m
mSettlement in mm
Df/B=0, Ds/B=0
Df/B=0, Ds/B=0.5
Df/B=0, Ds/B=1
Df/B=0.5, Ds/B=0
Df/B=0.5, Ds/B=0.5Df/B=0.5, Ds/B=1
Df/B=1, Ds/B=0
Df/B=1, Ds/B=0.5
Df/B=1, Df/B=1
0.0010
0.0100
0.1000
1.0000
0.01 1.00
Bea
rin
g p
ress
ure
in N
/sq
.mm
Settlement in mm
Df/B=0, Ds/B=0
Df/B=0, Ds/B=0.5
Df/B=0, Ds/B=1
Df/B=0.5, Ds/B=0
Df/B=0.5, Ds/B=0.5
Df/B=0.5, Ds/B=1
Df/B=1, Ds/B=0
Df/B=1, Ds/B=0.5
Df/B=1, Ds/B=1
Dr.(Mrs)Nayanmoni Chetia, Dr.(Mrs)Bibha Das Saikia
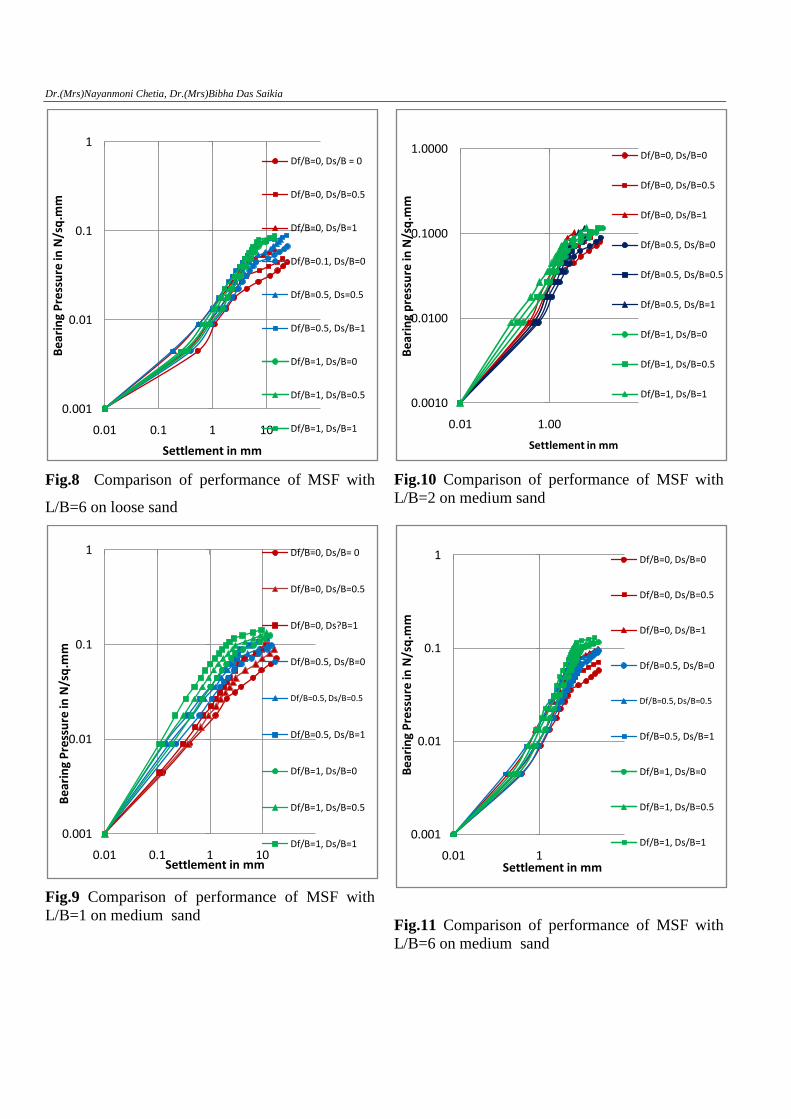
Fig.8 Comparison of performance of MSF with
L/B=6 on loose sand
Fig.9 Comparison of performance of MSF with
L/B=1 on medium sand
Fig.10 Comparison of performance of MSF with
L/B=2 on medium sand
Fig.11 Comparison of performance of MSF with
L/B=6 on medium sand
0.001
0.01
0.1
1
0.01 0.1 1 10
Bea
rin
g P
ress
ure
in N
/sq
.mm
Settlement in mm
Df/B=0, Ds/B = 0
Df/B=0, Ds/B=0.5
Df/B=0, Ds/B=1
Df/B=0.1, Ds/B=0
Df/B=0.5, Ds=0.5
Df/B=0.5, Ds/B=1
Df/B=1, Ds/B=0
Df/B=1, Ds/B=0.5
Df/B=1, Ds/B=1
0.001
0.01
0.1
1
0.01 0.1 1 10
Bea
rin
g P
ress
ure
in N
/sq
.mm
Settlement in mm
Df/B=0, Ds/B= 0
Df/B=0, Ds/B=0.5
Df/B=0, Ds?B=1
Df/B=0.5, Ds/B=0
Df/B=0.5, Ds/B=0.5
Df/B=0.5, Ds/B=1
Df/B=1, Ds/B=0
Df/B=1, Ds/B=0.5
Df/B=1, Ds/B=1
0.0010
0.0100
0.1000
1.0000
0.01 1.00
Bea
rin
g p
ress
ure
in N
/sq
.mm
Settlement in mm
Df/B=0, Ds/B=0
Df/B=0, Ds/B=0.5
Df/B=0, Ds/B=1
Df/B=0.5, Ds/B=0
Df/B=0.5, Ds/B=0.5
Df/B=0.5, Ds/B=1
Df/B=1, Ds/B=0
Df/B=1, Ds/B=0.5
Df/B=1, Ds/B=1
0.001
0.01
0.1
1
0.01 1
Bea
rin
g P
ress
ure
in N
/sq
.mm
Settlement in mm
Df/B=0, Ds/B=0
Df/B=0, Ds/B=0.5
Df/B=0, Ds/B=1
Df/B=0.5, Ds/B=0
Df/B=0.5, Ds/B=0.5
Df/B=0.5, Ds/B=1
Df/B=1, Ds/B=0
Df/B=1, Ds/B=0.5
Df/B=1, Ds/B=1
50
th
IG
C
50th
INDIAN GEOTECHNICAL CONFERENCE
17th
– 19th
DECEMBER 2015, Pune, Maharashtra, India
Venue: College of Engineering (Estd. 1854), Pune, India
Fig 9, 10 and 11 shows the results of the tests
performed on medium sand. In case of sand it is
difficult to get the definite break point in the
pressure settlement characteristics graph and
hence log-log plot is used.
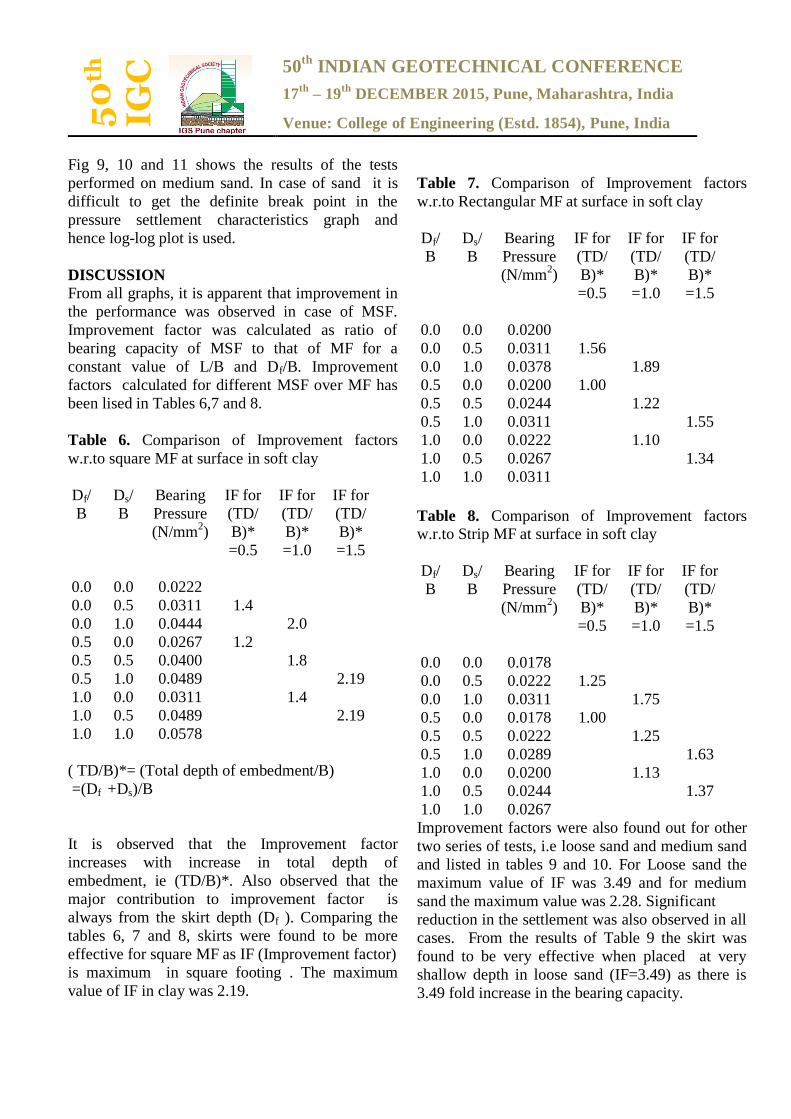
DISCUSSION
From all graphs, it is apparent that improvement in
the performance was observed in case of MSF.
Improvement factor was calculated as ratio of
bearing capacity of MSF to that of MF for a
constant value of L/B and Df/B. Improvement
factors calculated for different MSF over MF has
been lised in Tables 6,7 and 8.
Table 6. Comparison of Improvement factors
w.r.to square MF at surface in soft clay
Df/
B
Ds/
B
Bearing
Pressure
(N/mm2)
IF for
(TD/
B)*
=0.5
IF for
(TD/
B)*
=1.0
IF for
(TD/
B)*
=1.5
0.0 0.0 0.0222
0.0 0.5 0.0311 1.4
0.0 1.0 0.0444 2.0
0.5 0.0 0.0267 1.2
0.5 0.5 0.0400 1.8
0.5 1.0 0.0489 2.19
1.0 0.0 0.0311 1.4
1.0 0.5 0.0489 2.19
1.0 1.0 0.0578
( TD/B)*= (Total depth of embedment/B)
=(Df +Ds)/B
It is observed that the Improvement factor
increases with increase in total depth of
embedment, ie (TD/B)*. Also observed that the
major contribution to improvement factor is
always from the skirt depth (Df ). Comparing the
tables 6, 7 and 8, skirts were found to be more
effective for square MF as IF (Improvement factor)
is maximum in square footing . The maximum
value of IF in clay was 2.19.
Table 7. Comparison of Improvement factors
w.r.to Rectangular MF at surface in soft clay
Df/
B
Ds/
B
Bearing
Pressure
(N/mm2)
IF for
(TD/
B)*
=0.5
IF for
(TD/
B)*
=1.0
IF for
(TD/
B)*
=1.5
0.0 0.0 0.0200
0.0 0.5 0.0311 1.56
0.0 1.0 0.0378 1.89
0.5 0.0 0.0200 1.00
0.5 0.5 0.0244 1.22
0.5 1.0 0.0311 1.55
1.0 0.0 0.0222 1.10
1.0 0.5 0.0267 1.34
1.0 1.0 0.0311
Table 8. Comparison of Improvement factors w.r.to Strip MF at surface in soft clay
Df/
B
Ds/
B
Bearing
Pressure
(N/mm2)
IF for
(TD/
B)*
=0.5
IF for
(TD/
B)*
=1.0
IF for
(TD/
B)*
=1.5
0.0 0.0 0.0178
0.0 0.5 0.0222 1.25
0.0 1.0 0.0311 1.75
0.5 0.0 0.0178 1.00
0.5 0.5 0.0222 1.25
0.5 1.0 0.0289 1.63
1.0 0.0 0.0200 1.13
1.0 0.5 0.0244 1.37
1.0 1.0 0.0267
Improvement factors were also found out for other
two series of tests, i.e loose sand and medium sand
and listed in tables 9 and 10. For Loose sand the
maximum value of IF was 3.49 and for medium
sand the maximum value was 2.28. Significant
reduction in the settlement was also observed in all
cases. From the results of Table 9 the skirt was
found to be very effective when placed at very
shallow depth in loose sand (IF=3.49) as there is
3.49 fold increase in the bearing capacity.
Dr.(Mrs)Nayanmoni Chetia, Dr.(Mrs)Bibha Das Saikia
Table 9. Comparison of Improvement factors
w.r.to MF at surface in loose sand
L/B Df/B Ds/B Bearing
Capacity
(N/mm2)
Improvement
factor w.r.to
MF
(IF)
1 0.0 0.0 0.01778 1.00
1 0.0 0.5 0.03556 2.00
1 0.0 1.0 0.06222 3.49
1 0.5 0.0 0.04000 1.00
1 0.5 0.5 0.04444 1.11
1 0.5 1.0 0.07111 1.78
1 1.0 0.0 0.06222 1.00
1 1.0 0.5 0.07111 1.14
1 1.0 1.0 0.08000 1.29
2 0.0 0.0 0.01778 1.00
2 0.0 0.5 0.03556 2.00
2 0.0 1.0 0.05333 2.99
2 0.5 0.0 0.04444 1.00
2 0.5 0.5 0.05333 1.20
2 0.5 1.0 0.05333 1.20
2 1.0 0.0 0.06222 1.00
2 1.0 0.5 0.07111 1.14
2 1.0 1.0 0.08000 1.29
6 0.0 0.0 0.01778 1.00
6 0.0 0.5 0.03111 1.75
6 0.0 1.0 0.04000 2.25
6 0.5 0.0 0.04444 1.00
6 0.5 0.5 0.04888 1.09
6 0.5 1.0 0.06667 1.50
6 1.0 0.0 0.07111 1.00
6 1.0 0.5 0.07111 1.00
6 1.0 1.0 0.08000 1.13
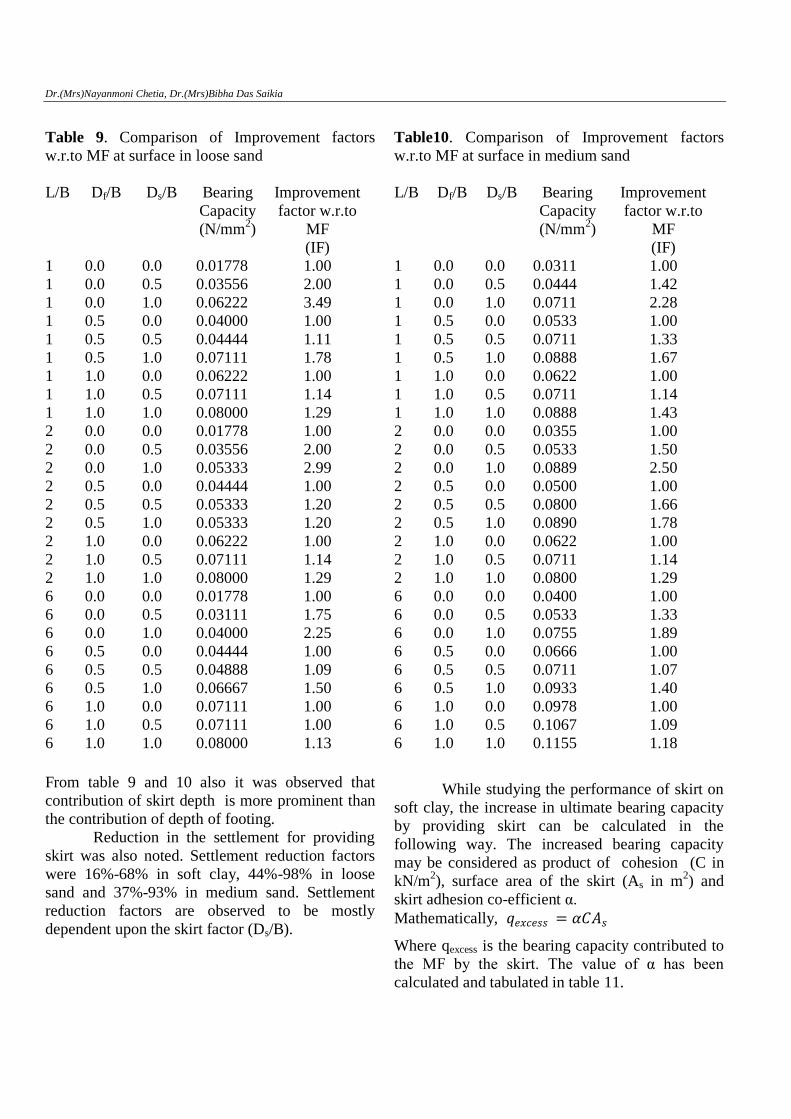
From table 9 and 10 also it was observed that
contribution of skirt depth is more prominent than
the contribution of depth of footing.
Reduction in the settlement for providing
skirt was also noted. Settlement reduction factors
were 16%-68% in soft clay, 44%-98% in loose
sand and 37%-93% in medium sand. Settlement
reduction factors are observed to be mostly
dependent upon the skirt factor (Ds/B).
Table10. Comparison of Improvement factors
w.r.to MF at surface in medium sand
L/B Df/B Ds/B Bearing
Capacity
(N/mm2)
Improvement
factor w.r.to
MF
(IF)
1 0.0 0.0 0.0311 1.00
1 0.0 0.5 0.0444 1.42
1 0.0 1.0 0.0711 2.28
1 0.5 0.0 0.0533 1.00
1 0.5 0.5 0.0711 1.33
1 0.5 1.0 0.0888 1.67
1 1.0 0.0 0.0622 1.00
1 1.0 0.5 0.0711 1.14
1 1.0 1.0 0.0888 1.43
2 0.0 0.0 0.0355 1.00
2 0.0 0.5 0.0533 1.50
2 0.0 1.0 0.0889 2.50
2 0.5 0.0 0.0500 1.00
2 0.5 0.5 0.0800 1.66
2 0.5 1.0 0.0890 1.78
2 1.0 0.0 0.0622 1.00
2 1.0 0.5 0.0711 1.14
2 1.0 1.0 0.0800 1.29
6 0.0 0.0 0.0400 1.00
6 0.0 0.5 0.0533 1.33
6 0.0 1.0 0.0755 1.89
6 0.5 0.0 0.0666 1.00
6 0.5 0.5 0.0711 1.07
6 0.5 1.0 0.0933 1.40
6 1.0 0.0 0.0978 1.00
6 1.0 0.5 0.1067 1.09
6 1.0 1.0 0.1155 1.18
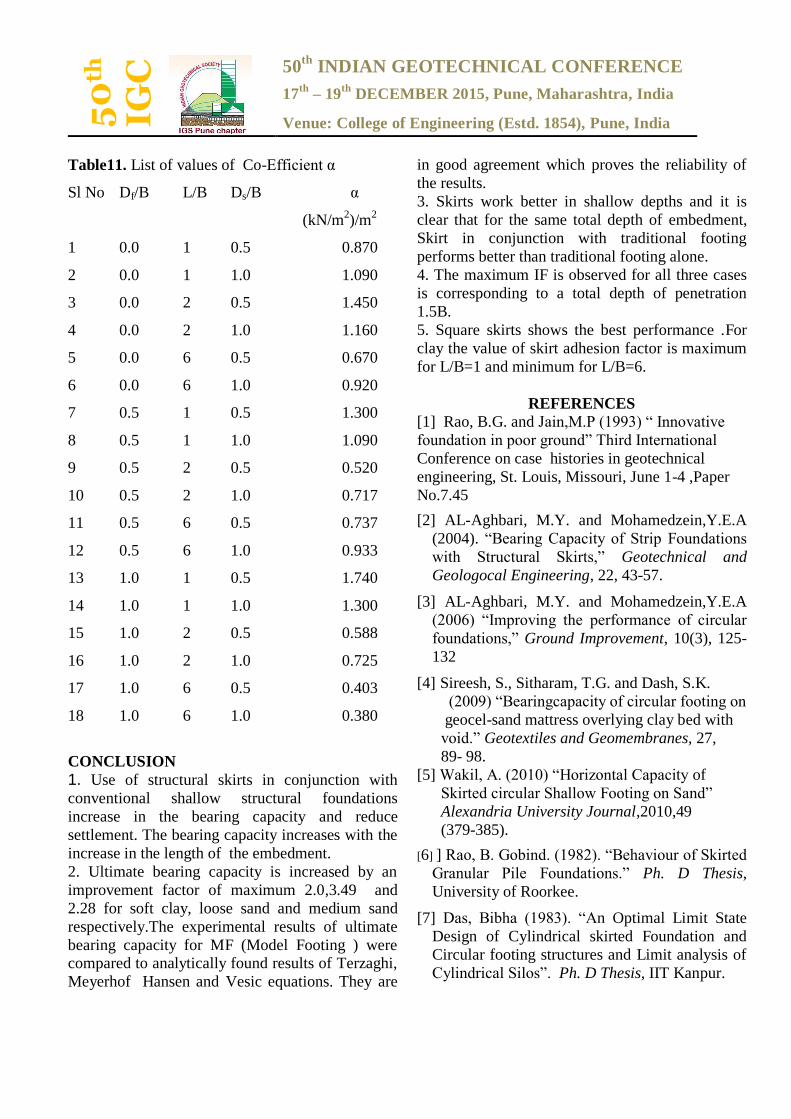
While studying the performance of skirt on
soft clay, the increase in ultimate bearing capacity
by providing skirt can be calculated in the
following way. The increased bearing capacity
may be considered as product of cohesion (C in
kN/m2), surface area of the skirt (As in m
2) and
skirt adhesion co-efficient α.
Mathematically, 𝑞𝑒𝑥𝑐𝑒𝑠𝑠 = 𝛼𝐶𝐴𝑠
Where qexcess is the bearing capacity contributed to
the MF by the skirt. The value of α has been
calculated and tabulated in table 11.
50
th
IG
C
50th
INDIAN GEOTECHNICAL CONFERENCE
17th
– 19th
DECEMBER 2015, Pune, Maharashtra, India
Venue: College of Engineering (Estd. 1854), Pune, India
Table11. List of values of Co-Efficient α
Sl No Df/B L/B Ds/B α
(kN/m2)/m
2
1 0.0 1 0.5 0.870
2 0.0 1 1.0 1.090
3 0.0 2 0.5 1.450
4 0.0 2 1.0 1.160
5 0.0 6 0.5 0.670
6 0.0 6 1.0 0.920
7 0.5 1 0.5 1.300
8 0.5 1 1.0 1.090
9 0.5 2 0.5 0.520
10 0.5 2 1.0 0.717
11 0.5 6 0.5 0.737
12 0.5 6 1.0 0.933
13 1.0 1 0.5 1.740
14 1.0 1 1.0 1.300
15 1.0 2 0.5 0.588
16 1.0 2 1.0 0.725
17 1.0 6 0.5 0.403
18 1.0 6 1.0 0.380
CONCLUSION
1. Use of structural skirts in conjunction with
conventional shallow structural foundations
increase in the bearing capacity and reduce
settlement. The bearing capacity increases with the
increase in the length of the embedment.
2. Ultimate bearing capacity is increased by an
improvement factor of maximum 2.0,3.49 and
2.28 for soft clay, loose sand and medium sand
respectively.The experimental results of ultimate
bearing capacity for MF (Model Footing ) were compared to analytically found results of Terzaghi,
Meyerhof Hansen and Vesic equations. They are
in good agreement which proves the reliability of
the results.
3. Skirts work better in shallow depths and it is
clear that for the same total depth of embedment,
Skirt in conjunction with traditional footing
performs better than traditional footing alone.
4. The maximum IF is observed for all three cases
is corresponding to a total depth of penetration
1.5B.
5. Square skirts shows the best performance .For
clay the value of skirt adhesion factor is maximum
for L/B=1 and minimum for L/B=6.
REFERENCES
[1] Rao, B.G. and Jain,M.P (1993) “ Innovative
foundation in poor ground” Third International
Conference on case histories in geotechnical
engineering, St. Louis, Missouri, June 1-4 ,Paper
No.7.45
[2] AL-Aghbari, M.Y. and Mohamedzein,Y.E.A
(2004). “Bearing Capacity of Strip Foundations
with Structural Skirts,” Geotechnical and
Geologocal Engineering, 22, 43-57.
[3] AL-Aghbari, M.Y. and Mohamedzein,Y.E.A
(2006) “Improving the performance of circular
foundations,” Ground Improvement, 10(3), 125-
132
[4] Sireesh, S., Sitharam, T.G. and Dash, S.K.
(2009) “Bearingcapacity of circular footing on
geocel-sand mattress overlying clay bed with
void.” Geotextiles and Geomembranes, 27,
89- 98. [5] Wakil, A. (2010) “Horizontal Capacity of
Skirted circular Shallow Footing on Sand”
Alexandria University Journal,2010,49
(379-385).
[6] ] Rao, B. Gobind. (1982). “Behaviour of Skirted
Granular Pile Foundations.” Ph. D Thesis,
University of Roorkee.
[7] Das, Bibha (1983). “An Optimal Limit State
Design of Cylindrical skirted Foundation and
Circular footing structures and Limit analysis of
Cylindrical Silos”. Ph. D Thesis, IIT Kanpur.

Dr.(Mrs)Nayanmoni Chetia, Dr.(Mrs)Bibha Das Saikia


![50th INDIAN GEOTECHNICAL CONFERENCEigs/ldh/files/igc 2015 pune... · 50th INDIAN GEOTECHNICAL CONFERENCE ... proposed by Barkan (1962) [8], to include all possible forms of soil types](https://img.pdfslide.us/doc/110x75/5b7bd4557f8b9a70138b636b/50th-indian-geotechnical-conference-igsldhfilesigc-2015-pune-50th-indian.jpg)