Embed Size (px)
Citation preview
Indian Container Market
Indian Container Trade AnalysisAnAlysis
IndIanContainerTrade
Indian Container Trade AnalysisAnAlysis
IndIanContainerTrade
Foreword
The world is embracing the concept of containerisation as a solution to deal with the challenges of contemporary global supplychains. In most developed regions around the world, the container has a high share in
the maritime related import and export flows of general cargo. It is only with containerisation that production could become globalised by a better usage of comparative advantages while distribution systems were able to interact more efficiently, reconciling spatially diverse supply and demand relationships.
In fact, ‘trading in the box’ is one of the most popular and efficient global transportation methods. In line with the global trend, the container business in India is also growing at a brisk pace, as importers and exporters are increasingly shifting away from general cargo. Container traffic in India has achieved a CAGR of 11 per cent over the last 10 years, while annual average growth rate over the last five years hovered around 6.3 per cent.
While global container shipping celebrated its 50th anniversary in 2006, as an innovation that had a tremendous impact on production and distribution, it is still an evolving business model in India. In this context, the role of containers in Indian trade, its share among various ports, distribution models and future growth, need to be looked at from a fresh perspective. To further support the growth of containerisation, major innovations in terms of logistics support, technology and policy interventions are required.
It is with this aim that we at Maritime Gateway along with Drewry Maritime Research, decided to come out with a quick study to showcase the existing scenario, future opportunities and growth distribution in containerised trade in India. This is part of our sustained effort to offer new perspective and in-depth knowledge about an industry that can bring in tremendous benefits to the maritime trade.
The abundant opportunities offered by containers lure various transport sector players to promote the containerization drive. Government of India has also taken several initiatives and brought forth policies to increase the utilisation of containers.
Our study suggest that infrastructure bottlenecks, connectivity and trade imbalance is hampering growth of container throughput and capacity on the east coast. Future container infrastructure growth in India will be driven by PPP model at policy as well as at the implementation level.
We sincerely hope this study will be both inspirational and insightful for all stakeholders of the maritime industry and trade.
We are delighted to be associated with this work and look forward to partnering with more such initiatives in future.
SincerelyRamprasadEditor-in-chief and PublisherMaritime Gateway
Foreword
Drewry is proud to be associated with Maritime Gateway as Knowledge Partner for Containers India 2013. It is our pleasure to present this industry a white paper titled “Indian Container Market”.
India’s position in global container trade has evolved notably over the past decade. This paper attempts to critically analyse the changing dynamics of container trade in India. It focuses on India’s historical container throughput, infrastructure (both landside and seaside), and competitive landscape under which the trade operates.
The report also touches upon the issues of shift in traffic at gateway ports and the impact of an on-going shift from traditional markets on Indian trade. Drewry has also tried to place focus on expected development of container port capacity in India and the regime of Public Private Partnership in the light of financing options for these projects.
Author: Dr. Subrata K Behera
Dr. Subrata Kumar Behera (Sr. Research Analyst) with an industry experience of five years is well versed in international trade and transport. He works in the container and ports team at Drewry. He has worked on the India and other emerging market Container Business Analysis. He is a Doctorate from the School of International Studies, Jawaharlal Nehru University, New Delhi. Besides his doctoral thesis, he has number of research publications to his credit.
C o n t e n t s
C o n t e n t s1. OverviewofcontainertrafficinIndia 6 1.1 Growth of container traffic in India 7 1.1.1 Major vs. Non-Major ports 7 1.1.2 West vs. East coast ports 8 1.2 East bound cargo vs. West bound cargo 8 1.3 India-ASEAN trade 9 1.4 Containerisation level in India 9 1.4.1 Current containerisation penetration in India 10 1.4.2 Containerisation potential 10 1.4.3 Factors effecting growth of containerization 10
2. Export and import imbalance 11 2.1 Current status 11 2.2 Future outlook 11
3. Supportinfrastructure:CFSandICD 12 3.1 The role of ICDs 12 3.2 Growth of ICDs and CFSs in India 13 3.3 Benefits from the development of ICDs 13 3.4 Drivers for the development of ICDs 13 3.5 Key Challenges 14 3.6 Future Outlook 14
4. ContainerportcapacityinIndia 15 4.1 Existing terminal capacities 15 4.2 Capacity utilisation 16 4.3 Major capacity expansion plan on the West coast 16 4.4 Major capacity expansion plan on the East coast 17 4.5 PPP for development of container port capacity 18
5. Keytakeaways 20
List of TablesTable 2.1 Containerised Export-Import split in India 11Table 3.1 State wise number of registered CFS/ICDs 13Table 4.1 Coastwise container port capacity in India 15Table 4.2 Container port capacity in India 15Table 4.3 Three main port institutional structures worldwide 18
List of FiguresFigure 1.1 India’s historical container traffic (million teu) 7Figure 1.2 Rising share of Non-Major ports 7Figure 1.3 Container handled at West coast and east coast ports 8Figure 1.4 Changing share of eastbound trade in India’s global trade 9Figure 1.5 India’s trade with ASEAN countries 9Figure 1.6 Level of containerisation in India 10Figure 4.1 Port capacity utilisation in India (coastwise) 16Figure 4.2 Port capacity utilisation in India 16Figure 4.3 Planned port capacity till 2020 18
C o n t e n t s
overview of container traffic in India
1
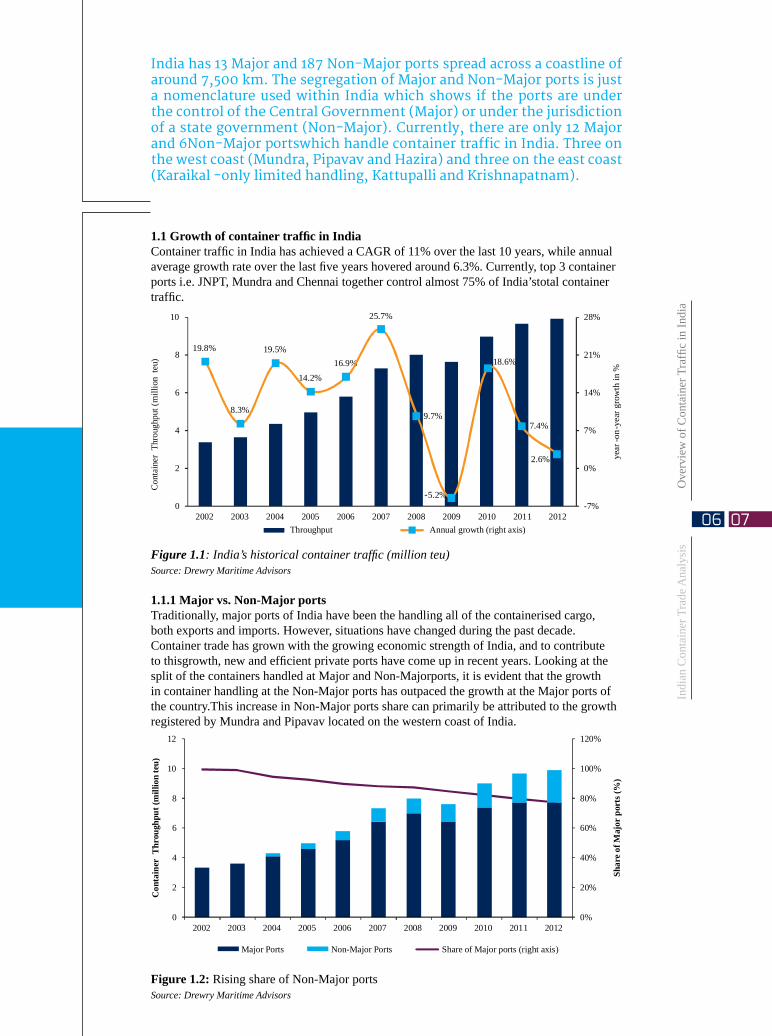
India has 13 Major and 187 Non-Major ports spread across a coastline of around 7,500 km. The segregation of Major and Non-Major ports is just a nomenclature used within India which shows if the ports are under the control of the Central Government (Major) or under the jurisdiction of a state government (Non-Major). Currently, there are only 12 Major and 6Non-Major portswhich handle container traffic in India. Three on the west coast (Mundra, Pipavav and Hazira) and three on the east coast (Karaikal -only limited handling, Kattupalli and Krishnapatnam).
1.1GrowthofcontainertrafficinIndiaContainer traffic in India has achieved a CAGR of 11% over the last 10 years, while annual average growth rate over the last five years hovered around 6.3%. Currently, top 3 container ports i.e. JNPT, Mundra and Chennai together control almost 75% of India’stotal container traffic.
Figure 1.1: India’s historical container traffic (million teu)Source: Drewry Maritime Advisors
1.1.1 Major vs. Non-Major portsTraditionally, major ports of India have been the handling all of the containerised cargo, both exports and imports. However, situations have changed during the past decade. Container trade has grown with the growing economic strength of India, and to contribute to thisgrowth, new and efficient private ports have come up in recent years. Looking at the split of the containers handled at Major and Non-Majorports, it is evident that the growth in container handling at the Non-Major ports has outpaced the growth at the Major ports of the country.This increase in Non-Major ports share can primarily be attributed to the growth registered by Mundra and Pipavav located on the western coast of India.
Figure 1.2: Rising share of Non-Major portsSource: Drewry Maritime Advisors
Indi
an C
onta
iner
Tra
de A
naly
sis
Ove
rvie
w o
f Con
tain
er T
raffi
c in
Indi
a
0706
The share of Major ports in container throughput of India has declined from 99% in 2002 to 85% in 2009, and further to 77% in 2012. Amongst the Major ports in India, JNP remained the largest port with a throughput of 4.2 million teu in 2012.The second largest Major port is Chennai,which registered a throughput of 1.5 million teu in 2012, grew at a CAGR of 14% during 2002-2012.On the other hand, amongst the Non-Major ports, Mundra has evolved over the time and is currently the largest port. It registered a CAGR of 38% during 2004-12 in terms of container throughput. The total container handled at this port was 1.7 million teu in 2012.
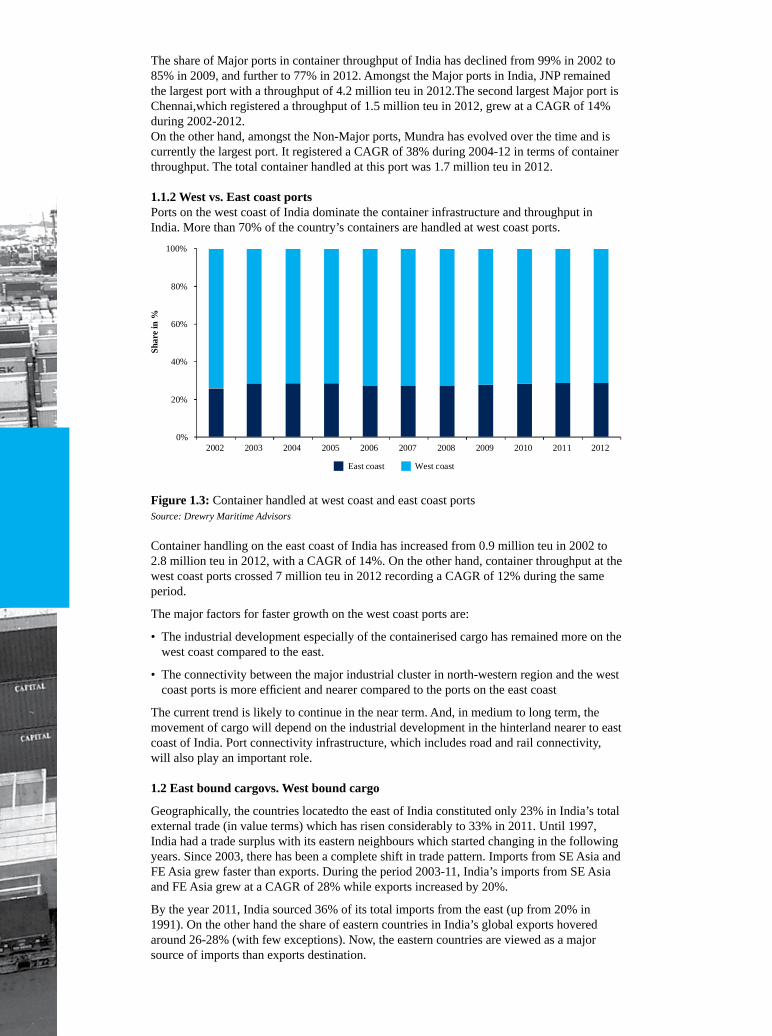
1.1.2 West vs. East coast portsPorts on the west coast of India dominate the container infrastructure and throughput in India. More than 70% of the country’s containers are handled at west coast ports.
Figure 1.3: Container handled at west coast and east coast portsSource: Drewry Maritime Advisors
Container handling on the east coast of India has increased from 0.9 million teu in 2002 to 2.8 million teu in 2012, with a CAGR of 14%. On the other hand, container throughput at the west coast ports crossed 7 million teu in 2012 recording a CAGR of 12% during the same period.
The major factors for faster growth on the west coast ports are:
• The industrial development especially of the containerised cargo has remained more on the west coast compared to the east.
• The connectivity between the major industrial cluster in north-western region and the west coast ports is more efficient and nearer compared to the ports on the east coast
The current trend is likely to continue in the near term. And, in medium to long term, the movement of cargo will depend on the industrial development in the hinterland nearer to east coast of India. Port connectivity infrastructure, which includes road and rail connectivity, will also play an important role.
1.2 East bound cargovs. West bound cargo
Geographically, the countries locatedto the east of India constituted only 23% in India’s total external trade (in value terms) which has risen considerably to 33% in 2011. Until 1997, India had a trade surplus with its eastern neighbours which started changing in the following years. Since 2003, there has been a complete shift in trade pattern. Imports from SE Asia and FE Asia grew faster than exports. During the period 2003-11, India’s imports from SE Asia and FE Asia grew at a CAGR of 28% while exports increased by 20%.
By the year 2011, India sourced 36% of its total imports from the east (up from 20% in 1991). On the other hand the share of eastern countries in India’s global exports hovered around 26-28% (with few exceptions). Now, the eastern countries are viewed as a major source of imports than exports destination.
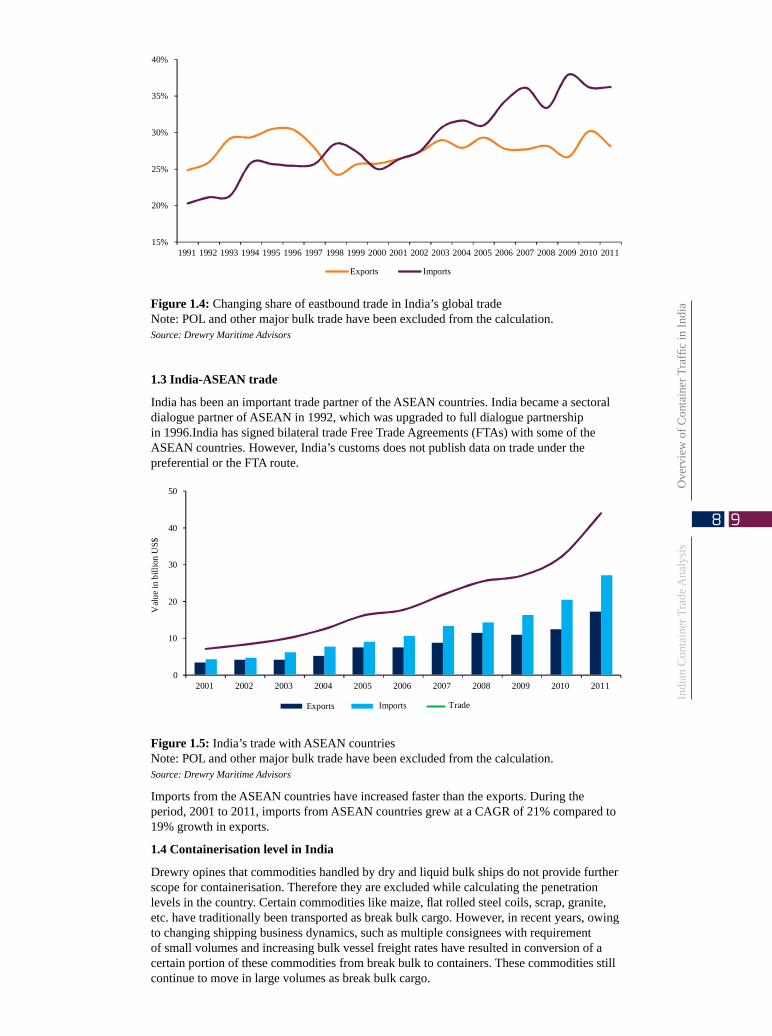
Figure 1.4: Changing share of eastbound trade in India’s global tradeNote: POL and other major bulk trade have been excluded from the calculation.Source: Drewry Maritime Advisors
1.3India-ASEANtrade
India has been an important trade partner of the ASEAN countries. India became a sectoral dialogue partner of ASEAN in 1992, which was upgraded to full dialogue partnership in 1996.India has signed bilateral trade Free Trade Agreements (FTAs) with some of the ASEAN countries. However, India’s customs does not publish data on trade under the preferential or the FTA route.
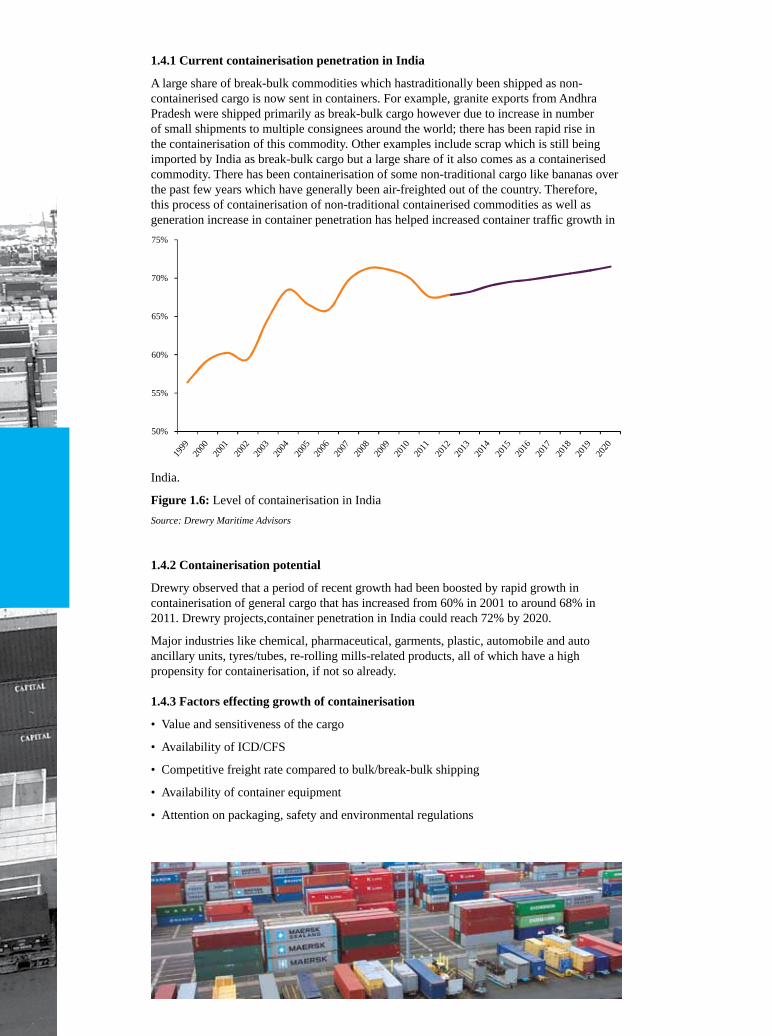
Figure1.5: India’s trade with ASEAN countriesNote: POL and other major bulk trade have been excluded from the calculation.Source: Drewry Maritime Advisors
Imports from the ASEAN countries have increased faster than the exports. During the period, 2001 to 2011, imports from ASEAN countries grew at a CAGR of 21% compared to 19% growth in exports.
1.4ContainerisationlevelinIndia
Drewry opines that commodities handled by dry and liquid bulk ships do not provide further scope for containerisation. Therefore they are excluded while calculating the penetration levels in the country. Certain commodities like maize, flat rolled steel coils, scrap, granite, etc. have traditionally been transported as break bulk cargo. However, in recent years, owing to changing shipping business dynamics, such as multiple consignees with requirement of small volumes and increasing bulk vessel freight rates have resulted in conversion of a certain portion of these commodities from break bulk to containers. These commodities still continue to move in large volumes as break bulk cargo.
Indi
an C
onta
iner
Tra
de A
naly
sis
Ove
rvie
w o
f Con
tain
er T
raffi
c in
Indi
a
98
1.4.1CurrentcontainerisationpenetrationinIndia
A large share of break-bulk commodities which hastraditionally been shipped as non-containerised cargo is now sent in containers. For example, granite exports from Andhra Pradesh were shipped primarily as break-bulk cargo however due to increase in number of small shipments to multiple consignees around the world; there has been rapid rise in the containerisation of this commodity. Other examples include scrap which is still being imported by India as break-bulk cargo but a large share of it also comes as a containerised commodity. There has been containerisation of some non-traditional cargo like bananas over the past few years which have generally been air-freighted out of the country. Therefore, this process of containerisation of non-traditional containerised commodities as well as generation increase in container penetration has helped increased container traffic growth in
India.
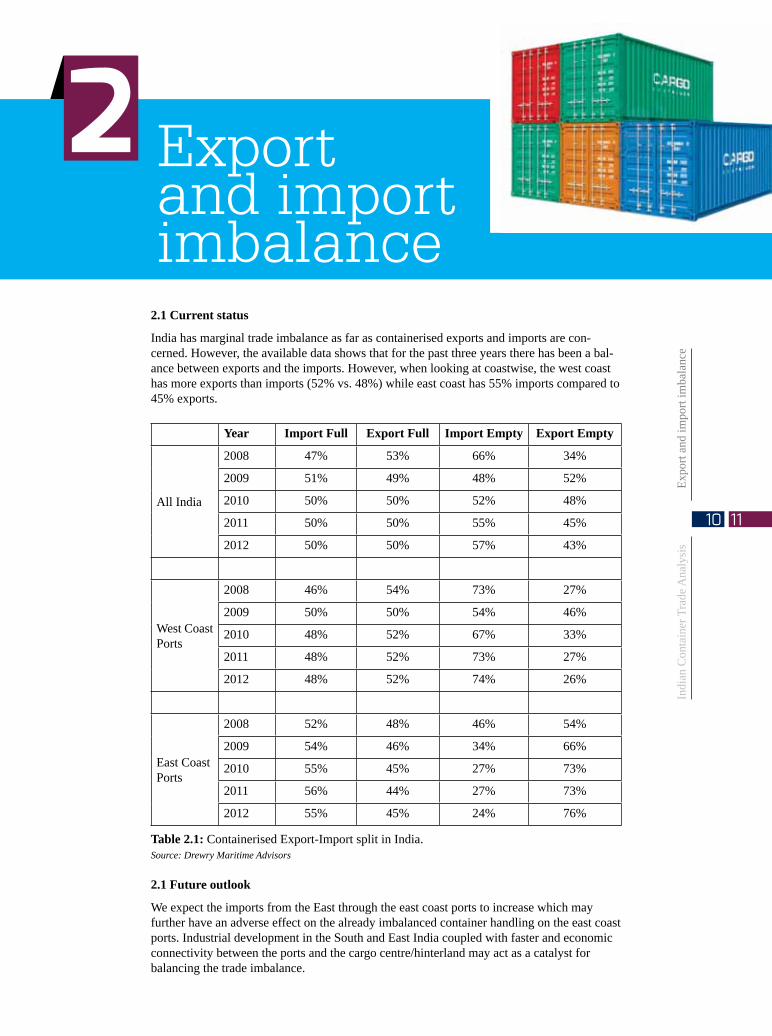
Figure 1.6: Level of containerisation in IndiaSource: Drewry Maritime Advisors
1.4.2 Containerisation potential
Drewry observed that a period of recent growth had been boosted by rapid growth in containerisation of general cargo that has increased from 60% in 2001 to around 68% in 2011. Drewry projects,container penetration in India could reach 72% by 2020.
Major industries like chemical, pharmaceutical, garments, plastic, automobile and auto ancillary units, tyres/tubes, re-rolling mills-related products, all of which have a high propensity for containerisation, if not so already.
1.4.3 Factors effecting growth of containerisation
• Value and sensitiveness of the cargo
• Availability of ICD/CFS
• Competitive freight rate compared to bulk/break-bulk shipping
• Availability of container equipment
• Attention on packaging, safety and environmental regulations
export and import imbalance
22.1 Current status
India has marginal trade imbalance as far as containerised exports and imports are con-cerned. However, the available data shows that for the past three years there has been a bal-ance between exports and the imports. However, when looking at coastwise, the west coast has more exports than imports (52% vs. 48%) while east coast has 55% imports compared to 45% exports.
Year ImportFull Export Full ImportEmpty Export Empty
All India
2008 47% 53% 66% 34%
2009 51% 49% 48% 52%
2010 50% 50% 52% 48%
2011 50% 50% 55% 45%
2012 50% 50% 57% 43%
West Coast Ports
2008 46% 54% 73% 27%
2009 50% 50% 54% 46%
2010 48% 52% 67% 33%
2011 48% 52% 73% 27%
2012 48% 52% 74% 26%
East Coast Ports
2008 52% 48% 46% 54%
2009 54% 46% 34% 66%
2010 55% 45% 27% 73%
2011 56% 44% 27% 73%
2012 55% 45% 24% 76%
Table 2.1: Containerised Export-Import split in India.Source: Drewry Maritime Advisors
2.1Futureoutlook
We expect the imports from the East through the east coast ports to increase which may further have an adverse effect on the already imbalanced container handling on the east coast ports. Industrial development in the South and East India coupled with faster and economic connectivity between the ports and the cargo centre/hinterland may act as a catalyst for balancing the trade imbalance.
Indi
an C
onta
iner
Tra
de A
naly
sis
Expo
rt an
d im
port
imba
lanc
e
1110
Support infrastructure: CFS and ICd
33.1TheroleofICDs
While ports are essential for seaborne trade, supporting infrastructure, especially hinterland infrastructure forms the backbone of competitive trade practices. Inland Container Depots (ICDs) and Container Freight Stations (CFSs) provide exporters and importers with value added services which facilitate movement of containerised goods from and to the ports.
ICDs may be viewed as extensions to the port and are commonly referred to dry ports, since they provide a similar function as a port for receipt/delivery of containers between carriers and cargo owners. These facilities are equipped for handling and temporary storage of containerised cargo as well as empty containers.
In India, the envisaged role of ICDs is paramount in facilitating cost effective and timely links to the vast hinterland, especially the Northern Hinterland covering the National Capital Region and adjoining states which are hub to key industrial zones and agricultural belt. Drewry estimates these ICDs put together handled well over a 1.3 million teu in 2012. But, this is much lower than the total potential.
Distinction between ICDs and CFSs
The terms ICDs and CFSs are frequently used interchangeably or inaccurately owing to an overlap of activities performed. However, the following primary activities differentiate the role of an ICD from that of a CFS –
• ICDs serve primarily as an extension of port as a clearing point providing last mile connectivity from inland location- typically by rail. However, some ICD’s do not have a rail head. At the same time many of the ICD’s now provide stuffing/stripping, warehousing and other value added services to offer a single point clearance.
• A CFS, on the other hand, is a facility for consolidation of cargo as well as a stuffing/stripping point for containerised goods under custom supervision with warehousing and specialised storage as value added services.
• ICDs are located inland and in proximity to cargo centres while CFSs are typically closer to the port.
• Considering the requirements of the Customs Act, and need to introduce clarity in nomenclature, all containers terminal facilities in the hinterland are designated as “ICDs”.
3.2GrowthofICDsandCFSsinIndia
While Inland depots have been gaining popularity many shippers and importers depended on direct movement of cargo to the ports where the cargo would be stuffed (for exports) or stripped (imports) before moving to/from the final destination.
There are as many as 247 listed container terminals in India. Most of these are CFSs located closer to the port. Nhava Sheva at JNP alone has over 30 CFS facilities in close proximity, catering to traffic moving to great distances, while Chennai port has 32 registered CFSs in its vicinity. This demonstrates the dependency on port based facilities as the primary point for cargo containerisation and clearing.
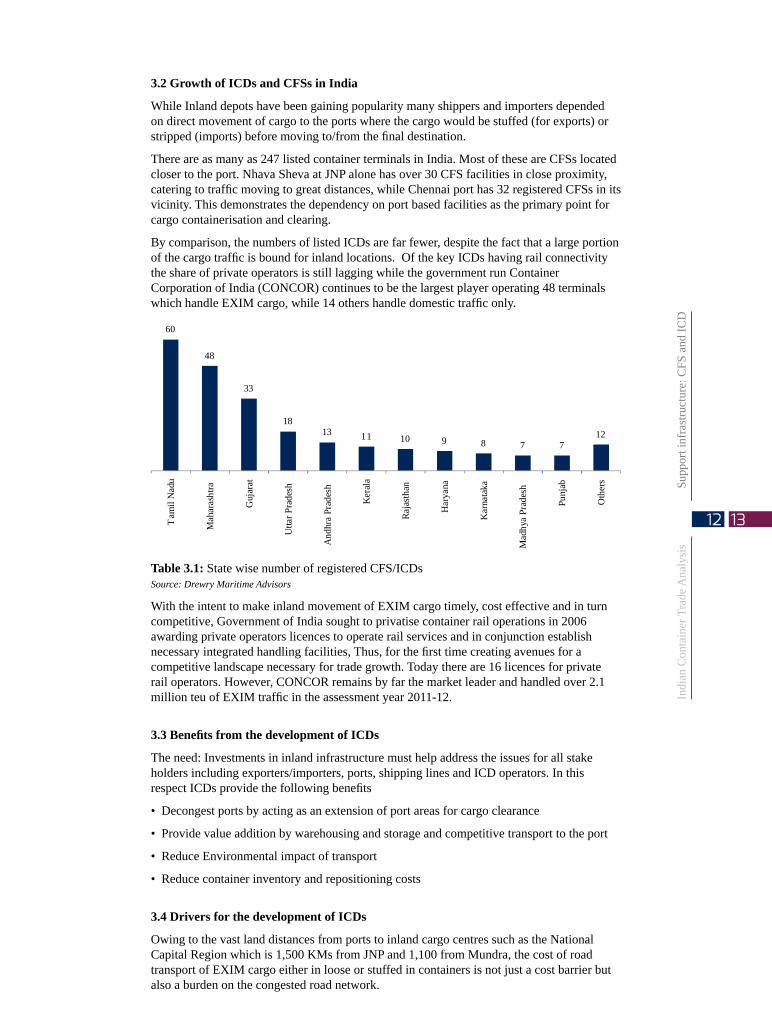
By comparison, the numbers of listed ICDs are far fewer, despite the fact that a large portion of the cargo traffic is bound for inland locations. Of the key ICDs having rail connectivity the share of private operators is still lagging while the government run Container Corporation of India (CONCOR) continues to be the largest player operating 48 terminals which handle EXIM cargo, while 14 others handle domestic traffic only.
Table 3.1: State wise number of registered CFS/ICDsSource: Drewry Maritime Advisors
With the intent to make inland movement of EXIM cargo timely, cost effective and in turn competitive, Government of India sought to privatise container rail operations in 2006 awarding private operators licences to operate rail services and in conjunction establish necessary integrated handling facilities, Thus, for the first time creating avenues for a competitive landscape necessary for trade growth. Today there are 16 licences for private rail operators. However, CONCOR remains by far the market leader and handled over 2.1 million teu of EXIM traffic in the assessment year 2011-12.
3.3BenefitsfromthedevelopmentofICDs
The need: Investments in inland infrastructure must help address the issues for all stake holders including exporters/importers, ports, shipping lines and ICD operators. In this respect ICDs provide the following benefits
• Decongest ports by acting as an extension of port areas for cargo clearance
• Provide value addition by warehousing and storage and competitive transport to the port
• Reduce Environmental impact of transport
• Reduce container inventory and repositioning costs
3.4DriversforthedevelopmentofICDs
Owing to the vast land distances from ports to inland cargo centres such as the National Capital Region which is 1,500 KMs from JNP and 1,100 from Mundra, the cost of road transport of EXIM cargo either in loose or stuffed in containers is not just a cost barrier but also a burden on the congested road network.
Indi
an C
onta
iner
Tra
de A
naly
sis
Supp
ort i
nfra
stru
ctur
e: C
FS a
nd IC
D
1312
Rail transport by comparison is far more cost competitive, safer and leaves a lower carbon footprint. ICDs with efficient rail links to ports ease gate congestion, reduce dwell, handling, documentation and inspection time.
Along with factors affecting modal shift from road to rail, the value generated by ICDs from their core and allied services will be important growth factors. Broadly these factors could be categorised under the following three dimensions -
• Growth in container traffic • Modal shift towards rail• Value addition and ease of business at ICDs
3.5KeyChallenges
Despite the apparent benefits that these inland facilities provide, several bottlenecks persist. Road is still a preferred mode of transport even over long distances and the trend has been on an up. Share of rail transport has regressed from close to 28% of cargo movement to just 22%, creating challenge for an ICD operators to offer frequent rail services and timely transports as opposed to export cargo moving directly to a CFS near the port facility.
Although there are myriad factors at play and they vary in form and magnitude for each ICD location, the two key factors encouraging direct road movement through ports are – transit time and costs.
The first has to do with frequency of rail services which in turn is related to traffic/demand. So, cost benefit and ease of doing business over direct road transport is paramount.
Rail haulage may be uncompetitive or provide little benefit over road in many cases; especially where distances are not too long or last mile connectivity is expensive. The single largest cost component of rail operations from ICD are high haulage costs which is paid to the Indian Railways and is the largest cost component of rail transport, estimated to be between 70-75% of the total transport cost.
Other issues, like availability of empty containers at the ICD location, difference in ocean freight rates by shipping for ICD acceptance, congested rail corridors, reluctance to move from established setups also translate into cost competitiveness and ease of doing business.
Broadly, the key challenges can be summarised under the following headers –
• Discouragement of inland penetration of container for faster turnaround of inventory • Inadequate rail frequency • Lack of last mile connectivity • High costs of rail transport • Multiplicity of ICDs
3.6FutureOutlook
CFSs and ICDs remain the fastest growing segment of the Indian Logistics industry and also highly profitable in most instances. Drewry expects this growth to gain pace in line with the increasing need to tackle the growing complexities of maritime intensive supply chain. Growing competition from private participation will also bring forth an array of new services and customised logistic solutions being provided. Recent investments towards developing Free Trade Warehousing Zones (FTWZs) by private players are illustrative of the growth potential and patent need of supporting infrastructure.
Nonetheless, formidable challenges remain to be tackled for this growth to sustain. The modal shift from road to rail will play a big role in facilitating a smooth flow of cargo from distant hinterlands to the port, decongesting ports and National highway in a safe and environmentally sensitive manner.
The much awaited development of Dedicated Freight Corridors on Eastern and Western is likely to provide the required impetus for rail services to be competitive to road transport. As per government estimates, the development of Dedicated Freight Corridor is expected to increase rail coefficient from Western Ports to 50% from the present levels of 20%.
Co-operation between key stake holders including various government agencies, ports, shipping lines and private ICD operators will be a key success factor for enhancing the role of Inland Container Depots as well as Container Freight Stations.
Container port capacity in India
4
4.1 Existing terminal capacities
With the growing demand for container handling facility in India, the port capacity has grown over the past decade. During the period 2002-12, the container handling capacity at Indian ports increased at a CAGR of 11%, from 5.2 million teu in 2002 to 14.9 in 2012. However, the capacity on the west coast of India grew faster at a CAGR of 12% during this period compared to 10% on the east coast.
Table 4.1 Coastwise container port capacity in India
2010 2011 2012West coast ports 9.7 10.3 10.0East coast ports 3.9 3.9 4.9AllIndia 13.6 14.0 14.9
Source: Drewry Maritime Advisors
When calculated on the basis of port type (Major and Non-Major), the rate of growth in capacity widely differs. Container handling capacity at the Major ports of the country grew at a CAGR of 7.7% over the period 2002-12 to reach 10.6 million teu. However, during the same period the capacity at the Non-Major ports grew at a very fast rate of 40% to reach 4.4 million teu in 2012 compared to a meagre 0.2 million teu in 2002. Mundra has emerged as the fastest growing port followed by Pipavav, both located on the upper west coast of India.
Table 4.2 Container port capacity in India
2010 2011 2012Major ports 9.95 9.95 10.55Non-Major ports 3.60 4.20 4.35AllIndia 13.6 14.0 14.9
Source: Drewry Maritime Advisors
Indi
an C
onta
iner
Tra
de A
naly
sis
Con
tain
er p
ort c
apac
ity in
Indi
a
1514
4.2 Capacity utilisation
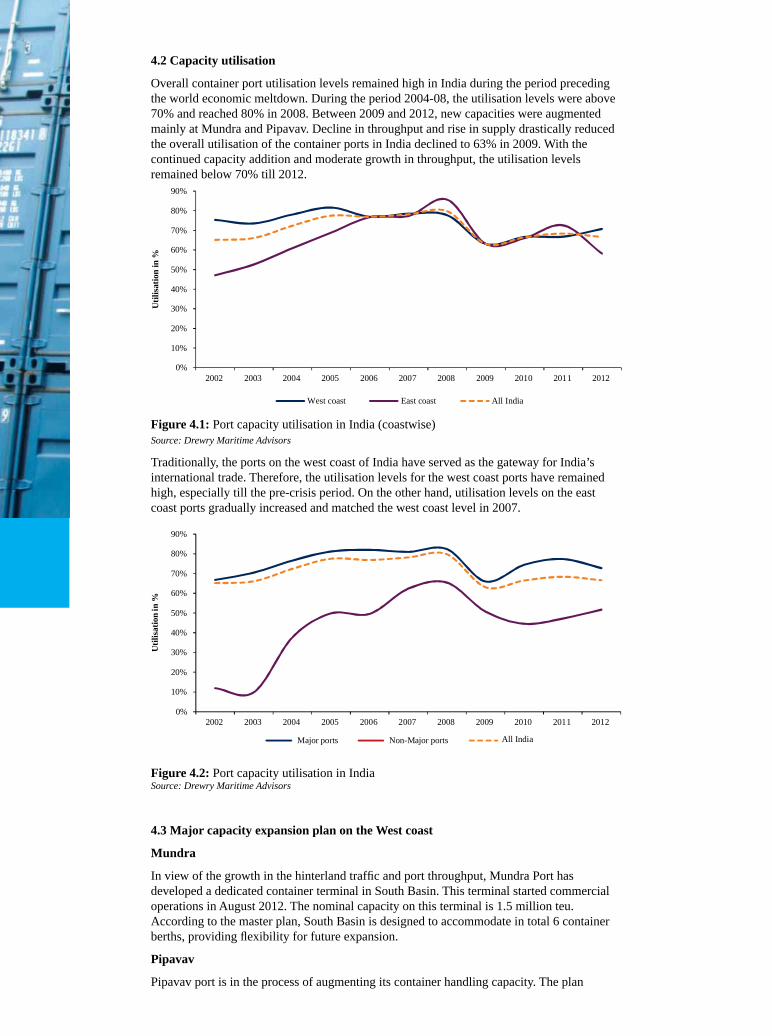
Overall container port utilisation levels remained high in India during the period preceding the world economic meltdown. During the period 2004-08, the utilisation levels were above 70% and reached 80% in 2008. Between 2009 and 2012, new capacities were augmented mainly at Mundra and Pipavav. Decline in throughput and rise in supply drastically reduced the overall utilisation of the container ports in India declined to 63% in 2009. With the continued capacity addition and moderate growth in throughput, the utilisation levels remained below 70% till 2012.
Figure 4.1: Port capacity utilisation in India (coastwise)Source: Drewry Maritime Advisors
Traditionally, the ports on the west coast of India have served as the gateway for India’s international trade. Therefore, the utilisation levels for the west coast ports have remained high, especially till the pre-crisis period. On the other hand, utilisation levels on the east coast ports gradually increased and matched the west coast level in 2007.
Figure 4.2: Port capacity utilisation in India Source: Drewry Maritime Advisors
4.3 Major capacity expansion plan on the West coast
Mundra
In view of the growth in the hinterland traffic and port throughput, Mundra Port has developed a dedicated container terminal in South Basin. This terminal started commercial operations in August 2012. The nominal capacity on this terminal is 1.5 million teu. According to the master plan, South Basin is designed to accommodate in total 6 container berths, providing flexibility for future expansion.
Pipavav
Pipavav port is in the process of augmenting its container handling capacity. The plan
includes construction of a berth of 356 m length, additional quay cranes and expansion of container yard. The total capacity is expected to increase to 1.5 million teu by 2014-15.
Hazira
Two container berths with a total quay length of 600 metre have been developed in the first phase. The port started container handling operations in January 2013. Future expansion plan includes building two new berths with a total quay length of 800 metres. The total capacity of the terminal is expected to increase to 1.2 million teu by 2017-18.
Jawaharlal Nehru Port (JNP)
JNP Port is planning to develop 330 m berth adjacent to existing NSICT terminal into a new container terminal. It could result in capacity augmentation of approximately 0.6 million teu. However, this project has been marred by several litigations which have substantially delayed the project.
JNPT is also developing a Fourth Container Terminal with a total quay length 2,000 metre. The proposed capacity is 5 million teu. PSA had won the bid for developing this terminal on a BOT basis. However, PSA did not sign the concession agreement.
Drewry learns from unconfirmed market sources that the port authority has received approval to split the planned mega terminal into two, each with a capacity of 2.4 million teu.
4.4 Major capacity expansion plan on the east coast
Ennore
Ennore Port has plans for the development of a container terminal on BOT basis for handling around 2 million teu. In September 2012, Grup Maritime and Eredene Capital got out of the project citing the increased cost of local financing, depreciation of the Indian rupee and lower projected growth in container traffic as key reasons. Now Ennore port is also planning split its new container terminal into three separate facilities. By the new plan, each berth will be of 700 metres.
Kattupalli
Kattupalli is an adjacent port located to the north of Ennore port, virtually sharing the same boundary wall as that of Ennore port. Originally conceived as a shipbuilding yard, the port has recently developed a container handling facility. Operations started in January this year with an initial capacity of 0.5 million teu. The capacity at Kattupalli is expected to reach 1.5 million teu by 2020.
Krishnapatnam
Krishnapatnam Port is promoted by the Hyderabad-based C.V.R. Group. Navayuga Engineering Company Ltd. (NECL) is the flagship entity of CVR Group and is the EPC contractor for Krishnapatnam Port. Krishnapatnam Port Company Limited (KPCL) has been awarded the 50-year BOOT concession by the Andhra Pradesh Government to develop the existing Non-Major port into a modern deep draft multipurpose port. The first phase was fully commissioned in September 2012 with planned terminal capacity of 1.2 million teu.
Chennai Mega Terminal
Chennai is developing a third terminal also known as Mega Terminal, which is proposed with a nameplate capacity of 4 million teu per annum. However, Drewry is of the opinion that peak capacity for this terminal until FY21 would be capped at around 2.4 million teu.
The proposed mega terminal will have two new breakwaters with a total length of around 4 km continuous quay length, 18 m alongside depth and basin area of 300 hectares and back up area of 100 hectares. The estimated cost of development for the proposed mega terminal at Chennai is US$770 million (INR 40 billion). According to Drewry estimates, the terminal is likely to begin operations by 2016-17.
Indi
an C
onta
iner
Tra
de A
naly
sis
Con
tain
er p
ort c
apac
ity in
Indi
a
1716
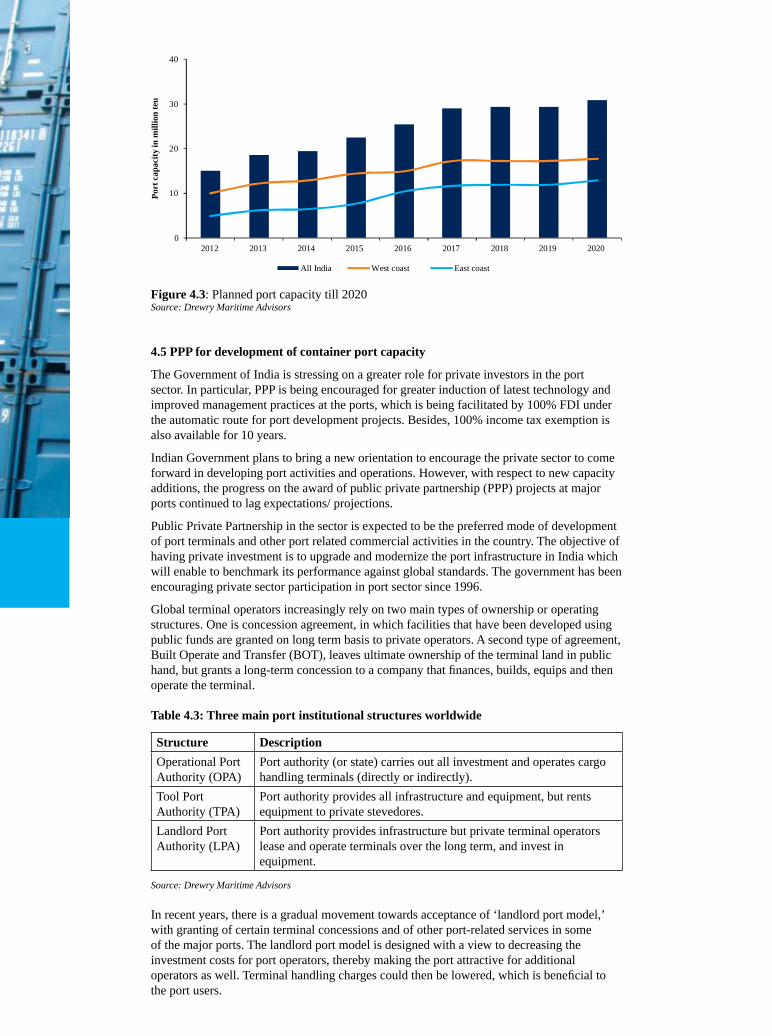
Figure 4.3: Planned port capacity till 2020Source: Drewry Maritime Advisors
4.5PPPfordevelopmentofcontainerportcapacity
The Government of India is stressing on a greater role for private investors in the port sector. In particular, PPP is being encouraged for greater induction of latest technology and improved management practices at the ports, which is being facilitated by 100% FDI under the automatic route for port development projects. Besides, 100% income tax exemption is also available for 10 years.
Indian Government plans to bring a new orientation to encourage the private sector to come forward in developing port activities and operations. However, with respect to new capacity additions, the progress on the award of public private partnership (PPP) projects at major ports continued to lag expectations/ projections.
Public Private Partnership in the sector is expected to be the preferred mode of development of port terminals and other port related commercial activities in the country. The objective of having private investment is to upgrade and modernize the port infrastructure in India which will enable to benchmark its performance against global standards. The government has been encouraging private sector participation in port sector since 1996.
Global terminal operators increasingly rely on two main types of ownership or operating structures. One is concession agreement, in which facilities that have been developed using public funds are granted on long term basis to private operators. A second type of agreement, Built Operate and Transfer (BOT), leaves ultimate ownership of the terminal land in public hand, but grants a long-term concession to a company that finances, builds, equips and then operate the terminal.
Table 4.3: Three main port institutional structures worldwide
Structure DescriptionOperational Port Authority (OPA)
Port authority (or state) carries out all investment and operates cargo handling terminals (directly or indirectly).
Tool Port Authority (TPA)
Port authority provides all infrastructure and equipment, but rents equipment to private stevedores.
Landlord Port Authority (LPA)
Port authority provides infrastructure but private terminal operators lease and operate terminals over the long term, and invest in equipment.
Source: Drewry Maritime Advisors
In recent years, there is a gradual movement towards acceptance of ‘landlord port model,’ with granting of certain terminal concessions and of other port-related services in some of the major ports. The landlord port model is designed with a view to decreasing the investment costs for port operators, thereby making the port attractive for additional operators as well. Terminal handling charges could then be lowered, which is beneficial to the port users.
IssuesrelatedtoPPPinPorts
1. Many of the public private partnership projects in the port sector have faced delays on account of various factors primarily including environmental clearances, security clearance, litigation leading to extended bidding process;
2. Poor project structuring resulting in weak response from potential developers;
3. Ministry has also given targets to all the ports for the dredging work to achieve a draft of 12 metre presently many projects are not coming up as per schedule;
4. The risk allocation in PPP is largely loaded against private parties.
ActionpointsforsuccessfulimplementationofPPPframework
i. Government of India should further strengthen the PPP framework and streamline the approval process, to attract greater private sector participation in port infrastructure.
ii. Do upfront complete due diligence along with statuary clearances before awarding the project. For such project investors may be ready to pay a premium as it reduces project risk and gestation period.
iii. The tariff fixing methodology under the TAMP had a negative impact on the profitability and returns of PPP project developers due to several factors. There is a need for port regulator for all ports for setting, monitoring, and regulating the service levels.
iv. With increasing completion more flexibility and freedom for tariff setting to ensure attractive returns for the investors.
v. Autonomy to major ports is a possible step, to facilitate faster implementation of PPP projects.
vi. Focus on corporatization of major ports.
vii. Developing risk reward matrix to appropriately device model for awarding PPP projects as investors would have varied risk appetite for different projects.
viii. Removing restriction for existing private operator to participate in PPP projects where there are two or more than two operators, on the same cargo.
Indi
an C
onta
iner
Tra
de A
naly
sis
Con
tain
er p
ort c
apac
ity in
Indi
a
1918
Indian Container Trade AnalysisAnAlysis
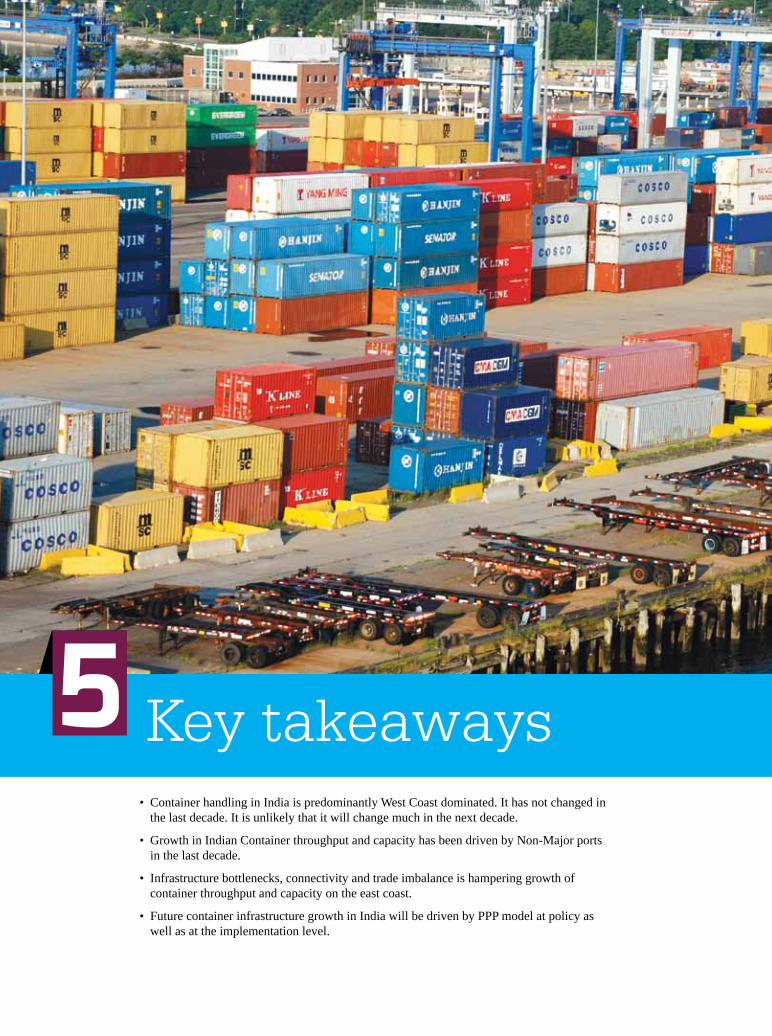
IndIanContainerTradeKey takeaways5
• Container handling in India is predominantly West Coast dominated. It has not changed in the last decade. It is unlikely that it will change much in the next decade.
• Growth in Indian Container throughput and capacity has been driven by Non-Major ports in the last decade.
• Infrastructure bottlenecks, connectivity and trade imbalance is hampering growth of container throughput and capacity on the east coast.
• Future container infrastructure growth in India will be driven by PPP model at policy as well as at the implementation level.
Indian Container Trade AnalysisAnAlysis
IndIanContainerTrade