Embed Size (px)
Citation preview

RESEARCH
India Real EstateOFFICE MARKET - JANUARY - JUNE 2021
knig
htfra
nk.c
o.in
/res
earc
h
www.knightfrank.co.in/research
Mumbai HOKnight Frank (India) Pvt. Ltd.Paville House, Near Twin Towers,Off. Veer Savarkar Marg, Prabhadevi, Mumbai 400 025, IndiaTel: 022 6745 0101 / 4928 0101;
BengaluruKnight Frank (India) Pvt. Ltd.204 & 205, 2nd Floor, Embassy Square, #148 Infantry Road, Bengaluru 560001, IndiaTel: 080 40732600 / 22385515
PuneKnight Frank (India) Pvt. Ltd.Unit No.701, Level 7, Pentagon Towers P4, Magarpatta City, Hadapsar,Pune 411 013, IndiaTel: 020 67491500 / 30188500;
ChennaiKnight Frank (India) Pvt. Ltd.1st Floor, Centre block, Sunny Side, 8/17, Shafee Mohammed Road, Nungambakkam, Chennai 600 006, IndiaTel: 044 4296 9000
GurgaonKnight Frank (India) Pvt. Ltd.Office Address: 1505-1508, 15th Floor, Tower B,Signature Towers South City 1,Gurgaon 122 001, IndiaTel: 0124 4782700;
HyderabadKnight Frank (India) Pvt. Ltd.Western Dallas Centre, 5th floor, Office #3, Hyderabad Knowledge City,Survey No. 83/1, Raidurg, Serilingampally Mandal, Ranga Reddy District, Telangana Hyderabad - 500032Tel: 040 44554141;
KolkataKnight Frank (India) Pvt. Ltd.PS Srijan Corporate Park Unit Number – 1202A, 12th Floor,Block – EP & GP, Plot Number - GP 2,Sector – V, Salt Lake, Kolkata 700 091, IndiaTel: 033 66521000
Ahmedabad Knight Frank (India) Pvt. Ltd.Unit Nos. 407 & 408, Block ‘C’, The First,B/H Keshav Baugh Party Plot, Vastrapur, Ahmedabad – 380015Tel: 079 48940259/ 40380259
A L L I N D I A A H M E D A B A D B E N G A L U R U
PA G E N O. . . . . . . . . . . . . . . . . . . . . . . . . . 0 8
PA G E N O. . . . . . . . . . . . . . . . . . . . . . . . . . 2 8
PA G E N O. . . . . . . . . . . . . . . . . . . . . . . . . . 1 3 PA G E N O. . . . . . . . . . . . . . . . . . . . . . . . . . 1 8
PA G E N O. . . . . . . . . . . . . . . . . . . . . . . . . . 3 3 PA G E N O. . . . . . . . . . . . . . . . . . . . . . . . . . 2 3
PA G E N O. . . . . . . . . . . . . . . . . . . . . . . . . . 3 9 PA G E N O. . . . . . . . . . . . . . . . . . . . . . . . . . 4 5 PA G E N O. . . . . . . . . . . . . . . . . . . . . . . . . . 5 1
H Y D E R A B A D K O L K A T AC H E N N A I
M U M B A I N C R P U N E
C O N T E N T S

I N D I A R E A L E S TAT E4
I N D I A R E A L E S TAT E5
The intensity of COVID-19 infections has been the primary bellwether for the economy and the real estate markets across India since the beginning of 2020. There was a standstill in activities when the pandemic and consequent nationwide lockdown first hit the nation. However, post the first wave and with easing of the stringent lockdown, we saw that the real estate sector made a strong comeback.
The pandemic second wave this year was more severe than the first one. Unfortunately, we lost many human lives. However, with better awareness and understanding of the virus, mass vaccination drives and preparedness to work with restricted mobility, businesses and households alike saw a relatively better economic momentum this time. Seen in this light, the severe second wave, at worst, served as a temporary blip.
On the commercial real estate front, office sector recorded a better performance during the second wave impacted Q2 2021 compared to the first wave seen in Q2 2020. Transactions across the markets under coverage grew by 39% YoY in the latest quarter despite severely restrictions on workforce mobility. Cumulatively, in H1 2021, transactions were down by 29% YoY when compared to pre pandemic levels. Going forward, with rapid vaccination progress and economic aspirations to return to normality, we are likely to see improved activity levels once important vaccination milestones are achieved. The Information Technology sector continued to hire employees amid this prolonged pandemic, and this creates a strong potential for office space once normalcy returns.
I am glad to share the 15th edition of our flagship half-yearly report ‘India Real Estate’. The report captures key developments in the office sector across top 8 cities in the country. I hope you find that this edition provides an encouraging connect with the market. Wishing you and your loved ones a safe and healthy life.
F O R E W O R D
S H I S H I R B A I J A LC H A I R M A N A N D M A N A G I N G D I R E C TO RK N I G H T F R A N K ( I N D I A ) P V T. LT D.

I N D I A R E A L E S TAT E6
PICK-UP IN CONSUMPTION: KEY TO ECONOMIC REVIVALThe Indian economy had started to recover from the first wave of pandemic before it got
hit by a second wave in March 2021. The lockdown imposed during the second wave was regional in nature and less restrictive. Hence, the immediate economic impact has been
relatively less severe. However, the damage to health and life in the second wave has been brutal, resulting in deeper scarring of consumer sentiments.
R A J A N I S I N H AC H I E F E C O N O M I S T & N AT I O N A L D I R E C TO R
R E S E A R C H
I N D I A R E A L E S TAT E7
With the second wave of infection on a downward trajectory,
economic activity is again gathering momentum. The ongoing
immunization is also providing comfort in the current opening up
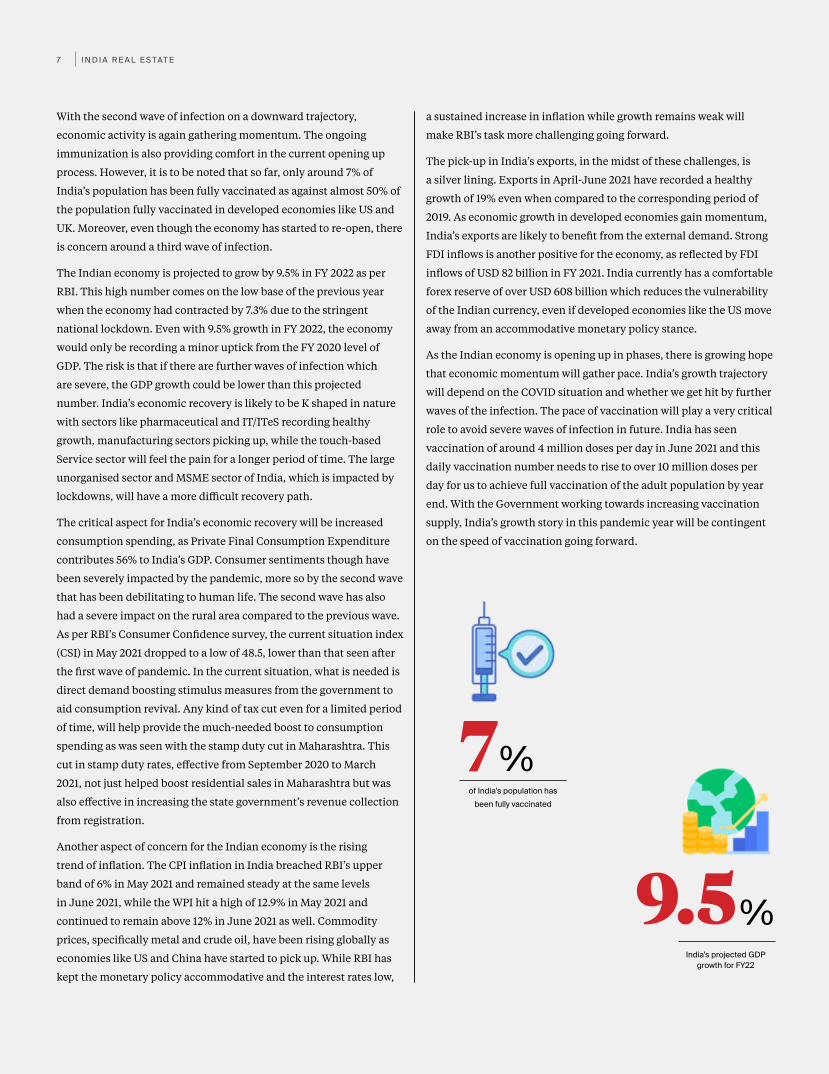
process. However, it is to be noted that so far, only around 7% of
India’s population has been fully vaccinated as against almost 50% of
the population fully vaccinated in developed economies like US and
UK. Moreover, even though the economy has started to re-open, there
is concern around a third wave of infection.
The Indian economy is projected to grow by 9.5% in FY 2022 as per
RBI. This high number comes on the low base of the previous year
when the economy had contracted by 7.3% due to the stringent
national lockdown. Even with 9.5% growth in FY 2022, the economy
would only be recording a minor uptick from the FY 2020 level of
GDP. The risk is that if there are further waves of infection which
are severe, the GDP growth could be lower than this projected
number. India’s economic recovery is likely to be K shaped in nature
with sectors like pharmaceutical and IT/ITeS recording healthy
growth, manufacturing sectors picking up, while the touch-based
Service sector will feel the pain for a longer period of time. The large
unorganised sector and MSME sector of India, which is impacted by
lockdowns, will have a more difficult recovery path.
The critical aspect for India’s economic recovery will be increased
consumption spending, as Private Final Consumption Expenditure
contributes 56% to India’s GDP. Consumer sentiments though have
been severely impacted by the pandemic, more so by the second wave
that has been debilitating to human life. The second wave has also
had a severe impact on the rural area compared to the previous wave.
As per RBI’s Consumer Confidence survey, the current situation index
(CSI) in May 2021 dropped to a low of 48.5, lower than that seen after
the first wave of pandemic. In the current situation, what is needed is
direct demand boosting stimulus measures from the government to
aid consumption revival. Any kind of tax cut even for a limited period
of time, will help provide the much-needed boost to consumption
spending as was seen with the stamp duty cut in Maharashtra. This
cut in stamp duty rates, effective from September 2020 to March
2021, not just helped boost residential sales in Maharashtra but was
also effective in increasing the state government’s revenue collection
from registration.
Another aspect of concern for the Indian economy is the rising
trend of inflation. The CPI inflation in India breached RBI’s upper
band of 6% in May 2021 and remained steady at the same levels
in June 2021, while the WPI hit a high of 12.9% in May 2021 and
continued to remain above 12% in June 2021 as well. Commodity
prices, specifically metal and crude oil, have been rising globally as
economies like US and China have started to pick up. While RBI has
kept the monetary policy accommodative and the interest rates low,
a sustained increase in inflation while growth remains weak will
make RBI’s task more challenging going forward.
The pick-up in India’s exports, in the midst of these challenges, is
a silver lining. Exports in April-June 2021 have recorded a healthy
growth of 19% even when compared to the corresponding period of
2019. As economic growth in developed economies gain momentum,
India’s exports are likely to benefit from the external demand. Strong
FDI inflows is another positive for the economy, as reflected by FDI
inflows of USD 82 billion in FY 2021. India currently has a comfortable
forex reserve of over USD 608 billion which reduces the vulnerability
of the Indian currency, even if developed economies like the US move
away from an accommodative monetary policy stance.
As the Indian economy is opening up in phases, there is growing hope
that economic momentum will gather pace. India’s growth trajectory
will depend on the COVID situation and whether we get hit by further
waves of the infection. The pace of vaccination will play a very critical
role to avoid severe waves of infection in future. India has seen
vaccination of around 4 million doses per day in June 2021 and this
daily vaccination number needs to rise to over 10 million doses per
day for us to achieve full vaccination of the adult population by year
end. With the Government working towards increasing vaccination
supply, India’s growth story in this pandemic year will be contingent
on the speed of vaccination going forward.
7
9.5
of India’s population has been fully vaccinated
India’s projected GDP growth for FY22
%
%

I N D I A R E A L E S TAT E - I N D I A8
INDIA
I N D I A R E A L E S TAT E - I N D I A9
O F F I C E M A R K E T
The impact of second wave of the pandemic in Q2 2021 has
not been as pronounced as that of the first wave in Q2 2020.
However, the office market has been more affected by the
pandemic compared to the residential market that is seeing
a sustained resurgence in demand. The outperformance of
the IT sector and the strong hiring it witnessed during the
pandemic holds the potential for office demand once a return
to workplace occurs as vaccination milestones are achieved.
The progress in employee vaccinations and the extent of
improvement in corporate earnings hold the key to a return to
the office and a resumption of expansion plans.
YA S H W I N B A N G E R A
Expert Take
INDIA MARKET SUMMARY
PARAMETER 2020 CHANGE (YOY) H1 2020 H1 2021 CHANGE (YOY)
Completions mn sq m (mn sq ft)
3.30 (35.5) -42% 1.71 (18.4) 1.39 (15.0) -18%
Transactions mn sq m (mn sq ft)
3.66 (39.4) -35% 1.60 (17.2) 1.14 (12.3) -29%
Stock mn sq m (mn sq ft) 73.52 (791.4) 5% 71.93 (774.2) 74.92 (806.4) 4%
Vacancy (%) 15.4% 14.2% 16.6% -
Source: Knight Frank Research
I N D I A R E A L E S TAT E - I N D I A1 0
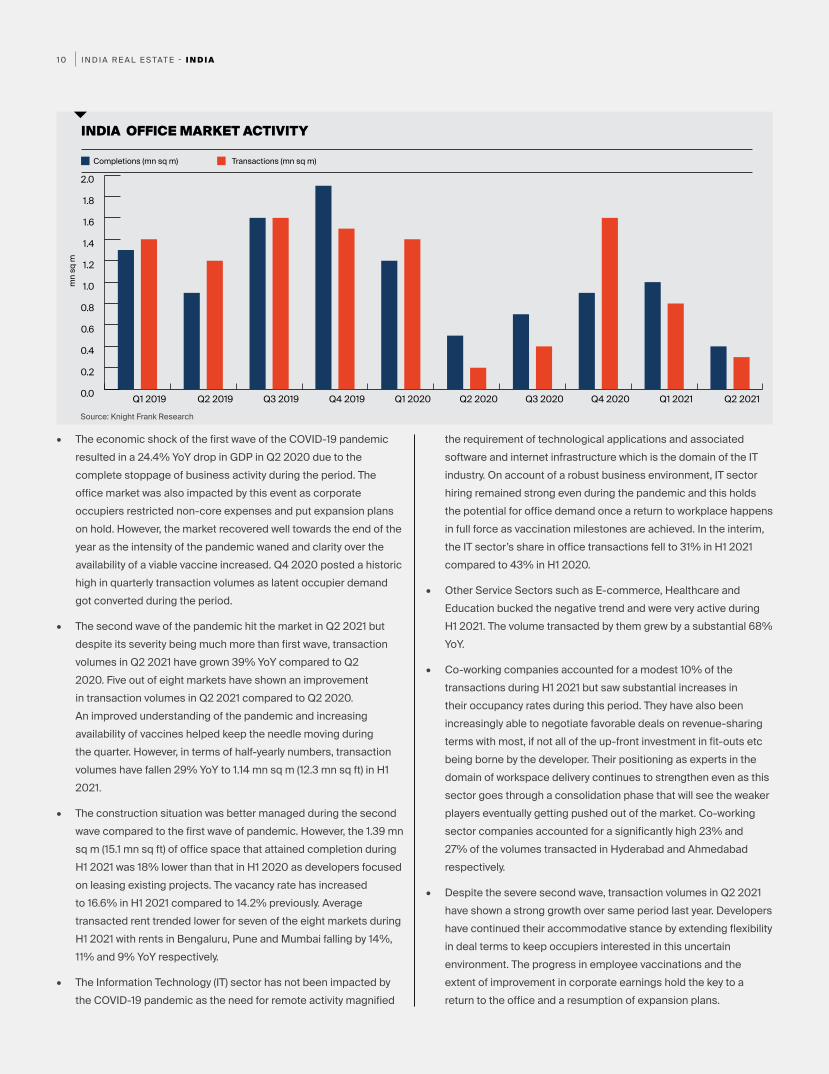
• The economic shock of the first wave of the COVID-19 pandemic resulted in a 24.4% YoY drop in GDP in Q2 2020 due to the complete stoppage of business activity during the period. The office market was also impacted by this event as corporate occupiers restricted non-core expenses and put expansion plans on hold. However, the market recovered well towards the end of the year as the intensity of the pandemic waned and clarity over the availability of a viable vaccine increased. Q4 2020 posted a historic high in quarterly transaction volumes as latent occupier demand got converted during the period.
• The second wave of the pandemic hit the market in Q2 2021 but despite its severity being much more than first wave, transaction volumes in Q2 2021 have grown 39% YoY compared to Q2 2020. Five out of eight markets have shown an improvement in transaction volumes in Q2 2021 compared to Q2 2020. An improved understanding of the pandemic and increasing availability of vaccines helped keep the needle moving during the quarter. However, in terms of half-yearly numbers, transaction volumes have fallen 29% YoY to 1.14 mn sq m (12.3 mn sq ft) in H1 2021.
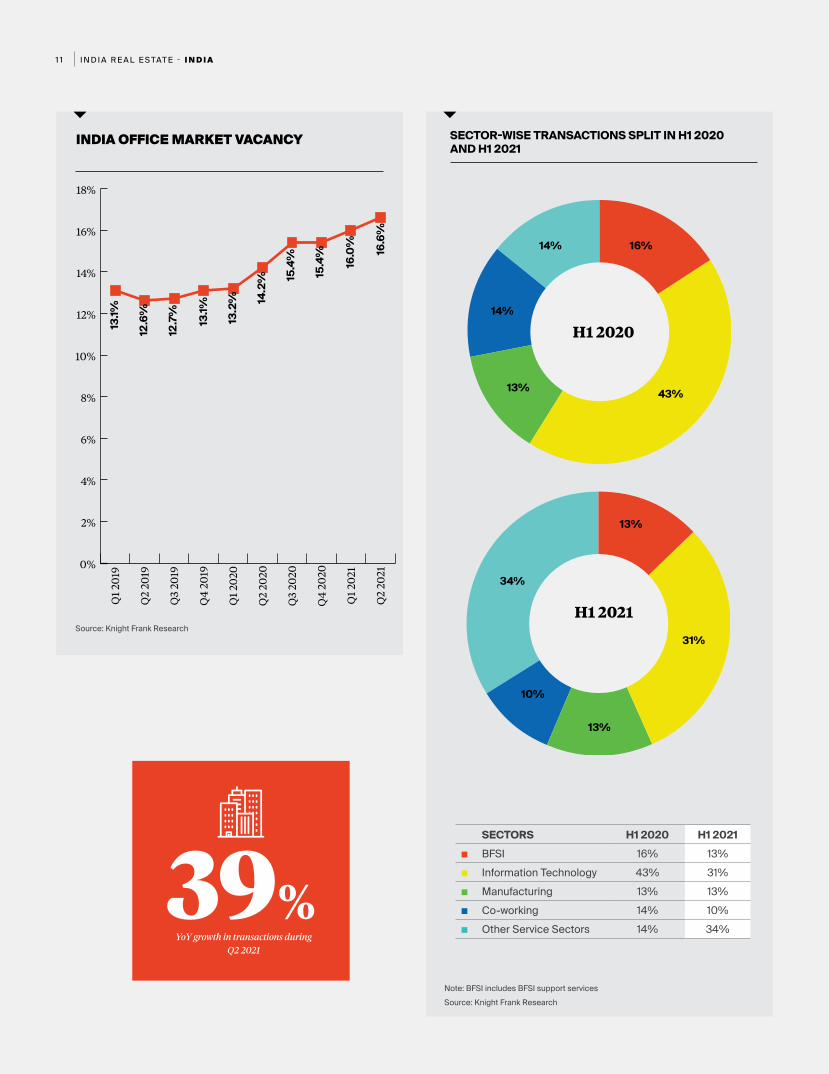
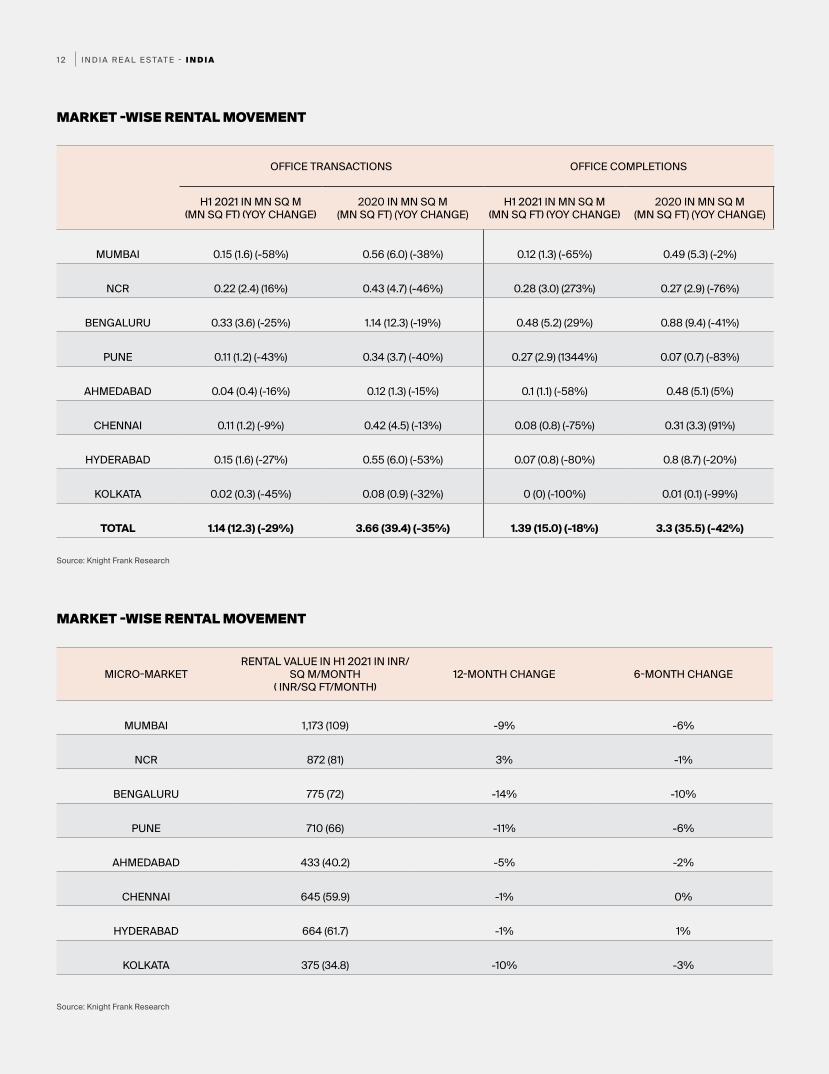
• The construction situation was better managed during the second wave compared to the first wave of pandemic. However, the 1.39 mn sq m (15.1 mn sq ft) of office space that attained completion during H1 2021 was 18% lower than that in H1 2020 as developers focused on leasing existing projects. The vacancy rate has increased to 16.6% in H1 2021 compared to 14.2% previously. Average transacted rent trended lower for seven of the eight markets during H1 2021 with rents in Bengaluru, Pune and Mumbai falling by 14%, 11% and 9% YoY respectively.
• The Information Technology (IT) sector has not been impacted by the COVID-19 pandemic as the need for remote activity magnified
the requirement of technological applications and associated software and internet infrastructure which is the domain of the IT industry. On account of a robust business environment, IT sector hiring remained strong even during the pandemic and this holds the potential for office demand once a return to workplace happens in full force as vaccination milestones are achieved. In the interim, the IT sector’s share in office transactions fell to 31% in H1 2021 compared to 43% in H1 2020.
• Other Service Sectors such as E-commerce, Healthcare and Education bucked the negative trend and were very active during H1 2021. The volume transacted by them grew by a substantial 68% YoY.
• Co-working companies accounted for a modest 10% of the transactions during H1 2021 but saw substantial increases in their occupancy rates during this period. They have also been increasingly able to negotiate favorable deals on revenue-sharing terms with most, if not all of the up-front investment in fit-outs etc being borne by the developer. Their positioning as experts in the domain of workspace delivery continues to strengthen even as this sector goes through a consolidation phase that will see the weaker players eventually getting pushed out of the market. Co-working sector companies accounted for a significantly high 23% and 27% of the volumes transacted in Hyderabad and Ahmedabad respectively.
• Despite the severe second wave, transaction volumes in Q2 2021 have shown a strong growth over same period last year. Developers have continued their accommodative stance by extending flexibility in deal terms to keep occupiers interested in this uncertain environment. The progress in employee vaccinations and the extent of improvement in corporate earnings hold the key to a return to the office and a resumption of expansion plans.
Completions (mn sq m) Transactions (mn sq m)
INDIA OFFICE MARKET ACTIVITY
Source: Knight Frank Research
mn
sq m
0.0
0.2
0.4
0.6
0.8
1.0
1.2
1.4
1.6
1.8
2.0
Q2 2021Q1 2021Q4 2020Q3 2020Q2 2020Q1 2020Q4 2019Q3 2019Q2 2019Q1 2019
I N D I A R E A L E S TAT E - I N D I A1 1
SECTOR-WISE TRANSACTIONS SPLIT IN H1 2020 AND H1 2021
SECTORS H1 2020 H1 2021■ BFSI 16% 13%■ Information Technology 43% 31%■ Manufacturing 13% 13%■ Co-working 14% 10%■ Other Service Sectors 14% 34%
H1 2020
H1 2021
43%
13%
31%
13%
10%
34%
16%
13%
14%
14%
Source: Knight Frank ResearchNote: BFSI includes BFSI support services
Source: Knight Frank Research
INDIA OFFICE MARKET VACANCY
0%
2%
4%
6%
8%
10%
12%
14%
16%
18%
Q2
2021
Q1
2021
Q4
2020
Q3
2020
Q2
2020
Q1
2020
Q4
2019
Q3
2019
Q2
2019
Q1
2019
39%YoY growth in transactions during
Q2 2021
13.1%
12.6
%
12.7
%
13.1%
13.2
% 14.2
% 15.4
%
15.4
%
16.0
%
16.6
%
I N D I A R E A L E S TAT E - I N D I A1 2
MICRO-MARKETRENTAL VALUE IN H1 2021 IN INR/
SQ M/MONTH ( INR/SQ FT/MONTH)
12-MONTH CHANGE 6-MONTH CHANGE
MUMBAI 1,173 (109) -9% -6%
NCR 872 (81) 3% -1%
BENGALURU 775 (72) -14% -10%
PUNE 710 (66) -11% -6%
AHMEDABAD 433 (40.2) -5% -2%
CHENNAI 645 (59.9) -1% 0%
HYDERABAD 664 (61.7) -1% 1%
KOLKATA 375 (34.8) -10% -3%
OFFICE TRANSACTIONS OFFICE COMPLETIONS
H1 2021 IN MN SQ M (MN SQ FT) (YOY CHANGE)
2020 IN MN SQ M (MN SQ FT) (YOY CHANGE)
H1 2021 IN MN SQ M (MN SQ FT) (YOY CHANGE)
2020 IN MN SQ M (MN SQ FT) (YOY CHANGE)
MUMBAI 0.15 (1.6) (-58%) 0.56 (6.0) (-38%) 0.12 (1.3) (-65%) 0.49 (5.3) (-2%)
NCR 0.22 (2.4) (16%) 0.43 (4.7) (-46%) 0.28 (3.0) (273%) 0.27 (2.9) (-76%)
BENGALURU 0.33 (3.6) (-25%) 1.14 (12.3) (-19%) 0.48 (5.2) (29%) 0.88 (9.4) (-41%)
PUNE 0.11 (1.2) (-43%) 0.34 (3.7) (-40%) 0.27 (2.9) (1344%) 0.07 (0.7) (-83%)
AHMEDABAD 0.04 (0.4) (-16%) 0.12 (1.3) (-15%) 0.1 (1.1) (-58%) 0.48 (5.1) (5%)
CHENNAI 0.11 (1.2) (-9%) 0.42 (4.5) (-13%) 0.08 (0.8) (-75%) 0.31 (3.3) (91%)
HYDERABAD 0.15 (1.6) (-27%) 0.55 (6.0) (-53%) 0.07 (0.8) (-80%) 0.8 (8.7) (-20%)
KOLKATA 0.02 (0.3) (-45%) 0.08 (0.9) (-32%) 0 (0) (-100%) 0.01 (0.1) (-99%)
TOTAL 1.14 (12.3) (-29%) 3.66 (39.4) (-35%) 1.39 (15.0) (-18%) 3.3 (35.5) (-42%)
MARKET -WISE RENTAL MOVEMENT
MARKET -WISE RENTAL MOVEMENT
Source: Knight Frank Research
Source: Knight Frank Research

I N D I A R E A L E S TAT E - A H M E D A B A D1 3
AHMEDABAD
I N D I A R E A L E S TAT E - A H M E D A B A D1 4
O F F I C E M A R K E T
The second wave of COVID-19 infections has put corporate
expansion plans on hold. The office market rent continues
to correct, as occupier demand falters after a brief recovery
in H2 2020. The vacancy level rose to 46% as office
development continued unabated in H1 2021.
YA S H W I N B A N G E R A
Expert Take
AHMEDABAD MARKET SUMMARY
PARAMETER 2020 CHANGE (YOY) H1 2020 H1 2021 CHANGE (YOY)
Completions mn sq m (mn sq ft)
0.48 (5.1) 5% 0.24 (2.6) 0.10 (1.1) -58%
Transactions mn sq m (mn sq ft)
0.12 (1.3) -15% 0.05 (0.5) 0.04 (0.4) -16%
Average transacted rent INR/sq m/month (INR/sq ft/month)
442 (41) -4% 454 (42) 433 (40) -5%
Stock mn sq m (mn sq ft) 2.9 (31.5) 19% 2.7 (29) 3.0 (32.6) 12%
Vacancy (%) 45.2% 45.6% 45.8% -
Source: Knight Frank Research
I N D I A R E A L E S TAT E - A H M E D A B A D1 5
Completions (mn sq m) Transactions (mn sq m)
AHMEDABAD OFFICE MARKET ACTIVITY
0.00
0.05
0.10
0.15
0.20
0.25
0.30
Q2 2021Q1 2021Q4 2020Q3 2020Q2 2020Q1 2020Q4 2019Q3 2019Q2 2019Q1 2019
Source: Knight Frank Research
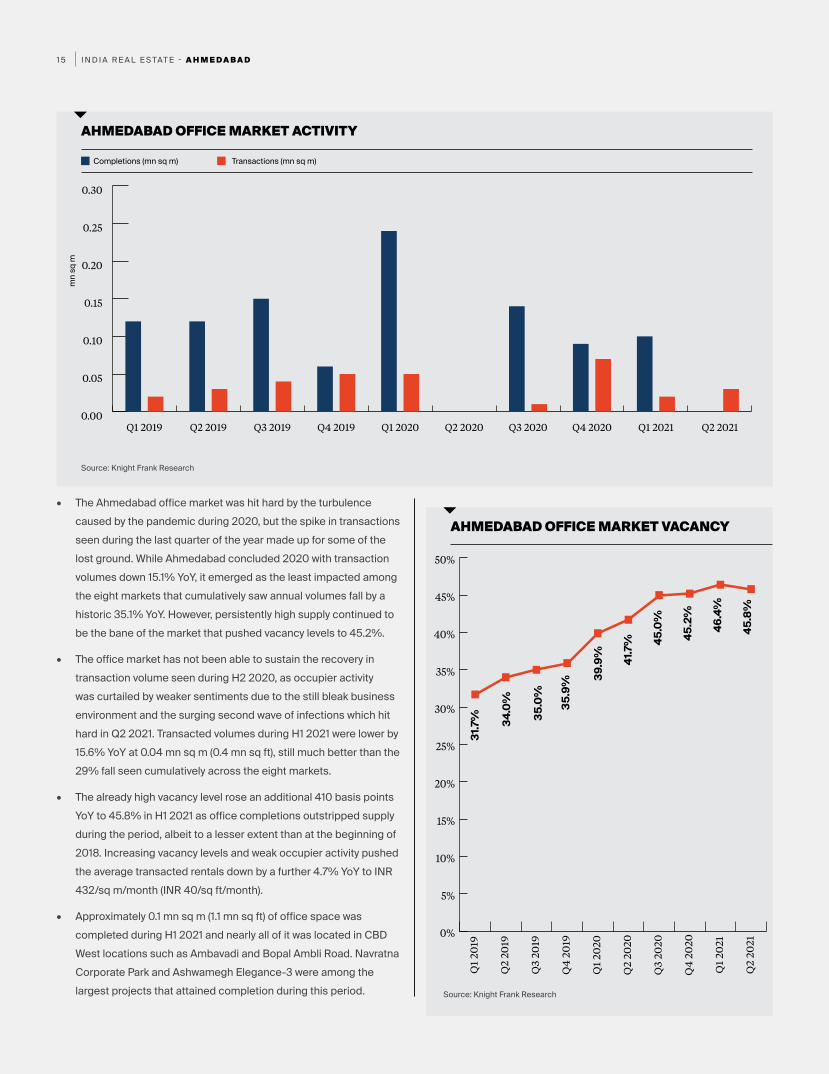
• The Ahmedabad office market was hit hard by the turbulence caused by the pandemic during 2020, but the spike in transactions seen during the last quarter of the year made up for some of the lost ground. While Ahmedabad concluded 2020 with transaction volumes down 15.1% YoY, it emerged as the least impacted among the eight markets that cumulatively saw annual volumes fall by a historic 35.1% YoY. However, persistently high supply continued to be the bane of the market that pushed vacancy levels to 45.2%.
• The office market has not been able to sustain the recovery in transaction volume seen during H2 2020, as occupier activity was curtailed by weaker sentiments due to the still bleak business environment and the surging second wave of infections which hit hard in Q2 2021. Transacted volumes during H1 2021 were lower by 15.6% YoY at 0.04 mn sq m (0.4 mn sq ft), still much better than the 29% fall seen cumulatively across the eight markets.
• The already high vacancy level rose an additional 410 basis points YoY to 45.8% in H1 2021 as office completions outstripped supply during the period, albeit to a lesser extent than at the beginning of 2018. Increasing vacancy levels and weak occupier activity pushed the average transacted rentals down by a further 4.7% YoY to INR 432/sq m/month (INR 40/sq ft/month).
• Approximately 0.1 mn sq m (1.1 mn sq ft) of office space was completed during H1 2021 and nearly all of it was located in CBD West locations such as Ambavadi and Bopal Ambli Road. Navratna Corporate Park and Ashwamegh Elegance-3 were among the largest projects that attained completion during this period.
mn
sq m
AHMEDABAD OFFICE MARKET VACANCY
Source: Knight Frank Research
0%
5%
10%
15%
20%
25%
30%
35%
40%
45%
50%
Q2
2021
Q1
2021
Q4
20
20
Q3
2020
Q2
2020
Q1
2020
Q4
20
19
Q3
2019
Q2
2019
Q1
2019
31.7
% 34.0
%
35.0
%
35.9
% 39.9
% 41.7
% 45.0
%
45.2
%
46.4
%
45.8
%
I N D I A R E A L E S TAT E - A H M E D A B A D1 6
Source: Knight Frank Research
BUSINESS DISTRICT MICRO MARKETS
CBD West Bodakdev, Keshav Baug, Prahladnagar, Satellite, SG Highway, Thaltej
PBD Gandhinagar, GIFT City
CBD Ashram Road, Ellis Bridge, Paldi
BUSINESS DISTRICT CLASSIFICATION
BUSINESS DISTRICT WISE TRANSACTIONS SPLIT IN H1 2020 AND H1 2021
Business district H1 2020 H1 2021■ CBD 5% 3%■ CBD West 87% 93%■ PBD 8% 4%
H1 2020
H1 2021
8%
5%
3%
93%
4%
87%
Source: Knight Frank Research
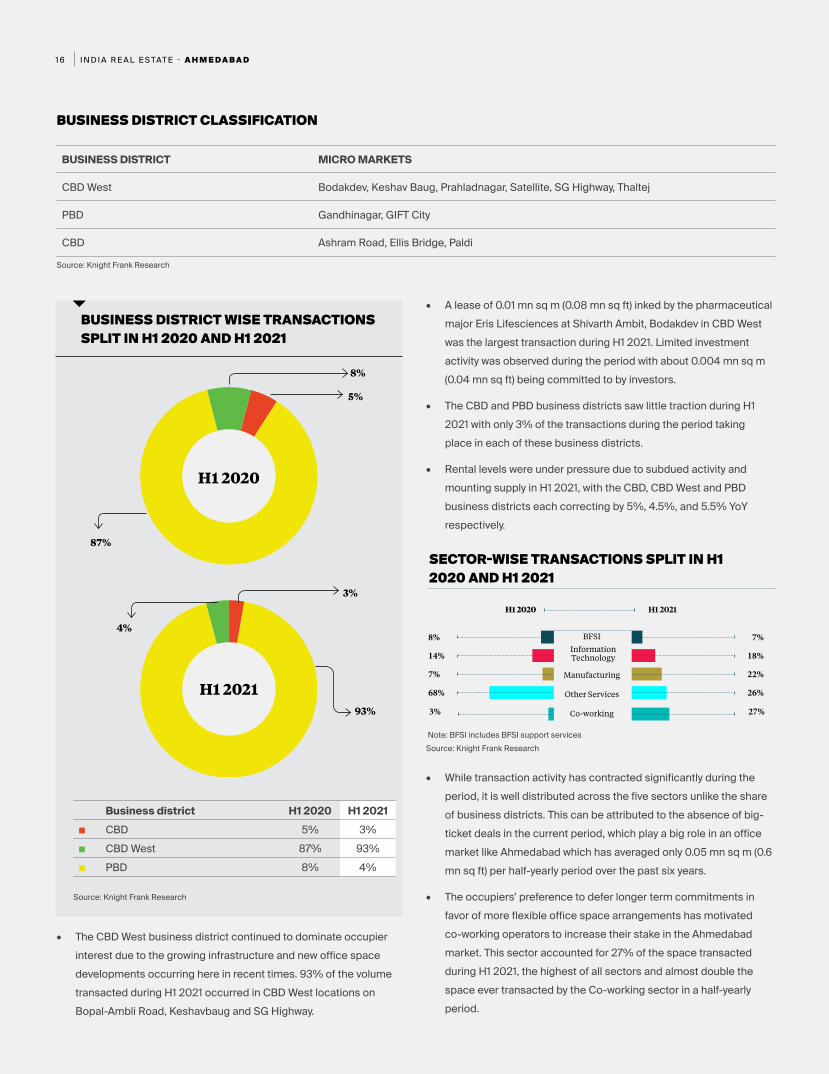
• The CBD West business district continued to dominate occupier interest due to the growing infrastructure and new office space developments occurring here in recent times. 93% of the volume transacted during H1 2021 occurred in CBD West locations on Bopal-Ambli Road, Keshavbaug and SG Highway.
SECTOR-WISE TRANSACTIONS SPLIT IN H1 2020 AND H1 2021
8% 7%
14% 18%
7% 22%
68%
3%
26%
27%
BFSI
Manufacturing
Other Services
Co-working
H1 2020 H1 2021
Note: BFSI includes BFSI support servicesSource: Knight Frank Research
Information Technology
• A lease of 0.01 mn sq m (0.08 mn sq ft) inked by the pharmaceutical major Eris Lifesciences at Shivarth Ambit, Bodakdev in CBD West was the largest transaction during H1 2021. Limited investment activity was observed during the period with about 0.004 mn sq m (0.04 mn sq ft) being committed to by investors.
• The CBD and PBD business districts saw little traction during H1 2021 with only 3% of the transactions during the period taking place in each of these business districts.
• Rental levels were under pressure due to subdued activity and mounting supply in H1 2021, with the CBD, CBD West and PBD business districts each correcting by 5%, 4.5%, and 5.5% YoY respectively.
• While transaction activity has contracted significantly during the period, it is well distributed across the five sectors unlike the share of business districts. This can be attributed to the absence of big-ticket deals in the current period, which play a big role in an office market like Ahmedabad which has averaged only 0.05 mn sq m (0.6 mn sq ft) per half-yearly period over the past six years.
• The occupiers’ preference to defer longer term commitments in favor of more flexible office space arrangements has motivated co-working operators to increase their stake in the Ahmedabad market. This sector accounted for 27% of the space transacted during H1 2021, the highest of all sectors and almost double the space ever transacted by the Co-working sector in a half-yearly period.
I N D I A R E A L E S TAT E - A H M E D A B A D1 7
• Similar to the Co-working sector, the Information Technology (IT) and the Manufacturing sectors have gained in transactions’ share and also in terms of absolute volumes YoY. Of the two sectors, the volume transacted by the Manufacturing sector has increased to a greater extent, growing by 188% YoY to 0.009 mn sq m (0.09 mn sq ft) in H1 2021. Considering that this is the second consecutive period of strong volumes by the Manufacturing sector, we believe that this increase in traction is a positive indication for the market, despite being on a lower base. In addition to FMCG companies, pharmaceutical companies from the Manufacturing sector such as Eris Lifesciences and Unison were active during the period.
• The YoY drop in volume during H1 2021 can be largely attributed to the steep fall in the Other Services sector’s transactions which has taken up just a third of the volume achieved during H1 2020. However, it must be noted that H1 2020 was also an exceptional period for the Other Services sector as it accounted for an extraordinarily high 68% of the transacted volume. This was largely due to one big-ticket lease which amounted to nearly 41% of the total volume transacted during that period. The current 26% share of transaction volume is closer to the sector’s long-term mean share of 27%. Leases were signed by law firms like Amarchand Mangaldas, healthcare players like Shalby Hospitals in premium properties such as Parshwanath Esquare and Mondeal in the CBD West business district.
• The BFSI sector’s share in transactions has marginally reduced from 8% in H1 2020 to 7% in H1 2021. A bulk of these were small leases signed in PBD micro-markets of GIFT City, Mani Nagar and Odhav by companies such as Citibank, Barclays, IDFC and ICICI Lombard.
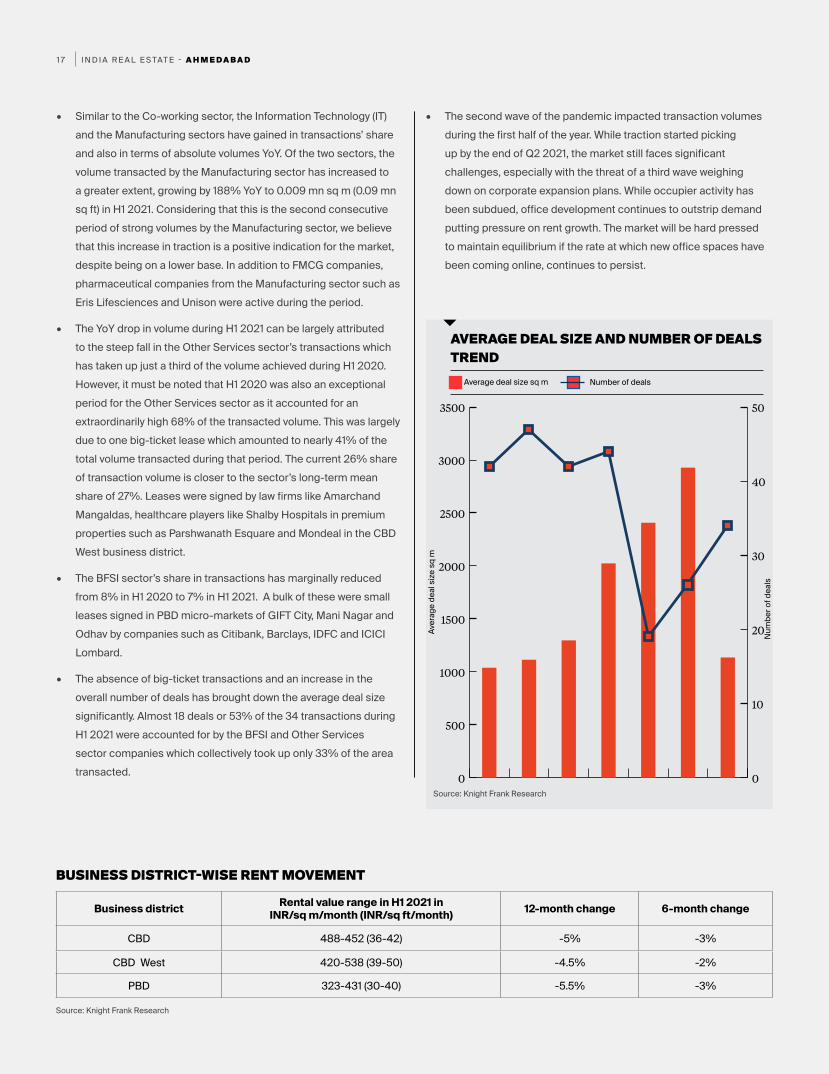
• The absence of big-ticket transactions and an increase in the overall number of deals has brought down the average deal size significantly. Almost 18 deals or 53% of the 34 transactions during H1 2021 were accounted for by the BFSI and Other Services sector companies which collectively took up only 33% of the area transacted.
• The second wave of the pandemic impacted transaction volumes during the first half of the year. While traction started picking up by the end of Q2 2021, the market still faces significant challenges, especially with the threat of a third wave weighing down on corporate expansion plans. While occupier activity has been subdued, office development continues to outstrip demand putting pressure on rent growth. The market will be hard pressed to maintain equilibrium if the rate at which new office spaces have been coming online, continues to persist.
AVERAGE DEAL SIZE AND NUMBER OF DEALS TREND
0
500
1000
1500
2000
2500
3000
3500
H1 2021H2 2020H1 2020H2 2019H1 2019H2 2018H1 20180
10
20
30
40
50
Source: Knight Frank Research
Number of dealsAverage deal size sq m
Num
ber o
f dea
ls
Aver
age
deal
size
sq
m
Business district Rental value range in H1 2021 in INR/sq m/month (INR/sq ft/month) 12-month change 6-month change
CBD 488-452 (36-42) -5% -3%
CBD West 420-538 (39-50) -4.5% -2%
PBD 323-431 (30-40) -5.5% -3%
BUSINESS DISTRICT-WISE RENT MOVEMENT
Source: Knight Frank Research

I N D I A R E A L E S TAT E - B E N G A L U R U1 8
BENGALURU
I N D I A R E A L E S TAT E - B E N G A L U R U1 9
O F F I C E M A R K E T
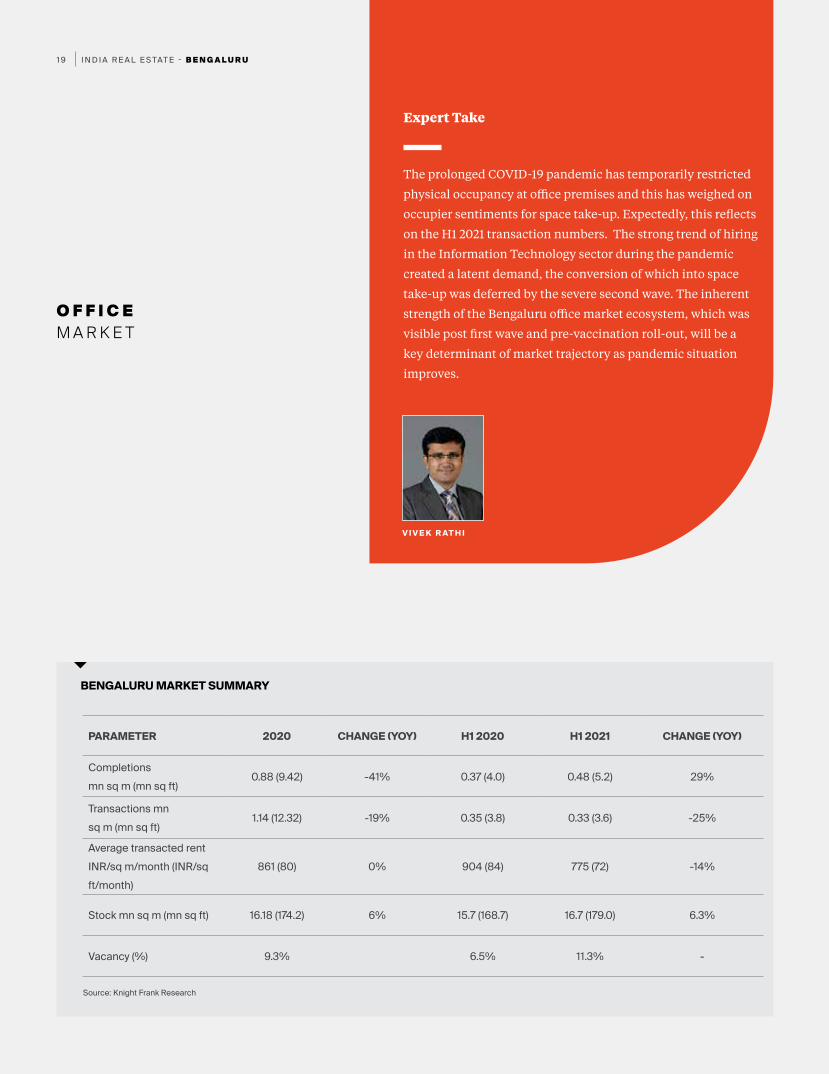
The prolonged COVID-19 pandemic has temporarily restricted
physical occupancy at office premises and this has weighed on
occupier sentiments for space take-up. Expectedly, this reflects
on the H1 2021 transaction numbers. The strong trend of hiring
in the Information Technology sector during the pandemic
created a latent demand, the conversion of which into space
take-up was deferred by the severe second wave. The inherent
strength of the Bengaluru office market ecosystem, which was
visible post first wave and pre-vaccination roll-out, will be a
key determinant of market trajectory as pandemic situation
improves.
V I V E K R AT H I
Expert Take
BENGALURU MARKET SUMMARY
PARAMETER 2020 CHANGE (YOY) H1 2020 H1 2021 CHANGE (YOY)
Completions mn sq m (mn sq ft)
0.88 (9.42) -41% 0.37 (4.0) 0.48 (5.2) 29%
Transactions mn sq m (mn sq ft)
1.14 (12.32) -19% 0.35 (3.8) 0.33 (3.6) -25%
Average transacted rent INR/sq m/month (INR/sq ft/month)
861 (80) 0% 904 (84) 775 (72) -14%
Stock mn sq m (mn sq ft) 16.18 (174.2) 6% 15.7 (168.7) 16.7 (179.0) 6.3%
Vacancy (%) 9.3% 6.5% 11.3% -
Source: Knight Frank Research
I N D I A R E A L E S TAT E - B E N G A L U R U2 0
Completions (mn sq m) Transactions (mn sq m)
BENGALURU OFFICE MARKET ACTIVITY
0.0
0.1
0.2
0.3
0.4
0.5
0.6
0.7
Q2 2021Q1 2021Q4 2020Q3 2020Q2 2020Q1 2020Q4 2019Q3 2019Q2 2019Q1 2019
Source: Knight Frank Research
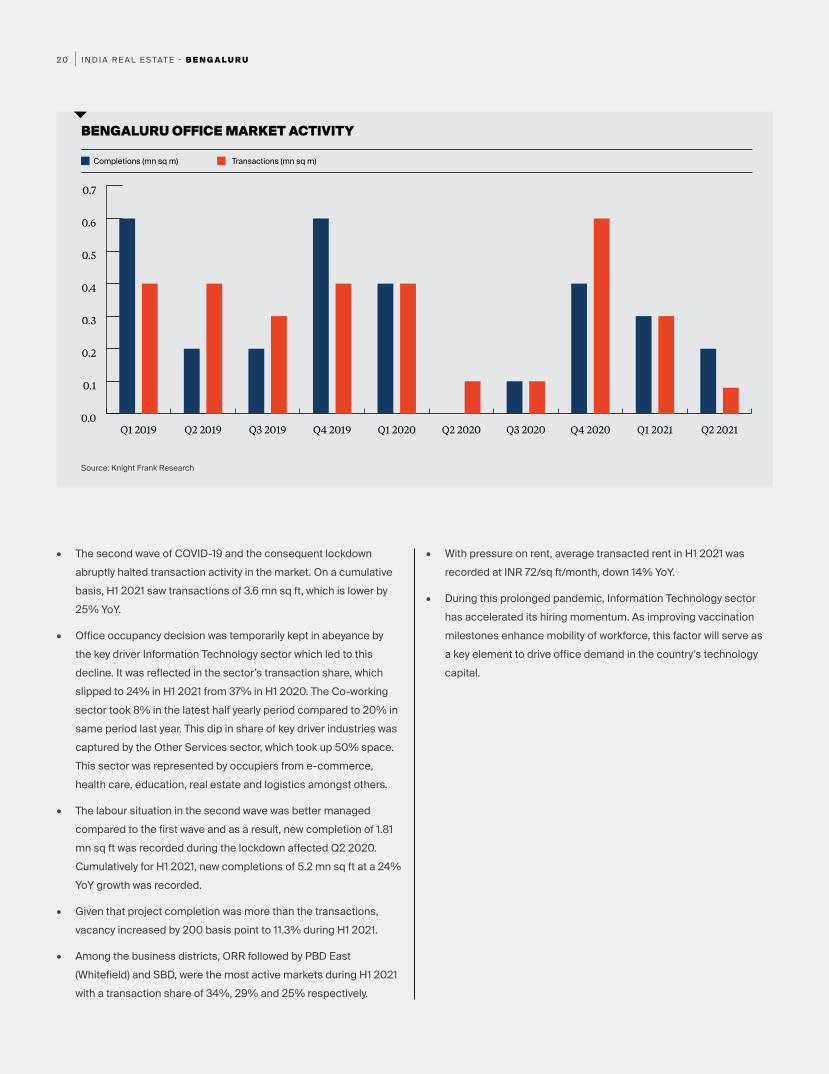
• The second wave of COVID-19 and the consequent lockdown abruptly halted transaction activity in the market. On a cumulative basis, H1 2021 saw transactions of 3.6 mn sq ft, which is lower by 25% YoY.
• Office occupancy decision was temporarily kept in abeyance by the key driver Information Technology sector which led to this decline. It was reflected in the sector’s transaction share, which slipped to 24% in H1 2021 from 37% in H1 2020. The Co-working sector took 8% in the latest half yearly period compared to 20% in same period last year. This dip in share of key driver industries was captured by the Other Services sector, which took up 50% space. This sector was represented by occupiers from e-commerce, health care, education, real estate and logistics amongst others.
• The labour situation in the second wave was better managed compared to the first wave and as a result, new completion of 1.81 mn sq ft was recorded during the lockdown affected Q2 2020. Cumulatively for H1 2021, new completions of 5.2 mn sq ft at a 24% YoY growth was recorded.
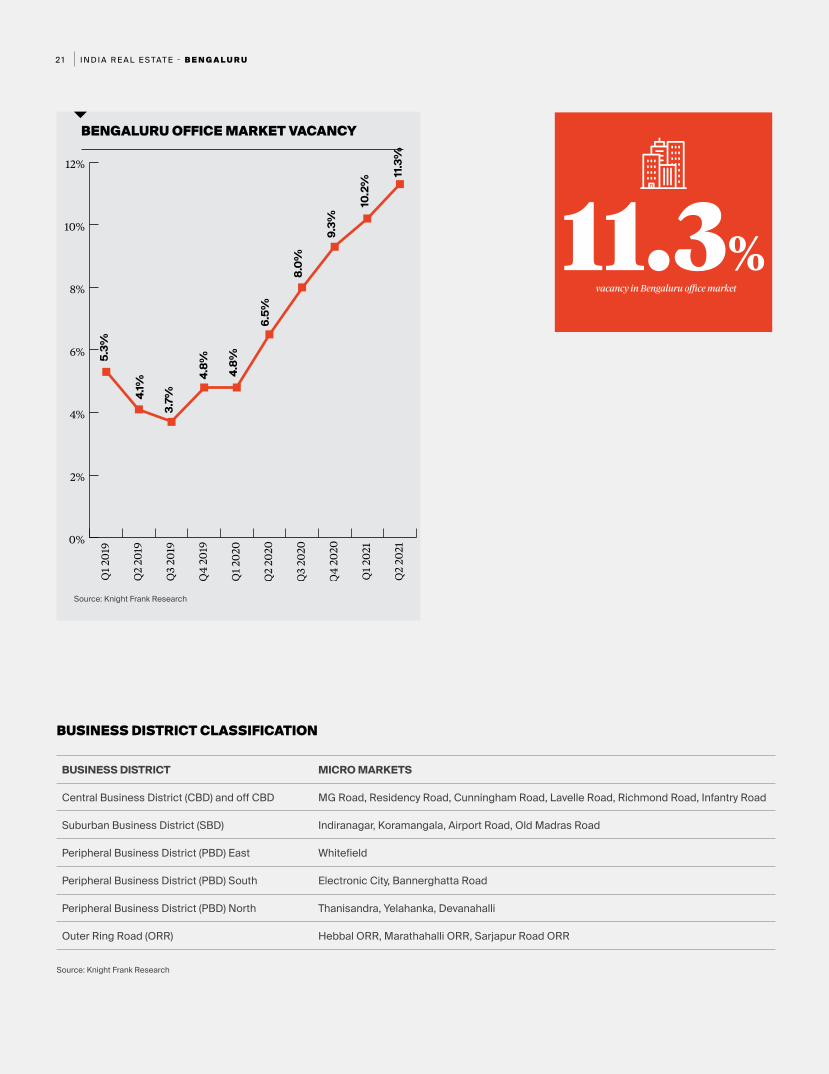
• Given that project completion was more than the transactions, vacancy increased by 200 basis point to 11.3% during H1 2021.
• Among the business districts, ORR followed by PBD East (Whitefield) and SBD, were the most active markets during H1 2021 with a transaction share of 34%, 29% and 25% respectively.
• With pressure on rent, average transacted rent in H1 2021 was recorded at INR 72/sq ft/month, down 14% YoY.
• During this prolonged pandemic, Information Technology sector has accelerated its hiring momentum. As improving vaccination milestones enhance mobility of workforce, this factor will serve as a key element to drive office demand in the country’s technology capital.
I N D I A R E A L E S TAT E - B E N G A L U R U2 1
BENGALURU OFFICE MARKET VACANCY
Source: Knight Frank Research
Source: Knight Frank Research
BUSINESS DISTRICT MICRO MARKETS
Central Business District (CBD) and off CBD MG Road, Residency Road, Cunningham Road, Lavelle Road, Richmond Road, Infantry Road
Suburban Business District (SBD) Indiranagar, Koramangala, Airport Road, Old Madras Road
Peripheral Business District (PBD) East Whitefield
Peripheral Business District (PBD) South Electronic City, Bannerghatta Road
Peripheral Business District (PBD) North Thanisandra, Yelahanka, Devanahalli
Outer Ring Road (ORR) Hebbal ORR, Marathahalli ORR, Sarjapur Road ORR
BUSINESS DISTRICT CLASSIFICATION
0%
2%
4%
6%
8%
10%
12%
Q2
2021
Q1
2021
Q4
2020
Q3
2020
Q2
2020
Q1
2020
Q4
201 9
Q3
2019
Q2
2019
Q1
2019
11.3%vacancy in Bengaluru office market
5.3%
4.1%
3.7%
4.8% 4.8%
6.5%
8.0%
9.3%
10.2
%
11.3
%
I N D I A R E A L E S TAT E - B E N G A L U R U2 2
BUSINESS DISTRICT WISE TRANSACTIONS SPLIT IN H1 2020 AND H1 2021
SECTOR-WISE TRANSACTIONS SPLIT IN H1 2020 AND H1 2021
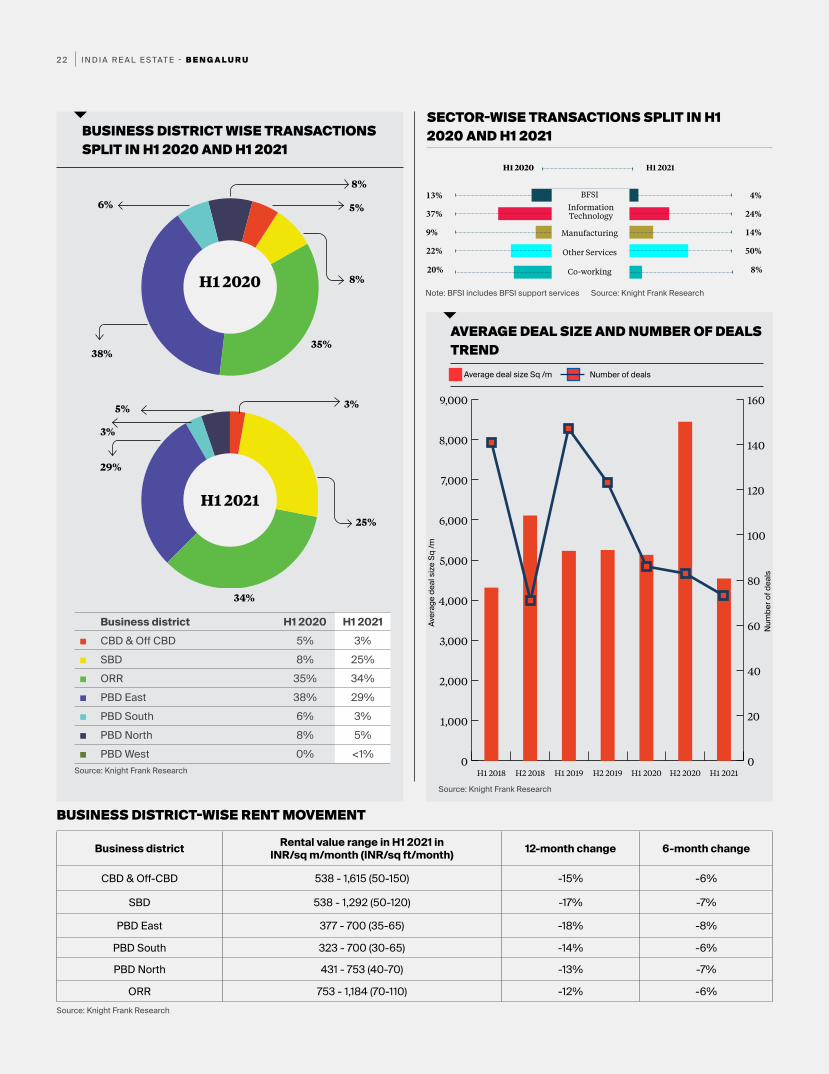
Business district H1 2020 H1 2021■ CBD & Off CBD 5% 3%■ SBD 8% 25%■ ORR 35% 34%■ PBD East 38% 29%■ PBD South 6% 3%■ PBD North 8% 5%■ PBD West 0% <1%
H1 2020
H1 2021
8%
5%
8%
35%
6%
5%
3%
3%
25%
29%
34%
38%
13% 4%
37% 24%
9% 14%
22%
20%
50%
8%
BFSI
Manufacturing
Other Services
Co-working
H1 2020 H1 2021
Note: BFSI includes BFSI support services Source: Knight Frank Research
Source: Knight Frank Research
Source: Knight Frank Research
Information Technology
Business district Rental value range in H1 2021 in INR/sq m/month (INR/sq ft/month) 12-month change 6-month change
CBD & Off-CBD 538 - 1,615 (50-150) -15% -6%
SBD 538 - 1,292 (50-120) -17% -7%
PBD East 377 - 700 (35-65) -18% -8%
PBD South 323 - 700 (30-65) -14% -6%
PBD North 431 - 753 (40-70) -13% -7%
ORR 753 - 1,184 (70-110) -12% -6%
BUSINESS DISTRICT-WISE RENT MOVEMENT
AVERAGE DEAL SIZE AND NUMBER OF DEALS TREND
0
1,000
2,000
3,000
4,000
5,000
6,000
7,000
8,000
9,000
H1 2021H2 2020H1 2020H2 2019H1 2019H2 2018H1 20180
20
40
60
80
100
120
140
160
Source: Knight Frank Research
Number of dealsAverage deal size Sq /m
Num
ber o
f dea
ls
Aver
age
deal
size
Sq
/m

I N D I A R E A L E S TAT E - C H E N N A I2 3
CHENNAI
I N D I A R E A L E S TAT E - C H E N N A I2 4
O F F I C E M A R K E T
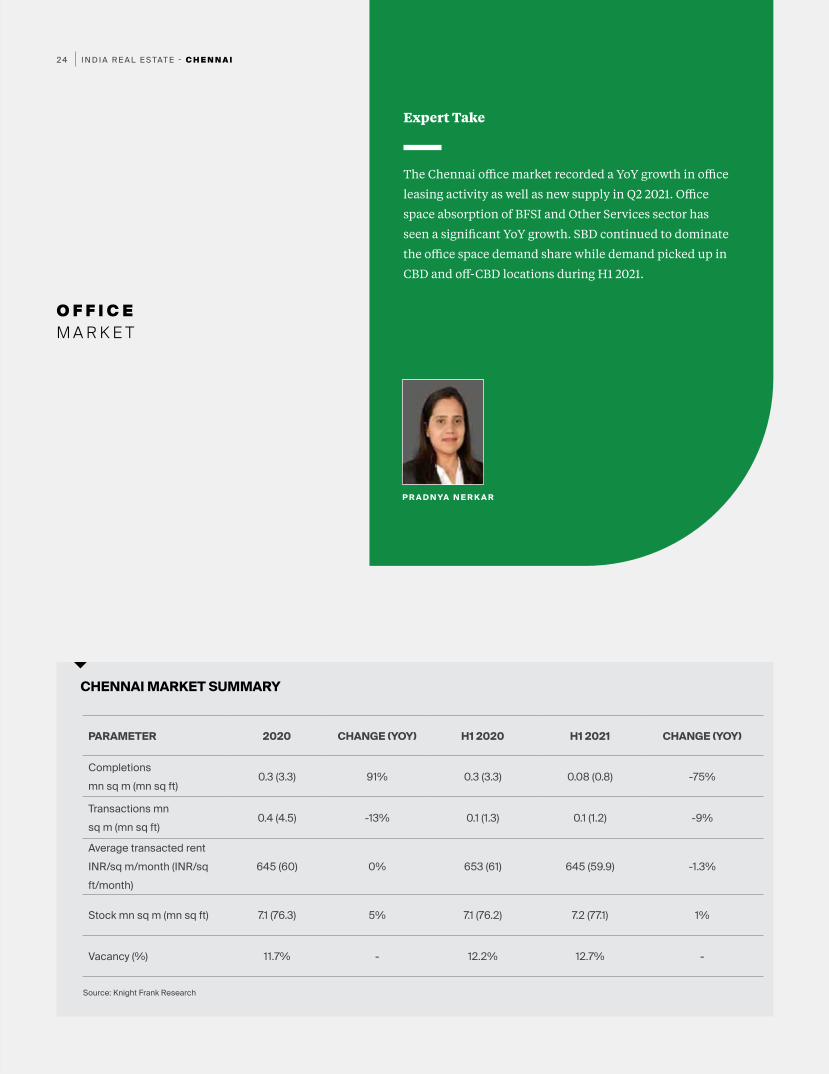
The Chennai office market recorded a YoY growth in office
leasing activity as well as new supply in Q2 2021. Office
space absorption of BFSI and Other Services sector has
seen a significant YoY growth. SBD continued to dominate
the office space demand share while demand picked up in
CBD and off-CBD locations during H1 2021.
P R A D N YA N E R K A R
Expert Take
CHENNAI MARKET SUMMARY
PARAMETER 2020 CHANGE (YOY) H1 2020 H1 2021 CHANGE (YOY)
Completions mn sq m (mn sq ft)
0.3 (3.3) 91% 0.3 (3.3) 0.08 (0.8) -75%
Transactions mn sq m (mn sq ft)
0.4 (4.5) -13% 0.1 (1.3) 0.1 (1.2) -9%
Average transacted rent INR/sq m/month (INR/sq ft/month)
645 (60) 0% 653 (61) 645 (59.9) -1.3%
Stock mn sq m (mn sq ft) 7.1 (76.3) 5% 7.1 (76.2) 7.2 (77.1) 1%
Vacancy (%) 11.7% - 12.2% 12.7% -
Source: Knight Frank Research
I N D I A R E A L E S TAT E - C H E N N A I2 5
Completions (mn sq m) Transactions (mn sq m)
CHENNAI OFFICE MARKET ACTIVITY
0.00
0.05
0.10
0.15
0.20
0.25
0.30
0.35
Q2 2021Q1 2021Q4 2020Q3 2020Q2 2020Q1 2020Q4 2019Q3 2019Q2 2019Q1 2019
Source: Knight Frank Research
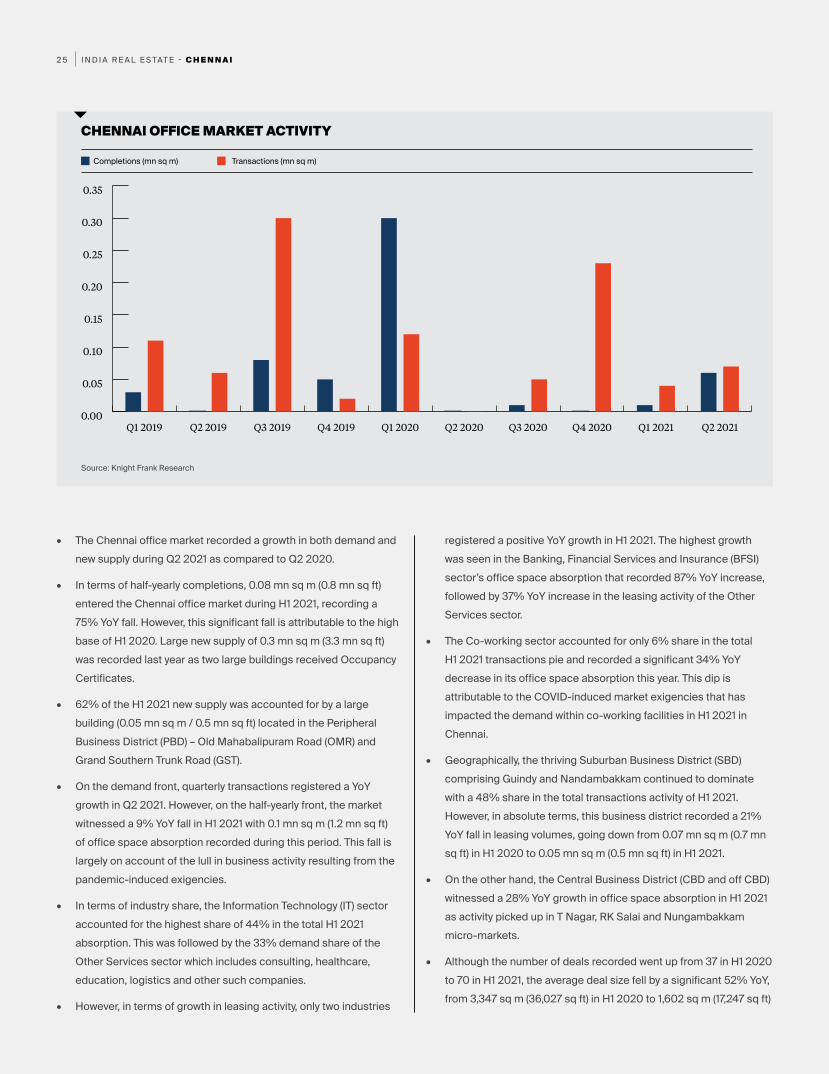
• The Chennai office market recorded a growth in both demand and new supply during Q2 2021 as compared to Q2 2020.
• In terms of half-yearly completions, 0.08 mn sq m (0.8 mn sq ft) entered the Chennai office market during H1 2021, recording a 75% YoY fall. However, this significant fall is attributable to the high base of H1 2020. Large new supply of 0.3 mn sq m (3.3 mn sq ft) was recorded last year as two large buildings received Occupancy Certificates.
• 62% of the H1 2021 new supply was accounted for by a large building (0.05 mn sq m / 0.5 mn sq ft) located in the Peripheral Business District (PBD) – Old Mahabalipuram Road (OMR) and Grand Southern Trunk Road (GST).
• On the demand front, quarterly transactions registered a YoY growth in Q2 2021. However, on the half-yearly front, the market witnessed a 9% YoY fall in H1 2021 with 0.1 mn sq m (1.2 mn sq ft) of office space absorption recorded during this period. This fall is largely on account of the lull in business activity resulting from the pandemic-induced exigencies.
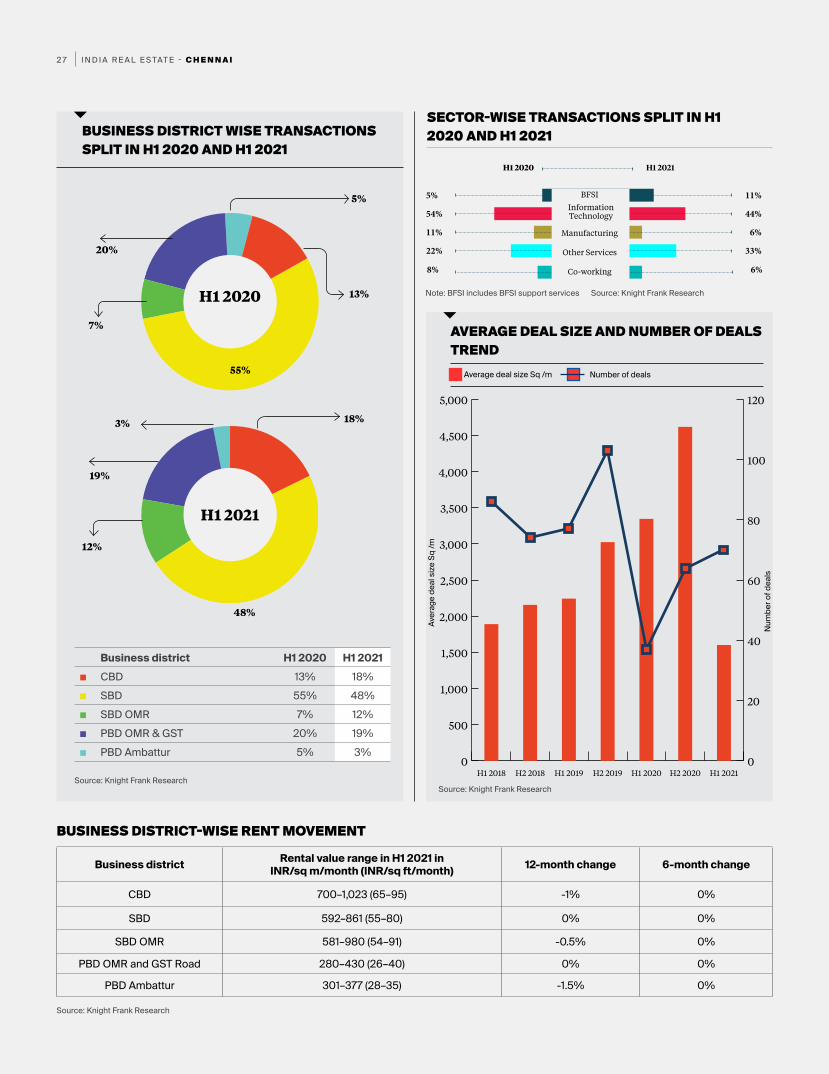
• In terms of industry share, the Information Technology (IT) sector accounted for the highest share of 44% in the total H1 2021 absorption. This was followed by the 33% demand share of the Other Services sector which includes consulting, healthcare, education, logistics and other such companies.
• However, in terms of growth in leasing activity, only two industries
registered a positive YoY growth in H1 2021. The highest growth was seen in the Banking, Financial Services and Insurance (BFSI) sector’s office space absorption that recorded 87% YoY increase, followed by 37% YoY increase in the leasing activity of the Other Services sector.
• The Co-working sector accounted for only 6% share in the total H1 2021 transactions pie and recorded a significant 34% YoY decrease in its office space absorption this year. This dip is attributable to the COVID-induced market exigencies that has impacted the demand within co-working facilities in H1 2021 in Chennai.
• Geographically, the thriving Suburban Business District (SBD) comprising Guindy and Nandambakkam continued to dominate with a 48% share in the total transactions activity of H1 2021. However, in absolute terms, this business district recorded a 21% YoY fall in leasing volumes, going down from 0.07 mn sq m (0.7 mn sq ft) in H1 2020 to 0.05 mn sq m (0.5 mn sq ft) in H1 2021.
• On the other hand, the Central Business District (CBD and off CBD) witnessed a 28% YoY growth in office space absorption in H1 2021 as activity picked up in T Nagar, RK Salai and Nungambakkam micro-markets.
• Although the number of deals recorded went up from 37 in H1 2020 to 70 in H1 2021, the average deal size fell by a significant 52% YoY, from 3,347 sq m (36,027 sq ft) in H1 2020 to 1,602 sq m (17,247 sq ft)
I N D I A R E A L E S TAT E - C H E N N A I2 6
CHENAAI OFFICE MARKET VACANCY
Source: Knight Frank Research
Source: Knight Frank Research
BUSINESS DISTRICT MICRO MARKETS
Central Business District (CBD and off CBD) Anna Salai, RK Salai, Nungambakkam, Greams Road, Egmore, T Nagar
Suburban Business District (SBD) Mount – Poonamallee Road, Porur, Guindy, Nandambakkam
SBD – Old Mahabalipuram Road (OMR) Perungudi, Taramani
Peripheral Business District (PBD) – OMR and Grand Southern Trunk Road (GST)
OMR beyond Perungudi Toll Plaza, GST Road
PBD – Ambattur Ambattur
BUSINESS DISTRICT CLASSIFICATION
0%
2%
4%
6%
8%
10%
12%
14%
16%
Q2
2021
Q1
2021
Q4
2020
Q3
2020
Q2
2020
Q1
2020
Q4
201 9
Q3
2019
Q2
2019
Q1
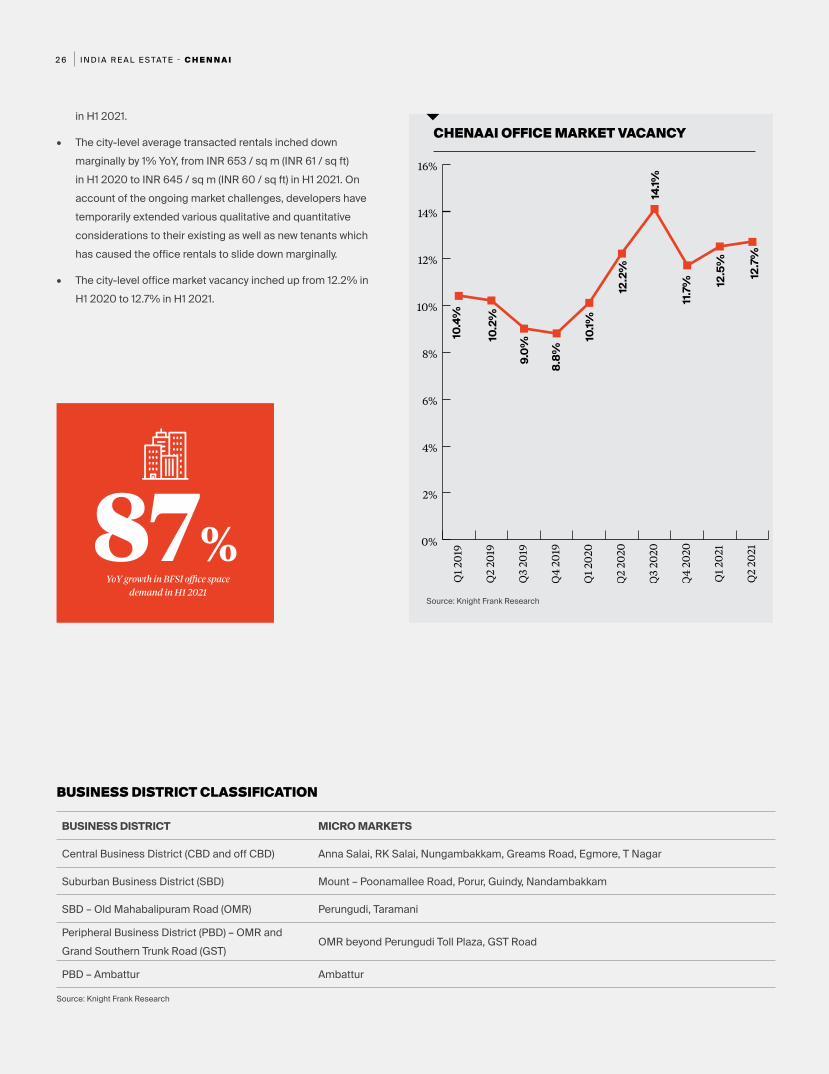
201 987%
YoY growth in BFSI office space demand in H1 2021
10.4
%
10.2
%
9.0%
8.8%
10.1%
12.2
%
14.1%
11.7
% 12.5
%
12.7
%
in H1 2021.
• The city-level average transacted rentals inched down marginally by 1% YoY, from INR 653 / sq m (INR 61 / sq ft) in H1 2020 to INR 645 / sq m (INR 60 / sq ft) in H1 2021. On account of the ongoing market challenges, developers have temporarily extended various qualitative and quantitative considerations to their existing as well as new tenants which has caused the office rentals to slide down marginally.
• The city-level office market vacancy inched up from 12.2% in H1 2020 to 12.7% in H1 2021.
I N D I A R E A L E S TAT E - C H E N N A I2 7
BUSINESS DISTRICT WISE TRANSACTIONS SPLIT IN H1 2020 AND H1 2021
SECTOR-WISE TRANSACTIONS SPLIT IN H1 2020 AND H1 2021
Business district H1 2020 H1 2021■ CBD 13% 18%■ SBD 55% 48%■ SBD OMR 7% 12%■ PBD OMR & GST 20% 19%■ PBD Ambattur 5% 3%
H1 2020
H1 2021
5%
7%
13%
55%
20%
3%
19%
18%
12%
48%
5% 11%
54% 44%
11% 6%
22%
8%
33%
6%
BFSI
Manufacturing
Other Services
Co-working
H1 2020 H1 2021
Note: BFSI includes BFSI support services Source: Knight Frank Research
Source: Knight Frank Research
Source: Knight Frank Research
Information Technology
Business district Rental value range in H1 2021 in INR/sq m/month (INR/sq ft/month) 12-month change 6-month change
CBD 700–1,023 (65–95) -1% 0%
SBD 592–861 (55–80) 0% 0%
SBD OMR 581–980 (54–91) -0.5% 0%
PBD OMR and GST Road 280–430 (26–40) 0% 0%
PBD Ambattur 301–377 (28–35) -1.5% 0%
BUSINESS DISTRICT-WISE RENT MOVEMENT
AVERAGE DEAL SIZE AND NUMBER OF DEALS TREND
0
500
1,000
1,500
2,000
2,500
3,000
3,500
4,000
4,500
5,000
H1 2021H2 2020H1 2020H2 2019H1 2019H2 2018H1 20180
20
40
60
80
100
120
Source: Knight Frank Research
Number of dealsAverage deal size Sq /m
Num
ber o
f dea
ls
Aver
age
deal
size
Sq
/m

I N D I A R E A L E S TAT E - H Y D E R A B A D2 8
HYDERABAD
I N D I A R E A L E S TAT E - H Y D E R A B A D2 9
O F F I C E M A R K E T
The Hyderabad office market recorded a YoY growth in
office space absorption in Q2 2021. The office leasing
activity of the Other Services, BFSI and Co-working sectors
grew substantially during H1 2021. The SBD comprising
the HITEC City continued to dominate the transaction
share in H1 2021 as well.
P R A D N YA N E R K A R
Expert Take
HYDERABAD MARKET SUMMARY
PARAMETER 2020 CHANGE (YOY) H1 2020 H1 2021 CHANGE (YOY)
Completions mn sq m (mn sq ft)
0.8 (8.7) -20% 0.3 (3.8) 0.07 (0.8) -80%
Transactions mn sq m (mn sq ft)
0.6 (6.0) -53% 0.2 (2.2) 0.1 (1.6) -27%
Average transacted rent INR/sq m/month (INR/sq ft/month)
658 (61) 0% 667 (62) 664 (61.7) -1%
Stock mn sq m (mn sq ft) 7.8 (83.9) 11% 7.2 (78) 7.9 (84.7) 7%
Vacancy (%) 9.4% - 8.9% 12.3% -
Source: Knight Frank Research
I N D I A R E A L E S TAT E - H Y D E R A B A D3 0
Completions (mn sq m) Transactions (mn sq m)
HYDERABAD OFFICE MARKET ACTIVITY
0.0
0.1
0.2
0.3
0.4
0.5
0.6
Q2 2021Q1 2021Q4 2020Q3 2020Q2 2020Q1 2020Q4 2019Q3 2019Q2 2019Q1 2019
Source: Knight Frank Research
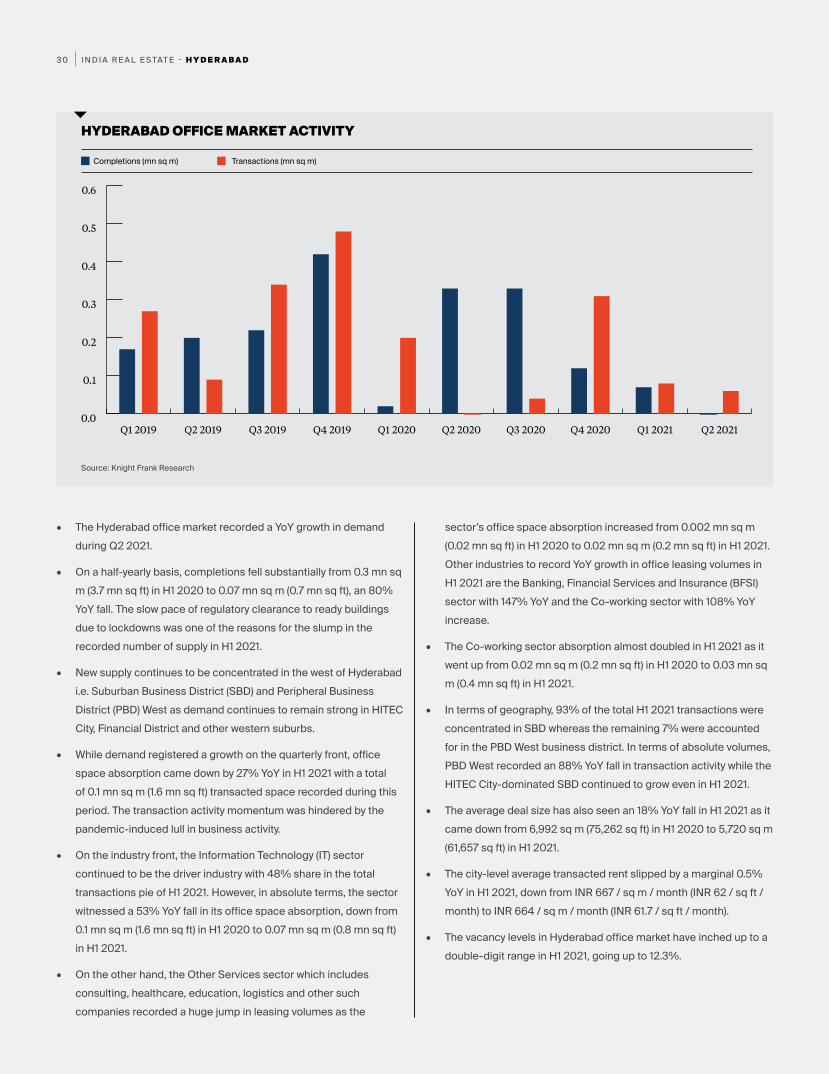
• The Hyderabad office market recorded a YoY growth in demand during Q2 2021.
• On a half-yearly basis, completions fell substantially from 0.3 mn sq m (3.7 mn sq ft) in H1 2020 to 0.07 mn sq m (0.7 mn sq ft), an 80% YoY fall. The slow pace of regulatory clearance to ready buildings due to lockdowns was one of the reasons for the slump in the recorded number of supply in H1 2021.
• New supply continues to be concentrated in the west of Hyderabad i.e. Suburban Business District (SBD) and Peripheral Business District (PBD) West as demand continues to remain strong in HITEC City, Financial District and other western suburbs.
• While demand registered a growth on the quarterly front, office space absorption came down by 27% YoY in H1 2021 with a total of 0.1 mn sq m (1.6 mn sq ft) transacted space recorded during this period. The transaction activity momentum was hindered by the pandemic-induced lull in business activity.
• On the industry front, the Information Technology (IT) sector continued to be the driver industry with 48% share in the total transactions pie of H1 2021. However, in absolute terms, the sector witnessed a 53% YoY fall in its office space absorption, down from 0.1 mn sq m (1.6 mn sq ft) in H1 2020 to 0.07 mn sq m (0.8 mn sq ft) in H1 2021.
• On the other hand, the Other Services sector which includes consulting, healthcare, education, logistics and other such companies recorded a huge jump in leasing volumes as the
sector’s office space absorption increased from 0.002 mn sq m (0.02 mn sq ft) in H1 2020 to 0.02 mn sq m (0.2 mn sq ft) in H1 2021. Other industries to record YoY growth in office leasing volumes in H1 2021 are the Banking, Financial Services and Insurance (BFSI) sector with 147% YoY and the Co-working sector with 108% YoY increase.
• The Co-working sector absorption almost doubled in H1 2021 as it went up from 0.02 mn sq m (0.2 mn sq ft) in H1 2020 to 0.03 mn sq m (0.4 mn sq ft) in H1 2021.
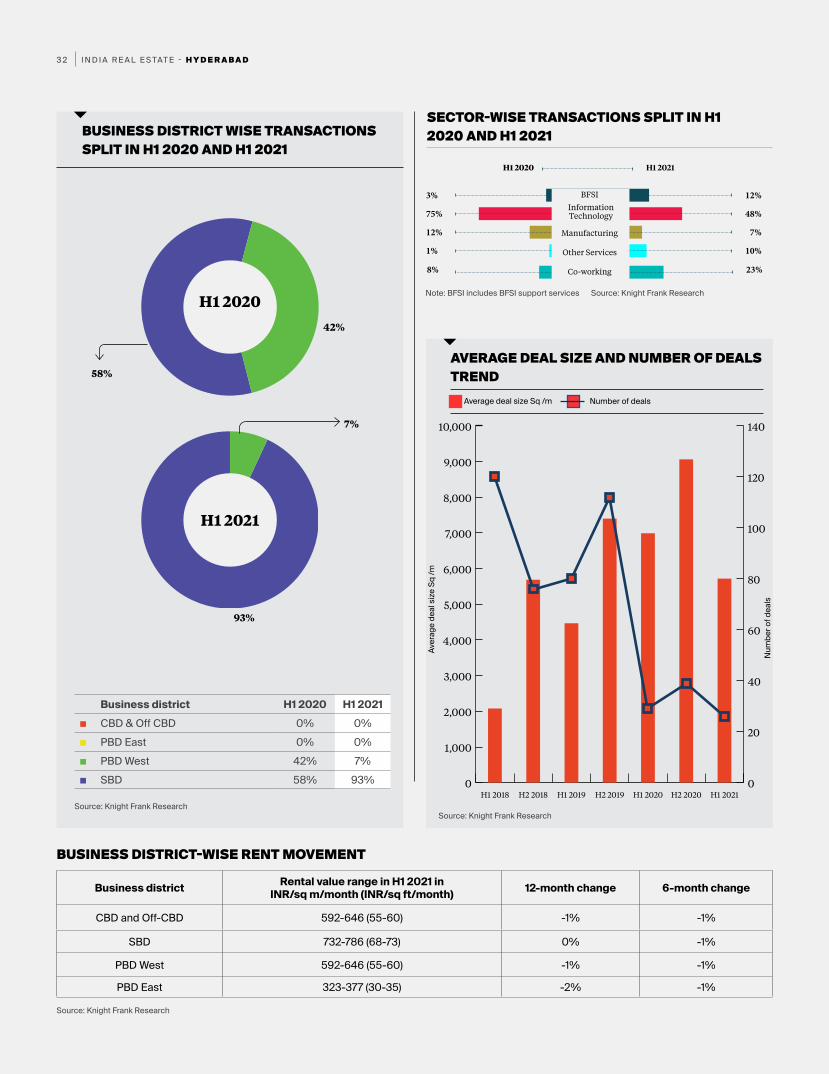
• In terms of geography, 93% of the total H1 2021 transactions were concentrated in SBD whereas the remaining 7% were accounted for in the PBD West business district. In terms of absolute volumes, PBD West recorded an 88% YoY fall in transaction activity while the HITEC City-dominated SBD continued to grow even in H1 2021.
• The average deal size has also seen an 18% YoY fall in H1 2021 as it came down from 6,992 sq m (75,262 sq ft) in H1 2020 to 5,720 sq m (61,657 sq ft) in H1 2021.
• The city-level average transacted rent slipped by a marginal 0.5% YoY in H1 2021, down from INR 667 / sq m / month (INR 62 / sq ft / month) to INR 664 / sq m / month (INR 61.7 / sq ft / month).
• The vacancy levels in Hyderabad office market have inched up to a double-digit range in H1 2021, going up to 12.3%.

I N D I A R E A L E S TAT E - H Y D E R A B A D3 1
HYDERABAD OFFICE MARKET VACANCY
Source: Knight Frank Research
Source: Knight Frank Research
BUSINESS DISTRICT MICRO MARKETS
Central Business District (CBD and off CBD)Banjara Hills, Jubilee Hills, Begumpet, Ameerpet, Somajiguda, Himayat Nagar, Raj Bhavan Road, Punjagutta
Suburban Business District (SBD) HITEC City, Kondapur, Manikonda, Kukatpally, Raidurg
Peripheral Business District (PBD) West Gachibowli, Kokapet, Madinaguda, Nanakramguda, Serilingampally
Peripheral Business District (PBD) East Uppal, Pocharam
BUSINESS DISTRICT CLASSIFICATION
0%
2%
4%
6%
8%
10%
12%
14%
Q2
2021
Q1
2021
Q4
2020
Q3
2020
Q2
2020
Q1
2020
Q4
201 9
Q3
2019
Q2
2019
Q1
2019
147%YoY growth in BFSI office space
demand in H1 2021
7.3%
7.1%
7.0%
7.0%
6.8%
8.9%
9.9%
9.4%
11.8
% 12.3
%
I N D I A R E A L E S TAT E - H Y D E R A B A D3 2
BUSINESS DISTRICT WISE TRANSACTIONS SPLIT IN H1 2020 AND H1 2021
SECTOR-WISE TRANSACTIONS SPLIT IN H1 2020 AND H1 2021
Business district H1 2020 H1 2021■ CBD & Off CBD 0% 0%■ PBD East 0% 0%■ PBD West 42% 7%■ SBD 58% 93%
H1 2020
H1 2021
42%
7%
93%
58%
3% 12%
75% 48%
12% 7%
1%
8%
10%
23%
BFSI
Manufacturing
Other Services
Co-working
H1 2020 H1 2021
Note: BFSI includes BFSI support services Source: Knight Frank Research
Source: Knight Frank Research
Source: Knight Frank Research
Information Technology
Business district Rental value range in H1 2021 in INR/sq m/month (INR/sq ft/month) 12-month change 6-month change
CBD and Off-CBD 592-646 (55-60) -1% -1%
SBD 732-786 (68-73) 0% -1%
PBD West 592-646 (55-60) -1% -1%
PBD East 323-377 (30-35) -2% -1%
BUSINESS DISTRICT-WISE RENT MOVEMENT
AVERAGE DEAL SIZE AND NUMBER OF DEALS TREND
0
1,000
2,000
3,000
4,000
5,000
6,000
7,000
8,000
9,000
10,000
H1 2021H2 2020H1 2020H2 2019H1 2019H2 2018H1 20180
20
40
60
80
100
120
140
Source: Knight Frank Research
Number of dealsAverage deal size Sq /m
Num
ber o
f dea
ls
Aver
age
deal
size
Sq
/m

I N D I A R E A L E S TAT E - K O L K ATA3 3
KOLKATA
I N D I A R E A L E S TAT E - K O L K ATA3 4
O F F I C EM A R K E T
Kolkata witnessed muted demand for office spaces as lock-
down in April 2021 led to delayed decision making on new
occupancy. High office space vacancy in H1 2021, with ten-
ants demanding flexibility and sub-leasing arrangements,
have led to a softening of rents compared to the past. Second
generation office spaces are being remodelled and let out
with amenities for co-working, a trend which is catching on
amongst occupiers in the Information
Technology sector, more so, after the pandemic outbreak.
Expert Take
KOLKATA MARKET SUMMARY
PARAMETER 2020 CHANGE (YOY) H1 2020 H1 2021 CHANGE (YOY)
Completions mn sq m (mn sq ft)
0.01 (0.10) -98% 0.01 (0.1) - -
Transactions mn sq m (mn sq ft)
0.09 (0.92) -32% 0.04 (0.5) 0.02 (0.3) -46%
Average transacted rent INR/sq m/month (INR/sq ft/month)
385 (35.8) -7% 415 (38.6) 375 (34.8) -10%
Stock mn sq m (mn sq ft) 2.94 (31.6) 0% 2.94 (31.6) 2.94 (31.6) 0%
Vacancy (%) 41.7% - 41.4% 41.8% -
Source: Knight Frank ResearchNote – 1 square metre (sq m) = 10.764 square feet (sq ft)
I N D I A R E A L E S TAT E - K O L K ATA3 5
Completions (mn sq m) Transactions (mn sq m)
KOLKATA OFFICE MARKET ACTIVITY
0.00
0.01
0.02
0.03
0.04
0.05
0.06
Q2 2021Q1 2021Q4 2020Q3 2020Q2 2020Q1 2020Q4 2019Q3 2019Q2 2019Q1 2019
Source: Knight Frank Research
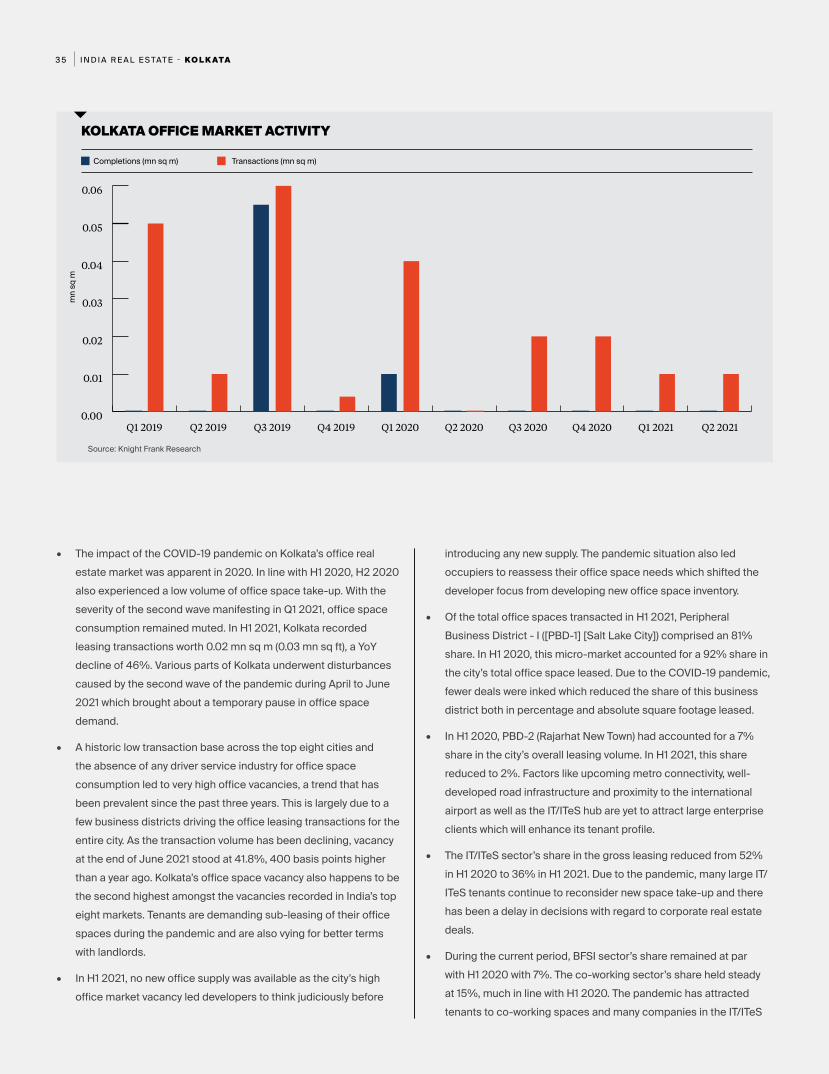
• The impact of the COVID-19 pandemic on Kolkata’s office real estate market was apparent in 2020. In line with H1 2020, H2 2020 also experienced a low volume of office space take-up. With the severity of the second wave manifesting in Q1 2021, office space consumption remained muted. In H1 2021, Kolkata recorded leasing transactions worth 0.02 mn sq m (0.03 mn sq ft), a YoY decline of 46%. Various parts of Kolkata underwent disturbances caused by the second wave of the pandemic during April to June 2021 which brought about a temporary pause in office space demand.
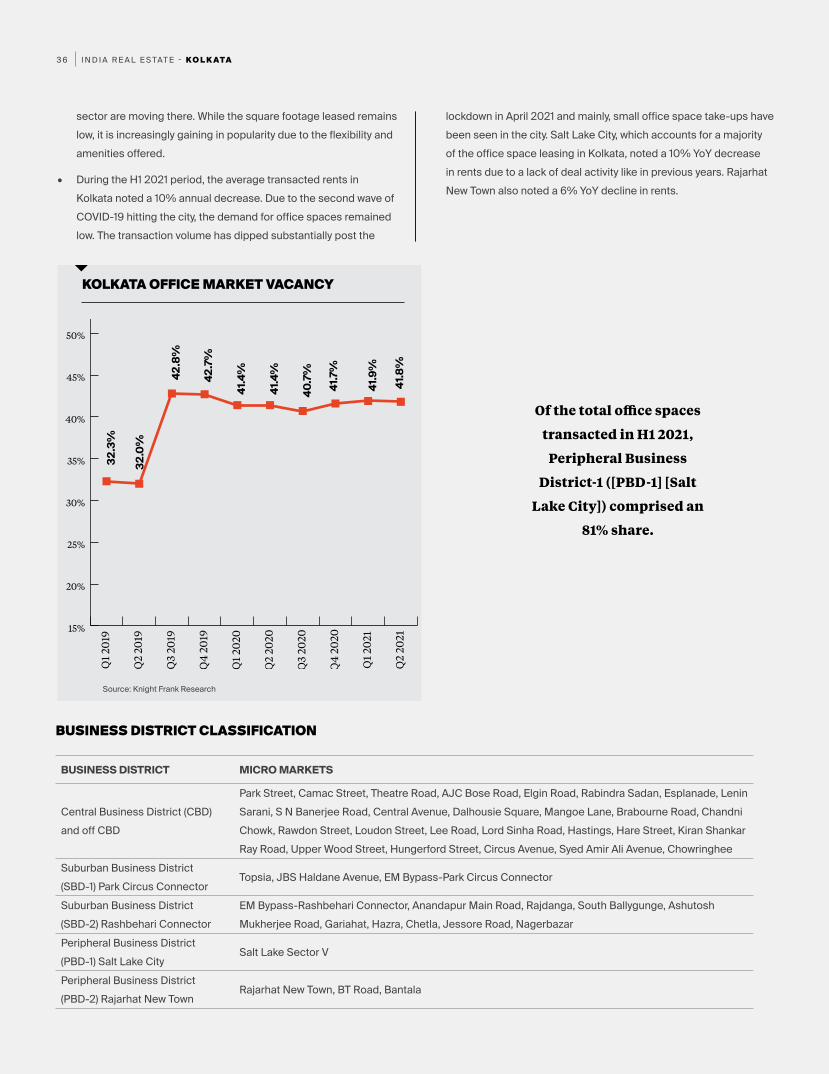
• A historic low transaction base across the top eight cities and the absence of any driver service industry for office space consumption led to very high office vacancies, a trend that has been prevalent since the past three years. This is largely due to a few business districts driving the office leasing transactions for the entire city. As the transaction volume has been declining, vacancy at the end of June 2021 stood at 41.8%, 400 basis points higher than a year ago. Kolkata’s office space vacancy also happens to be the second highest amongst the vacancies recorded in India’s top eight markets. Tenants are demanding sub-leasing of their office spaces during the pandemic and are also vying for better terms with landlords.
• In H1 2021, no new office supply was available as the city’s high office market vacancy led developers to think judiciously before
introducing any new supply. The pandemic situation also led occupiers to reassess their office space needs which shifted the developer focus from developing new office space inventory.
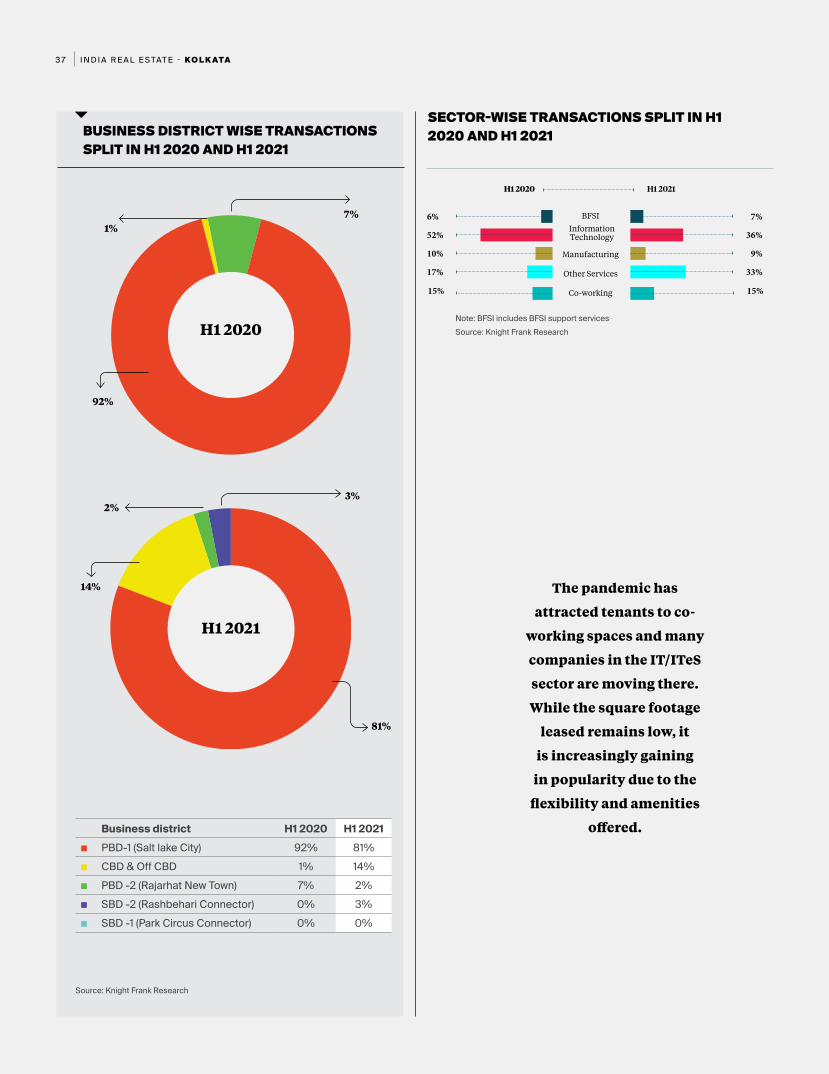
• Of the total office spaces transacted in H1 2021, Peripheral Business District - I ([PBD-1] [Salt Lake City]) comprised an 81% share. In H1 2020, this micro-market accounted for a 92% share in the city’s total office space leased. Due to the COVID-19 pandemic, fewer deals were inked which reduced the share of this business district both in percentage and absolute square footage leased.
• In H1 2020, PBD-2 (Rajarhat New Town) had accounted for a 7% share in the city’s overall leasing volume. In H1 2021, this share reduced to 2%. Factors like upcoming metro connectivity, well-developed road infrastructure and proximity to the international airport as well as the IT/ITeS hub are yet to attract large enterprise clients which will enhance its tenant profile.
• The IT/ITeS sector’s share in the gross leasing reduced from 52% in H1 2020 to 36% in H1 2021. Due to the pandemic, many large IT/ITeS tenants continue to reconsider new space take-up and there has been a delay in decisions with regard to corporate real estate deals.
• During the current period, BFSI sector’s share remained at par with H1 2020 with 7%. The co-working sector’s share held steady at 15%, much in line with H1 2020. The pandemic has attracted tenants to co-working spaces and many companies in the IT/ITeS
mn
sq m
I N D I A R E A L E S TAT E - K O L K ATA3 6
KOLKATA OFFICE MARKET VACANCY
Source: Knight Frank Research
BUSINESS DISTRICT MICRO MARKETS
Central Business District (CBD) and off CBD
Park Street, Camac Street, Theatre Road, AJC Bose Road, Elgin Road, Rabindra Sadan, Esplanade, Lenin Sarani, S N Banerjee Road, Central Avenue, Dalhousie Square, Mangoe Lane, Brabourne Road, Chandni Chowk, Rawdon Street, Loudon Street, Lee Road, Lord Sinha Road, Hastings, Hare Street, Kiran Shankar Ray Road, Upper Wood Street, Hungerford Street, Circus Avenue, Syed Amir Ali Avenue, Chowringhee
Suburban Business District (SBD-1) Park Circus Connector
Topsia, JBS Haldane Avenue, EM Bypass-Park Circus Connector
Suburban Business District (SBD-2) Rashbehari Connector
EM Bypass-Rashbehari Connector, Anandapur Main Road, Rajdanga, South Ballygunge, Ashutosh Mukherjee Road, Gariahat, Hazra, Chetla, Jessore Road, Nagerbazar
Peripheral Business District (PBD-1) Salt Lake City
Salt Lake Sector V
Peripheral Business District (PBD-2) Rajarhat New Town
Rajarhat New Town, BT Road, Bantala
BUSINESS DISTRICT CLASSIFICATION
15%
20%
25%
30%
35%
40%
45%
50%
55%
60%
Q2
2021
Q1
2021
Q4
2020
Q3
2020
Q2
2020
Q1
2020
Q4
201 9
Q3
2019
Q2
2019
Q1
201 9
sector are moving there. While the square footage leased remains low, it is increasingly gaining in popularity due to the flexibility and amenities offered.
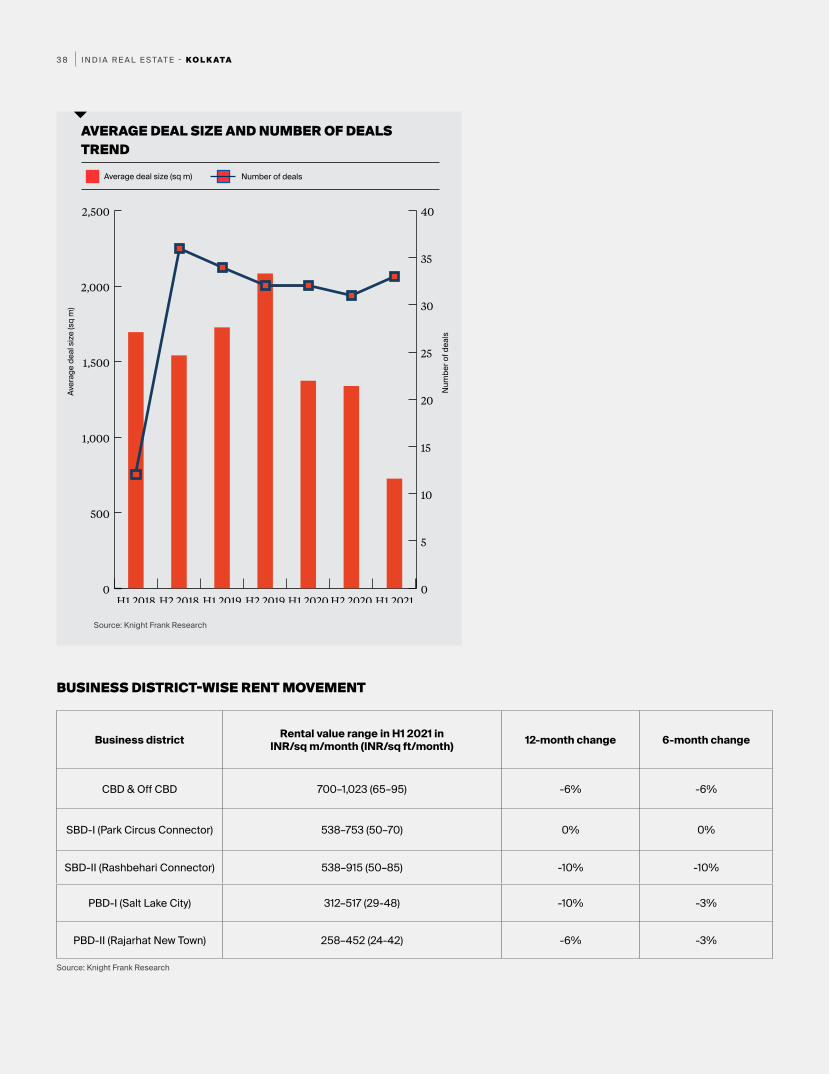
• During the H1 2021 period, the average transacted rents in Kolkata noted a 10% annual decrease. Due to the second wave of COVID-19 hitting the city, the demand for office spaces remained low. The transaction volume has dipped substantially post the
lockdown in April 2021 and mainly, small office space take-ups have been seen in the city. Salt Lake City, which accounts for a majority of the office space leasing in Kolkata, noted a 10% YoY decrease in rents due to a lack of deal activity like in previous years. Rajarhat New Town also noted a 6% YoY decline in rents.
Of the total office spaces
transacted in H1 2021,
Peripheral Business
District-1 ([PBD-1] [Salt
Lake City]) comprised an
81% share.
32.3
%
32.0
%
42.8
%
42.7
%
41.4
%
41.4
%
40.7
%
41.7
%
41.9
%
41.8
%
I N D I A R E A L E S TAT E - K O L K ATA3 7
BUSINESS DISTRICT WISE TRANSACTIONS SPLIT IN H1 2020 AND H1 2021
SECTOR-WISE TRANSACTIONS SPLIT IN H1 2020 AND H1 2021
Business district H1 2020 H1 2021■ PBD-1 (Salt lake City) 92% 81%■ CBD & Off CBD 1% 14%■ PBD -2 (Rajarhat New Town) 7% 2%■ SBD -2 (Rashbehari Connector) 0% 3%■ SBD -1 (Park Circus Connector) 0% 0%
H1 2020
H1 2021
7%1%
2%3%
81%
14%
92%
6% 7%
52% 36%
10% 9%
17%
15%
33%
15%
BFSI
Manufacturing
Other Services
Co-working
H1 2020 H1 2021
Note: BFSI includes BFSI support servicesSource: Knight Frank Research
Source: Knight Frank Research
Information Technology
The pandemic has
attracted tenants to co-
working spaces and many
companies in the IT/ITeS
sector are moving there.
While the square footage
leased remains low, it
is increasingly gaining
in popularity due to the
flexibility and amenities
offered.
I N D I A R E A L E S TAT E - K O L K ATA3 8
AVERAGE DEAL SIZE AND NUMBER OF DEALS TREND
Source: Knight Frank Research
Source: Knight Frank Research
0
500
1,000
1,500
2,000
2,500
H1 2021H2 2020H1 2020H2 2019H1 2019H2 2018H1 20180
5
10
15
20
25
30
35
40
Business district Rental value range in H1 2021 in INR/sq m/month (INR/sq ft/month) 12-month change 6-month change
CBD & Off CBD 700–1,023 (65–95) -6% -6%
SBD-I (Park Circus Connector) 538–753 (50–70) 0% 0%
SBD-II (Rashbehari Connector) 538–915 (50–85) -10% -10%
PBD-I (Salt Lake City) 312–517 (29-48) -10% -3%
PBD-II (Rajarhat New Town) 258–452 (24-42) -6% -3%
BUSINESS DISTRICT-WISE RENT MOVEMENT
Num
ber o
f dea
ls
Number of deals
Aver
age
deal
size
(sq
m)
Average deal size (sq m)

I N D I A R E A L E S TAT E - M U M B A I3 9
MUMBAI
I N D I A R E A L E S TAT E - M U M B A I4 0
O F F I C E M A R K E T
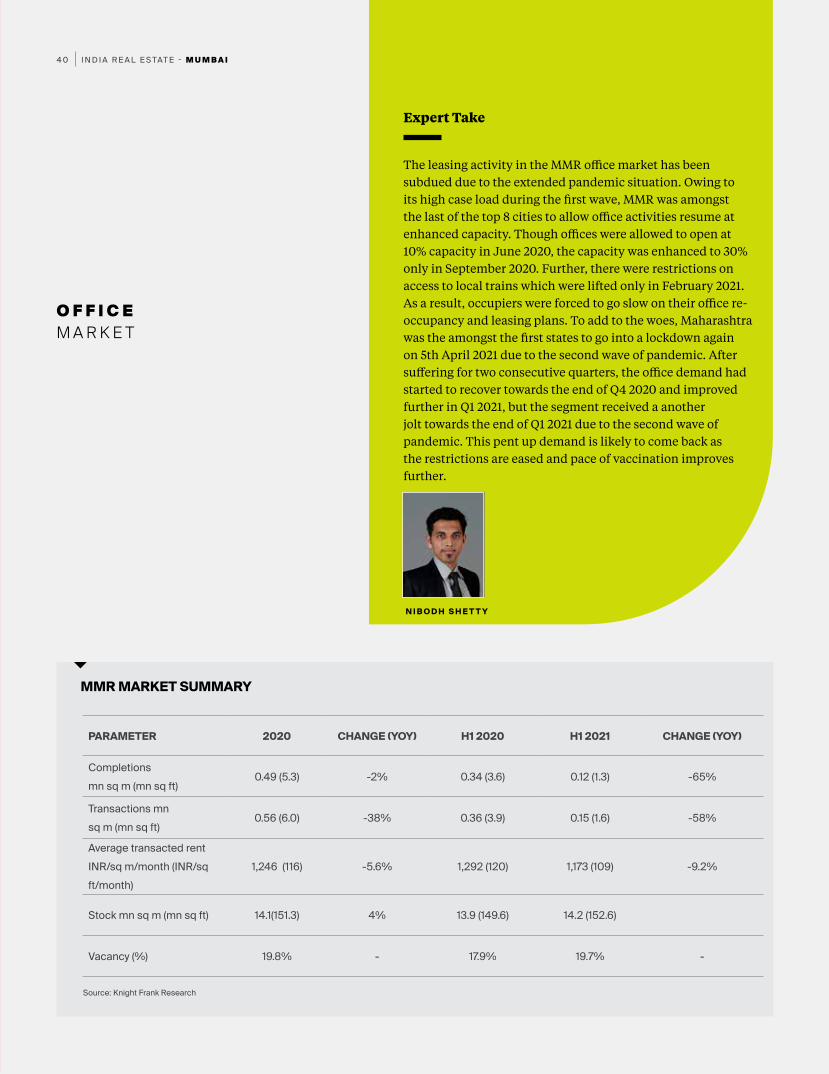
The leasing activity in the MMR office market has been subdued due to the extended pandemic situation. Owing to its high case load during the first wave, MMR was amongst the last of the top 8 cities to allow office activities resume at enhanced capacity. Though offices were allowed to open at 10% capacity in June 2020, the capacity was enhanced to 30% only in September 2020. Further, there were restrictions on access to local trains which were lifted only in February 2021. As a result, occupiers were forced to go slow on their office re-occupancy and leasing plans. To add to the woes, Maharashtra was the amongst the first states to go into a lockdown again on 5th April 2021 due to the second wave of pandemic. After suffering for two consecutive quarters, the office demand had started to recover towards the end of Q4 2020 and improved further in Q1 2021, but the segment received a another jolt towards the end of Q1 2021 due to the second wave of pandemic. This pent up demand is likely to come back as the restrictions are eased and pace of vaccination improves further.
N I B O D H S H E T T Y
Expert Take
MMR MARKET SUMMARY
PARAMETER 2020 CHANGE (YOY) H1 2020 H1 2021 CHANGE (YOY)
Completions mn sq m (mn sq ft)
0.49 (5.3) -2% 0.34 (3.6) 0.12 (1.3) -65%
Transactions mn sq m (mn sq ft)
0.56 (6.0) -38% 0.36 (3.9) 0.15 (1.6) -58%
Average transacted rent INR/sq m/month (INR/sq ft/month)
1,246 (116) -5.6% 1,292 (120) 1,173 (109) -9.2%
Stock mn sq m (mn sq ft) 14.1(151.3) 4% 13.9 (149.6) 14.2 (152.6)
Vacancy (%) 19.8% - 17.9% 19.7% -
Source: Knight Frank Research
I N D I A R E A L E S TAT E - M U M B A I4 1
Completions (mn sq m) Transactions (mn sq m)
MMR OFFICE MARKET ACTIVITY
0.00
0.05
0.10
0.15
0.20
0.25
Q2 2021Q1 2021Q4 2020Q3 2020Q2 2020Q1 2020Q4 2019Q3 2019Q2 2019Q1 2019
Source: Knight Frank Research
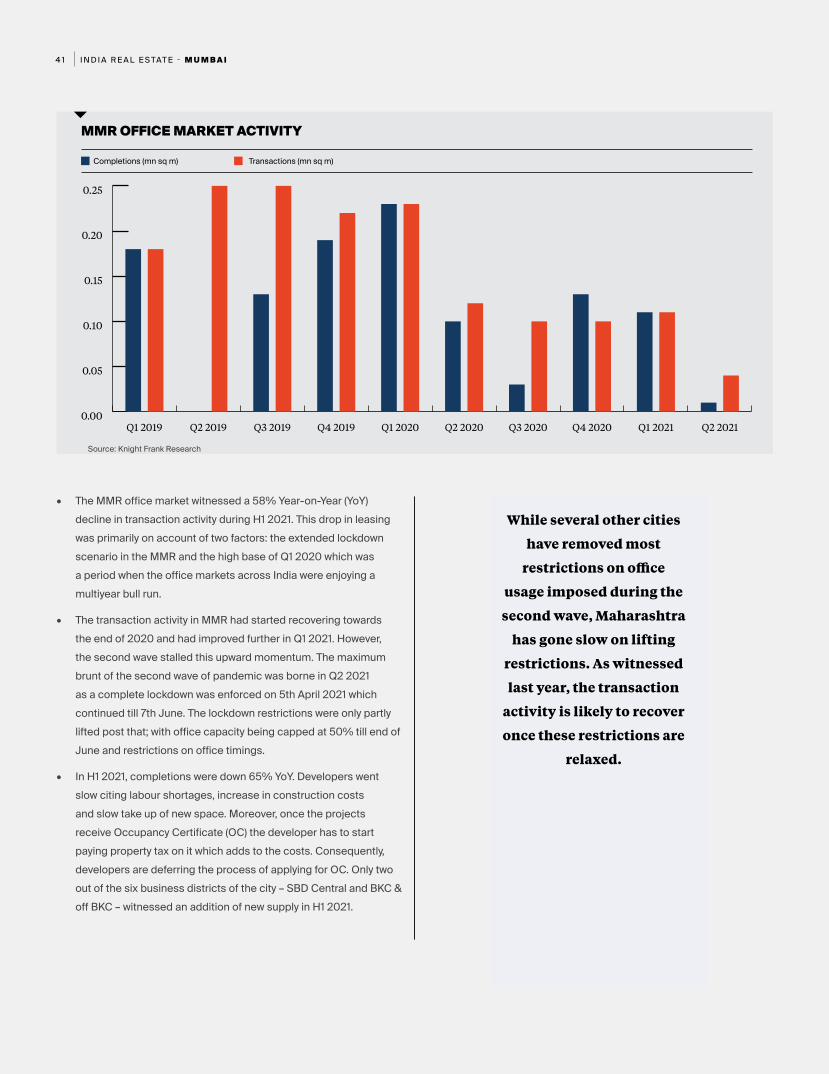
• The MMR office market witnessed a 58% Year-on-Year (YoY) decline in transaction activity during H1 2021. This drop in leasing was primarily on account of two factors: the extended lockdown scenario in the MMR and the high base of Q1 2020 which was a period when the office markets across India were enjoying a multiyear bull run.
• The transaction activity in MMR had started recovering towards the end of 2020 and had improved further in Q1 2021. However, the second wave stalled this upward momentum. The maximum brunt of the second wave of pandemic was borne in Q2 2021 as a complete lockdown was enforced on 5th April 2021 which continued till 7th June. The lockdown restrictions were only partly lifted post that; with office capacity being capped at 50% till end of June and restrictions on office timings.
• In H1 2021, completions were down 65% YoY. Developers went slow citing labour shortages, increase in construction costs and slow take up of new space. Moreover, once the projects receive Occupancy Certificate (OC) the developer has to start paying property tax on it which adds to the costs. Consequently, developers are deferring the process of applying for OC. Only two out of the six business districts of the city – SBD Central and BKC & off BKC – witnessed an addition of new supply in H1 2021.
While several other cities
have removed most
restrictions on office
usage imposed during the
second wave, Maharashtra
has gone slow on lifting
restrictions. As witnessed
last year, the transaction
activity is likely to recover
once these restrictions are
relaxed.
I N D I A R E A L E S TAT E - M U M B A I4 2
MMR OFFICE MARKET VACANCY
Source: Knight Frank Research
BUSINESS DISTRICT MICRO MARKETS
CBD & Off-CBD Nariman Point, Cuffe Parade, Ballard Estate, Fort, Mahalaxmi
Bandra Kurla Complex & Off-Bandra Kurla Complex (BKC & Off-BKC) BKC, Bandra (E), Kalina and Kalanagar
Central Mumbai Parel, Lower Parel, Dadar, Prabhadevi, Worli
SBD West Andheri, Jogeshwari, Goregoan, Malad
SBD Central Kurla, Ghatkopar, Vikhroli, Kanjurmarg, Powai, Bhandup, Chembur
PBD Thane, Airoli, Vashi, Ghansoli, Rabale, Belapur
BUSINESS DISTRICT CLASSIFICATION
15%
16%
17%
18%
19%
20%
Q2
2021
Q1
2021
Q4
2020
Q3
2020
Q2
2020
Q1
2020
Q4
2019
Q3
2019
Q2
2019
Q1
2019
58%YoY drop in leasing activity in H1
2021
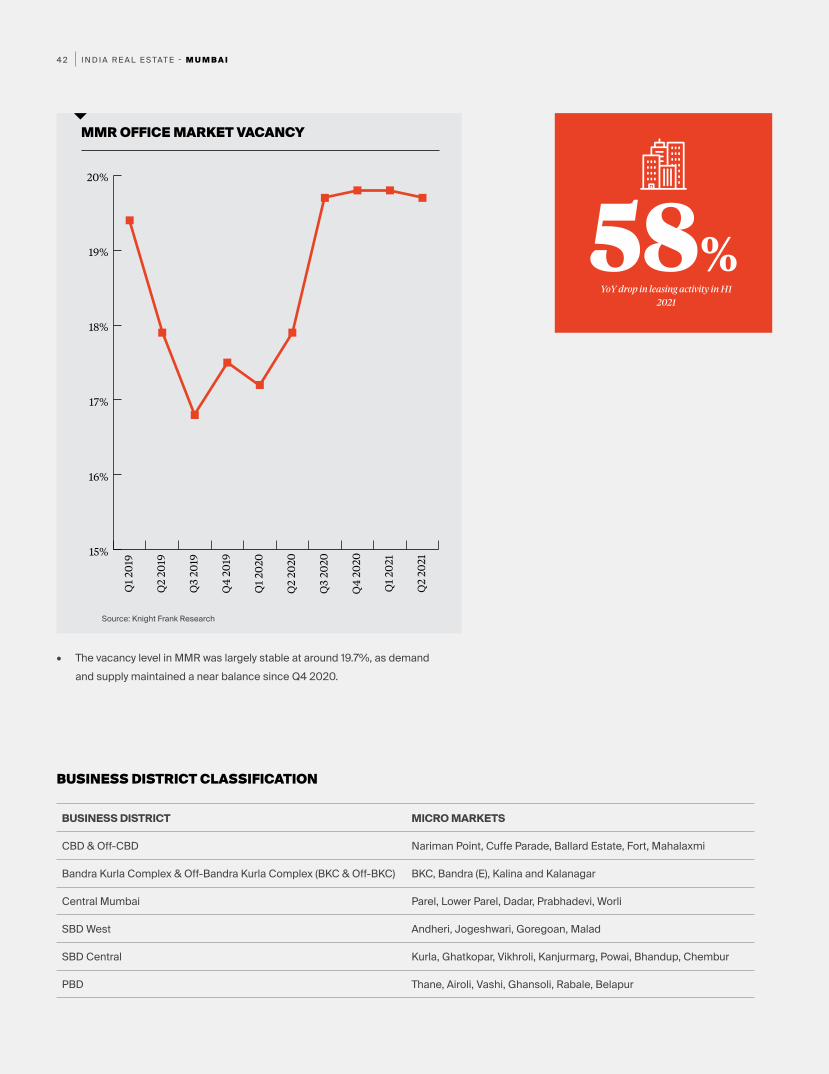
• The vacancy level in MMR was largely stable at around 19.7%, as demand and supply maintained a near balance since Q4 2020.
I N D I A R E A L E S TAT E - M U M B A I4 3
BUSINESS DISTRICT WISE TRANSACTIONS SPLIT IN H1 2020 AND H1 2021
SECTOR-WISE TRANSACTIONS SPLIT IN H1 2020 AND H1 2021
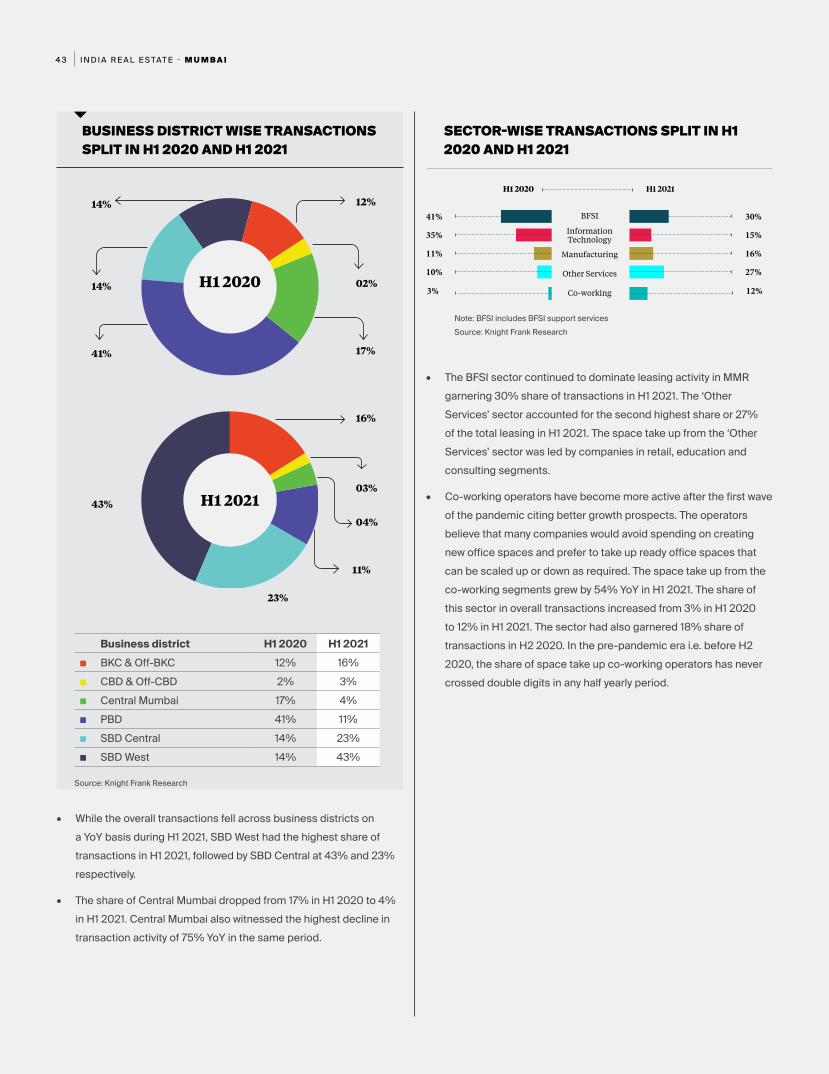
Business district H1 2020 H1 2021■ BKC & Off-BKC 12% 16%■ CBD & Off-CBD 2% 3%■ Central Mumbai 17% 4%■ PBD 41% 11%■ SBD Central 14% 23%■ SBD West 14% 43%
H1 2020
H1 2021
12%14%
02%14%
17%
16%
03%
04%
11%
43%
23%
41%
• While the overall transactions fell across business districts on a YoY basis during H1 2021, SBD West had the highest share of transactions in H1 2021, followed by SBD Central at 43% and 23% respectively.
• The share of Central Mumbai dropped from 17% in H1 2020 to 4% in H1 2021. Central Mumbai also witnessed the highest decline in transaction activity of 75% YoY in the same period.
41% 30%
35% 15%
11% 16%
10%
3%
27%
12%
BFSI
Manufacturing
Other Services
Co-working
H1 2020 H1 2021
Note: BFSI includes BFSI support servicesSource: Knight Frank Research
Source: Knight Frank Research
• The BFSI sector continued to dominate leasing activity in MMR garnering 30% share of transactions in H1 2021. The ‘Other Services’ sector accounted for the second highest share or 27% of the total leasing in H1 2021. The space take up from the ‘Other Services’ sector was led by companies in retail, education and consulting segments.
• Co-working operators have become more active after the first wave of the pandemic citing better growth prospects. The operators believe that many companies would avoid spending on creating new office spaces and prefer to take up ready office spaces that can be scaled up or down as required. The space take up from the co-working segments grew by 54% YoY in H1 2021. The share of this sector in overall transactions increased from 3% in H1 2020 to 12% in H1 2021. The sector had also garnered 18% share of transactions in H2 2020. In the pre-pandemic era i.e. before H2 2020, the share of space take up co-working operators has never crossed double digits in any half yearly period.
Information Technology
I N D I A R E A L E S TAT E - M U M B A I4 4
AVERAGE DEAL SIZE AND NUMBER OF DEALS TREND
Source: Knight Frank Research
Source: Knight Frank Research
0
500
1,000
1,500
2,000
2,500
3,000
3,500
4,000
4,500
H1 2021H2 2020H1 2020H2 2019H1 2019H2 2018H1 20180
20
40
60
80
100
120
140
160
180
Business district Rental value range in H1 2021 in INR/sq m/month (INR/sq ft/month) 12-month change 6-month change
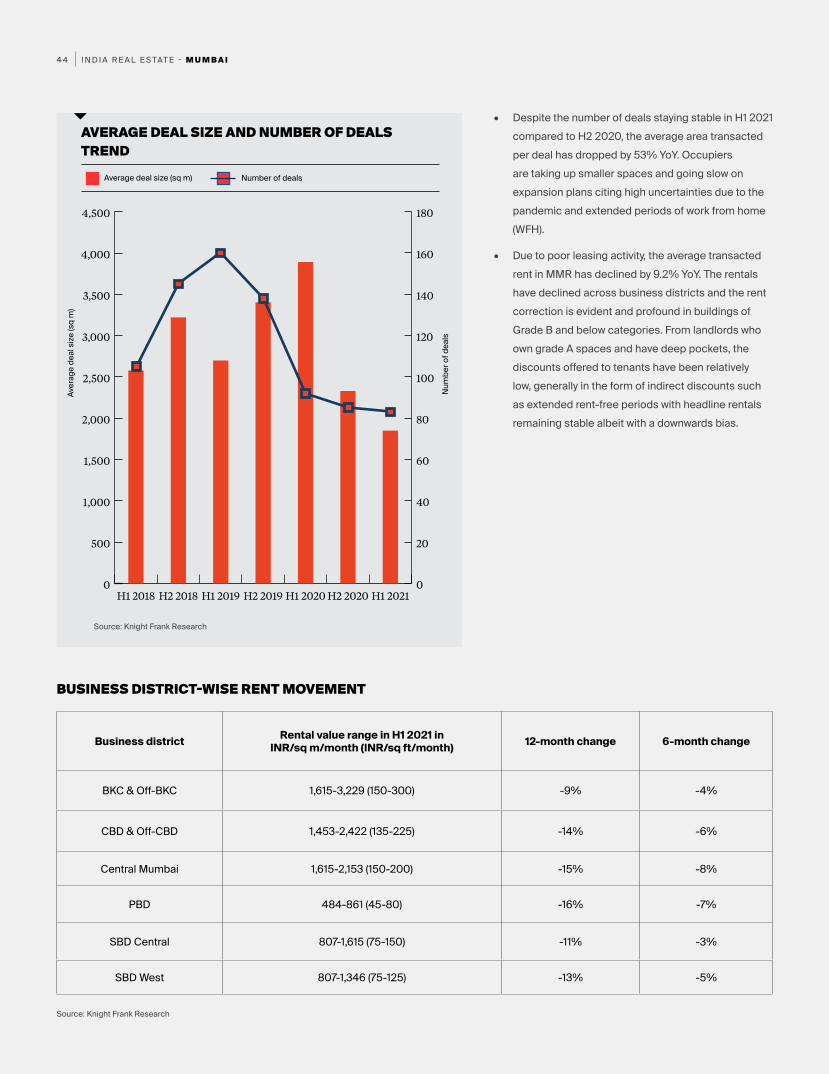
BKC & Off-BKC 1,615-3,229 (150-300) -9% -4%
CBD & Off-CBD 1,453-2,422 (135-225) -14% -6%
Central Mumbai 1,615-2,153 (150-200) -15% -8%
PBD 484-861 (45-80) -16% -7%
SBD Central 807-1,615 (75-150) -11% -3%
SBD West 807-1,346 (75-125) -13% -5%
BUSINESS DISTRICT-WISE RENT MOVEMENT
• Despite the number of deals staying stable in H1 2021 compared to H2 2020, the average area transacted per deal has dropped by 53% YoY. Occupiers are taking up smaller spaces and going slow on expansion plans citing high uncertainties due to the pandemic and extended periods of work from home (WFH).
• Due to poor leasing activity, the average transacted rent in MMR has declined by 9.2% YoY. The rentals have declined across business districts and the rent correction is evident and profound in buildings of Grade B and below categories. From landlords who own grade A spaces and have deep pockets, the discounts offered to tenants have been relatively low, generally in the form of indirect discounts such as extended rent-free periods with headline rentals remaining stable albeit with a downwards bias.
Num
ber o
f dea
ls
Number of deals
Aver
age
deal
size
(sq
m)
Average deal size (sq m)

I N D I A R E A L E S TAT E - N C R4 5
NCR
I N D I A R E A L E S TAT E - N C R4 6
O F F I C E M A R K E T
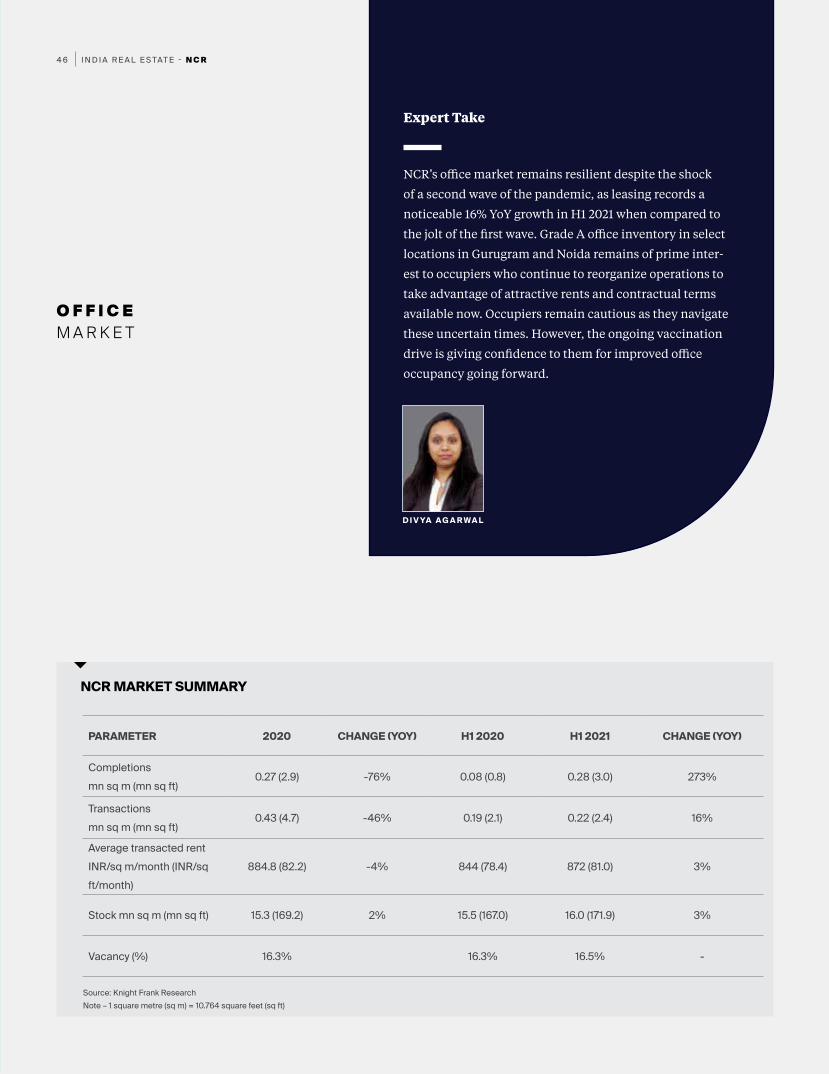
NCR’s office market remains resilient despite the shock
of a second wave of the pandemic, as leasing records a
noticeable 16% YoY growth in H1 2021 when compared to
the jolt of the first wave. Grade A office inventory in select
locations in Gurugram and Noida remains of prime inter-
est to occupiers who continue to reorganize operations to
take advantage of attractive rents and contractual terms
available now. Occupiers remain cautious as they navigate
these uncertain times. However, the ongoing vaccination
drive is giving confidence to them for improved office
occupancy going forward.
Expert Take
NCR MARKET SUMMARY
PARAMETER 2020 CHANGE (YOY) H1 2020 H1 2021 CHANGE (YOY)
Completions mn sq m (mn sq ft)
0.27 (2.9) -76% 0.08 (0.8) 0.28 (3.0) 273%
Transactions mn sq m (mn sq ft)
0.43 (4.7) -46% 0.19 (2.1) 0.22 (2.4) 16%
Average transacted rent INR/sq m/month (INR/sq ft/month)
884.8 (82.2) -4% 844 (78.4) 872 (81.0) 3%
Stock mn sq m (mn sq ft) 15.3 (169.2) 2% 15.5 (167.0) 16.0 (171.9) 3%
Vacancy (%) 16.3% 16.3% 16.5% -
Source: Knight Frank ResearchNote – 1 square metre (sq m) = 10.764 square feet (sq ft)
I N D I A R E A L E S TAT E - N C R4 7
Completions (mn sq m) Transactions (mn sq m)
NCR OFFICE MARKET ACTIVITY
NCR OFFICE MARKET VACANCY
0.0
0.1
0.2
0.3
0.4
0.5
Q2 2021Q1 2021Q4 2020Q3 2020Q2 2020Q1 2020Q4 2019Q3 2019Q2 2019Q1 2019
Source: Knight Frank Research
Source: Knight Frank Research
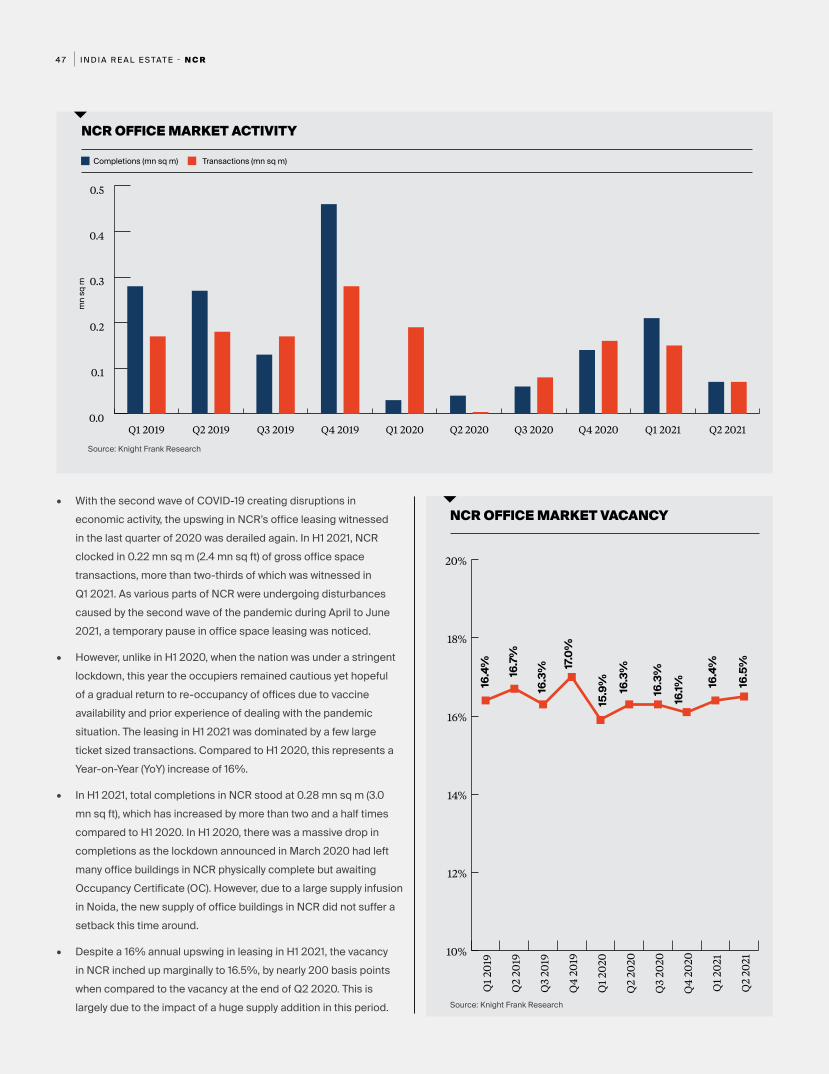
• With the second wave of COVID-19 creating disruptions in economic activity, the upswing in NCR’s office leasing witnessed in the last quarter of 2020 was derailed again. In H1 2021, NCR clocked in 0.22 mn sq m (2.4 mn sq ft) of gross office space transactions, more than two-thirds of which was witnessed in Q1 2021. As various parts of NCR were undergoing disturbances caused by the second wave of the pandemic during April to June 2021, a temporary pause in office space leasing was noticed.
• However, unlike in H1 2020, when the nation was under a stringent lockdown, this year the occupiers remained cautious yet hopeful of a gradual return to re-occupancy of offices due to vaccine availability and prior experience of dealing with the pandemic situation. The leasing in H1 2021 was dominated by a few large ticket sized transactions. Compared to H1 2020, this represents a Year-on-Year (YoY) increase of 16%.
• In H1 2021, total completions in NCR stood at 0.28 mn sq m (3.0 mn sq ft), which has increased by more than two and a half times compared to H1 2020. In H1 2020, there was a massive drop in completions as the lockdown announced in March 2020 had left many office buildings in NCR physically complete but awaiting Occupancy Certificate (OC). However, due to a large supply infusion in Noida, the new supply of office buildings in NCR did not suffer a setback this time around.
• Despite a 16% annual upswing in leasing in H1 2021, the vacancy in NCR inched up marginally to 16.5%, by nearly 200 basis points when compared to the vacancy at the end of Q2 2020. This is largely due to the impact of a huge supply addition in this period.
mn
sq m
16.4
%
16.7
%
16.3
% 17.0
%
15.9
% 16.3
%
16.3
%
16.1% 16
.4%
16.5
%
10%
12%
14%
16%
18%
20%
Q2
2021
Q1
2021
Q4
2020
Q3
2020
Q2
2020
Q1
2020
Q4
2019
Q3
2019
Q2
2019
Q1
2019
I N D I A R E A L E S TAT E - N C R4 8
BUSINESS DISTRICT MICRO MARKETS
CBD Delhi Connaught Place, Barakhamba Road, Kasturba Gandhi Marg and Minto Road
SBD Delhi Nehru Place, Saket, Jasola, Bhikaji Cama Place, Mohan Cooperative, Okhla and Aerocity
Gurugram Zone A M G Road, NH-8, Golf Course Road and Golf Course Extension Road
Gurugram Zone B DLF CyberCity, Sohna Road, Udyog Vihar and Gwal Pahari
Gurugram Zone C Manesar
Noida Sectors 16, 18, 62, 63 and the Noida-Greater Noida Expressway
Faridabad Sector Alpha, Beta, Gamma and Tech Zone
BUSINESS DISTRICT CLASSIFICATION
BUSINESS DISTRICT WISE TRANSACTIONS SPLIT IN H1 2020 AND H1 2021
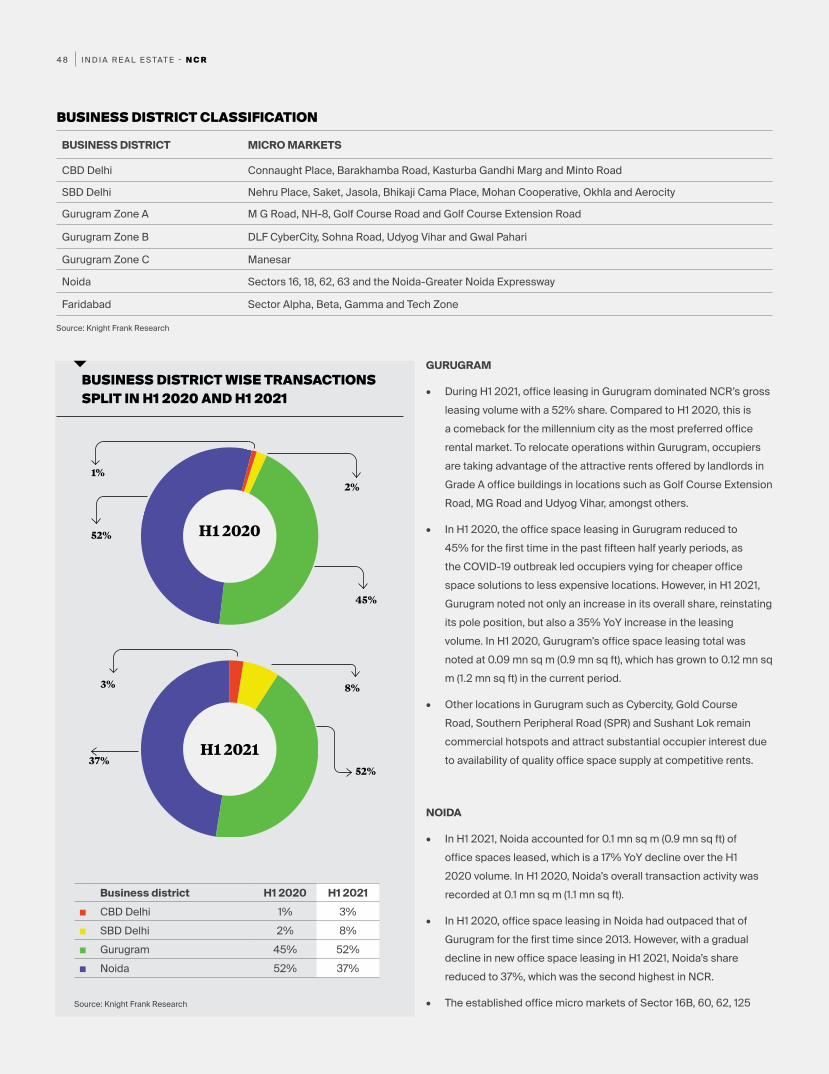
Business district H1 2020 H1 2021■ CBD Delhi 1% 3%■ SBD Delhi 2% 8%■ Gurugram 45% 52%■ Noida 52% 37%
H1 2020
H1 2021
1%2%
52%
45%
3% 8%
52%37%
Source: Knight Frank Research
Source: Knight Frank Research
GURUGRAM
• During H1 2021, office leasing in Gurugram dominated NCR’s gross leasing volume with a 52% share. Compared to H1 2020, this is a comeback for the millennium city as the most preferred office rental market. To relocate operations within Gurugram, occupiers are taking advantage of the attractive rents offered by landlords in Grade A office buildings in locations such as Golf Course Extension Road, MG Road and Udyog Vihar, amongst others.
• In H1 2020, the office space leasing in Gurugram reduced to 45% for the first time in the past fifteen half yearly periods, as the COVID-19 outbreak led occupiers vying for cheaper office space solutions to less expensive locations. However, in H1 2021, Gurugram noted not only an increase in its overall share, reinstating its pole position, but also a 35% YoY increase in the leasing volume. In H1 2020, Gurugram’s office space leasing total was noted at 0.09 mn sq m (0.9 mn sq ft), which has grown to 0.12 mn sq m (1.2 mn sq ft) in the current period.
• Other locations in Gurugram such as Cybercity, Gold Course Road, Southern Peripheral Road (SPR) and Sushant Lok remain commercial hotspots and attract substantial occupier interest due to availability of quality office space supply at competitive rents.
NOIDA
• In H1 2021, Noida accounted for 0.1 mn sq m (0.9 mn sq ft) of office spaces leased, which is a 17% YoY decline over the H1 2020 volume. In H1 2020, Noida’s overall transaction activity was recorded at 0.1 mn sq m (1.1 mn sq ft).
• In H1 2020, office space leasing in Noida had outpaced that of Gurugram for the first time since 2013. However, with a gradual decline in new office space leasing in H1 2021, Noida’s share reduced to 37%, which was the second highest in NCR.
• The established office micro markets of Sector 16B, 60, 62, 125
I N D I A R E A L E S TAT E - N C R4 9
SECTOR-WISE TRANSACTIONS SPLIT IN H1 2020 AND H1 2021
5% 11%
60% 32%
5% 16%
27%
3%
40%
1%
BFSI
Manufacturing
Other Services
Co-working
H1 2020 H1 2021
Note: BFSI includes BFSI support servicesSource: Knight Frank Research
and Noida-Greater Noida Expressway remained of interest to occupiers. Companies across IT/ITeS, BFSI and other sectors leased spaces in Noida in the current half yearly period. Despite reduced transaction volume in H1 2021, Noida remains an occupier favorite due to its competitive rents and quality office assets with large floor plates. Proximity to south and central Delhi and easy accessibility by public transport are just some of the other reasons why occupiers prefer to be situated here.
DELHI
• One of the premium office micro markets in NCR, CBD Delhi saw its share in overall leasing climb from 1% in H1 2020 to 3% in H1 2021. The demand for office spaces in H1 2021 was fueled by small office space requirements, largely in the prime business districts of Connaught Place and Barakhamba Road. Companies from BFSI, real estate and manufacturing chose prime commercial buildings in the heart of the city due to good transport connectivity and nearby amenities.
• SBD Delhi on the other hand, which had accounted for only a 2% share in the overall transaction volume in NCR’s total in H1 2020, witnessed its share expand to 8% in H1 2021. On a YoY basis, SBD Delhi’s leasing volume increased nearly threefold due to occupier interest in Okhla Phase III, Jasola, Aerocity and Mohan Co-operative area.
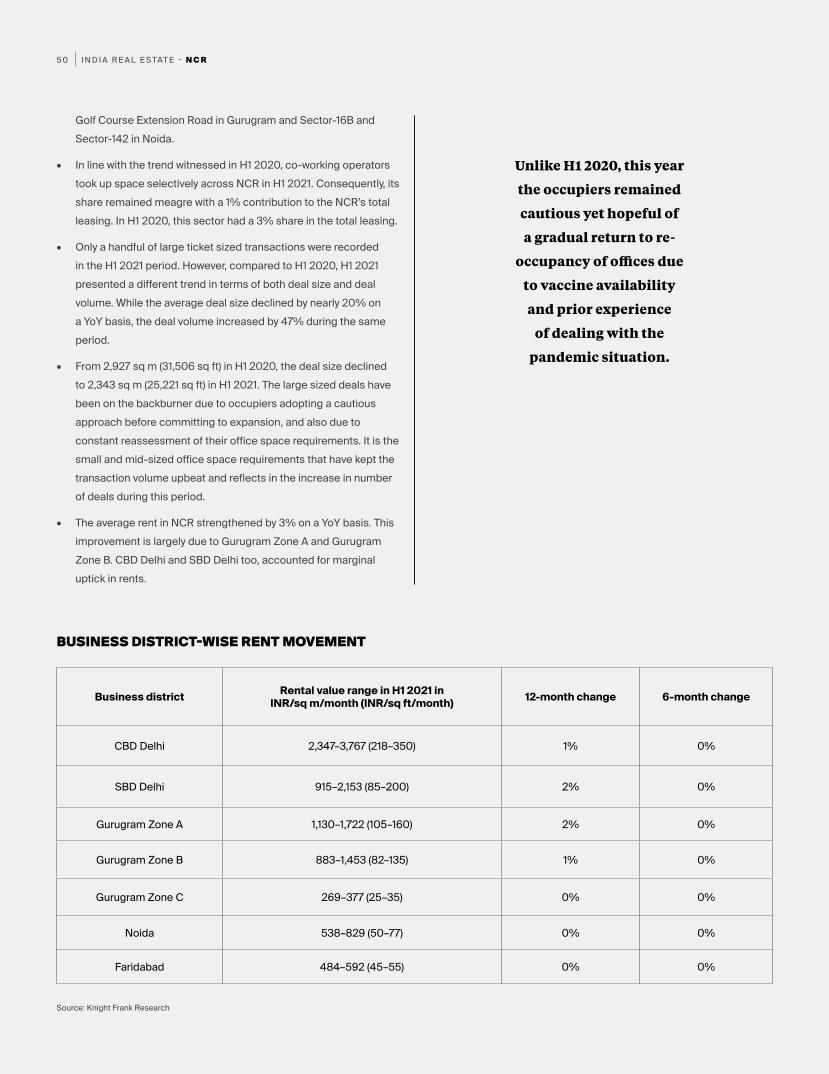
• In H1 2021, the Information Technology sector accounted for 32% of the total office spaces leased compared to 60% of the total transactions in H1 2020 as many IT players worked with reduced office operations. Office spaces leased by the Information Technology sector occupiers were mostly located in multiple locations in Gurugram, followed by Noida.
• The Other Services sector accounted for 40% of the total leasing in H1 2021 and largely comprised space take-up by companies in segments like consulting, telecommunications and education. Gurugram remained the preferred zone in NCR for these companies to set up footprint. The Other Services sector which accounted for 27% of NCR’s total share in H1 2020 has significantly increased mainly on the back of numerous small and mid-sized deals. The manufacturing sector’s share also increased significantly from 5% in H1 2020 to 16% in H1 2021.
• The Banking, Financial Services and Insurance (BFSI) sector constituted 11% of the total leasing in H1 2021. Apart from Delhi’s Central Business District (CBD), occupiers also preferred
AVERAGE DEAL SIZE AND NUMBER OF DEALS
Source: Knight Frank Research
Num
ber o
f dea
ls
Number of deals
Aver
age
deal
size
sq
m
Average deal size in sq m
0
1,000
2,000
3,000
4,000
5,000
H1
2021
H2
2020
H1
2020
H2
2019
H1
2019
H2
2018
H1
2018
0
20
40
60
80
100
120
140
Information Technology
I N D I A R E A L E S TAT E - N C R5 0
Golf Course Extension Road in Gurugram and Sector-16B and Sector-142 in Noida.
• In line with the trend witnessed in H1 2020, co-working operators took up space selectively across NCR in H1 2021. Consequently, its share remained meagre with a 1% contribution to the NCR’s total leasing. In H1 2020, this sector had a 3% share in the total leasing.
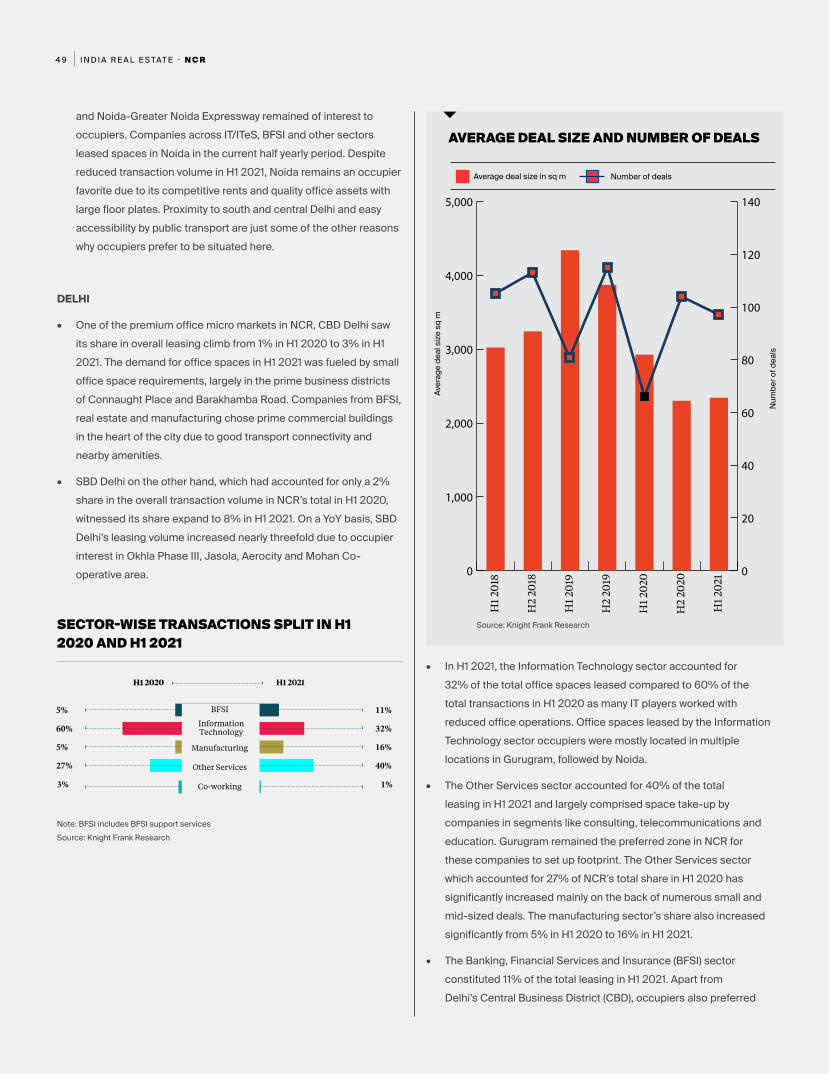
• Only a handful of large ticket sized transactions were recorded in the H1 2021 period. However, compared to H1 2020, H1 2021 presented a different trend in terms of both deal size and deal volume. While the average deal size declined by nearly 20% on a YoY basis, the deal volume increased by 47% during the same period.
• From 2,927 sq m (31,506 sq ft) in H1 2020, the deal size declined to 2,343 sq m (25,221 sq ft) in H1 2021. The large sized deals have been on the backburner due to occupiers adopting a cautious approach before committing to expansion, and also due to constant reassessment of their office space requirements. It is the small and mid-sized office space requirements that have kept the transaction volume upbeat and reflects in the increase in number of deals during this period.
• The average rent in NCR strengthened by 3% on a YoY basis. This improvement is largely due to Gurugram Zone A and Gurugram Zone B. CBD Delhi and SBD Delhi too, accounted for marginal uptick in rents.
Business district Rental value range in H1 2021 in INR/sq m/month (INR/sq ft/month) 12-month change 6-month change
CBD Delhi 2,347–3,767 (218–350) 1% 0%
SBD Delhi 915–2,153 (85–200) 2% 0%
Gurugram Zone A 1,130–1,722 (105–160) 2% 0%
Gurugram Zone B 883–1,453 (82–135) 1% 0%
Gurugram Zone C 269–377 (25–35) 0% 0%
Noida 538–829 (50–77) 0% 0%
Faridabad 484–592 (45–55) 0% 0%
Source: Knight Frank Research
BUSINESS DISTRICT-WISE RENT MOVEMENT
Unlike H1 2020, this year
the occupiers remained
cautious yet hopeful of
a gradual return to re-
occupancy of offices due
to vaccine availability
and prior experience
of dealing with the
pandemic situation.

I N D I A R E A L E S TAT E - P U N E5 1
PUNE
I N D I A R E A L E S TAT E - P U N E5 2
O F F I C E M A R K E T
Pune was amongst the last cities to lift lockdown restrictions
during the first wave of the pandemic and this had a direct
bearing on the office market demand in Q2 and Q3 of 2020.
The demand had revived in Q4 2020, however, the second
wave of COVID-19 infections in Pune struck the city harder
compared to the first wave. As a result, companies were forced
to keep employees on work from home (WFH) mode and this
impacted transaction activity in H1 2021. Given these uncer-
tainties and the threat of a third wave, several companies are
also exploring and opting for co-working options as it can be
scaled up or down as required. Like Q4 2020, the transaction
volumes this year is also expected to pick up as the restric-
tions of second lockdown are lifted. However, the demand
revival is expected to be sustainable this time around as we
have visibility on vaccines.
N I B O D H S H E T T Y
Expert Take
PUNE MARKET SUMMARY
PARAMETER 2020 CHANGE (YOY) H1 2020 H1 2021 CHANGE (YOY)
Completions mn sq m (mn sq ft)
0.07 (0.7) -80% 0.02 (0.2) 0.27 (2.9) 1344%
Transactions mn sq m (mn sq ft)
0.34 (3.7) -30% 0.19 (2.0) 0.11 (1.2) -43%
Average transacted rent INR/sq m/month (INR/sq ft/month)
753.5 (70) -6% 796.5 (74) 710.4 (66) -11%
Stock mn sq m (mn sq ft) 6.9 (73.7) 1% 6.8 (73.2) 7.1 (76.6) 5%
Vacancy (%) 5.9% 4.7% 8.7%
Source: Knight Frank Research
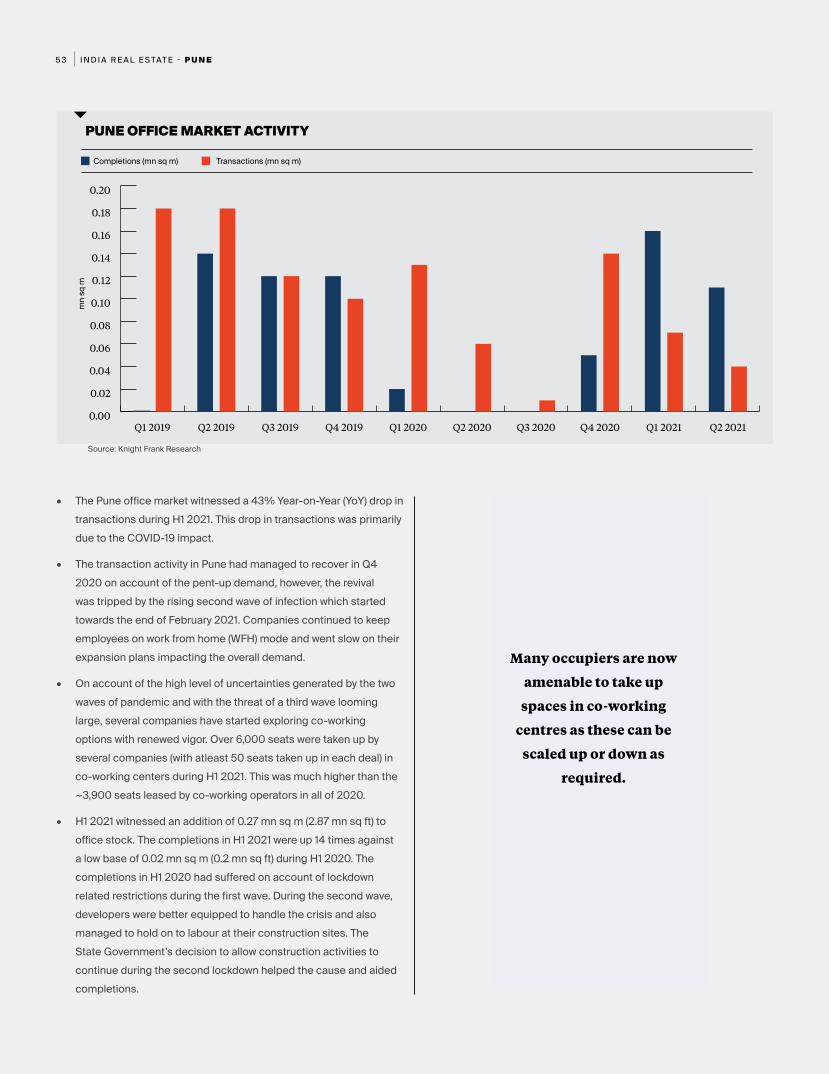
I N D I A R E A L E S TAT E - P U N E5 3
Completions (mn sq m) Transactions (mn sq m)
PUNE OFFICE MARKET ACTIVITY
0.00
0.02
0.04
0.06
0.08
0.10
0.12
0.14
0.16
0.18
0.20
Q2 2021Q1 2021Q4 2020Q3 2020Q2 2020Q1 2020Q4 2019Q3 2019Q2 2019Q1 2019
Source: Knight Frank Research
• The Pune office market witnessed a 43% Year-on-Year (YoY) drop in transactions during H1 2021. This drop in transactions was primarily due to the COVID-19 impact.
• The transaction activity in Pune had managed to recover in Q4 2020 on account of the pent-up demand, however, the revival was tripped by the rising second wave of infection which started towards the end of February 2021. Companies continued to keep employees on work from home (WFH) mode and went slow on their expansion plans impacting the overall demand.
• On account of the high level of uncertainties generated by the two waves of pandemic and with the threat of a third wave looming large, several companies have started exploring co-working options with renewed vigor. Over 6,000 seats were taken up by several companies (with atleast 50 seats taken up in each deal) in co-working centers during H1 2021. This was much higher than the ~3,900 seats leased by co-working operators in all of 2020.
• H1 2021 witnessed an addition of 0.27 mn sq m (2.87 mn sq ft) to office stock. The completions in H1 2021 were up 14 times against a low base of 0.02 mn sq m (0.2 mn sq ft) during H1 2020. The completions in H1 2020 had suffered on account of lockdown related restrictions during the first wave. During the second wave, developers were better equipped to handle the crisis and also managed to hold on to labour at their construction sites. The State Government’s decision to allow construction activities to continue during the second lockdown helped the cause and aided completions.
Many occupiers are now
amenable to take up
spaces in co-working
centres as these can be
scaled up or down as
required.
mn
sq m
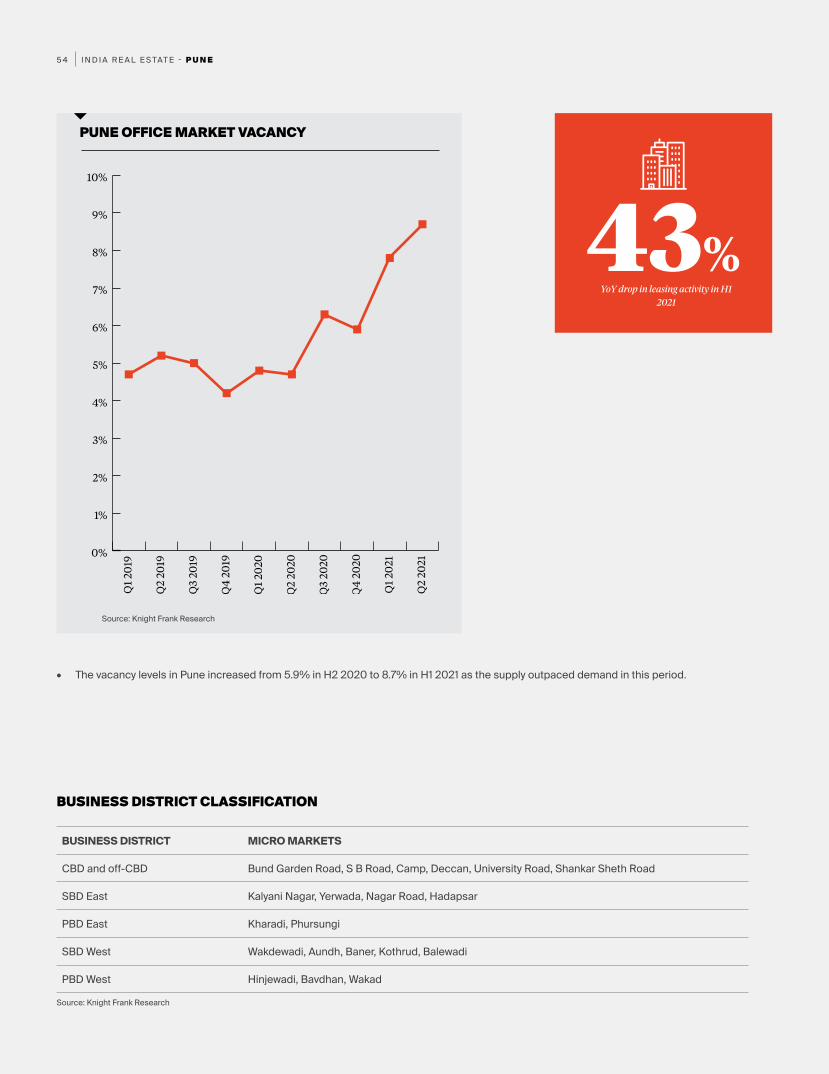
I N D I A R E A L E S TAT E - P U N E5 4
PUNE OFFICE MARKET VACANCY
Source: Knight Frank Research
Source: Knight Frank Research
BUSINESS DISTRICT MICRO MARKETS
CBD and off-CBD Bund Garden Road, S B Road, Camp, Deccan, University Road, Shankar Sheth Road
SBD East Kalyani Nagar, Yerwada, Nagar Road, Hadapsar
PBD East Kharadi, Phursungi
SBD West Wakdewadi, Aundh, Baner, Kothrud, Balewadi
PBD West Hinjewadi, Bavdhan, Wakad
BUSINESS DISTRICT CLASSIFICATION
0%
1%
2%
3%
4%
5%
6%
7%
8%
9%
10%
Q2
2021
Q1
2021
Q4
2020
Q3
2020
Q2
2020
Q1
2020
Q4
201 9
Q3
2019
Q2
2019
Q1
2019
43%YoY drop in leasing activity in H1
2021
• The vacancy levels in Pune increased from 5.9% in H2 2020 to 8.7% in H1 2021 as the supply outpaced demand in this period.
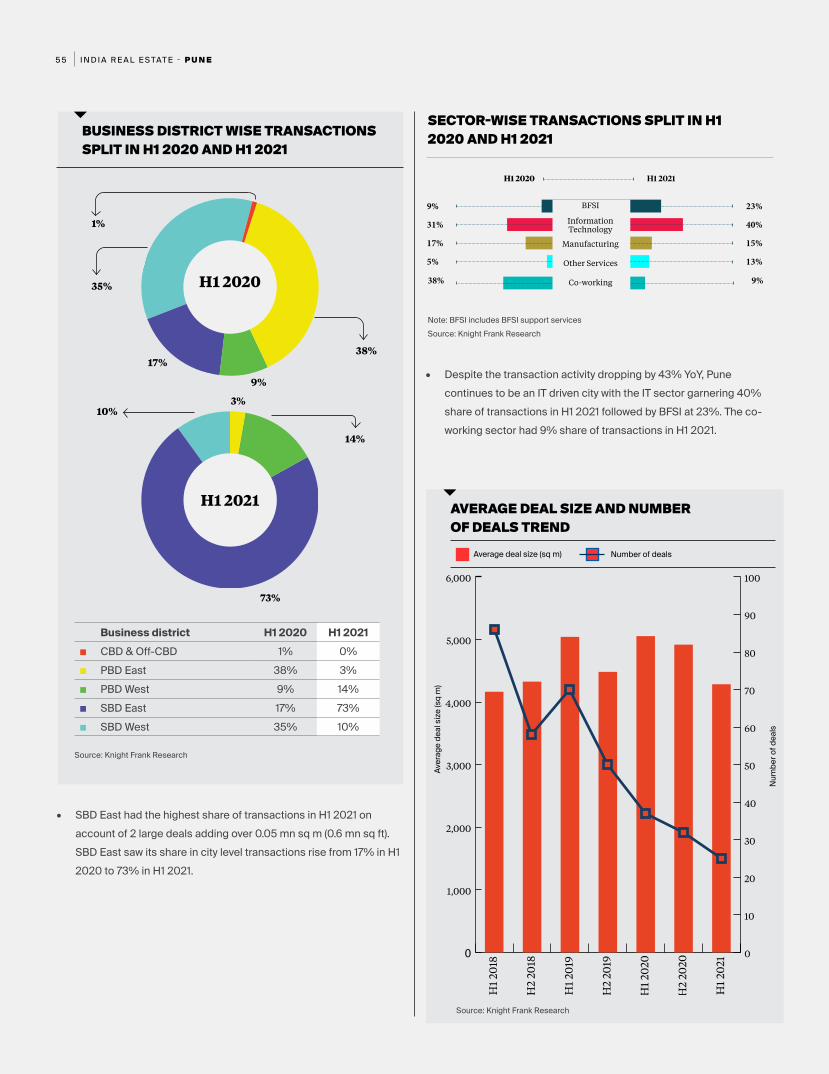
I N D I A R E A L E S TAT E - P U N E5 5
BUSINESS DISTRICT WISE TRANSACTIONS SPLIT IN H1 2020 AND H1 2021
SECTOR-WISE TRANSACTIONS SPLIT IN H1 2020 AND H1 2021
Business district H1 2020 H1 2021■ CBD & Off-CBD 1% 0%■ PBD East 38% 3%■ PBD West 9% 14%■ SBD East 17% 73%■ SBD West 35% 10%
H1 2020
H1 2021
1%
9%
17%
35%
38%
3%
14%
10%
73%
• SBD East had the highest share of transactions in H1 2021 on account of 2 large deals adding over 0.05 mn sq m (0.6 mn sq ft). SBD East saw its share in city level transactions rise from 17% in H1 2020 to 73% in H1 2021.
9% 23%
31% 40%
17% 15%
5%
38%
13%
9%
BFSI
Manufacturing
Other Services
Co-working
H1 2020 H1 2021
Note: BFSI includes BFSI support servicesSource: Knight Frank Research
Source: Knight Frank Research
AVERAGE DEAL SIZE AND NUMBER OF DEALS TREND
Source: Knight Frank Research
Num
ber o
f dea
ls
Number of deals
Aver
age
deal
size
(sq
m)
Average deal size (sq m)
0
1,000
2,000
3,000
4,000
5,000
6,000
H1
2021
H2
2020
H1
2020
H2
2019
H1
201 9
H2
2018
H1
2018
0
10
20
30
40
50
60
70
80
90
100
Information Technology
• Despite the transaction activity dropping by 43% YoY, Pune continues to be an IT driven city with the IT sector garnering 40% share of transactions in H1 2021 followed by BFSI at 23%. The co-working sector had 9% share of transactions in H1 2021.
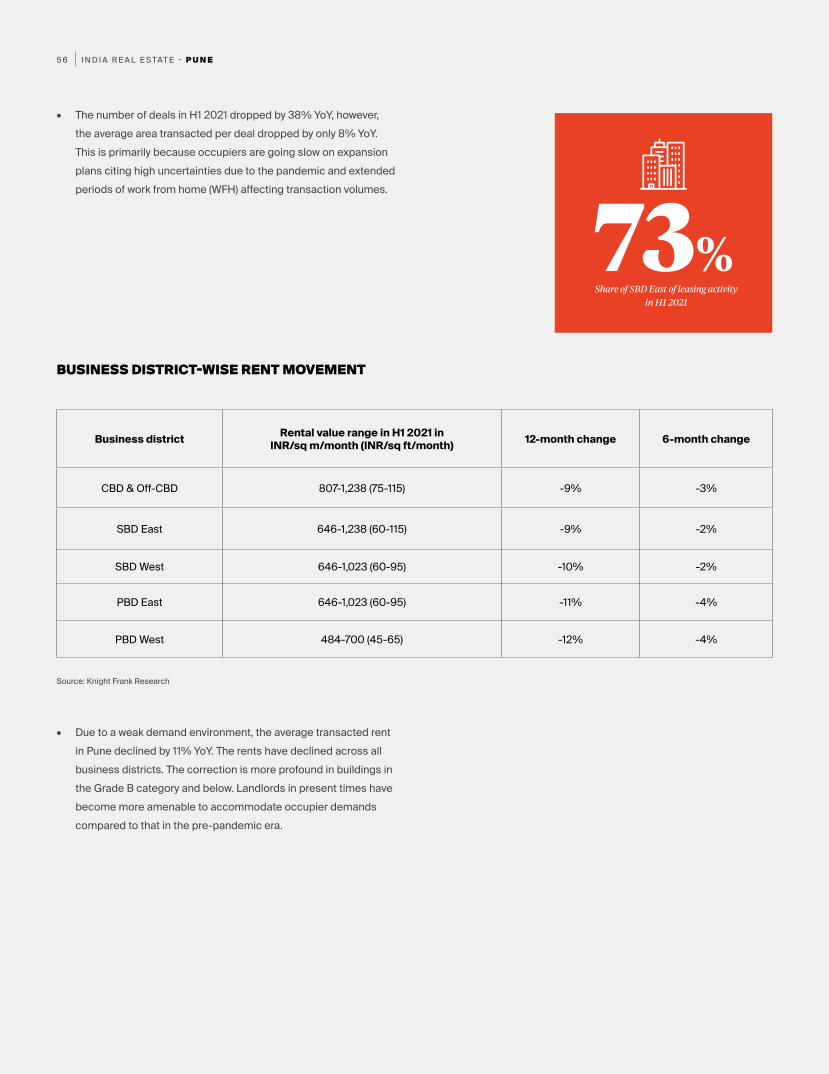
I N D I A R E A L E S TAT E - P U N E5 6
• The number of deals in H1 2021 dropped by 38% YoY, however, the average area transacted per deal dropped by only 8% YoY. This is primarily because occupiers are going slow on expansion plans citing high uncertainties due to the pandemic and extended periods of work from home (WFH) affecting transaction volumes.
• Due to a weak demand environment, the average transacted rent in Pune declined by 11% YoY. The rents have declined across all business districts. The correction is more profound in buildings in the Grade B category and below. Landlords in present times have become more amenable to accommodate occupier demands compared to that in the pre-pandemic era.
Business district Rental value range in H1 2021 in INR/sq m/month (INR/sq ft/month) 12-month change 6-month change
CBD & Off-CBD 807-1,238 (75-115) -9% -3%
SBD East 646-1,238 (60-115) -9% -2%
SBD West 646-1,023 (60-95) -10% -2%
PBD East 646-1,023 (60-95) -11% -4%
PBD West 484-700 (45-65) -12% -4%
Source: Knight Frank Research
BUSINESS DISTRICT-WISE RENT MOVEMENT
73%Share of SBD East of leasing activity
in H1 2021

I N D I A R E A L E S TAT E5 7
for your business.
c o n tac t
Knight Frank India
Headquarters
Paville House, Near Twin Towers
Off Veer Savarkar Marg
Prabhadevi
Mumbai 400 025
L o c a l ly e x p e r t, g l o b a l ly c o n n e c t e d
Our teams are locally expert, yet globally
connected. Our multi-market clients are managed
centrally from our various hubs across the world.
We can help you gain access and entry to new
markets, create a working environment which
enhances productivity, attracts and retains talent,
whilst also managing your portfolio
costs effectively.
O u r m i s s i o n
We work responsibly,
In partnership, to enhance
Peoples lives
& Environments
A B O U TKnight Frank India
8O f f i c e s
I N I N D I As i n c e 1 9 9 5
1 , 4 0 0 +p e o p l e
Mumbai Ahmedabad Bengaluru Chennai Hyderabad Kolkata NCR Pune
I N D I A R E A L E S TAT E5 8
ADVISORY, RETAIL & HOSPITALITY Gulam ZiaExecutive Director [email protected]
Rajeev VijayExecutive Director - Advisory [email protected]
Saurabh MehrotraNational Director - Advisory saurabh.mehrotra@in.knightfrank.com-----------------------------------------
CAPITAL MARKETSSharad AgrawalExecutive Director sharad.agrawal@in.knightfrank.com-----------------------------------------
FACILITIES & ASSET MANAGEMENT SERVICESSathish RajendrenChief Operating Officer sathish.rajendren@in.knightfrank.com-----------------------------------------
INDUSTRIAL & LOGISTICS SERVICES Balbirsingh KhalsaNational [email protected]
Pinkesh TeckwaniNational Directorpinkesh.teckwanii@in.knightfrank.com-----------------------------------------
OFFICE AGENCY & LRGViral DesaiNational Directorviral.desai@in.knightfrank.com-----------------------------------------
PROJECT MANAGEMENTDeben MozaExecutive Director deben.moza@in.knightfrank.com-----------------------------------------
RESEARCH Rajani SinhaChief Economist & National Director [email protected]
Vivek RathiDirector vivek.rathi@in.knightfrank.com-----------------------------------------
AHMEDABAD Balbirsingh KhalsaBranch Directorbalbirsingh.khalsa@in.knightfrank.com-----------------------------------------
BENGALURU Shantanu MazumderSenior Branch Directorshantanu.mazumder@in.knightfrank.com-----------------------------------------
CHENNAI Srinivas AnkipattiSenior Directorsrinivas.ankipatti@in.knightfrank.com-----------------------------------------
HYDERABAD Samson Arthur Branch Directorsamson.arthur@in.knightfrank.com-----------------------------------------
KOLKATASwapan DuttaBranch Directorswapan.dutta@in.knightfrank.com-----------------------------------------
NCRMudassir ZaidiExecutive Director - Northmudassir.zaidi@in.knightfrank.com-----------------------------------------
PUNE Paramvir Singh PaulBranch Directorparamvirsingh.paul@in.knightfrank.com-----------------------------------------
KEY CONTACTS
REPORT AUTHORS
GRAPHICS & DESIGN
Vivek Rathi Director - Research [email protected]
Rajani Sinha Chief Economist & National Director - Research [email protected]
Yashwin Bangera Vice President - Research [email protected]
Divya Agarwal Assistant Vice President - Research [email protected]
Nibodh Shetty Consultant - Research [email protected]
Pradnya Nerkar Associate Consultant - Research [email protected]
Mahendra Dhanawade
Manager - Graphics & Design [email protected]

I N D I A R E A L E S TAT E5 9
The statements, information, data and opinions expressed or provided herein are provided on “as is, where is” basis and concerned parties clients are required to carry out their own due diligence as may be required before signing any binding document. Knight Frank (India) Private Limited (KFIPL) makes no warranties, expressed or implied, and hereby disclaims and negates all other warranties, including without limitation, implied warranties or conditions of merchantability, fitness for a particular purpose, or non-infringement of intellectual property or other violation of rights including any third party rights. Further, KFIPL does not warrant or make any representations concerning the accuracy, likely results, or reliability of the use of the statements, information and opinions as specified herein. The statements, information and opinions expressed or provided in this presentation / document by KFIPL are intended to be a guide with respect to the purpose for which they are intended, but in no way shall serve as a guide with regards to validating title, due diligence (technical and financial), or any other areas specifically not included in the presentation. Neither KFIPL nor any of its personnel involved accept any contractual, tortuous or other form of liability for any consequences, loss or damages which may arise as a result of any person acting upon or using the statements, information, data or opinions in the publication, in part or full. The information herein shall be strictly confidential to the addressee, and is not to be the subject of communication or reproduction wholly or in part. The document / presentation is based on our understanding of the requirement, applicable current real estate market conditions and the regulatory environment that currently exists. Please note: Any change in any one of the parameter stated above could impact the information in the document/presentation. In case of any dispute, KFIPL shall have the right to clarify.
Knight Frank Research Reports are available to download atknightfrank.com/research
We like questions, if you’ve got one about our research, or would like some property advice, we would love to hear from you.
RESEARCH Rajani SinhaChief Economist & National Director [email protected]
CORPORATE - MARKETING & PUBLIC RELATIONSPiyali DasguptaAssociate Director - Corporate - Marketing & Public Relations [email protected]
Inve
stm
ents
in
Real
Est
ate
Wor
k fro
m H
ome
Indi
a W
areh
ousi
ngM
arke
t rep
ort 2
021
#Wor
k fro
m H
yder
abad
Indi
a Re
al E
stat
e Ja
n-Ju
n 20
20
Real
Est
ate
Se
ntim
ent I
ndex
2021
: A N
ew E
ra fo
r Re
ntal
Rea
l Est
ate
in In
dia
Co-w
orkin
g