Embed Size (px)
Citation preview

India and Latin America and the CaribbeanOpportunities and challenges in trade and investment relations
Comisión Económica para América Latina y el Caribe (CEPAL)Economic Commission for Latin America and the Caribbean (ECLAC)
www.eclac.org

India and Latin America and the CaribbeanOpportunities and challenges in trade and investment relations

Alicia BárcenaExecutive Secretary
Antonio PradoDeputy Executive Secretary
Osvaldo RosalesChief, Division of International Trade and Integration
Ricardo PérezChief, Documents and Publications Division
The preparation of this document, which has not been subject to editorial revision, was the responsibility of Osvaldo Rosales, Chief of the Division of International Trade and Integration of the Economic Commission for Latin America and the Caribbean (ECLAC). Mikio Kuwayama, Senior Economic Affairs Officer, coordinated the research. Mariano Alvarez also participated in the preparation of the document.
LC/L.3426Copyright © United Nations, November 2011.
All rights reserved.United Nations publication. Printed in Santiago, Chile
2011-867

3
India and Latin America and the Caribbean: opportunities and challenges in trade and investment relations
Foreword 7
Chapter IIndia and Latin America and the Caribbean in the world economy 91. India’s population will surpass that of China by 2030. With its growing middle class, India presents a
large potential market for Latin American and Caribbean countries 11
2. Countries in Latin America and the Caribbean weathered the recent world economic crisis with unprecedented resilience and emerged from it more quickly and robustly than the developed economies. In the future, the region will be called on to assume an ever larger role in the global economy 12
3. When measured at PPP, India is likely to surpass Japan as the world’s third largest economy in 2011. However, its per capita GDP still remains less than 10% of that of the United States 13
4. India has been responsible for almost 10% of world economic growth in recent years. This impressive performance has contributed to the stability of the world economy 14
5. The Indian economy has seen significant structural changes. The share of services in GDP has increased, while that of agriculture has declined. India’s trade-to-GDP ratio has increased considerably in the past decade, but its level of trade integration remains low compared with that of other Asian countries 15
6. Total factor productivity has been a major source of economic growth for India, whereas Latin American performance in this area has been disappointing 16
7. India’s central Government has a difficult task of maintaining high growth rates with a twin deficit and relatively high inflation 17
8. Despite its increasing volume, India is still at an incipient stage of merchandise trade expansion 18
9. By contrast, India plays a much more important role in world services trade 19
10. Over the years, trade in services has become an engine of growth for India’s external sector 20
11. Asia is India’s largest trading partner both in exports and imports, while the role of Latin America and the Caribbean as a trading partner remains modest 21
12. Historically, India has not relied heavily on FDI as a source of gross fixed capital formation; however, in recent years, the country has become not only a major recipient but also a significant investor worldwide 22
13. Although developing countries are receiving an ever larger proportion of India’s outward FDI, developed economies have, until recently, been India’s main outward FDI hosts. However, even among the former, Latin America and the Caribbean has not been a favoured destination for those investment flows 23
14. The drivers of India’s outward foreign direct investment in recent years have been mergers and acquisitions in developed economies 24
15. Manufacturing is the primary destination sector for India’s FDI overseas, though its share has been declining in recent years 25
Contents

4
Economic Commission for Latin America and the Caribbean (ECLAC)
16. There are substantive differences in outward FDI between China and India 26
17. Though to a lesser degree than China, India is a major importer and consumer of the types of primary products of which Latin America and the Caribbean is a major producer 27
18. India is a major world producer of industrial goods 28
19. India’s domestic demand presents trade and investment opportunities in a number of sectors of the manufacturing industry for the region 29
20. In comparison with Latin American countries, India’s income distribution is favourable; however, the country has the highest poverty rate of all the BRICS 30
21. Among the weaknesses of the Indian economy, the poor condition of infrastructure is a major hindrance to growth 31
22. India offers sizeable markets for Latin American agricultural products. The region has untapped agricultural assets such as fresh water and cultivable land for future use 32
Chapter IITrade and investment relations between India and Latin America and the Caribbean 331. China is a key component in the Latin American and Caribbean region’s strategy to diversify into
Asia-Pacific markets. However, the dynamism of Asia-Pacific does not lie solely in China – India has also become an important trading partner 35
2. Trade between Latin America and India is a recent phenomenon 36
3. The region’s trade with India is concentrated in a small number of countries 37
4. According to India’s official statistics, the order of importance of its trade partners differs dramatically 38
5. For the majority of the countries in the region, India is still an unexploited export market and a minor source of imports 39
6. The region’s exports to India are concentrated in primary products and natural resource-based manufactures, while its imports from India are of a more diverse nature 40
7. The region’s exports to Asia, and especially to India, are limited in terms of range of products 41
8. India’s imports from the region are concentrated in a small number of primary products 42
9. As is the case for the trade flows between Latin America and the Caribbean and other Asian countries, India has little intra-industry trade with Latin America 43
10. To date, the lion’s share of India’s outward FDI in the region has been directed towards tax haven countries 44
11. Though it is still concentrated in natural-resources intensive sectors, India is beginning to expand and diversify its FDI into various types of services, especially outsourcing, software development, and manufacturing 45
12. A complex network of trade agreements has emerged within and between Asia-Pacific and Latin America; however, India has shown reluctance towards signing comprehensive trade agreements with countries in the latter region 46

5
India and Latin America and the Caribbean: opportunities and challenges in trade and investment relations
13. India is creating a complex network of trade agreements, though most of them are partial agreements, with countries inside and outside Asia-Pacific, including partial agreements with Chile and MERCOSUR. India has been negotiating a free trade agreement with the European Union, its largest trading partner 47
14. The region’s exports of raw materials to India are expected to grow, but will face stiff competition in the Indian market from exporters from other regions 48
15. The region’s imports from India range from primary products to manufactures of varying technological intensities. Countries of the region are expected to face strong competition from the Asian country in relation to these products in the future 49
16. Latin America and the Caribbean competes with other countries in Indian markets of primary products and their processed goods, and competes with India in third markets 50
17. The continuing process of reducing trade barriers between Asian countries continues could prejudice trade with Latin America and the Caribbean 51
18. The most-favoured-nation tariff rates applied to the sectors that are of interest to the region remain high 52
19. The Indian markets that are of major interest to Latin America and the Caribbean apply extremely high most-favoured-nation rates 53
Conclusions and recommendations 55
Annex 63


7
India and Latin America and the Caribbean: opportunities and challenges in trade and investment relations
Foreword
India and Latin America and the Caribbean, together with China, are the world’s new growth poles. Economies in developing Asia, led by China and India, are growing three times as fast as the industrialized countries. Latin America and the Caribbean weathered the international crisis with remarkable resilience and emerged from it sooner and more robustly than the developed economies. In the coming years, the industrialized economies will continue to face complex challenges, in particular the need to rein in and gradually reduce the fiscal deficit and public debt in a context of slower growth and high unemployment. The rise of the emerging economies reflects not only their growing contribution to the world economy, but also the stronger linkages between emerging and developing economies through increased South-South trade and investment and cooperation. In this context, India continues to deepen its trade and investment relations with the Latin American and Caribbean region in search of a more coordinated, institutionalized approach among countries.
On the back of recent global economic events, India and the countries of Latin America and the Caribbean must rethink strategic alliances both globally and regionally. In this respect, India and Latin America and the Caribbean need to reposition themselves in the world economy and to address the growing relevance of South-South linkages (in areas such as trade, foreign direct investment and finance) by enhancing cooperation in innovation and human capital in order to diversify trade, add greater value and apply new knowledge to exports, thus helping to create more stable conditions for growth.
Latin America’s resilience during the international financial crisis and its recent strong recovery have aroused India’s interest in the region, while countries in the region have shown a renewed enthusiasm for learning about the Indian economy as a future trade and investment partner. Indeed, the region’s trade with India will continue to grow rapidly, though from a small base, while an increasing number of Indian companies have begun to invest and operate in the region.
Despite recent improvements on many fronts, however, both India and the countries of Latin America and the Caribbean face some formidable challenges. They still have some of the highest inequality indices in the world, as well as serious deficiencies in infrastructure, technology, innovation and competitiveness. India and the Latin American and Caribbean region, together with their main partners, could approach these challenges as opportunities to forge new partnerships to promote growth and development through increased trade and investment. India could be an active partner of the region in this endeavour.

8
Economic Commission for Latin America and the Caribbean (ECLAC)
Increasing trade between Latin America and the Caribbean and the Asia-Pacific region has been prompted primarily by China, while India still remains an unexploited export market as well as an untapped source of imports for the majority of countries in Latin America and the Caribbean. Furthermore, despite the rising interest in investing in the region shown recently by Indian firms, the region’s share of India’s overseas foreign direct investment (FDI) remains quite small. The region’s trade and investment relations with India are still at an incipient stage, making it necessary to consolidate and strengthen ties, while identifying and taking advantage of complementarities and promoting business alliances with a view to stimulating their internationalization and enhancing competitiveness. Several countries in Latin America and the Caribbean have benefited from growing trade flows with the Asia-Pacific region, including Argentina, Brazil, Chile, Costa Rica, Cuba and Peru. However, this trade is mainly of an inter-industry nature, whereby the region exports primary products and natural resource-based manufactures and imports manufactures of different technological intensities, thus limiting the potential for deeper economic relations between the two regions. Trade development therefore needs to be promoted at the intra-industry level with an emphasis on export diversification through business initiatives that draw on the competitive advantage of each region and promote increased investment flows centred on value chains involving both Asian and Latin American firms. Efforts should be made to reduce transaction and transport costs, streamline trade logistics, promote communication with trading partners and enhance the international competitiveness and innovation capabilities of countries in both regions.
For the past five years, the Economic Commission for Latin America and the Caribbean (ECLAC) has closely monitored developments in economic relations between Latin America and the Caribbean and China, Japan and the Republic of Korea. The opportunity now to expand the analysis to include India is a welcome challenge. We hope that this document will serve as an input for deliberations during the seminar “The New India and the New Latin America-Synergies and Complementarities”, to be held in December 2011 in Buenos Aires, and contribute to the region’s goal to further promote trade and investment and enhance economic cooperation with India.
Alicia Bárcena Executive Secretary Economic Commission for Latin America and the Caribbean (ECLAC)

India and Latin America and the Caribbean in the world economy
Chapter I

1.

11
India and Latin America and the Caribbean: opportunities and challenges in trade and investment relations
1. India’s population will surpass that of China by 2030. With its growing middle class, India presents a large potential market for Latin American and Caribbean countries
India’s 1.2 billion inhabitants account for almost 18% of the ■world’s population. If the population continues to grow at a high rate, India is likely to be the most populous country in the world by 2030.India’s rapid economic growth has set the stage for ■fundamental change among the country’s consumers. While there is no official definition of the middle class, estimates of the number of people making up this segment of the population range from 30 million to 300 million; even using the most generous estimates, the middle class comprises less than 30% of the population. Though the rich and the poor combined far outweigh the Indian middle class, the middle class is the fastest growing segment of the population. Average household incomes are expected to triple over the
next two decades and India looks set to become the world’s fifth-largest consumer economy by 2025, up from the twelfth place it currently holds. On the other hand, Latin America and the Caribbean has a ■young population with a birth rate higher than that of Asia and the European Union, but slightly lower than that of the United States of America. Until 2050, population growth rates in the countries of the ■region are expected to be quite heterogeneous: Guatemala will have the highest annual growth rate (1.7%), while Cuba will experience an annual decline in its population (0.3%). The largest populations of the region (Brazil, Mexico, Argentina, the Bolivarian Republic of Venezuela and Colombia) are expected to grow at an annual rate of 0.46%.
Table I.1Selected countries and regions: population growth, 2000-2050 (Millions of people and annual growth rates)
2000 2010 2020 2030 2040 2050Rate of growth
2010-2050
Latin America and the Caribbean 521.2 588.6 645.5 689.9 718 729.2 0.54
Andean Countries 110.8 128.6 145.6 160.3 171.6 179 0.83 Caribbean 34.7 38.1 41.2 43.8 45.6 46.5 0.5 Central America 35.4 42.2 49.6 56.9 63.0 67.9 1.2
Mexico 99 110.7 120.1 127.5 132.1 133.3 0.47 Southern Cone 235.1 263.2 283.2 296.3 302.8 303.2 0.35
Asia a, b, c 3 032.2 3 368.0 3 661.2 3 857.5 3 959.2 3 979.8 0.42East Asiaa 1 472.4 1 564.0 1 640.4 1 666.4 1 649.8 1 600.0 0.06
China 1 267.0 1 354.1 1 431.2 1 462.5 1 455.1 1 417.0 0.11 Korea, Republic of 46.4 48.5 49.5 49.1 47.3 44.1 -0.24 Japan 126.7 127.0 123.7 117.4 109.8 101.7 -0.55
South-east Asiab 517.2 589.6 653.5 706.5 744.7 766.0 0.66Indiac 1 042.6 1 214.5 1 367.2 1 484.6 1 564.8 1 613.8 0.71
United States 287.8 317.6 346.2 370.0 388.9 403.9 0.60European Union 481.2 497.5 505.3 505.6 501.4 493.9 -0.02
World 6 115.4 6 908.7 7 674.8 8 308.9 8 801.2 9 150.0 0.70
Asia’s share in the world total 49.6 48.8 47.7 46.4 45.0 43.5
Source: Economic Commission for Latin America and the Caribbean (ECLAC), on the basis of World Population Prospects, 2008.
a China, Democratic People’s Republic of Korea, Hong Kong Special Administrative Region of China, Japan, Macao Special Administrative Region of China, Mongolia and Republic of Korea.b Brunei Darussalam, Cambodia, Indonesia, Lao People’s Democratic Republic, Malaysia, Myanmar, Philippines, Singapore, Thailand, Timor-Leste and Viet Nam.c Includes India.

12
Economic Commission for Latin America and the Caribbean (ECLAC)
2. 3.
The Latin American and Caribbean region is a large market ■of 33 countries, with a population of 580 million people, regional GDP of US$ 4.9 trillion (at current prices), per capita GDP over five times higher than that of India, and US$ 1.6 trillion in merchandise trade, accounting for 6% of the world total. Following a 1.7% decline in GDP in 2009, Latin America and ■the Caribbean grew by 6.1% in 2010, with most countries in the region experiencing an economic rebound. The region’s economic reforms of past decades, its fiscal and ■macroeconomic prudence and its sound financial supervision, together with ever closer commercial ties with China and the emerging economies, have allowed it not only to successfully navigate through the worst international crisis of the past 80 years but also to enter the new decade with a promising outlook for growth and development. Of course, significant challenges remain. Latin America and ■the Caribbean is still the region with the highest levels of inequality in the world and there are serious deficiencies in technology, innovation and competitiveness. The region and its main partners are approaching these ■challenges as opportunities for growth, investment and trade with a view to opening the way for new business opportunities and partnerships. On the strength of its solid recent performance and its abundance of natural resources, energy, water and biodiversity, the region will be called on to assume an ever larger role in the global economy.India can and should be an active partner in the region’s ■endeavour.
Countries in Latin America and the Caribbean weathered the recent world economic crisis with unprecedented resilience and emerged from it more quickly and robustly than the developed economies. In the future, the region will be called on to assume an ever larger role in the global economy
Figure I.1 WORLD GDP GROWTH RATES BY REGION, 2008-2012(Percentages)
Source: International Monetary Fund (IMF), World Economic Outlook database, September 2011.
a Projections.
-8
-6
-4
-2
0
2
4
6
8
10
12
Advancedeconomies
UnitedStates
EuropeanUnion
Emergingand
developingeconomies
LatinAmericaand the
Caribbean
Brazil DevelopingAsia
China India
2009 2010 2011a 2012a

13
India and Latin America and the Caribbean: opportunities and challenges in trade and investment relations
3.
Table I.2 WORLD’S 15 LARGEST ECONOMIES: GDP AT CURRENT PRICES AND PURCHASING POWER PARITY (PPP), 2010(Billions of dollars and percentages)
Ranking GDP at current prices GDP at PPP (International prices)
1 United States 14 582 23.1 United States 14 582 19.12 China 5 879 9.3 China 10 085 13.23 Japan 5 498 8.7 Japan 4 333 5.74 Germany 3 310 5.2 India 4 199 5.55 France 2 560 4.1 Germany 3 071 4.06 United Kingdom 2 246 3.6 Russian Federation 2 812 3.77 Brazil 2 088 3.3 United Kingdom 2 231 2.98 Italy 2 051 3.3 France 2 194 2.99 India 1 729 2.7 Brazil 2 169 2.810 Canada 1 574 2.5 Italy 1 909 2.511 Russian Federation 1 480 2.3 Mexico 1 652 2.212 Spain 1 407 2.2 Spain 1 478 1.913 Mexico 1 040 1.6 Korea, Rep. 1 418 1.914 Korea, Rep. of 1 014 1.6 Canada 1 327 1.715 Netherlands 783 1.2 Turkey 1 116 1.5
Memo European Union 16 250 25.8 European Union 15 904 20.9Latin America & Caribbean 4 969 7.9 Latin America &
Caribbean 6 478 8.5
World 63 044 100.0 World 76 278 100.0
Source: Economic Commission for Latin America and the Caribbean (ECLAC), on the basis of World Bank, World Development Indicators, 2011.
When measured at PPP, India is likely to surpass Japan as the world’s third largest economy in 2011. However, its per capita GDP still remains less than 10% of that of the United States
Figure I.2BRICS AND EUROPEAN UNION: PER CAPITA GDP (PPP), 1990-2010(Percentages of United States per capita GDP)
India’s GDP ranked ninth and fourth largest in the world ■in 2010, when measured at current prices and purchasing power parity (PPP), respectively. The International Monetary Fund (IMF) projects that India’s GDP at PPP will surpass that of Japan in 2011, making it the world’s third largest economy.India’s per capita GDP is the lowest of the emerging economies ■commonly referred to as BRICS (Brazil, Russian Federation, India, China and South Africa). At US$ 1,500, India’s per capita GDP is less than half that of China. Despite the rapid growth rates that it has achieved over ■the years, India is far from closing the income gap with industrialized countries.
Figure I.3BRICS: PER CAPITA GDP (PPP), 1990-2010(International dollars)
Source: Economic Commission for Latin America and the Caribbean (ECLAC), on the basis of World Bank, World Development Indicators, 2011.
-
5 000
10 000
15 000
20 000
25 000
1990
1991
1992
1993
1994
1995
1996
1997
1998
1999
2000
2001
2002
2003
2004
2005
2006
2007
2008
2009
2010
Brazil China India Russian Federation South Africa
Source: Economic Commission for Latin America and the Caribbean (ECLAC), on the basis of World Bank, World Development Indicators, 2011.Abbreviation: BRICS, Brazil, Russian Federation, India, China and South Africa.
0
10
20
30
40
50
60
70
80
1990
1991
1992
1993
1994
1995
1996
1997
1998
1999
2000
2001
2002
2003
2004
2005
2006
2007
2008
2009
2010
Brazil China IndiaRussian Federation South Africa European Union

14
Economic Commission for Latin America and the Caribbean (ECLAC)
Figure I.4 BRAZIL, CHINA AND INDIA: ANNUAL GDP GROWTH, 1970-2010(Percentages)
Source: World Bank, World Development Indicators 2011.
India has been responsible for almost 10% of world economic growth in recent years. This impressive performance has contributed to the stability of the world economy
Figure I.6 CHINA AND INDIA: CONTRIBUTION TO WORLD ECONOMIC GROWTH, 2002-2011(Percentage points)
Source: Economic Commission for Latin America and the Caribbean (ECLAC),on the basis of International Monetary Fund (IMF), World Economic Outlook database, September 2011.
Figure 1.5 BRICS: ANNUAL GDP GROWTH BY PERIODS, 1970-2010(Percentages)
Source: World Bank, World Development Indicators 2011.
Even though it slowed substantially, India managed to ■maintain a positive growth rate during the 2008-2009 international financial crisis. The economy grew at 4.9% in 2009 and at an almost double-digit rate in the subsequent two years.For over a decade, India has been contributing more than ■10% to world economic growth, a level similar to that of Latin America and the Caribbean as a whole. Together with China, the growth rates of the two BRICs account for more than 40% of the overall growth of the world economy.India has thus become one of the most important growth ■poles of the world economy.
0.73 0.85 0.901.07
1.291.56
1.13 1.191.41 1.36
0.180.27 0.31
0.39
0.43
0.47
0.300.35
0.550.44
0.0
0.5
1.0
1.5
2.0
2.5
2002 2003 2004 2005 2006 2007 2008 2009 2010 2011
India China
4. 5. 19
70
1972
1974
1976
1978
1980
1982
1984
1986
1988
1990
1992
1994
1996
1998
2000
2002
2004
2006
2008
2010
-10
-5
0
5
10
15
20
India China Brazil
2.13.7
5.5 5.94.7
6.6 5.9
8.7
-10
-5
0
5
10
15
1970
-197
4
1976
-197
9
1980
-198
4
1985
-198
9
1990
-199
4
1995
-199
9
2000
-200
4
2005
-201
0
China Brazil South Africa Russian Federation India

15
India and Latin America and the Caribbean: opportunities and challenges in trade and investment relations
Figure I.9 CHINA AND INDIA: SHARE OF EXPORTS AND IMPORTS (GOODS AND SERVICES) IN GDP, 1970-2010(Percentages)
Source: Economic Commission for Latin America and the Caribbean (ECLAC), on the basis of World Bank, World Development Indicators 2011
Private consumption has long been the largest component ■of GDP in India, although its share has fallen from 75% in 1980 to 60% in 2010. By contrast, the share of gross fixed capital formation has risen significantly over the last forty years, though it remains lower as a proportion of GDP than in China. In India, the contribution of net exports to GDP is negative, in strong contrast to China. A boom in the services sector has raised its share of GDP ■from 38% during the 1970s to 53% in the 2000s. The industrial sector has maintained a share slightly over 25% of GDP. Although the economy’s dependence on agriculture has declined in recent years, the sector still absorbs 56% of the total labour force. The economy is also becoming more exposed to external ■trade, with the share of exports (goods and services) rising from 7% in 1990 to 19% in 2010. Compared with China, India’s trade openness is still modest in terms of exports; however, imports (goods and services) now account for a similar proportion of GDP in India as in China.
The Indian economy has seen significant structural changes. The share of services in GDP has increased, while that of agriculture has declined. India’s trade-to-GDP ratio has increased considerably in the past decade, but its level of trade integration remains low compared with that of other Asian countries
Figure I.8 INDIA: GDP BY SECTOR, 1960-2010(Percentages)
Source: Economic Commission for Latin America and the Caribbean (ECLAC), on the basis of World Bank, World Development Indicators 2011
Figure I.7 INDIA: GDP BY EXPENDITURE, 1970-2010(Percentages)
Source: Economic Commission for Latin America and the Caribbean (ECLAC), on the basis of World Bank, World Development Indicators 2011
0
5
10
15
20
25
30
35
40
45
1970
1972
1974
1976
1978
1980
1982
1984
1986
1988
1990
1992
1994
1996
1998
2000
2002
2004
2006
2008
2010
China exports China imports India exports India imports
-20
0
20
40
60
80
100
1970-1979 1980-1989 1990-1999 2000-2010
Change in inventories Net exports Private consumption
Government cosumption Gross fixed capital formation
0
10
20
30
40
50
60
70
80
90
100
1960-1969 1970-1979 1980-1989 1990-1999 2000-2010
Services Industry Agriculture
5.

16
Economic Commission for Latin America and the Caribbean (ECLAC)
When measured in terms of PPP, a major source of economic ■growth, and one that has been gaining ground over the last ten years, for India has been total factor productivity (TFP). For example, total factor productivity accounted for 34% of the 8.4% growth rate recorded for the period 2004-2008, only slightly less than the contribution of non-ICT capital. Latin American experience in this area has been quite meagre ■in comparison with that of Eastern Europe and developing Asia. The TFP performance of Brazil has not been very strong and in Mexico, the contribution of TFP to overall growth in 2004-2008 was even negative. The above indicates that economic growth in India is being ■driven increasingly by improvements in quality rather than increases in the quantity of capital and labour inputs.
Total factor productivity has been a major source of economic growth for India, whereas Latin American performance in this area has been disappointing
Figure I.10 INDIA: SOURCES OF GROWTH, 1989-2008(Percentages)
Source: Economic Commission for Latin America and the Caribbean (ECLAC), on the basis of Dale W. Jorgenson and Khuong M. Vu, “Potential Growth of the World Economy”, Journal of Policy Modeling, vol. 32, Issue 5, September-October 2010.
Figure I.11 SELECTED ASIAN AND LATIN AMERICAN COUNTRIES: SOURCES OF GROWTH, 2004-2008(Percentages)
Source: Economic Commission for Latin America and the Caribbean (ECLAC), on the basis of Dale W. Jorgenson and Khuong M. Vu, “Potential Growth of the World Economy”, Journal of Policy Modeling, vol. 32, Issue 5, September-October 2010.
5.0
5.7
6.2
8.4
0.0 2.0 4.0 6.0 8.0 10.0 12.0
1989-1995
1995-2000
2000-2004
2004-2008
ICT Capital Non-ICT capital
Labour quality Labour hours Total factor priductivity
5.7
3.2
7.0
4.4
5.0
10.4
8.4
-2 0 2 4 6 8 10 12
Indonesia
Mexico
Russia, Fed.
Brazil
Korea, Rep. of
China
India
ICT Capital Non-ICT Capital
Labour hours Labour quantity Total factor productivity
6. 7.

17
India and Latin America and the Caribbean: opportunities and challenges in trade and investment relations
Figure I.12 BRICS: FISCAL DEFICIT, 2000-2010(Percentages of GDP)
Source: Economic Commission for Latin America and the Caribbean (ECLAC), on the basis of International Monetary Fund (IMF), World Economic Outlook database, September 2011.
The Indian economy is not free from problems. The central ■Government has a difficult task of attenuating rising fiscal deficit and the resulting public debt. Among the BRICS countries, India shows the highest level of fiscal deficit when measured by comparing central government revenues with expenditures as percentages of GDP. Unlike China and the Russian Federation, India runs a ■chronic current account deficit, which is continuing to grow in size as a percentage of GDP. Inflation, a constant source of concern in India, remains at the ■highest level among the five BRICS countries considered.
India’s central Government has a difficult task of maintaining high growth rates with a twin deficit and relatively high inflation
-15
-10
-5
0
5
10
2000
2001
2002
2003
2004
2005
2006
2007
2008
2009
2010
India Brazil China RussianFederation
South Africa
Figure I.13 BRICS: CURRENT ACCOUNT DEFICIT, 2000-2010(Percentages of GDP)
Source: Economic Commission for Latin America and the Caribbean (ECLAC) on the basis of International Monetary Fund (IMF), World Economic Outlook database, September 2011.
-10
-5
0
5
10
15
20
2000
2001
2002
2003
2004
2005
2006
2007
2008
2009
2010
India Brazil China RussianFederation
South Africa
Figure 1.14 BRICS: INFLATION, 2000-2010(Percentages)
Source: Economic Commission for Latin America and the Caribbean (ECLAC) on the basis of International Monetary Fund (IMF), World Economic Outlook database, September 2011.
-5
0
5
10
15
20
25
2000
2001
2002
2003
2004
2005
2006
2007
2008
2009
2010
India Brazil China RussianFederation
South Africa
7.

18
Economic Commission for Latin America and the Caribbean (ECLAC)
Table I.3 WORLD MERCHANDISE TRADE, 2010(Billions of dollars and percentages)
Country/Region Exports Imports
China 1 578 10.4 1 368 8.9Russian Federation 400 2.6 248 1.6India 216 1.4 323 2.1Brazil 202 1.3 191 1.2BRIC total 2 396 15.7 2 130 13.9ASEAN 1 052 6.9 950 6.2Newly industrialized economies 1 111 7.3 1 103 7.2Japan 770 5.1 693 4.5Asia total 4 511 29.6 2 746 17.9United States 1 278 8.4 2 681 17.4European Union 5 147 33.8 5 337 34.7Latin America and the Caribbean 872 5.7 887 5.8World 15 238 100.0 15 376 100.0
Source: Economic Commission for Latin America and the Caribbean (ECLAC), on the basis of World Trade Organization (WTO) press release, “World Trade 2010. Prospects of a 2011”, Press/628, April 2011.Note: The newly industrialized economies include Hong Kong Special Administrative Region of China, Republic of Korea, Singapore and Taiwan Province of China.
Compared with its share in world GDP, India’s participation ■in world merchandise trade remains small, accounting for 1.4% and 2.1% of world exports and imports, respectively, in 2010. The country ranked twentieth in exports that year. Its export value was similar to that of Brazil, but lower than that of Mexico. India’s share in world merchandise imports was slightly ■larger than in exports. With an import value of US$ 323 billon, India ranked thirteenth in the world in 2010. The Latin American and Caribbean region accounted for 5.7% ■and 5.8% of world exports and imports, respectively.
Despite its increasing volume, India is still at an incipient stage of merchandise trade expansion
Figure I.15 BRICS AND REST OF THE WORLD: SHARE IN WORLD MERCHANDISE TRADE, 2010(Percentages of world total)
A. Exports
B. Imports
Source: Economic Commission for Latin America and the Caribbean (ECLAC), on the basis of World Trade Organization (WTO) press release, “World Trade 2010. prospects of a 2011”, Press/628, April 2011.
8. 9.
China10.4%
India 1.4% Brazil
1.3% Russian Federation
2.6%
South Africa 0.5%
Rest 83.7%
China9.1%
India 2.1%
Brazil 1.2% Russian
Federation 1.6%
South Africa 0.6%
Rest 85.4%

19
India and Latin America and the Caribbean: opportunities and challenges in trade and investment relations
India exported US$ 123 billion of services in 2010, more ■than double the value of its services exports in 2005. The county was the world’s tenth largest services exporter in 2010. India’s 3.3% share in world services exports was almost equal to that of Latin American and the Caribbean. India’s annualized growth rate for the period 2005-2010 was almost 19%, the highest rate among the countries and regions under consideration.
By contrast, India plays a much more important role in world services trade
Table I.4 WORLD TRADE IN SERVICES BY VALUES, ANNUALIZED GROWTH RATES AND SHARES IN WORLD TOTAL, 2005-2010(Billions of dollars and percentages)
A. Exports B. Imports
2005 2010Annualized
growth rates2005-2010
Share in world total
2010
United States 353 518 8.0 14.0
European Union 1 181 1 569 5.8 42.5
Latin America and the Caribbean 86 127 8.1 3.4
Brazil 15 30 15.3 0.8
Mexico 16 15 -0.8 0.4
Commonwealth of Independent States 41 79 13.9 2.1
Russian Federation 25 44 12.2 1.2
Africa 56 85 8.7 2.3
South Africa 11 14 4.3 0.4
Middle East 65 97 8.4 2.6
Asia 539 975 12.6 26.4
China 74 146 14.7 4.0
India 52 123 18.8 3.3
World 2 496 3 693 8.1 100.0
2005 2010Annualized
growth rates2005-2010
Share in world total
2010
United States 271 358 5.8 10.2
European Union 1 072 1 404 5.6 40.0
Latin America and the Caribbean 92 136 8.2 3.9
Brazil 22 60 21.7 1.7
Mexico 21 22 1.3 0.6
Commonwealth of Independent States 59 107 12.7 3.1
Russian Federation 38 70 13.2 2.0
Africa 72 139 14.1 4.0
South Africa 12 18 8.8 0.5
Middle East 97 184 13.6 5.2
Asia 571 958 10.9 27.3
China 83 192 18.2 5.5
India 47 116 19.9 3.3
World 2 373 3 511 8.2 100.0
Source: Economic Commission for Latin America and the Caribbean (ECLAC), on the basis of World Trade Organization (WTO) Trade Statistics database.
India’s services imports reached US$ 116 billion, equivalent ■to 3.3% of world services imports in 2010. The country was ranked seventh in world services imports that year. India’s imports grew at a high rate, but slightly below that registered by Brazil. The import value of India was US$ 20 billion lower than that of Latin America and the Caribbean as a whole.Among the five BRICS countries, India ranks second behind ■China in both exports and imports.
9.

20
Economic Commission for Latin America and the Caribbean (ECLAC)
C. BREAKDOWN OF OTHER SERVICES, 2000, 2005 AND 2010
(Percentages of the “other services” total) India’s trade in services continues to expand, accounting ■for 35% and 26% of total exports and imports (merchandise and services), respectively. The major growth engine of service exports has been the ■“other services” category, growing at a much faster rate than the other two major categories, travel and transport.Among the different subsectors within “other services”, ■the most dynamic has been the computer and information category. Together with the other business services category, these two subsectors account for 90% of the “other services” total. Indian companies operating in these areas, especially ■in business process outsourcing (BPO) and knowledge process outsourcing (KPO), have become India’s major investors abroad.
Over the years, trade in services has become an engine of growth for India’s external sector Figure I.16 INDIA: TRADE IN SERVICES
A. SHARE OF SERVICES IN TOTAL TRADE, 1990-2010
(Percentages of exports and imports) B. BREAKDOWN OF SERVICES EXPORTS BY MAJOR SECTORS, 1990-2010
(Millions of dollars)
Source: Economic Commission for Latin America and the Caribbean (ECLAC), on the basis of International Monetary Fund (IMF), Balance of Payments Statistics, 2011.
0
5
10
15
20
25
30
35
40
1990
1991
1992
1993
1994
1995
1996
1997
1998
1999
2000
2001
2002
2003
2004
2005
2006
2007
2008
2009
2010
Share in total exports Share in total imports
0
20 000
40 000
60 000
80 000
100 000
120 000
140 000
1990
1991
1992
1993
1994
1995
1996
1997
1998
1999
2000
2001
2002
2003
2004
2005
2006
2007
2008
2009
2010
Other services Travel Transport
0
10
20
30
40
50
60
70
80
90
100
2000 2005 2010
Government services Personal, cultural and recreationalOther business services Royalties and license feesComputer and information FinancialInsurance Construction
10. 11.

21
India and Latin America and the Caribbean: opportunities and challenges in trade and investment relations
Table I.5 INDIA: EXPORTS AND IMPORTS, BY MAJOR REGIONS, ANNUAL AVERAGE, APRIL 2009-MARCH 2010 AND APRIL 2010-MARCH 2011 (Millions of dollars and percentages of national total)
Exports Imports
European Union 41 424 19.3 41 487 12.6Other Europe 3 168 1.5 21 960 6.7Africa 13 294 6.2 23 389 7.1North America 23 784 11.1 20 576 6.3Latin America and the Caribbean 8 223 3.8 12 305 3.7Asia 118 718 55.2 200 760 61.0 ASEAN 22 696 10.6 28 203 8.6Commonwealth of Independent States 2 276 1.1 5 884 1.8
Unspecified 4 057 1.9 2 711 0.8
Total 214 944 100.0 329 071 100.0
Source: Economic Commission for Latin America and the Caribbean (ECLAC), on the basis of the Ministry Commerce and Industry, Export Import Data Bank [online] http://commerce.nic.in/eidb/irgn.asp [Date of reference: 10 November 2011].Abbreviation: ASEAN, Association of Southeast Asian Nations.
Asia is India’s largest trading partner both in exports and imports, while the role of Latin America and the Caribbean as a trading partner remains modest
The annual average value of Indian exports and imports ■during the fiscal years 2009 and 2010 reached US$ 215 billion and US$ 329 billion, respectively.Asia is India’s largest trading region, accounting for 55% of ■exports and 61% of imports during the same period.The European Union represented almost 19% and 13% of ■the country’s exports and imports, respectively. The United States had a much lower share in India’s exports and imports than the European Union.Latin America and the Caribbean is neither an important ■export destination nor a point of origin for India’s imports. In each, the region’s share was less than 4%. This compares quite unfavourably with Africa’s share, which was almost double that of Latin American and Caribbean in both cases.Among the developing regions, the countries of the ■Association of Southeast Asian Nations (ASEAN) have become a significant trade partner for India, accounting for 11% of exports and 9% of imports, during the two fiscal years under consideration.
11.

22
Economic Commission for Latin America and the Caribbean (ECLAC)
Table I.6 BRICS, SELECTED ECONOMIES AND WORLD: INWARD AND OUTWARD FDI STOCK, DECEMBER 2010(Millions of dollars and percentages)
Inward Outward
China 578 818 3.0 297 600 1.5India 197 937 1.0 92 407 0.5Brazil 472 579 2.5 180 949 0.9Russian Federation 423 150 2.2 433 655 2.1BRIC Total 1 290 306 6.7 713 368 3.5South Africa 132 396 0.7 81 127 0.4BRICS 1 296 002 6.8 714 952 3.5Developing economies 5 951 203 31.1 3 131 845 15.3World 19 140 603 100.0 20 408 257 100.0
Source: Economic Commission for Latin America and the Caribbean (ECLAC), on the basis of United Nations Conference on Trade and Development (UNCTAD) World Investment Report 2011 [online] www.unctad.org/wir or www.unctad.org/fdistatistics.
Historically, India has not relied heavily on FDI as a source of gross fixed capital formation; however, in recent years, the country has become not only a major recipient but also a significant investor worldwide
Table I.7 INDIA, SELECTED ECONOMIES AND WORLD: INWARD AND OUTWARD FDI FLOWS, 1995-2010(Millions of dollars and percentages)
1995-2004Annual average
2005-2007Annual average
2008-2010Annual average
2008-2010Share in total developing economies
2008-2010Share in
World total
India Inward 3 789 17 766 34 278 5.9 2.5 Outward 824 11 501 16 651 5.5 1.1China Inward 46 475 76 213 102 349 17.6 7.4 Outward 2 976 18 630 58 893 19.5 4.0Brazil Inward 19 174 22 824 39 815 6.9 2.9 Outward 1 885 12 595 7 297 2.4 0.5Korea, Rep. of Inward 5 075 4 855 7 594 1.3 0.5 Outward 3 745 12 418 18 893 6.2 1.3Taiwan Prov. of China Inward 2 165 5 606 3 576 0.6 0.3 Outward 5 022 8 178 9 116 3.0 0.6Singapore Inward 12 980 27 780 20 835 3.6 1.5 Outward 7 752 20 910 12 649 4.2 0.9Argentina Inward 7 351 5 759 6 693 1.2 0.5 Outward 1 269 1 751 1 022 0.3 0.1Mexico Inward 17 097 24 636 20 103 3.5 1.4 Outward 1 549 6 830 7 507 2.5 0.5Developing economies Inward 199 794 444 940 580 716 100.0 41.8 Outward 74 301 214 332 302 402 100.0 20.6World Inward 718 542 1 471 784 1 390 934 100.0 Outward 703 779 1 487 426 1 468 124 100.0
Source: Economic Commission for Latin America and the Caribbean (ECLAC), on the basis of United Nations Conference on Trade and Development (UNCTAD) World Investment Report 2011 [online] www.unctad.org/wir or www.unctad.org/fdistatistics.
India accounted for only 1.0% and 0.5% of world inward ■and outward FDI stock, respectively, in 2010, which was much lower than the shares of Brazil, China and the Russian Federation. However, India’s FDI flows have increased substantially in ■recent years. Annual average inflows in 2008-2010 reached US$ 34 billion, almost 10 times the annual average amount received in 1995-2004. At the same time, India has been increasing its FDI abroad: in the period 2008-2010, annual average outward FDI totalled US$ 17 billion, much more than the amount invested abroad by Brazil and Mexico.
12. 13.

23
India and Latin America and the Caribbean: opportunities and challenges in trade and investment relations
Traditionally, developed economies have been the main ■recipients of India’s FDI abroad. In the period 2002-2009, Europe received more than US$ 30 billon of India’s outward FDI, absorbing more than 40% of the total.In recent years, developing economies as a whole have ■become important destinations for India’s FDI abroad, accounting for almost half of outflows during the 2000s.
Although developing countries are receiving an ever larger proportion of India’s outward FDI, developed economies have, until recently, been India’s main outward FDI hosts. However, even among the former, Latin America and the Caribbean has not been a favoured destination for those investment flows
Among developing regions, developing Asia is increasing ■its share as a host region of India’s FDI, absorbing almost 30% of total FDI in recent years. Latin America and the Caribbean received almost 4% of ■India’s FDI abroad between 2002 and 2010.
Table I.8 INDIA: GEOGRAPHICAL DISTRIBUTION OF OUTWARD FDI FLOWS,a 1996-2010b
(Millions of dollars and percentages)
1996-2002 2002-2009 2009-2010 1996-2002 2002-2009 2009-2010
Developed economies 5 267 39 487 3 384 70.0 52.0 31.9
Europe 827 30 715 2 134 11.0 40.4 20.1
North America 1 546 7 185 1 191 20.5 9.5 11.2
Other developed economies 248 1 587 59 3.3 2.1 0.6
Developing economies 36 498 7 239 - 48.0 68.1
Africa 750 9 321 1 521 10.0 12.3 14.3
Asia and Oceania 1 544 21 032 4 923 20.5 27.7 46.3
South-east Europe/CIS 1 787 3 448 76 23.7 4.5 0.7
Latin America and the Caribbean 821 2 697 718 10.9 3.5 6.8
World 7 525 75 985 10 623 100.0 100.0 100.0
Source: Adapted from Premila Nazareth Satyanand and Pramila Raghavendran, “Outward FDI from India and its policy context”, Columbia, FDI Profiles, Vale Columbia Center, 22 September 2010. Abbreviation: CIS, Commonwealth of Independent States.
a This table relies on investment approval data because the Government of India does not publish a geographical breakdown of outward FDI flows. b Data are by fiscal year (1 April to 31March).
13.

24
Economic Commission for Latin America and the Caribbean (ECLAC)
Prior to the 1990s, India’s outward FDI flows were largely ■limited to its neighbouring developing countries. Such investments were viewed by the Government of India as its contribution to South-South cooperation. During the 1980s, the share of India’s total outward FDI ■going to developing countries stood at 76%. However, this changed in the early 1990s. The share of developed countries rose continuously from 24% in the 1980s to 44% in the 1990s, and climbed further to 64% in 2000-2007.
The drivers of India’s outward foreign direct investment in recent years have been mergers and acquisitions in developed economies
Table I.9 INDIA: TOP 15 OUTWARD FDI DESTINATIONS, 1996-2002 AND 2002-2009a, b
(Billions of United States dollars and percentages)
1996-2002 2002-2009
Destination Outflows authorized Share Destination Outflows authorized Share
Russian Federation 1.7 23.8 Singapore 14.2 20.8United States 1.5 20.5 Netherlands 10.6 15.4British Virgin Islands 0.8 10.3 Mauritius 5.6 8.1Mauritius 0.6 8.2 Channel Islands 5.4 7.9Hong Kong SAR 0.4 5.9 United Kingdom 5.2 7.6United Kingdom 0.4 5.5 United States 5.1 7.4Bermuda 0.2 3.1 Cyprus 4.7 6.8Viet Nam 0.2 3.0 United Arab Emirates 2.1 3.1Oman 0.2 2.7 Russian Federation 1.4 2.0Netherlands 0.1 2.1 Sudan 1.2 1.7Singapore 0.1 2.0 Switzerland 1.1 1.6United Arab Emirates 0.1 1.5 China 0.9 1.3Austria 0.1 1.0 British Virgin Islands 0.9 1.2Nepal 0.1 0.9 Egypt 0.8 1.2Sri Lanka 0.1 0.8 Denmark 0.8 1.2
Source: Adopted from Premila Nazareth Satyanand and Pramila Raghavendran, “Outward FDI from India and its policy context”, Columbia, FDI Profiles, Vale Columbia Center, 22 September 2010.
a Rankings are based on the cumulative stock of outward investment approvals for each period. b Data are by fiscal year (1 April to 31 March).
The sharp rise in India’s outward FDI to developed ■regions was also reflected in its overseas mergers and acquisitions. During the period from 2000 to March 2008, Indian FDI flows into developed countries in the form of acquisitions stood at US$ 47.4 billion, accounting for 80% of the total acquisitions made by Indian companies. A total of 306 Indian firms were engaged in acquisitions in 28 developed countries.
14. 15.

25
India and Latin America and the Caribbean: opportunities and challenges in trade and investment relations
Over the years, manufacturing has been the leading sector ■for India’s outward FDI, though in the last half of the past decade, the predominance of manufacturing was slowly displaced by services.While the pharmaceutical, consumer electronics and ■automotive sectors accounted for the bulk of manufacturing FDI abroad in the first half of the decade, the second half saw a concentration in metals, energy and natural resource investments, and consumer goods and foods and beverages. Similarly, while information and communications technology ■initially dominated services, there has been a rising trend in investment in other services sectors, such as financial and insurance services, entertainment and broadcasting, construction and telecommunications. Since 2000, Indian firms have tended to use cross-border ■mergers and acquisitions as the main vehicle for entry into developed economies and greenfield investments as a way into developing countries. Firms systematically acquire leading developed country firms to boost domain expertise, technological competitiveness, market size and brand recognition. Energy and mineral security have been the major driving ■forces of Indian firms’ investments in developing countries, although many telecommunications, consumer goods, food, information and communications technology, metal and power firms are now using mergers and acquisitions to obtain market size or secure raw materials in these economies.
Manufacturing is the primary destination sector for India’s FDI overseas, though its share has been declining in recent years
Figure I.17 INDIA: DISTRIBUTION OF OUTWARD FDI FLOWS BY MAJOR SECTORSa, b
(Percentages)
A. Cumulative 2000/2001-2004/2005
B. Cumulative 2005/2006-2009/2010
Source: Adapted from Premila Nazareth Satyanand and Pramila Raghavendran, “Outward FDI from India and its policy context”, Columbia, FDI Profiles, Vale Columbia Center, 22 September, 2010.
a These figures use investment approval data. b Data are by fiscal year (1 April to 31 March).
Manufacturing 64%
Financial services
1%
Non-financial services
27%
Trade 4%
Others4%
Manufacturing 41%
Financial services
1%
Non -financial services
19%
Trade 33%
Others6%
15.

26
Economic Commission for Latin America and the Caribbean (ECLAC)
1. India’s outward FDI is primarily driven by markets and private companies, while China’s outward FDI is mainly government-led
Most Indian outward FDI is undertaken by publicly-listed, ■private firms and, as yet, only a handful of Indian public-sector firms have internationalized.Unlike State-driven Chinese FDI outflows, Indian outward ■FDI has chiefly been led by leading Indian multinationals owned by large Indian business houses and driven by markets, with little coordination with the Government, except in the case of a few public-sector firms operating in the energy sector.
2. China’s outward FDI mainly goes to developing countries and mining sectors while India’s goes to developed economies and manufacturing and, increasingly, services sectors
The growing importance of developed countries as a host ■to Indian outward FDI can be attributed to the emergence of the knowledge-based segment of the Indian economy, including, for example, the pharmaceuticals and software development industries.The non-financial services and mining sectors accounted for the ■largest shares of Chinese outward FDI, while manufacturing accounted for a relatively small share.
3. China has advantages in its government-led strategy and economic diplomacy, whereas India has advantages in enterprise governance and management
Many of India’s family-run companies have been ■involved in outward ventures far longer than their Chinese counterparts and have thus developed the
requisite knowledge and business acumen to deal with the complex issues relating to the management of cross-border alliances.Indian outward FDI is driven fundamentally by inherent ■incentives and innovations, global growth, competition and business opportunities.Chinese local and private enterprises still lack sufficient ■capital and the technological capabilities to invest abroad. A priority in the Chinese outward FDI strategy has been to secure access to strategic assets and natural resources by supporting large State-owned enterprises to invest abroad.
4. Mergers and acquisitions will remain an active component of both countries’ overseas resource acquisition strategy
For many latecomers and less technologically advanced ■firms, outward FDI in the form of overseas mergers and acquisitions provides an important means to access advanced proprietary technology, immobile strategic assets (such as brands and local distribution networks) and other capabilities required for survival and growth in a globalizing world economy. Many Chinese and Indian firms engaged in overseas ■mergers and acquisitions have been motivated to acquire skills, technology and widen their distribution networks overseas, in addition to achieving the objective of accessing overseas markets.It is not just large conglomerates that are active investors ■abroad. In the period 2000-2008, 34% of all Indian mergers and acquisitions abroad were made by smaller firms, even though they accounted for just 8% of the total investment value and were less geographically diverse than their larger counterparts.
There are substantive differences in outward FDI between China and India 16. 17.

27
India and Latin America and the Caribbean: opportunities and challenges in trade and investment relations
Table I.10 SHARE OF CHINA AND INDIA IN GLOBAL PRODUCTION, CONSUMPTION AND IMPORTS OF AGRICULTURAL PRODUCTS, 2008/2009(Millions of metric tons and percentages)
Production
Product World China India China India
Wheat 683.3 112.5 78.6 16.5 11.5Corn 797.8 165.9 19.7 20.8 2.5Rice 448.2 134.3 99.2 30.0 22.1Soybean 212.0 15.5 9.1 7.3 4.3Soybean meal 151.4 32.5 5.8 21.4 3.8Soybean oil 35.7 7.3 1.3 20.5 3.6Cotton 23.6 8.1 4.9 34.2 20.8Sugar 151.1 13.6 16.0 9.0 10.6
Consumption
Product World China India China India
Wheat 635.8 105.0 72.5 16.5 11.4Corn 778.7 155.0 17.0 19.9 2.2Rice 437.5 131.0 93.2 29.9 21.3Soybean 220.8 51.4 8.5 23.3 3.8Soybean meal 151.9 31.7 2.0 20.8 1.3Soybean oil 35.9 9.5 2.3 26.4 6.4Cotton 22.7 8.8 4.0 38.8 17.6Sugar 161.8 14.9 23.8 9.2 14.7
Imports
Product World China India China India
Wheat 136.9 0.5 0.0 0.4 0.0Corn 82.4 0.1 0.0 0.1 0.0Rice 27.2 0.3 0.0 1.3 0.0Soybean 77.2 41.1 0.0 53.3 0.0Soybean meal 51.2 0.2 0.0 0.4 0.0Soybean oil 8.9 2.5 1.1 27.9 11.9Cotton 30.0 7.0 0.8 23.3 2.7Sugar 48.2 1.1 2.8 2.2 5.8
Source: United States Department of Agriculture; Economist Intelligence Unit, World Commodity Forecasts: industrial raw materials, January 2010; Economist Intelligence Unit, World Commodity Forecasts: food, feedstuffs and beverages, November 2010.
Though to a lesser degree than China, India is a major importer and consumer of the types of primary products of which Latin America and the Caribbean is a major producer
Table I.11 SHARE OF CHINA AND INDIA IN GLOBAL PRODUCTION, CONSUMPTION AND IMPORTS OF MINERALS AND METALS, 2008/2009(Millions of metric tons and percentages)
Production
Product World China India China India
Alminium 36 891.2 12 846.0 1 478.6 34.8 4.0Copper 18 606.7 4 109.5 721.4 22.1 3.9Lead 8 903.7 3 707.9 137.7 41.6 1.5Nickel 1 326.7 246.7 - 18.6 0.0Tin 333.0 134.5 3.6 40.4 1.1Zinc 11 465.4 4 356.7 615.5 38.0 5.4Primary steel 1 219.7 567.8 56.6 46.6 4.6Crude oil 82.3 3.8 0.8 4.6 1.0
Consumption
Product World China India China India
Aluminium 34 581.5 14 275.7 1 478.1 38.7 4.3Copper 18 256.4 7 144.1 551.5 38.4 3.0Lead 8 951.4 3 859.9 180.0 43.4 2.0Nickel 1 305.6 541.3 24.5 40.8 1.9Tin 321.5 143.0 9.0 44.5 2.8Zinc 11 255.6 4 888.3 532.2 43.4 4.7Primary steel 1 300.7 452.9 53.6 34.8 4.1Crude oil 83.7 8.2 3.0 9.8 3.6
Imports
Product World China India China India
Aluminium 17 250.3 1 739.8 257.7 10.1 1.5Copper 7 970.0 3 185.0 15.5 40.0 0.2Lead 1 734.5 175.6 116.3 10.1 6.7Nickel 638.8 247.0 17.9 38.7 2.8Tin 254.0 20.5 6.1 8.1 2.4Zinc 3 660.1 670.2 93.6 18.3 2.6Iron ore 933.2 444.0 0.6 47.6 0.1Sponge iron 24.0 0.4 0.0 1.5 0.1Crude oila 44.5 3.6 2.5 8.2 5.6
Source: United States Department of Agriculture; Economist Intelligence Unit, World Commodity Forecasts: industrial raw materials, January 2010; Economist Intelligence Unit, World Commodity Forecasts: food, feedstuffs and beverages, November 2010.
a Millions of barrels a day. The figures refer to 2008: US Energy Information Administration , Independent Statistics and Analysis [online] http://www.eia.gov/.
India is a major global producer and consumer of wheat, ■rice, cotton and sugar, and its share in world imports of soybean oil is quite high. India’s share in world production, consumption and imports ■of minerals and metals, and crude oil is much lower than that of agricultural products. If the sustained economic growth that the country has shown ■over the last two decades continues, India’s consumption
and imports of the type of commodities of which Latin America and the Caribbean is a major producer should increase over time. However, India is trying to diversify its suppliers and in this regard, Latin America and the Caribbean has to compete with other regions of the world to supply primary products to India.
17.

28
Economic Commission for Latin America and the Caribbean (ECLAC)
In addition to the dominant positions that China has ■consolidated in selected International Standard Industrial Classification (ISIC) industrial sectors, Brazil and India, and to a lesser extent, the Russian Federation, have also become major producers of manufactures worldwide.When measured in terms of manufacturing value-added, ■at constant 2000 prices, India ranks quite highly among the top 15 producing countries in sectors such as textiles
(ISIC division code 17), chemicals and chemical products (ISIC division code 24), basic metals (ISIC division code 27) and electrical machinery and apparatus (ISIC division code 31).India has a solid industrial base in many sectors, pointing to ■future trade and investment opportunities, on the one hand, and competition in domestic and third country markets, on the other, for Latin America and the Caribbean.
India is a major world producer of industrial goodsTable I.12 BRICS: RANKING AMONG WORLD TOP 15 PRODUCERS IN SELECTED INTERNATIONAL STANDARD INDUSTRIAL CLASSIFICATION (ISIC REV. 3) DIVISIONS AND SHARE IN WORLD TOTAL VALUE-ADDED, 2007(World total value-added at constant 2000 prices and percentages)
ISIC Product description Ranking China (Percentages)
Ranking Brazil (Percentages)
Ranking India (Percentages)
Ranking Russian Federation
(Percentages)
15 Food and beverages 2 14.3 9 2.6 14 1.716 Tobacco products 1 51.4 12 0.9 17 Textiles 1 36.7 4 4.2 18 Wearing apparel, fur 1 28.7 8 2.0 19 Leather, leather products and footwear 1 39.1 9 2.2 10 2.0 20 Wood products (except furniture) 2 8.9 7 3.7 21 Paper and paper products 3 12.9 12 2.1 15 1.522 Printing and publishing 5 3.8 23 Coke, refined petroleum products and nuclear fuel 2 15.7 4 6.0 10 1.8 24 Chemicals and chemical products 2 3.5 12 1.9 7 3.5 25 Rubber and plastics products 1 18.3 9 2.2 15 1.4 26 Non-metalic mineral products 1 16.1 9 2.5 13 2.1 12 2.227 Basic metals 1 36.3 14 1.3 6 2.9 7 2.328 Fabricated metal products 4 9.4 9 2.4 29 Machinery and equipment n.e.c. 2 15.9 10 1.6 12 1.4 11 1.530 Office, accounting and computing machinery 7 3.2 9 1.1 15 0.3 31 Electrical machinery and apparatus n.e.c. 1 30.8 7 2.0 5 3.1 15 0.832 Radio, television and communication equipment 3 7.2 10 0.2 33 Medical, precision and optical instruments 4 5.1 8 2.4 6 4.434 Motor vehicles, trailers and semi-trailers 13 1.5 12 1.6 35 Other transport equipment 1 35.9 3 5.6 10 2.4 13 1.036 Furniture, manufacturing n.e.c. 2 20.7 11 1.4
Source: United Nations Industrial Development Organization (UNIDO), Industrial Statistical Yearbook, 2009.
18. 19.

29
India and Latin America and the Caribbean: opportunities and challenges in trade and investment relations
The list of 31 industrial sectors whose apparent consumption ■reached the threshold of US$ 5 billion in 2007 includes a series of industrial activities which might be conducive to future trade and investment expansion between India and Latin America and the Caribbean.The list includes sectors such as basic and non-ferrous ■metals, basic chemicals, television and radio transmitters, and office, accounting and computing machinery, whose import levels as a percentage of apparent consumption are already high.
India’s domestic demand presents trade and investment opportunities in a number of sectors of the manufacturing industry for the regionTable I.13INDIA: SHARE OF IMPORTS IN APPARENT CONSUMPTION IN SELECTED INTERNATIONAL STANDARD INDUSTRIAL CLASSIFICATION (ISIC REV. 3) MANUFACTURING CLASSES, 2007(United States dollars at current prices)
Ranking Industry (ISIC Rev. 3, four-digit class code) Total apparent consumption (US$ billions)
Imports as a percentage of apparent consumption
1 2320 - Refined petroleum products 91.2 12.42 2710 - Basic iron and steel 78.1 10.53 2720 - Basic precious and non-ferrous metals 34.9 62.54 1514 - Vegetable and animal oils and fats 22.5 11.55 1711 - Textile fibre preparation; textile weaving 22.4 5.76 3410 - Motor vehicles 22.3 3.17 2412 - Fertilizers and nitrogen compounds 16.8 26.68 2423 - Pharmaceuticals, medicinal chemicals, etc. 15.4 12.29 3430 - Parts/accessories for automobiles 15.1 11.5
10 1531 - Grain mill products 14.5 0.111 2413 - Plastics in primary forms; synthetic rubber 13.6 23.512 2694 - Cement, lime and plaster 12.9 0.313 2411 - Basic chemicals, except fertilizers 12.2 74.214 2520 - Plastic products 12.2 8.515 3220 - Television and radio transmitters and apparatus for line telephony and line telegraphy 10.4 74.316 3110 - Electric motors, generators and transformers 10.3 17.717 3591 - Motorcycles 9.2 0.718 1542 - Sugar 9.2 0.019 1520 - Dairy products 8.3 0.420 2811 - Structural metal products 7.8 7.621 2101 - Pulp, paper and paperboard 7.5 19.022 3230 - TV and radio receivers and associated goods 6.9 30.123 3000 - Office, accounting and computing machinery 6.6 63.924 2429 - Other chemical products n.e.c. 6.3 28.825 3120 - Electricity distribution and control apparatus 6.3 20.526 1549 - Other food products n.e.c. 6.0 0.827 2929 - Other special purpose machinery 6.0 45.028 2424 - Soap, cleaning and cosmetic preparations 5.6 5.129 3130 - Insulated wire and cable 5.4 12.930 2911 - Engines and turbines (not for transport equipment) 5.3 11.431 2924 - Machinery for mining and construction 5.1 39.8
Source: Economic Commission for Latin America and the Caribbean (ECLAC), on the basis of United Netions Industrial Development Organization (UNIDO) Industrial Statistics Database, http://www.unido.org/ [Date of referencia: 9 November 2011].
The list also includes sectors that are subject to large domestic ■demand and that have been satisfied mostly by national production, but that are considered sectors of comparative advantage for Latin America and the Caribbean. For example, basic iron and steel, vegetable oils and fats, cement, basic chemicals, and others, provide future trade opportunities with India.
19.

30
Economic Commission for Latin America and the Caribbean (ECLAC)
Strong economic growth and targeted labour market and ■social policies have helped to reduce extreme poverty in India in the past 15 years. However, the country has not managed to achieve reductions on the scale of Brazil or China where the number of people living on less than US$ 1.25 per day has fallen by more than half. Nevertheless, poverty levels remain high, affecting approximately 5% of the population in Brazil, 16% in China, 18% in South Africa and 35% in India.
Where progress on overall poverty reduction has been made, ■income inequality has often increased. While Brazil has seen a remarkable reduction in income inequality since 2000, the levels have worsened in India, China, and South Africa. Depending on the definition used, informal employment ■represents between 15% and 30% of total employment in China, between 25% and 50% in Brazil and between 55% and 85% in India. India’s social expenditure as a percentage of GDP is lower ■than that of Brazil, China and South Africa.
In comparison with Latin American countries, India’s income distribution is favourable; however, the country has the highest poverty rate of all the BRICS
Figure I.18 SHARE OF INCOME BY QUINTILES(Percentages)
Source: Economic Commission for Latin America and the Caribbean (ECLAC), on the basis of World Bank, World Development indicators, 2010.
Figure 1.19 SELECTED ASIAN AND LATIN AMERICAN COUNTRIES: GINI INDEX IN RELATION TO PER CAPITA GDP, 2009
Source: Economic Commission for Latin America and the Caribbean (ECLAC), on the basis of World Bank, World Development indicators, 2010.
0 20 40 60 80 100
India (2005)
China (2005)
Indonesia (2009)
Brazil (2009)
Mexico (2008)
Highest 20% Second 20% Third 20% Fourth 20% Lowest 20%
AUS
CHN
IDN
JPN
KHM
KORLAO
MNG
MYS
NZL
PHL
SGPTHA
VTM
ARG
BOL
BRA
CHI
COL
CRI
DOM
ECUGTM
MEXNIC
PAN
PER
PRY
SLV UGY
VEN
IND
20
25
30
35
40
45
50
55
60
0 5 000 10 000 15 000 20 000 25 000 30 000 35 000 40 000 45 000 50 000G
ini i
ndex
Per capita GDP
20. 21.
31
India and Latin America and the Caribbean: opportunities and challenges in trade and investment relations
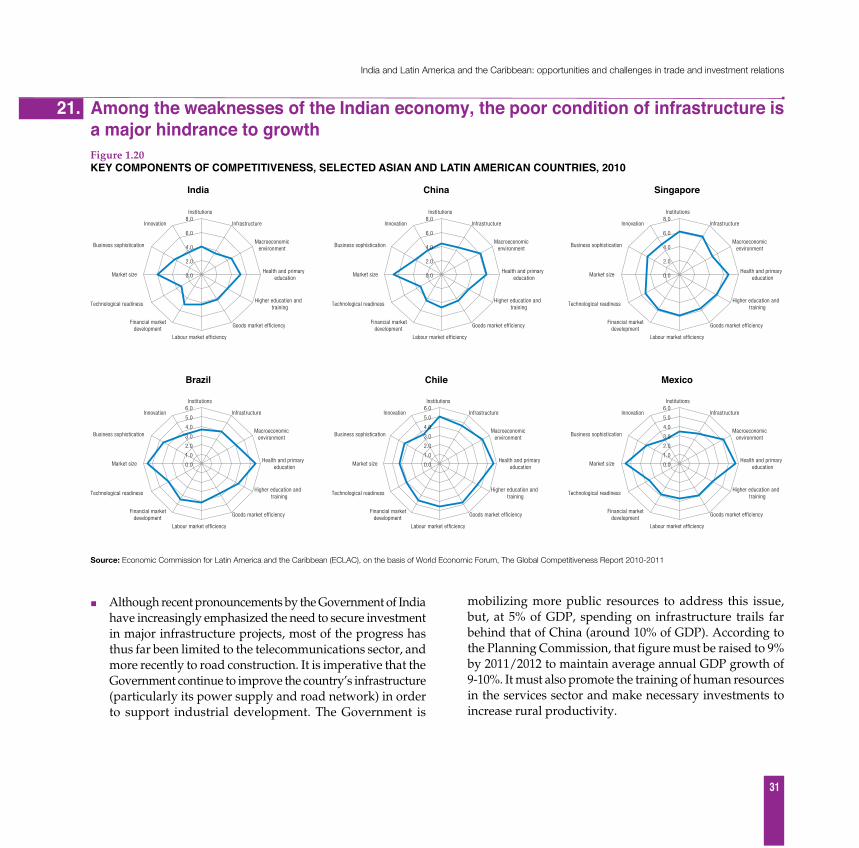
Although recent pronouncements by the Government of India ■have increasingly emphasized the need to secure investment in major infrastructure projects, most of the progress has thus far been limited to the telecommunications sector, and more recently to road construction. It is imperative that the Government continue to improve the country’s infrastructure (particularly its power supply and road network) in order to support industrial development. The Government is
mobilizing more public resources to address this issue, but, at 5% of GDP, spending on infrastructure trails far behind that of China (around 10% of GDP). According to the Planning Commission, that figure must be raised to 9% by 2011/2012 to maintain average annual GDP growth of 9-10%. It must also promote the training of human resources in the services sector and make necessary investments to increase rural productivity.
Among the weaknesses of the Indian economy, the poor condition of infrastructure is a major hindrance to growthFigure 1.20KEY COMPONENTS OF COMPETITIVENESS, SELECTED ASIAN AND LATIN AMERICAN COUNTRIES, 2010
India China Singapore
Brazil Chile Mexico
Source: Economic Commission for Latin America and the Caribbean (ECLAC), on the basis of World Economic Forum, The Global Competitiveness Report 2010-2011
0.0
2.0
4.0
6.0
8.0Institutions
Infrastructure
Macroeconomic environment
Health and primary education
Higher education and training
Goods market efficiency
Labour market efficiency
Financial market development
Technological readiness
Market size
Business sophistication
Innovation
0.0
2.0
4.0
6.0
8.0Institutions
Infrastructure
Macroeconomic environment
Health and primary education
Higher education and training
Goods market efficiency
Labour market efficiency
Financial market development
Technological readiness
Market size
Business sophistication
Innovation
0.0
2.0
4.0
6.0
8.0Institutions
Infrastructure
Macroeconomic environment
Health and primary education
Higher education and training
Goods market efficiency
Labour market efficiency
Financial market development
Technological readiness
Market size
Business sophistication
Innovation
0.0
1.0
2.0
3.0
4.0
5.0
6.0Institutions
Infrastructure
Macroeconomic environment
Health and primary education
Higher education and training
Goods market efficiency
Labour market efficiency
Financial market development
Technological readiness
Market size
Business sophistication
Innovation
0.0
1.0
2.0
3.0
4.0
5.0
6.0Institutions
Infrastructure
Macroeconomic environment
Health and primary education
Higher education and training
Goods market efficiency
Labour market efficiency
Financial market development
Technological readiness
Market size
Business sophistication
Innovation
0.0
1.0
2.0
3.0
4.0
5.0
6.0Institutions
Infrastructure
Macroeconomic environment
Health and primary education
Higher education and training
Goods market efficiency
Labour market efficiency
Financial market development
Technological readiness
Market size
Business sophistication
Innovation
21.

32
Economic Commission for Latin America and the Caribbean (ECLAC)
Latin America and the Caribbean has the world’s ■largest freshwater reserves, accounting for one third of world reserves. In addition, together with Sub-Saharan Africa, the region has ■the largest area of cultivable land available for future use. The region has 885 million hectares of land that could be used for production, equivalent to one third of the world total.
On the basis of world population growth projections, an ■additional 1 billion tons of grain and 200 million tons of meat will be needed to feed the world’s population in 2050. Latin America and the Caribbean has an abundance of natural resources, which represent strategic assets.
India offers sizeable markets for Latin American agricultural products. The region has untapped agricultural assets such as fresh water and cultivable land for future use
Figure I.21 WATER RESERVES, BY MAJOR REGIONS, 2007(Percentages)
Source: World Resource Institute (WRI), Earth Trends: Environmental information, 2007 [online] http://earthtrends.wri.org.
Figure 1.22 CULTIVABLE AREA IN USE, BY MAJOR REGIONS, 2011(Percentages)
Source: Economic Commission for Latin America and the Caribbean (ECLAC), on the basis of Food and Agriculture Organization (FAO) database TERRASAT [online]http://fao.org/ag/agl/agll/terrastat/#terrasatdb.
Latin America andthe Caribbean
34%
European Union4%
Asia-Pacific28%
North America10%
Rest of the world24%
13.9
14.2
35.7
45.6
55.6
59.0
61.4
144.2
0 20 40 60 80 100 120 140 160
South and Central America
Sub-Saharan Africa
World
North America
Europe
North Asia and Eastof Ural Mountains
Asia-Pacific
Africa and Middle East
22.

Trade and investment relations between India and Latin America and the Caribbean
Chapter II

1.
35
India and Latin America and the Caribbean: opportunities and challenges in trade and investment relations
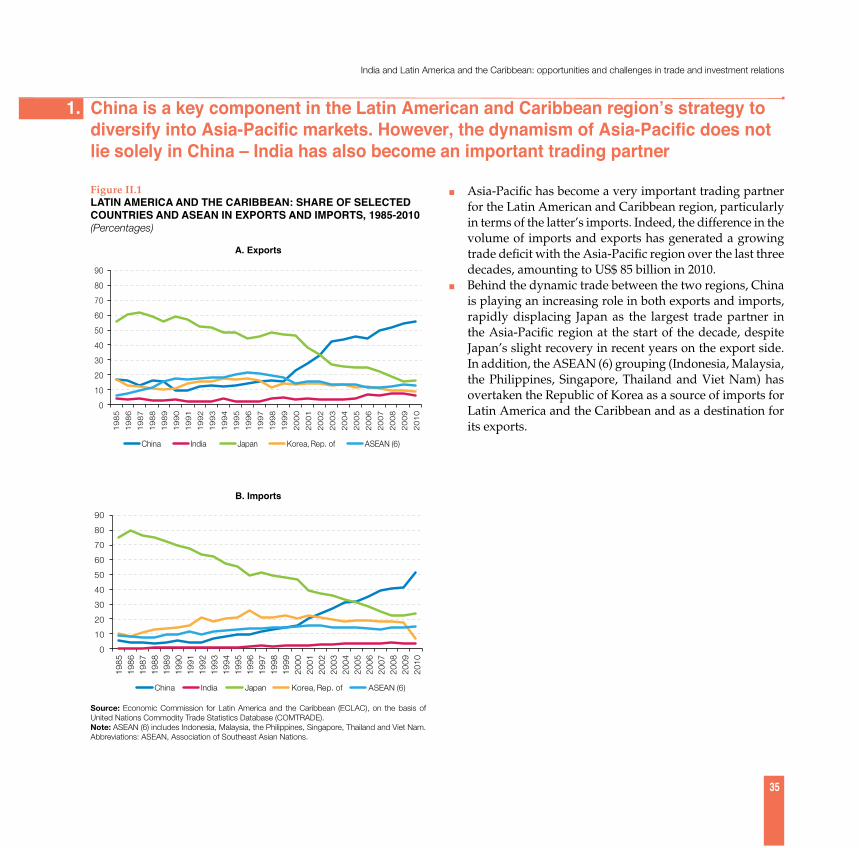
Figure II.1 LATIN AMERICA AND THE CARIBBEAN: SHARE OF SELECTED COUNTRIES AND ASEAN IN EXPORTS AND IMPORTS, 1985-2010(Percentages)
A. Exports
B. Imports
Source: Economic Commission for Latin America and the Caribbean (ECLAC), on the basis of United Nations Commodity Trade Statistics Database (COMTRADE).Note: ASEAN (6) includes Indonesia, Malaysia, the Philippines, Singapore, Thailand and Viet Nam.Abbreviations: ASEAN, Association of Southeast Asian Nations.
China is a key component in the Latin American and Caribbean region’s strategy to diversify into Asia-Pacific markets. However, the dynamism of Asia-Pacific does not lie solely in China – India has also become an important trading partner
Asia-Pacific has become a very important trading partner ■for the Latin American and Caribbean region, particularly in terms of the latter’s imports. Indeed, the difference in the volume of imports and exports has generated a growing trade deficit with the Asia-Pacific region over the last three decades, amounting to US$ 85 billion in 2010.Behind the dynamic trade between the two regions, China ■is playing an increasing role in both exports and imports, rapidly displacing Japan as the largest trade partner in the Asia-Pacific region at the start of the decade, despite Japan’s slight recovery in recent years on the export side. In addition, the ASEAN (6) grouping (Indonesia, Malaysia, the Philippines, Singapore, Thailand and Viet Nam) has overtaken the Republic of Korea as a source of imports for Latin America and the Caribbean and as a destination for its exports.
0
10
20
30
40
50
60
70
80
90
19
85
19
86
19
87
19
88
19
89
19
90
19
91
19
92
19
93
19
94
19
95
19
96
19
97
19
98
19
99
20
00
20
01
20
02
20
03
20
04
20
05
20
06
20
07
20
08
20
09
20
10
China India Japan Korea, Rep. of ASEAN (6)
0
10
20
30
40
50
60
70
80
90
1985
1986
1987
1988
1989
1990
1991
1992
1993
1994
1995
1996
1997
1998
1999
2000
2001
2002
2003
2004
2005
2006
2007
2008
2009
2010
China India Japan Korea, Rep. of ASEAN (6)
1.
36
Economic Commission for Latin America and the Caribbean (ECLAC)
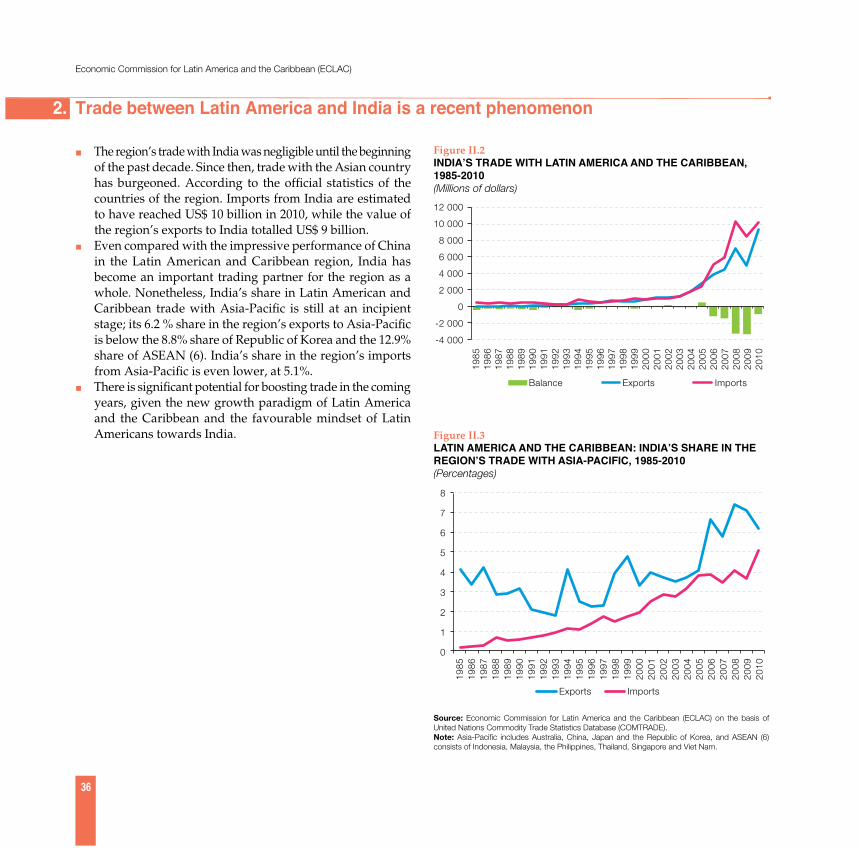
The region’s trade with India was negligible until the beginning ■of the past decade. Since then, trade with the Asian country has burgeoned. According to the official statistics of the countries of the region. Imports from India are estimated to have reached US$ 10 billion in 2010, while the value of the region’s exports to India totalled US$ 9 billion. Even compared with the impressive performance of China ■in the Latin American and Caribbean region, India has become an important trading partner for the region as a whole. Nonetheless, India’s share in Latin American and Caribbean trade with Asia-Pacific is still at an incipient stage; its 6.2 % share in the region’s exports to Asia-Pacific is below the 8.8% share of Republic of Korea and the 12.9% share of ASEAN (6). India’s share in the region’s imports from Asia-Pacific is even lower, at 5.1%.There is significant potential for boosting trade in the coming ■years, given the new growth paradigm of Latin America and the Caribbean and the favourable mindset of Latin Americans towards India.
Trade between Latin America and India is a recent phenomenon
Figure II.2 INDIA’S TRADE WITH LATIN AMERICA AND THE CARIBBEAN, 1985-2010(Millions of dollars)
Figure II.3 LATIN AMERICA AND THE CARIBBEAN: INDIA’S SHARE IN THE REGION’S TRADE WITH ASIA-PACIFIC, 1985-2010(Percentages)
Source: Economic Commission for Latin America and the Caribbean (ECLAC) on the basis of United Nations Commodity Trade Statistics Database (COMTRADE).Note: Asia-Pacific includes Australia, China, Japan and the Republic of Korea, and ASEAN (6) consists of Indonesia, Malaysia, the Philippines, Thailand, Singapore and Viet Nam.
-4 000
-2 000
0
2 000
4 000
6 000
8 000
10 000
12 000
1985
1986
1987
1988
1989
1990
1991
1992
1993
1994
1995
1996
1997
1998
1999
2000
2001
2002
2003
2004
2005
2006
2007
2008
2009
2010
Balance Exports Imports
2. 3.
0
1
2
3
4
5
6
7
8
1985
1986
1987
1988
1989
1990
1991
1992
1993
1994
1995
1996
1997
1998
1999
2000
2001
2002
2003
2004
2005
2006
2007
2008
2009
2010
Exports Imports

37
India and Latin America and the Caribbean: opportunities and challenges in trade and investment relations
Figure II.4 LATIN AMERICA AND THE CARIBBEAN: TRADE WITH INDIA, AVERAGE 2008-2010a, b
(Percentages of total trade)
A. Exports B. Imports
Source: Economic Commission for Latin America and the Caribbean (ECLAC) on the basis of United Nations Commodity Trade Statistics Database (COMTRADE).
a Data are not available for Antigua and Barbuda and Honduras from 2008; for Saint Kitts and Nevis and Saint Lucia from 2009 ; or for Bahamas, Granada, Honduras, Saint Kitts and Nevis, Saint Lucia, Trinidad and Tobago and Uruguay from 2010.
b Oil statistics were estimated by COMTRADE and may not be included for every country.
The region’s trade with India is concentrated in a small number of countries
According to the official statistics of the countries of Latin ■America and the Caribbean, the region’s exports to India reached US$ 7 billion a year in 2008 and 2009. The four major exporters, Brazil, Chile, Mexico and Argentina, accounted for almost 90% of region’s exports to India during the period. The Caribbean countries represented 1.3 % of total exports.
0.00.10.10.10.10.10.10.10.40.40.81.3
2.94.0
13.417.7
20.338.3
0 5 10 15 20 25 30 35 40 45
HondurasBolivia (Plur. State of)
El SalvadorUruguay
NicaraguaPanama
Venezuela (Bol. Rep. of)bEcuador
GuatemalaCosta Rica
ParaguayCaribbean countries
PeruColombiaArgentina
MexicoChileBrazil
0.20.40.50.50.70.80.91.11.61.62.82.8
5.05.76.2
7.418.6
43.2
0 5 10 15 20 25 30 35 40 45
HondurasEl Salvador
Bolivia (Plur. State of)Uruguay
ParaguayNicaragua
Costa RicaPanamaEcuador
GuatemalaVenezuela (Bol. Rep. of)b
Caribbean countriesChilePeru
ArgentinaColombia
MexicoBrazil
The region’s imports from India totalled an annual average ■value of US$ 7.7 billion. Brazil, Mexico, Colombia, Argentina, Peru and Chile, by order of importance, absorbed 86% of the region’s total imports from India. The Caribbean played a more significant role in imports than exports, accounting for 2.8% of total imports (for more detailed information by country, see tables A.1 and A.2 of the annex).
3.

38
Economic Commission for Latin America and the Caribbean (ECLAC)
Table II.1 INDIA: TRADE WITH LATIN AMERICA AND THE CARIBBEAN, ANNUAL AVERAGE, APRIL 2009 TO MARCH 2011 (Millions of dollars and percentages of regional total)
Exports Imports
Ranking Country US$ million Share Country US$ million Share
1 Brazil 3 192.5 38.83 Venezuela (Bol. Rep. of) 4 047.9 32.902 Bahamas 1 528.4 18.59 Brazil 3 493.4 28.393 Mexico 754.7 9.18 Chile 1 334.8 10.854 Colombia 471.9 5.74 Mexico 1 106.2 8.995 Chile 413.6 5.03 Argentina 847.5 6.896 Peru 364.9 4.44 Colombia 640.2 5.207 Argentina 334.1 4.06 Panama 277.4 2.258 Venezuela (Bol. Rep. of) 176.9 2.15 Peru 162.0 1.329 Ecuador 107.5 1.31 Ecuador 118.1 0.96
10 Trinidad and Tobago 104.7 1.27 Costa Rica 94.5 0.7711 Guatemala 99.1 1.21 Trinidad and Tobago 68.9 0.5612 Panama 98.0 1.19 Guatemala 23.0 0.1913 Uruguay 69.4 0.84 Uruguay 16.7 0.1414 Dominican Republic 67.6 0.82 Honduras 13.4 0.1115 Honduras 53.1 0.65 Domincan Republic 12.6 0.1016 Haiti 46.7 0.57 Guyana 8.8 0.0717 Costa Rica 46.6 0.57 Antigua 7.8 0.0618 British Virgin Islands 40.9 0.50 El Salvador 5.4 0.0419 Netherlands Antilles 40.5 0.49 Paraguay 5.3 0.0420 Paraguay 39.7 0.48 Bolivia (Plur. State of) 5.0 0.04
Others 171.8 2.09 Others 15.8 0.13
Total 8 222.6 100.00 Total 12 304.7 100.00
Source: Economic Commission for Latin America and the Caribbean (ECLAC), on the basis of the Ministry of Commerce and Industry, Export Import Data Bank [online] http://commerce.nic.in/eidb/Default.asp.
Mexico, Argentina and Colombia were also important sources of Indian imports. The major differences between the official statistics produced ■by India and those produced by the countries of Latin America and the Caribbean probably stem from the fact that: (i) data on oil trade destinations are not always available, as is the case for the Bolivarian Republic of Venezuela; and (ii) India’s statistics report on the basis of ports of arrival rather than final destination.
According to India’s official statistics, the order of importance of its trade partners differs dramatically
According to India’s official statistics for the fiscal years 2009 ■and 2010, the country’s exports to Latin America and the Caribbean reached US$ 8.2 billion, while its imports from the region totalled US$ 12.3 billion. Brazil is the largest export destination, accounting for almost ■40% of total exports to the region. The combined share of the top seven destination countries (Brazil, Bahamas, Mexico, Colombia, Chile, Peru and Argentina) represented 86% of total exports to the region. With respect to imports, the Bolivarian Republic of Venezuela ■and Brazil led the list, with a combined share of 61%. Chile,
4. 5.

39
India and Latin America and the Caribbean: opportunities and challenges in trade and investment relations
Figure II.5LATIN AMERICA AND THE CARIBBEAN: RELATIVE IMPORTANCE OF INDIA AS A TRADE PARTNER, ANNUAL AVERAGE, 2008-2010a, b
(Percentages of each country’s total exports and imports)
A. Exports B. Imports
Source: Economic Commission for Latin America and the Caribbean (ECLAC) on the basis of United Nations Commodity Trade Statistics Database (COMTRADE).
a Data are not available for Antigua and Barbuda and Honduras from 2008; or for Saint Kitts and Nevis and Saint Lucia from 2009; or for Bahamas, Granada, Honduras, Saint Kitts and Nevis, Saint Lucia, Trinidad and Tobago and Uruguay from 2010.
b Oil statistics were estimated by COMTRADE and may not be included for every country.
For the majority of the countries in the region, India is still an unexploited export market and a minor source of imports
0.00.10.10.10.10.20.2
0.30.30.3
0.40.5
0.70.8
0.91.4
1.41.5
2.2
0.0 0.5 1.0 1.5 2.0 2.5
Venezuela (Bol. Rep. of)bEcuadorPanama
Bolivia (Plur. State of)El Salvador
HondurasUruguay
Costa RicaGuatemalaNicaragua
Caribbean countriesMexico
PeruColombia
Latin America and the CaribbeanParaguayArgentina
BrazilChile
0.30.50.50.50.60.60.60.70.70.80.80.8
0.91.01.0
1.51.5
1.62.1
0.0 0.5 1.0 1.5 2.0 2.5
El SalvadorCosta Rica
MexicoVenezuela (Bol. Rep. of)b
PanamaParaguay
Caribbean countriesEcuador
ChileUruguay
Bolivia (Plur. State of)HondurasArgentina
GuatemalaLatin America and the Caribbean
NicaraguaColombia
PeruBrazil
India is not yet a major destination for the region’s exports, ■receiving only 0.9% of the region’s total exports in 2008-2010. Among the countries of the region, Chile sends the highest proportion of its total exports to India: 2.2%. Brazil, Argentina and Paraguay are the only other countries to surpass the regional average.
Nor is India an important source of the region’s imports. In ■2008-2010, only 1% of the region’s total imports originated from India. The countries that rely more on India as an import source are Brazil, Peru, Colombia and Nicaragua (for more detailed information by country, see tables A.1 and A.2 of the annex).
5.

40
Economic Commission for Latin America and the Caribbean (ECLAC)
Figure II.6 LATIN AMERICA AND THE CARIBBEAN: TRADE STRUCTURE WITH SELECTED MARKETS IN ASIA-PACIFIC, BY TECHNOLOGICAL INTENSITY, ANNUAL AVERAGE, 2008-2010a, b
(Percentages of total )
A. Exports
B. Imports
Source: Economic Commission for Latin America and the Caribbean (ECLAC) on the basis of United Nations Commodity Trade Statistics Database (COMTRADE).
a Data are not available for the Bolivarian Republic of Venezuela from 2007; for Antigua and Barbuda and Honduras from 2008; or for Saint Kitts and Nevis and Saint Lucia from 2009.
b Oil statistics for the Bolivarian Republic of Venezuela were estimated by COMTRADE and may not include data for every country.
The region’s export basket for India is similar to that for ■other Asian countries, that is, primary products and natural resource-based manufactures account for the lion’s share of total exports. The share of primary products could be even higher if oil exports from the Bolivarian Republic of Venezuela were taken into account. This contrasts with the region’s export basket for other trading partners, especially for intraregional trade within Latin America and the Caribbean, which consists of a high proportion of manufactures of different technological intensities. Notably, the region’s import structure from India is quite ■different to that from other Asian countries. The import basket from India consists not only of manufactures, but also natural resource-based manufactures. The shares of medium- and high-tech manufactures are also much lower when compared with the import baskets from China, Japan and the Republic of Korea. Therefore, the typical inter-industry trade structure of the ■region with Asia, in which the region exports primary products and imports manufactures, does not necessarily apply to India.
The region’s exports to India are concentrated in primary products and natural resource-based manufactures, while its imports from India are of a more diverse nature
6. 7.
0
20
40
60
80
100
India China Japan Rep. of Korea
ASEAN Australiaand
New Zealand
World
Primary products Natural resouce-based manufacturesLow-tech manufactures Medium-tech manufacturesHigh-tech manufactures Other
0
20
40
60
80
100
India China Japan Rep. of Korea
ASEAN Australiaand
New Zealand
World
Primary products Natural resouce- based manufacturesLow-tech manufactures Medium-tech manufacturesHigh-tech manufactures Other

41
India and Latin America and the Caribbean: opportunities and challenges in trade and investment relations
Table II.2LATIN AMERICA AND THE CARIBBEAN: NUMBER OF PRODUCTS EXPORTED TO THE MAIN MARKETS, ANNUAL AVERAGE, 2007-2009(Number of products at the six-digit level of the 2002 Harmonized System)
India China JapanRepublic of
KoreaASEAN European Union United States
Latin America and the Caribbean
Argentina 373 521 453 251 674 2 258 1 751 3 815Bolivia (Plur. State of) 15 40 82 34 18 359 364 673Brazil 1 031 1 172 1 266 524 1 395 3 148 2 864 3 964Chile 113 307 324 173 254 1 429 1 340 3 108Colombia 73 155 210 118 156 1 314 1 827 3 258Costa Rica 54 160 112 68 176 684 1 457 2 472Ecuador 22 65 109 61 61 753 1 020 1 803El Salvador 15 36 39 24 40 336 1 008 2 435Guatemala 25 193 140 304 161 843 1 534 3 284Hondurasa 27 74 76 31 47 323 922 1 851Mexico 591 1 093 1 150 671 1 043 2 772 4 129 3 895Nicaragua 7 35 22 44 16 174 840 1 726Panama 45 98 50 52 92 718 1 029 2 716Paraguay 18 57 27 12 30 345 246 1 002Peru 58 252 447 172 184 1 555 1 688 2 872Uruguay 42 121 49 42 100 717 448 1 430Venezuela (Bol. Rep. of)b 40 63 67 19 120 778 849 1 663Caribbean countriesc 108 289 147 37 189 1 422 2 600 3 037Latin America and the Caribbean 1 613 2 275 2 234 1 529 2 319 4 225 4 625 4 852
Source: Economic Commission for Latin America and the Caribbean (ECLAC), on the basis of United Nations Commodity Trade Statistics Database (COMTRADE).
a Does not include 2008.b Does not include 2007.c Includes Bahamas, Barbados, Belize, Dominica, Dominican Republic, Guyana, Jamaica and Trinidad and Tobago.
The region’s exports to Asia, and especially to India, are limited in terms of range of products
The number of products exported by Latin America and the ■Caribbean, as categorized under the Harmonized System at the six-digit level (5,052 tariff lines), to India is much smaller than to other regions and countries of the world. Export baskets within the region, for the United States, and for the European Union are much more diversified. At the regional level, 1,613 products (at the six-digit level of the
Harmonized System) were exported to India, a much smaller number than for China, Japan and ASEAN.Among the countries of the region, Brazil exports the largest ■number of products to India, followed by Mexico, while the number of products exported by Central American countries and Paraguay is very small.
7.

42
Economic Commission for Latin America and the Caribbean (ECLAC)
Table II.3 INDIA: TOP THREE IMPORT PRODUCTS FROM LATIN AMERICAN AND CARIBBEAN COUNTRIES, ANNUAL AVERAGE 2008-2010(Percentages)
First Second Third Share in total
Argentina Fixed vegetable oils (73.8) Wheat, unmilled (7.6) Leather (3.3) 84.9Bolivia (Plur. State of) Other crude minerals (57.9) Leather (29.7) Hides and skins, raw (2.5) 90.2Brazil Sugars, molasses and honey (18.2) Petroleum oils, crude (32.4) Copper ores (12.6) 63.3Chile Copper ores (86.7) Inorganic chemical elements (3.5) Other base metals ores (2.3) 92.7Colombia Petroleum oils, crude (88.6) Coke and semi-coke (3.8) Ferro-alloys (2.7) 95.2Costa Rica Parts for automatic data-processing machines (68.1) Wood, in the rough (25.6) Ferrous waste and scrap (1.3) 95.1Cuba Petroleum oils, crude (78.1) Tobacco, manufactured (12.5) Pulp and waste paper (2.5) 93.3Dominican Rep. Cocoa (38.2) Ferrous waste and scrap (18.2) Ferro-alloys (20.1) 76.6Ecuador Petroleum oils, crude (65.3) Wood, in the rough (19.1) Printed matter (6.2) 90.8El Salvador Wood, in the rough (84.7) Pulp and waste paper (6.7) Base metal waste and scrap (3.1) 94.7Guatemala Sugars, molasses and honey (72.2) Wood, in the rough (10.4) Spices (4.8) 87.6Honduras Ferrous waste and scrap (49.8) Base metal waste and scrap (24.3) Precious or semiprecious stones (11.4) 85.6Mexico Petroleum oils, crude (52.9) Fertilizers (8.7) Primary forms of iron (8.5) 70.3Nicaragua Ferrous waste and scrap (27.8) Wood, in the rough (19.6) Base metal waste and scrap (11.8) 59.4Panama Petroleum oils, crude (55.7) Ships and floating structures (39.5) Wood, in the rough (3.4) 98.7Paraguay Fixed vegetable oils (82.7) Essential oils (12.1) Leather (2.5) 97.5Peru Copper ores (77.3) Other base metals ores (14.9) Silver (1.5) 93.9Uruguay Wool (32.4) Other textile fabrics (13.6) Hollow profiles of iron (11.9) 58.1Venezuela (Bol. Rep. of) Petroleum oils, crude (99.5) Flat-rolled products of iron not coated (0.15) Polymers of halogenated olefins (0.08) 99.8CARICOM Natural gas (60.6) Ships and floating structures (21.7) Petroleum oils, crude (5.2) 87.6
Source: Economic Commission for Latin America and the Caribbean (ECLAC) on the basis of United Nations Commodity Trade Statistics Database (COMTRADE).
India’s imports from the region are concentrated in a small number of primary products
According to the country’s official statistics, India’s imports ■from the region by country are highly concentrated in a small number of products. With the exception of Uruguay, the top three products account for about 90% of total imports from each country.
Moreover, the majority of those products are primary products ■or natural resource-based manufactures. The only exception is the top product for Costa Rica: parts for automatic data processing machines.
8. 9.

43
India and Latin America and the Caribbean: opportunities and challenges in trade and investment relations
The Grubel Lloyd Index indicates that: (i) intra-industry ■trade has increased over the years from 0.13 to 0.29 in Latin America and from 0.22 to 0.37 in Asia-Pacific; (ii) the strongest spikes in intra-industry trade coefficients are observed in intra-Asia-Pacific trade; (iii) the intra-industry trade coefficients for biregional trade between Latin America and Asia-Pacific, though rising, still remain very low at 0.06 and 0.05; and (iv) coefficients for
As is the case for the trade flows between Latin America and the Caribbean and other Asian countries, India has little intra-industry trade with Latin America
intra-industry trade with the United States and the European Union are rising substantially for both regions. The increase is most striking in the case of intra-industry trade with the United States.The Grubel Lloyd Indices for Latin America with Asia- ■Pacific are invariably low. In the case of India, trade with Brazil and Mexico is of a more intra-industry nature than that with other countries in the region.
Table II.4 INTRA-INDUSTRY TRADE BETWEEN SELECTED ASIA-PACIFIC AND LATIN AMERICAN COUNTRIES, 2009(Grubel Lloyd Indices)
Republic of
Korea China Japan Indonesia Malaysia Philippines Singapore Thailand Viet Nam Australia
New Zealand
India
Argentina 0.02 0.02 0.03 0.01 0.01 0.01 0.06 0.03 0.00 0.08 0.04 0.04
Bolivia (Plur. State of) 0.00 0.01 0.00 0.00 0.01 0.00 0.00 0.00 0.00 0.00 0.00 0.00
Brazil 0.04 0.04 0.06 0.06 0.02 0.03 0.17 0.04 0.05 0.07 0.15 0.11
Chile 0.01 0.02 0.00 0.01 0.02 0.03 0.01 0.02 0.01 0.05 0.06 0.01
Colombia 0.02 0.02 0.01 0.02 0.01 0.03 0.02 0.02 0.01 0.05 0.05 0.00
Costa Rica 0.03 0.06 0.09 0.01 0.04 0.03 0.16 0.01 0.01 0.09 0.01 0.03
Ecuador 0.00 0.01 0.00 0.00 0.00 0.01 0.00 0.00 0.00 0.01 0.00 0.00
El Salvador 0.05 0.00 0.00 0.00 0.00 0.04 0.00 0.00 0.01 0.00 0.00 0.00
Guatemala 0.01 0.01 0.00 0.00 0.00 0.00 0.00 0.00 0.00 0.01 0.00 0.01
Honduras 0.00 0.01 0.00 0.01 0.00 0.01 0.00 0.00 0.00 0.00 0.00 0.01
Mexico 0.03 0.05 0.12 0.07 0.03 0.03 0.36 0.05 0.04 0.23 0.06 0.10
Nicaragua 0.00 0.00 0.00 0.00 0.00 0.00 0.00 0.00 0.11 0.00 0.00 0.00
Panama 0.00 0.00 0.00 0.02 0.00 0.00 0.00 0.00 0.00 0.00 0.00 0.00
Paraguay 0.00 0.00 0.00 0.00 0.00 0.00 0.00 0.00 0.00 0.00 0.02 0.00
Peru 0.05 0.01 0.00 0.01 0.02 0.01 0.00 0.00 0.01 0.02 0.03 0.02
Uruguay 0.03 0.01 0.01 0.09 0.02 0.02 0.01 0.00 0.01 0.04 0.01 0.03
Venezuela (Bol. Rep. of) 0.00 0.01 0.00 0.00 0.00 0.00 0.02 0.00 0.00 0.00 0.00 0.06
More than or equal to 0.05 More than 0.10 but less than 0.20 More than 0.20
Source: Economic Commission for Latin America and the Caribbean (ECLAC), on the basis of the United Nations Commodity Trade Statistics Database (COMTRADE).
9.

44
Economic Commission for Latin America and the Caribbean (ECLAC)
Over the last two decades, the Latin American and Caribbean ■region has received about 4% of India’s outward FDI. Of this small amount, more than 70% of the total invested ■in the region has gone to the British Virgin Islands and Cayman Islands. Productive investment in the region as a whole has therefore ■been quite limited.
To date, the lion’s share of India’s outward FDI in the region has been directed towards tax haven countriesTable II.5 INDIA: OUTWARD FDI IN LATIN AMERICA AND THE CARIBBEAN, 1996-2010a, b
(Millions of dollars and percentages)
1996-2002 2002-2009 2009-2010 1996-2002 2002-2009 2009-2010 1996-2002 2002-2009 2009-2010
(US$ Million dollars) (As percentage of regional total ) (As percentage of world total )
South America 30 622 14 3.7 23.1 1.9 0.4 0.8 0.1
Brazil 13 508 11 1.6 18.8 1.5 0.2 0.7 0.1
Uruguay 91 0.0 3.4 0.0 0.0 0.1 0.0
Central America 1 144 32 0.1 5.3 4.5 0.0 0.2 0.3
Caribbean and other Americas 790 1 930 672 96.2 71.6 93.6 10.5 2.5 6.3
British Virgin Islands 777 1 627 567 94.6 60.3 79.0 10.3 2.1 5.3
Cayman Islands 12 221 104 1.5 8.2 14.5 0.2 0.3 1.0
Latin America and the Caribbean 821 2 697 718 100.0 100.0 100.0 10.9 3.5 6.8
World 7 525 75 985 10 623 100.0 100.0 100.0
Source: Adapted from Premila Nazareth Satyanand and Pramila Raghavendran, “Outward FDI from India and its policy context”, Columbia, FDI Profiles, Vale Columbia Center, 22 September 2010.
a This table relies on investment approval data because the Government of India does not publish a geographical breakdown of outward FDI flows. b Data are by fiscal year (1 April to 31 March).
Figure II.7 LATIN AMERICA AND THE CARIBBEAN: SHARE IN INDIA’S TOTAL OUTWARD FDI(Percentages)
Source: Economic Commission for Latin America and the Caribbean (ECLAC), on the basis of Prema-Chandra Athukorala, “Outward Foreign Direct Investment from India”, Asian Development Review, vol. 26, no. 2., pp. 125-153, and Premila Nazareth Satyanand and Pramila Raghavendran, “Outward FDI from India and its policy context”, Columbia, FDI Profiles, Vale Columbia Center, 22 September 2010.
0.0
0.5
1.0
1.5
2.0
2.5
3.0
3.5
4.0
4.5
Up to 1990 1991-1995 1996-2002 2002-2009
10. 11.

45
India and Latin America and the Caribbean: opportunities and challenges in trade and investment relations
Following a brief analysis of the list of major Indian firms ■operating in Latin America and the Caribbean (for more details, see table A.3 of the annex) India’s FDI in the region can be characterized as follows:
1. As with Chinese FDI in the region, the factors driving Indian FDI are access to natural resources, expansion of overseas markets (market-seeking) and improvement of production and administration efficiency (efficiency-seeking).
Significant Indian investments have been made in the region ■in the mining and hydrocarbons sector. The Indian economy needs a reliable supply of raw materials, ■of which the Latin American and Caribbean region is a particularly rich source. This has led to many of the major investments and acquisitions made by Indian transnational companies in the region. In the manufacturing sector, Chinese industries —mainly ■textiles, paper, automotive, electronics, information technologies and telecommunications— have selected particular countries (Brazil is clearly one of them) as a stepping stone to enter the regional market.Unlike for China, sectors such as textiles have not been a ■target of Indian investment in the region.
2. The construction sector has been favoured by India’s FDI in the region.
3. The service outsourcing sector has been a major target of India’s FDI in the region and, as a result, has become a major player in this arena.
Most Indian investments in the region have been carried ■out by the main companies that operate in this sector worldwide. In the consulting services sector, the most well known is Tata Consultancy Services, which has operations in Argentina, Brazil, Chile, Ecuador, Colombia, Mexico, Peru and Uruguay. Wipro Technologies Ltd, a software development company, ■has operations in Mexico and Brazil. The firm set up operations in 2007 in Monterrey, Mexico, to service North America and Latin America, and it has a payroll of approximately 1,000 employees.
4. FDI by Latin American firms in India is even smaller.
Some outstanding examples include (for more details, see ■table A.4 of the annex): (i) A joint venture was forged between Marcopolo, a
Brazilian bus manufacturer, and Tata Motors, which started to produce buses in India in 2008 at its plant located in Dharwad. This plant has the capacity to manufacture 30,000 units per year and generate 6,500 direct jobs;
(ii) Grupo Gerdau, Brazil’s largest steel manufacturer, and the Indian Kalyani Group signed a contract for a joint venture worth US$ 170 million to operate SJK Steel Plant Ltd in the city of Tadipatri, state of Andhra Pradesh; and
(iii) Petrobras and Oil and Natural Gas Corporation Ltd (ONGC) signed an agreement in June 2007, granting them joint participation in exploration blocks – Brazil’s first oil operations on Indian soil.
Though it is still concentrated in natural-resources intensive sectors, India is beginning to expand and diversify its FDI into various types of services, especially outsourcing, software development, and manufacturing
11.

46
Economic Commission for Latin America and the Caribbean (ECLAC)
Some examples of trans-Pacific agreements include the trade ■agreement between Chile and China, the agreements Chile has with Japan and India, and Panama’s agreements with Singapore and Taiwan Province of China. The Economic Partnership Agreement between Japan and Mexico entered into force in April 2005 and is considered the first agreement Japan has entered into that is of such broad scope. Several more Asia-Pacific and Latin American countries have also been involved in other initiatives, including: Chile-Korea Free Trade Agreement (the first trans-Pacific trade agreement), Trans-Pacific Strategic Economic Partnership between Chile, New Zealand, Singapore and Brunei Darussalam (referred to as the P4 agreement) and a free trade agreement between Peru and Thailand, which was concluded in 2005 but has not yet entered into effect. Chile has signed a free trade agreement with Malaysia and is at the pre-negotiation stage with Viet Nam (evaluating the possibility of an agreement). In 2010, Costa Rica signed bilateral free trade agreements with Singapore and China. These initiatives demonstrate that Latin American countries ■are intent on developing long-term relationships with Asia-Pacific even though a unified strategy does not yet exist.
A complex network of trade agreements has emerged within and between Asia-Pacific and Latin America; however, India has shown reluctance towards signing comprehensive trade agreements with countries in the latter region Table II.6BILATERAL AND MULTILATERAL FREE TRADE AGREEMENTS IN ASIA-PACIFIC, BY COUNTRY AND STAGE OF NEGOTIATIONS, JUNE 2011
ASEAN Japan China Republic of Korea India Australia New
Zealand
ASEAN IF IF IF IF IF IFJapan IF FS UN IF UN FSChina IF FS FS IF UN IFKorea, Rep. of IF UN FS IF UN UNIndia IF IF FS IF FS UNAustralia
IFUN UN UN FS IF
New Zealand FS IF UN FS IF
IF In force or signed UN Under negotiation FS Feasibility study
Source: Economic Commission for Latin America and the Caribbean (ECLAC), on the basis of official information.Note: Australia and New Zealand have a joint agreement with ASEAN. Although Japan and the Republic of Korea started negotiations in December 2003, the process was suspended in November 2004. A feasibility study on an agreement between China, Japan and the Republic of Korea was announced in May 2010.
Table II.7 TRANS-PACIFIC FREE TRADE AGREEMENTS, JUNE 2011
Agreements in forceDate of entry into
force
Taiwan Prov. China - Panama 1 Jan. 2004Korea, Rep. of -Chile 1 Apr. 2004Japan-Mexico 1 Apr. 2005Trans-Pacific Strategic Economic Partnership Agreement (P4) 28 May 2006Singapore - Panama 24 July 2006China-Chile 1 Oct. 2006India-Chile 17 Aug. 2007Japan-Chile 3 Sept. 2007Nicaragua-Taiwan, Prov. China 1 Jan. 2008Honduras-Taiwan, Prov. China 1 Mar. 2008Australia-Chile 6 Mar. 2009India -Mercosur 1 June 2009Singapore -Peru 1 Aug. 2009China -Peru 1 Mar. 2010Malaysia-Chile 15 Nov. 2010Korea, Rep. of. - Peru 21 Mar. 2011China-Costa Rica 1 July 2011
Agreements signed, but not yet in force Date signedSingapore -Costa Rica 6 Apr. 2010Thailand - Peru, Protocol 19 Nov. 2005Japan-Peru 31 May 2011
Under negotiation Thailand - Chile Viet Nam-Chile Singapore-Colombia Korea Rep. of. - México Nagotiations suspended Korea, Rep. of. - Colombia Singapore - Mexico
Proposed agreements Korea Rep. of. - Mercosur Korea, Rep. of. - Panama Indonesia-Chile
Source: Economic Commission for Latin America and the Caribbean (ECLAC), on the basis of official information.
12. 13.

47
India and Latin America and the Caribbean: opportunities and challenges in trade and investment relations
IN EFFECT ■• AssociationofSoutheastAsianNations(ASEAN)(2010)
• Asia-PacificTradeAgreement(APTA)(1976):Bangladesh,China, India, Korea, Lao People’s Democratic Republic and Sri Lanka
• SouthAsianPreferentialTradeAgreement(SAPTA)(1995):Bangladesh, Bhutan, India, Maldives, Nepal, Pakistan, Sri Lanka
• South Asian Free Trade Agreement (SAFTA) (2006):Afghanistan, Bangladesh, Bhutan, India, Maldives, Nepal, Pakistan and Sri Lanka
• MERCOSUR(2009)
• Afghanistan(2003)
• Bhutan(2006)
• Chile(2007)
• RepublicofKorea(2010)
• Nepal(2009)
• Singapore(2005)
• SriLanka(2001)
• Japan(2011)
• Malaysia(2011)
• Thailand(2011)
• Global System of Trade Preferences among DevelopingCountries (GSTP) (1989): Includes a number of Latin American and Caribbean countries, such as the Bolivarian Republic of Venezuela, Brazil, Chile, Colombia, Cuba, Mexico, Nicaragua, Plurinational State of Bolivia and Trinidad and Tobago
UNDER NEGOTIATION ■ • BayofBengal Initiative forMulti-SectoralTechnicaland
Economic Cooperation (BIMSTEC) Free Trade Area ((FA) signed/FTA Under Negotiation)
• India-Gulf Cooperation Council Free Trade Area ((FA)signed/FTA Under Negotiation since October 2007)
• India-SouthernAfricanCustomsUnion(SACU)PreferentialTrade Agreement ((FA) signed/FTA under Negotiation)
• EuropeanUnion(undernegotiationsinceJune2007)
• EFTA(undernegotiationsinceOctober2008)
• Gulf Cooperation Council (GCC) (under negotiation since 2006)
• NewZealand(undernegotiation)
PROPOSED/UNDER CONSULTATION AND STUDY ■• Comprehensive Economic Partnership for East Asia
(ASEAN+6)
• India-AustraliaFreeTradeAgreement
• India-CanadaEconomicPartnershipAgreement
• India-ColombiaPreferentialTradingArrangement
• India-Indonesia Comprehensive Economic CooperationArrangement
• India-IsraelPreferentialTradeAgreement
• India-Russian Federation Comprehensive EconomicCooperation Agreement
• India-TurkeyFreeTradeAgreement
• India-UruguayPreferentialTradingArrangement
• India-BolivarianRepublicofVenezuelaPreferentialTradingArrangement
• People’s Republic of China-India Regional TradingArrangement
• India-EgyptPreferentialTradeAgreement
• India-MauritiusComprehensiveEconomicCooperation
India is creating a complex network of trade agreements, though most of them are partial agreements, with countries inside and outside Asia-Pacific, including partial agreements with Chile and MERCOSUR. India has been negotiating a free trade agreement with the European Union, its largest trading partner
13.

48
Economic Commission for Latin America and the Caribbean (ECLAC)
This competition is illustrated in table II-8, which lists the 20 ■main products imported by India from Latin America and the Caribbean in 2008-2010, the top three suppliers of each product to India and their respective market shares. Crude oil, copper ores and edible oil are the top three ■items, accounting for 76% of total imports from the region. Imports of these three products are expected to increase
The region’s exports of raw materials to India are expected to grow, but will face stiff competition in the Indian market from exporters from other regions
in the coming years in view of the growing demand and sluggish domestic production. It is striking that many countries of the Asia-Pacific region ■are also suppliers of the same natural resources, yet Latin America and the Caribbean maintains a sizeable comparative advantage in the Indian and other Asian markets.
Table II.8 INDIA: 20 LEADING PRODUCTSa IMPORTED FROM THE LATIN AMERICAN AND CARIBBEAN REGION AND ITS COMPETITORS, ANNUAL AVERAGE 2008-2010(Millions of dollars and percentages)
Ranking SITC Commodity description Valueb Accum.Percentagesc
SharePercentagesd
Worlde Leading buyer countries and import percentages
1st Percentages 2nd Percentages 3rd Percentages
All commodities 9 293.1 100.0 3.3 283 581 CHN 11.2 ARE 7.4 USA 6.6
1 333 Petroleum oils, crude 5 006.4 53.9 6.9 72 332 SAU 19.4 IRN 13.1 NGA 10.62 283 Copper ores 1 542.9 16.6 43.4 3 551 CHL 31.5 AUS 19.7 IDN 13.93 421 Fixed vegetable oils 597.2 6.4 61.0 978 ARG 50.1 UKR 25.7 BRA 10.64 061 Sugars, molasses and honey 418.6 4.5 78.2 535 BRA 74.6 THA 8.6 GTM 6.15 562 Fertilizers 111.1 1.2 1.4 7 961 USA 22.3 RUS 13.2 CHN 12.26 793 Ships and floating structures 107.5 1.2 3.1 3 484 SGP 14.3 NOR 13.5 CHN 13.27 343 Natural gas 99.7 1.1 3.9 2 541 QAT 60.9 BEL 7.4 RUS 6.18 041 Wheat, unmilled 94.6 1.0 87.5 108 ARG 141.5 BRA 33.5 RUS 30.49 672 Primary forms of iron 83.5 0.9 21.7 386 MEX 37.2 UKR 14.1 CHN 12.4
10 287 Other base metals ores 66.9 0.7 11.7 574 AUS 27.2 ZAF 25.2 GAB 6.711 673 Flat-rolled products of iron not coated 66.6 0.7 2.1 3 136 CHN 27.1 KOR 20.7 RUS 8.112 247 Wood, in the rough 64.3 0.7 5.7 1 133 MYS 31.5 MMR 29.6 NZL 8.013 671 Ferro-alloys 61.6 0.7 13.1 470 CHN 18.3 BTN 12.6 RUS 11.314 931 Commodities not classified 56.9 0.6 0.7 7 918 CHN 32.2 USA 16.4 DEU 7.815 512 Alcohols and their halogenated derivatives 45.0 0.5 3.2 1 421 SAU 26.2 IRN 9.4 USA 9.016 278 Other crude minerals 43.8 0.5 11.5 380 RUS 22.0 CHN 14.5 CAN 9.617 759 Parts for automatic data-processing machines 43.6 0.5 3.1 1 424 CHN 37.0 MYS 19.9 SGP 12.218 522 Inorganic chemical elements 37.8 0.4 1.3 2 895 MAR 21.1 ZAF 12.4 USA 7.419 282 Ferrous waste and scrap 29.1 0.3 1.4 2 060 USA 17.5 GBR 16.7 ARE 11.720 764 Telecommunications equipment 27.2 0.3 0.3 9 045 CHN 57.2 KOR 8.0 USA 3.7
Source: Economic Commission for Latin America and the Caribbean (ECLAC), on the basis of United Nations Commodity Trade Statistics Database (COMTRADE).
a 20 leading products imported from Latin America and the Caribbean by India, based on its average import value in 2008-2010, with their SITC Rev. 2 codes.b The order reflects the import value of these products.c Share of the product in India’s total imports from Latin America and the Caribbean.d Share of the product imported from Latin America and the Caribbean in the total value of the product imported worldwide.e Total value of imports of the product worldwide.
14. 15.

49
India and Latin America and the Caribbean: opportunities and challenges in trade and investment relations
Table II.9 INDIA: 20 LEADING PRODUCTSa EXPORTED TO THE LATIN AMERICAN AND CARIBBEAN REGION AND ITS COMPETITORS, ANNUAL AVERAGE 2008-2010(Millions of dollars and percentages)
Ranking SITC Commodity description Valueb Accum. Percentagesc
Share Percentagesd
Worlde Leading buyer countries and export percentages
1st Percentages 2nd Percentages 3rd Percentages
All commodities 5 904.2 100.0 3.1 193 012 ARE 12.4 USA 11.1 CHN 6.5
1 334 Petroleum oils, preparations 2 204.4 37.3 7.2 30 475 ARE 14.9 SGP 12.2 NLD 11.12 651 Textile yarn 424.9 7.2 13.4 3 178 BGD 11.4 BRA 9.5 TUR 7.83 542 Medicaments 299.6 5.1 5.9 5 058 USA 24.9 RUS 5.8 GBR 4.64 781 Motor vehicles for the transport of persons 263.0 4.5 8.2 3 224 GBR 9.0 ITA 7.4 DZA 7.25 516 Other organic chemicals 241.0 4.1 9.2 2 606 USA 18.8 DEU 6.2 CAN 5.26 591 Insecticides 219.4 3.7 20.6 1 065 USA 12.5 BRA 8.3 NLD 4.77 674 Flat-rolled products of iron, coated 135.0 2.3 8.7 1 548 ARE 11.5 USA 11.2 ITA 8.08 325 Coke and semi-coke 130.8 2.2 99.6 131 BRA 91.4 ARG 16.4 ITA 12.19 679 Hollow profiles of iron 109.7 1.9 3.8 2 884 USA 27.5 SAU 11.5 ARE 8.6
10 541 Medicinal and pharmaceutical products 90.9 1.5 7.4 1 231 USA 10.7 BRA 4.6 CHN 3.811 531 Synthetic organic colouring matter 84.1 1.4 7.7 1 095 USA 10.4 DEU 6.4 ITA 6.112 676 Shapes and sections of iron 56.7 1.0 6.4 887 DEU 11.2 USA 11.0 ITA 6.313 785 Motor cycles 54.0 0.9 6.1 884 NGA 12.6 COL 10.4 LKA 10.314 784 Parts and accessories of motor vehicles 52.6 0.9 3.1 1 704 USA 23.3 ITA 6.2 THA 5.915 842 Women’s or girls’ clothes, not knitted 47.3 0.8 1.4 3 388 USA 26.8 GBR 13.6 DEU 7.916 515 Other organic chemicals 45.0 0.8 5.7 792 USA 16.0 DEU 9.5 CHN 9.317 716 Rotating electric plant, and parts thereof 41.3 0.7 4.3 966 USA 31.9 BRA 9.6 AUS 9.518 625 Tyres 41.1 0.7 4.5 912 ARE 6.7 USA 5.8 PHL 5.319 673 Flat-rolled products of iron not coated 36.3 0.6 2.9 1 232 BEL 25.2 ARE 10.1 NPL 6.420 722 Tractors 35.7 0.6 8.8 407 USA 35.6 BGD 5.7 TUR 5.5
Source: Economic Commission for Latin America and the Caribbean (ECLAC), on the basis of United Nations Commodity Trade Statistics Database (COMTRADE).
a 20 leading products exported to Latin America and the Caribbean by India, based on average export value in 2008-2010, with their SITC Rev. 2 codes.b The order reflects the export value of these products.c Share of the product in India’s total exports to Latin America and the Caribbean.d Share of the product exported to Latin America and the Caribbean in the total value of the product exported worldwide.e Total value exports of the product worldwide.
The region’s imports from India range from primary products to manufactures of varying technological intensities. Countries of the region are expected to face strong competition from the Asian country in relation to these products in the future
The list of the top 20 products exported to the region by ■India includes products in which Latin America is a major supplier to its own region.
Notwithstanding the increasing role of India as a major ■supplier of manufactures to the region, competition within Latin America is expected to intensify, and diversion of trade by India may have a significant impact on the region, unless proactive polices are adopted.
15.

50
Economic Commission for Latin America and the Caribbean (ECLAC)
Table II.10 INDIA’S TRADE BALANCE WITH SELECTED TRADING PARTNERS, BY TECHNOLOGICAL INTENSITY, ANNUAL AVERAGE 2008-2010(Millions of dollars)
Exports Imports Balance
Primary products Manufactures
Products Natural resources
Low-tech Medium-tech High-tech
Africa 614 989 (374) (5 346) 295 508 826 742
Asia-Pacific 2 134 4 143 (2 009) 35 (341) (1 125) (4 202) (5 273)
ASEAN 881 1 123 (241) (1 620) (181) 88 113 (695)
Australia and New Zealand 91 499 (408) (2 384) (56) 147 5 61
China 728 1 692 (963) 3 529 (600) (916) (2 443) (3 792)
Japan 224 379 (155) 431 278 (185) (998) (357)
Republic of Korea 209 451 (241) 79 218 (259) (878) (490)
Commonwealth of Independent States 97 258 (161) (109) (248) (89) (604) 194
Latin America and the Caribbean 301 418 (117) (2 517) 235 259 225 159
South America 229 356 (127) (2 546) 168 185 249 157
Mexico and Central America 58 89 (31) (510) 32 69 (38) (25)
Caribbean 14 (27) 41 542 50 15 305 157
Middle East 1 678 2 787 (1 109) (15 137) 1 515 2 060 100 247
European Union 1 682 1 621 61 597 76 2 258 (2 184) (1 641)
United States 1 142 1 031 112 74 635 1 862 (1 159) (880)
Source: Economic Commission for Latin America and the Caribbean (ECLAC), on the basis of United Nations Commodity Trade Statistics Database (COMTRADE).
Latin America and the Caribbean competes with other countries in Indian markets of primary products and their processed goods, and competes with India in third markets
India’s trade deficit with Latin America and the Caribbean is ■mostly attributable to its trade with South America in primary products. The deficit with Mexico and Central America is much smaller and originates from not only primary products but also medium- and high-tech manufactures.India has a surplus in natural resource-based manufactures ■with Latin America and the Caribbean, a sector in which the latter is supposed to have a comparative advantage. In addition to a large deficit in relation to oil imports ■with the Middle East, India’s deficit in primary
products and natural resource-based manufactures with Africa, Australia and New Zealand, and ASEAN, is comparatively large. India is a significant importer of manufactured goods, ■registering a large deficit with members of ASEAN+3 (ASEAN plus China, Japan and the Republic of Korea). India’s deficit in medium- and high-tech manufactures with Asia is much larger than that with the United States or the European Union.
16. 17.

51
India and Latin America and the Caribbean: opportunities and challenges in trade and investment relations
The disadvantage that Latin American and Caribbean ■countries face in Indian markets compared with the countries of ASEAN would be alleviated if countries in the region signed free trade agreements with ASEAN. If the existing high most-favoured-nation tariffs ■remain in effect, Latin America and the Caribbean will face severe competition in relation to the primary markets and natural resource-based manufactures in which ASEAN countries have a comparative advantage. The tariffs applied to agricultural products, textiles ■and clothing and some machinery by ASEAN countries, as well as China, Japan and the Republic of Korea (ASEAN +3) are still high. Any reduction in tariffs in the ASEAN+3 agreement or the agreements between ASEAN and individual countries, or even in the China-ASEAN or ASEAN-India agreements, would be at the expense of Latin America and the Caribbean.
Table II.11 CHINA AND INDIA: COMPOSITION OF TRADE WITH ASEAN AND LATIN AMERICA AND THE CARIBBEAN, BY TECHNOLOGICAL INTENSITY, ANNUAL AVERAGE, 2006-2009(Percentages of each country’s total exports and imports)
China India
Imports Exports Imports Exports
Primary products ASEAN 6.8 12.7 7.4 11.8LAC 17.0 1.8 5.9 0.5
Natural-resource based manufactures ASEAN 13.3 11.3 15.3 12.8LAC 9.2 6.0 2.8 3.7
Low-tech manufactures ASEAN 6.3 5.7 7.9 3.1LAC 1.8 4.3 0.9 2.9
Medium-tech manufactures ASEAN 6.0 9.6 7.9 12.4LAC 1.1 5.8 1.7 4.5
High-tech manufacturesASEAN 17.0 7.9 11.1 10.6
LAC 1.3 3.4 0.6 5.4
OthersASEAN 4.2 6.9 2.6 17.2LAC 0.1 1.7 0.3 0.8
Source: Economic Commission for Latin America and the Caribbean (ECLAC), on the basis of United Nations Commodity Trade Statistics Database (COMTRADE).Abbreviations: ASEAN, Association of Southeast Asian Nations; LAC, Latin America and the Caribbean.
The continuing process of reducing trade barriers between Asian countries continues could prejudice trade with Latin America and the Caribbean
17.

52
Economic Commission for Latin America and the Caribbean (ECLAC)
Figure II.8 ASIA-PACIFIC AND LATIN AMERICA (SELECTED COUNTRIES): MOST-FAVOURED-NATION SIMPLE AVERAGE APPLIED AND BOUND RATES, AGRICULTURE AND NON-AGRICULTURE, 2009(Percentages)
A. Agriculture B. Non-agriculture
Source: World Trade Organization (WTO) Tariff Profiles 2010. Source: World Trade Organization (WTO) Tariff Profiles 2010.
a Viet Nam: bound rate 18.5% and applied rate 18.9%. a Cuba: applied rate, 10.7% and bound rate, 9.4%.
The most-favoured-nation tariff rates applied to the sectors that are of interest to the region remain high
0 20 40 60 80 100 120Singapore
AustraliaNew Zealand
ChilePeru
IndonesiaPhilippinesGuatemala
UruguayBrazil
ArgentinaParaguay
CubaNicaraguaCosta RicaEl Salvador
Bolivia (Plur. State of)Domincan Republic
PanamaMalaysia
Venezuela (Bol. Rep. of) China
ColombiaCambodia
EcuadorViet Nama
JapanMexico
ThailandIndia
Korea, Rep. of
Applied rates Bound rates 0 10 20 30 40 50
SingaporeNew Zealand
JapanAustralia
Costa RicaNicaragua
El SalvadorGuatemala
PeruPhilippines
ChileDomincan Republic
PanamaIndonesia
Korea, Rep. ofMalaysiaThailand
ChinaViet Nam
MexicoBolivia (Plur. State of)
EcuadorParaguay
IndiaUruguay
CubaaColombia
Venezuela (Bol. Rep. of) Argentina
Brazil
Applied rates Bound rates
The tariffs applied by a large number of Asian countries, ■including India, and some Latin American countries to agricultural products remain quite high, while the majority of Latin American countries still apply high most-favoured-nation rates in the non-agricultural sectors. The
applied most-favoured-nation rates differ substantially to the bound rates in both agricultural and non-agricultural sectors, thereby leaving the countries with a significant margin for possible protectionism.
18. 19.

53
India and Latin America and the Caribbean: opportunities and challenges in trade and investment relations
The most-favoured-nation rates applied by India in almost ■all sectors, with the exception of the petroleum sector, are much higher than those applied by other Asian countries. The rates are extremely high for agricultural products, in which Latin American and Caribbean countries have comparative advantages and the potential for trade expansion between India and the region is high.
The Indian markets that are of major interest to Latin America and the Caribbean apply extremely high most-favoured-nation rates
Though lower than the most-favoured-nation rates for ■agricultural products, those applied to industrial goods are also higher than those applied by other Asian countries. A lowering of these tariffs within the framework of the ASEAN+6 agreement would benefit Asia-Pacific countries at the expense of Latin America and the Caribbean. These high rates also impede the countries of the region from engaging in Asian supply chains.
Table II.12 ASIA-PACIFIC AND LATIN AMERICA (SELECTED COUNTRIES): MOST-FAVOURED-NATION TARIFF RATES, 2009(Percentages)
Ani
mal
pro
duc
ts
Dai
ry p
rod
ucts
Frui
t, v
eget
able
s,
pla
nts
Co
ffee
, tea
Cer
eals
and
p
rep
arat
ions
Oils
eed
s, f
ats
and
oils
Sug
ars
and
co
nfec
tio
nery
Bev
erag
es
and
to
bac
co
Co
tto
n
Oth
er a
gri
cult
ural
p
rod
ucts
Fish
& fi
sh
pro
duc
ts
Min
eral
s &
met
als
Pet
role
um
Che
mic
als
Wo
od
, pap
er, e
tc.
Text
iles
Clo
thin
g
Leat
her,
foo
twea
r, et
c.
No
n-el
ectr
ical
m
achi
nery
Ele
ctri
cal
mac
hine
ry
Tran
spo
rt
equi
pm
ent
Man
ufac
ture
s,
n.e.
s.
Australia 0.4 3.6 1.6 1.0 1.3 1.6 1.9 3.6 0.0 0.3 0.0 2.8 0.0 1.8 3.4 6.8 15.4 5.5 3.1 3.2 5.1 1.4Cambodia 27.8 25.8 14.0 26.7 19.8 9.1 7.0 33.1 7.0 15.5 18.9 11.0 14.8 9.6 11.8 9.6 28.5 18.0 14.6 24.3 16.1 14.9China 14.8 12.0 14.8 14.7 24.2 10.9 27.4 22.9 15.2 11.5 10.7 7.4 4.4 6.6 4.4 9.6 16.0 13.4 7.8 8.0 11.5 11.9Indonesia 4.4 5.5 5.9 8.3 5.8 3.9 8.0 51.8 4.0 4.3 5.8 6.4 0.3 5.2 5.0 9.3 14.4 9.0 2.3 5.8 10.6 6.9Japan 12.3 147.5 12.2 15.6 60.8 10.6 23.5 14.2 0.0 5.7 5.5 1.0 0.6 2.2 0.8 5.5 9.2 9.7 0.0 0.2 0.0 1.2Republic of Korea 22.1 67.5 57.7 53.9 134.5 37.5 17.1 31.7 0.0 16.1 16.0 4.6 4.1 5.7 2.2 9.1 12.6 7.8 6.0 6.2 5.5 6.7Malaysia 3.9 2.3 3.6 5.7 4.5 1.8 2.5 155.2 0.0 0.6 1.2 11.2 0.7 2.9 10.1 10.3 15.9 13.9 3.6 4.3 11.6 4.8New Zealand 1.5 1.4 1.2 2.3 2.9 0.6 1.5 3.0 0.0 0.7 0.4 1.8 0.2 0.8 1.3 1.9 9.6 3.1 3.0 2.6 3.1 1.7Philippines 21.0 3.9 9.8 15.7 10.9 5.6 16.0 8.2 2.6 3.4 8.1 4.9 2.9 3.8 6.6 9.1 14.9 6.6 2.3 4.0 9.1 4.9Singapore 0.0 0.0 0.0 0.0 0.0 0.0 0.0 2.5 0.0 0.0 0.0 0.0 0.0 0.0 0.0 0.0 0.0 0.0 0.0 0.0 0.0 0.0Thailand 28.7 24.8 30.5 28.3 18.1 10.0 22.3 41.9 0.0 9.4 11.7 6.0 6.0 3.1 6.9 8.0 29.8 12.4 4.1 7.5 20.3 10.2Viet Nam 14.6 12.8 24.4 29.8 21.6 8.6 15.8 50.0 6.0 6.8 25.7 8.6 13.5 4.2 13.5 10.0 19.7 15.4 4.0 10.9 18.9 12.1India 105.9 65.0 99.4 133.1 115.7 165.2 124.7 120.5 110.0 105.6 100.8 38.3 - 39.6 36.6 30.0 37.8 34.7 28.2 27.0 35.7 30.8 Argentina 8.9 15.1 9.8 13.3 12.2 8.5 17.5 17.2 6.4 7.5 10.0 9.9 0.2 8.1 10.7 22.5 35.0 15.5 5.6 12.3 20.2 13.7Bolivia (Plur. State of) 12.6 12.0 14.1 15.3 11.2 12.2 13.0 13.7 11.0 9.6 18.0 9.0 9.8 7.0 11.3 15.8 19.5 11.3 4.2 7.4 7.2 11.1Brazil 8.9 15.1 9.7 13.3 11.8 8.0 16.5 17.2 6.4 7.6 10.0 10.1 0.2 8.3 10.7 22.5 35.0 15.7 12.7 14.2 18.1 15.3Chile 6.3 6.0 6.0 6.0 6.0 6.0 6.0 6.0 6.0 6.0 6.0 6.0 6.0 6.0 6.0 6.0 6.0 6.0 6.0 6.0 5.4 6.0Colombia 24.5 24.3 15.3 17.9 20.4 16.3 16.8 18.6 10.0 9.9 19.1 10.1 10.1 7.9 13.1 17.7 20.0 13.6 8.7 10.5 14.0 11.2Costa Rica 21.0 43.5 11.4 12.4 10.0 6.1 17.2 12.7 0.0 4.0 8.6 3.1 7.3 1.8 5.9 7.6 13.9 7.2 1.1 2.1 4.1 6.1Cuba 9.7 22.1 9.4 20.5 11.2 8.2 20.3 23.4 1.6 6.2 4.7 7.7 2.4 9.5 8.7 14.6 22.8 12.0 9.7 10.4 9.0 12.5Dominican Rep. 20.9 18.6 17.0 18.1 10.9 5.1 13.0 18.1 0.0 3.0 16.3 5.8 8.4 2.8 6.6 4.1 19.9 8.7 1.7 5.7 7.3 11.4Ecuador 28.9 31.8 20.2 24.5 21.0 13.8 12.1 24.2 4.0 5.4 24.6 6.5 4.8 3.2 13.3 18.0 30.0 13.0 3.4 7.1 8.8 14.3El Salvador 24.0 26.1 11.4 13.0 10.9 5.7 25.2 17.7 0.0 4.2 9.2 3.4 7.6 1.9 6.2 8.2 14.9 7.8 1.2 2.6 3.9 7.4Guatemala 12.3 13.2 11.3 13.4 10.3 5.8 11.1 17.6 0.0 4.3 9.3 3.3 6.8 1.9 6.4 8.3 14.9 7.8 1.2 2.8 6.1 6.8Mexico 41.2 35.0 17.8 37.0 19.5 17.1 66.0 27.8 4.7 7.3 16.6 7.3 4.4 5.5 9.2 14.5 30.0 11.1 5.9 7.7 14.2 10.5Nicaragua 15.4 26.5 11.3 13.4 11.4 6.3 29.0 13.2 0.0 4.2 9.3 3.3 7.3 1.8 6.2 8.2 14.9 7.6 1.2 2.8 3.8 6.5Panama 21.5 37.2 10.7 19.6 13.0 9.8 24.1 13.3 0.0 7.9 12.9 7.0 3.9 1.8 7.7 3.6 11.7 8.7 4.8 7.9 11.2 10.1Paraguay 8.9 15.1 10.1 12.4 11.5 8.0 19.6 16.7 6.4 7.5 10.0 9.7 0.2 7.8 10.3 16.4 20.4 13.1 3.2 8.5 8.3 12.5Peru 7.7 4.5 7.5 9.0 4.4 3.4 7.0 9.3 9.0 4.6 0.6 3.0 0.0 3.1 6.7 13.1 17.0 6.8 0.8 3.1 1.5 5.5Uruguay 8.9 15.1 9.8 11.5 11.4 8.0 17.5 16.6 6.0 7.5 10.0 9.7 0.2 7.8 10.0 16.5 20.0 15.3 3.3 11.3 8.6 13.3Venezuela (Bol. Rep. of) 17.2 19.3 14.8 17.9 17.8 16.0 17.4 18.6 10.0 9.2 19.1 10.3 9.8 8.3 13.3 17.8 20.0 13.3 9.2 11.4 14.1 11.4
Source: Economic Commission for Latin America and the Caribbean (ECLAC), on the basis of World Trade Organization (WTO), Tariff Profiles 2010.
19.


Conclusions and recommendations

57
India and Latin America and the Caribbean: opportunities and challenges in trade and investment relations
Given the current uncertainty in the world economy and its new emerging structure increasingly centred on emerging markets, in particular the BRICs, government authorities in Latin America and the Caribbean should redouble their efforts to identify and capitalize on the potential complementarities created by greater integration with that group of countries. Of the four BRICs economies, China, Brazil and India are likely to continue to be at the heart of the significant changes taking place in the world’s economic structure and power balance in the global economy. Countries of the region and India could boost their potential by reinforcing the bridges of South-South cooperation.
Like in China, economic growth in India has been faster than that in developed and other emerging markets. India was able to grow at a positive rate during the international financial crisis, thanks to the implementation of a stimulus package and a countercyclical fiscal policy . India’s strong growth fundamentals, high saving and investment rates, fast labour force growth and rapidly expanding middle class are likely to ensure a steady economic performance, with little volatility in GDP growth rates from year to year. However, economic growth will continue to be constrained by infrastructure bottlenecks, shortages of skilled labour and the difficulties involved in shifting resources from low productivity agriculture to higher productivity manufacturing.
The first decade of this new century has seen a solid performance by Latin America and the Caribbean. Between 2003 and 2008, regional GDP growth averaged nearly 5% per year, with per capita GDP increasing by over 3% per annum. This growth was coupled with improvements in labour-market indicators and a reduction in poverty in the region. One of the most outstanding features of this period was the priority placed by policymakers, in most countries, on maintaining macroeconomic balances, which helped to generate surpluses in both their external and their fiscal accounts. The highly favourable external economic environment during this period, especially the increasing demand for primary products in Asian countries, was another contributing factor. The ramparts that the countries of the region had built through sounder macroeconomic policy management during this period made it possible for the region to weather the international crisis with unprecedented resilience and to emerge from it more quickly and robustly than the developed countries. The region’s economy grew by 6.1% in 2010 and is expected to grow by over 4.5% in 2011.
Medium-term perspectives look promising for India and Latin America and the Caribbean. This reflects not only the larger influence of emerging economies in the main variables of the world economy, but also the stronger links between emerging and developing economies through increased South-South trade and investment. Countries in the region must work together with India to anticipate this new scenario, adjusting their policies and strategies so as to take advantage of the growing potential of South-South economic links and cooperation, by creating biregional business alliances, enhancing cooperation in innovation and human capital

58
Economic Commission for Latin America and the Caribbean (ECLAC)
in order to diversify trade, add greater value and knowledge to exports, and help create more stable conditions for growth.
The region’s trade and investment relations with India, though still in their infancy, are expanding rapidly. So far, Latin American exports to India have been dominated by natural resource-based manufactures, while the region’s imports from India have consisted mainly of natural resource-based manufactures low-, medium- and high-technology manufactures. Given the inter-industrial nature of trade between India and Latin America, the region should seek to create partnerships between its firms and successful Indian companies, in order to gain access to supply chains that produce more complex, technologically sophisticated inputs and services for production units. The best approach may be to build partnerships around chains, in order to increase the sophistication of the natural resource-based manufactures that the region exports to India. Latin America should make optimal use of its natural resources, promoting long-term contracts, investment agreements and technological partnerships in the natural resources sector, as well as strategic production clusters among countries, firms and specific geographical areas in Asia, including India. Strategic partnerships should also be created to increase value added throughout the production and marketing chain, and mutually beneficial technological partnerships should be developed (to apply advances in biotechnology to agro-industry, mining, forestry and fisheries, for example). With respect to India, the creation of value-chains in services will be a high priority.
India’s raw material needs can be met and its food security facilitated by trade with Latin America and the Caribbean. The region is gradually transforming into one of the major suppliers of India’s essential raw materials, such as crude oil, edible oils, and several minerals and metal products. The region also has a large available fertile land area and abundant water resources. Trade and investment with India in natural resource-related areas are expected to expand in the future. At the same time, investments in other fields should also be encouraged. As has occurred in recent years, India’s FDI in the region is expected to continue increasing in areas such as the information and communications technology sector and other services, including construction, manufacturing, and the pharmaceutical industry. A more diversified trade and investment pattern with India would help to attenuate the region’s skewed export structure based on primary products.
To promote trade and investment flows between Latin America and India in such a way as to improve competitiveness, the following constraints need to be addressed: (i) the fact that trade flows by country and the composition of traded products are highly concentrated; (ii) the nature of these flows is almost exclusively inter-industry, and India exports mainly manufactured goods, while Latin America and the Caribbean exports mainly raw materials; and (iii) that this characteristic makes it harder for the region’s countries to engage more effectively in the productive chains of the Asia-Pacific region, which are increasingly intra-industry, and into which Indian companies are beginning to integrate. The Latin American and Caribbean region should therefore adopt a two-pronged approach: first, it should pursue a more efficient and coordinated exploitation of natural resource-based comparative advantages; and, second, it

59
India and Latin America and the Caribbean: opportunities and challenges in trade and investment relations
should make greater efforts to promote industrial development by improving the corresponding international competitiveness in manufacturing sectors.
Like China, India has become a major destination for exports from other Asian countries, which have gradually attained a higher degree of specialization, and now produce not only natural resource-based manufactures, but also more complex inputs. Latin American countries with a solid industrial base, such as Brazil and Mexico, should be encouraged to integrate into the complex “Asian Factory” supply chain network that has been created as a result of ASEAN.
Notwithstanding the significant role played by some Latin American countries as leading suppliers of primary products, competition in that sector between Asia and South America is likely to intensify, leading to significant diversion of trade for the region, unless proactive policies are pursued with regard to the adoption of bilateral or subregional trade agreements. Such agreements would have a positive impact on the region, given their effect on international flows of foreign direct investment, as well as the business that they would generate for products currently facing sharp competition in the Indian and other Asian markets from the economies of Asia, North America and Europe.
In this regard, India’s preferential trade agreements with MERCOSUR and Chile have given a boost to the region’s trade with India. However, these agreements still focus mainly on market access for goods only, and in order for them to play a critical role in trade and investment promotion, their scope and depth should be widened to include other areas such as services, investment, government procurement and intellectual property rights. At the same time, more countries in the region should show an interest in negotiating comprehensive free trade agreements with India in the future, or at least partial preferential agreements, which could later be upgraded.
During the favourable external cycle of 2003-2008, Latin America grew faster than at any time in the last four decades, but it did not reduce its productivity gap with industrialized economies or that between modern and less advanced sectors within the region’s national economies. The countries of the region urgently need to: (i) develop new linkages to strengthen innovation and competitiveness (a weakness in the Latin American region); (ii) strengthen links between trade and investment; and (iii) consolidate productive and technological linkages. The success of any strategy aimed at convergence with industrialized economies will be measured by indicators showing innovation, productivity, diversification of the productive and export base, a more qualified workforce, a strengthening of the link between exports and the rest of the economy, and a less unequal income distribution. To differing degrees, India shares these fundamental problems in its own economy, making these systemic issues good areas for mutual cooperation in the coming years.
Latin American countries should strengthen their trade ties and increase their productive complementarity with India, striving to integrate into Asian production and export chains. To do so, they will need to form trade and investment partnerships that go beyond free trade agreements. Although these agreements may be important, they are not enough to generate the scale and critical mass needed to encourage trade and technology partnerships between

60
Economic Commission for Latin America and the Caribbean (ECLAC)
the two regions, or to reduce the marked asymmetry between the increasing volumes of trade and still small reciprocal levels of investment. The relationship between trade and FDI can also be affected by broadly defined transaction costs that include transportation costs, as well as trade logistics, and communication with trading partners. Companies must decrease costs and improve product quality, delivery and customer service in order to maintain good relationships with their clients in an increasingly globalized economy.
A complex and complete network of free trade agreements has emerged in the Asia-Pacific region, with the ASEAN at its core. The proliferation of free trade agreements in this region involves not only those signed by ASEAN as a whole or its individual member countries, but also those within the framework of ASEAN+3 (ASEAN plus China, Japan and the Republic of Korea) or ASEAN+6 (ASEAN+3 plus India, Australia and New Zealand). As India becomes increasingly integrated into Asian supply chains, by way of greater production and trade complementarities and lower levels of protection in goods and services among the parties to these free trade agreements, Latin America and the Caribbean, as an exporter of primary products and their processed goods, could find itself increasingly at a disadvantage. The work that lies ahead for ASEAN+6 is fundamentally important for Latin America and involves areas in which the region can contribute in a way that is beneficial to both regions.
India is in a position to promote South-South cooperation between Latin America and the Caribbean and the Asia-Pacific region. Both regions have a tradition of fruitful cooperation in regional and multilateral forums, including within the United Nations system. India and Latin America have been, and will continue to be, key actors in safeguarding an effective multilateral system and promoting the democratization of global governance structures. In respect of the Doha Development Agenda, for instance, both should continue stressing the importance of close coordination to bring to the fore the development dimension in every aspect of the negotiations, promoting the interests of developing countries and reaffirming their commitment to work closely together in the Group of Twenty (G20).
The ascendancy of Latin America and the Caribbean and India in the global economy may represent an opportunity in the medium and long terms to the extent that it induces both countries to rethink their strategies with a view to changing their production models to adapt to the global economy and to introduce more proactive policies for productive development, competitiveness and innovation. Technological capacities will have to be strengthened significantly in order to compete on the global market on the basis of higher value-added products and knowledge-based goods and services. Latin America and the Caribbean and India can work together in the following areas of South-South cooperation:
• Developmentofjointstrategiesfortradeandinvestmentpromotion;
• cooperationoninfrastructure,competitivenessandinnovation;
• climatechange,greeneconomyandgreentrade;and
• policydialogueoncooperation.

61
India and Latin America and the Caribbean: opportunities and challenges in trade and investment relations
There is a great need for information exchange on market opportunities and market access, including basic economic indicators, recent trends in biregional trade and investment, developments in regional integration, standards, tariffs and non-tariff trade measures, as well as a need for capacity- and institution-building for biregional trade and investment promotion.
The countries in both regions face several challenges: eliminating poverty, radically improving living standards and attaining food security, for example, remain among the highest priorities. This is an area conducive to wide consultation and cooperation, including South-South cooperation. The countries of the region and India need not only to tap into the resources of developed countries, but also to usher in the second Green Revolution, harnessing contemporary biotechnology, water conservation and harvesting techniques and adopting an approach that is both environmentally friendly and economically sustainable. The Indian and Latin American authorities are also committed to finding effective solutions to climate change, without foreclosing developing countries’ right to accelerated economic and social development for the purposes of poverty alleviation.
The policy dialogue process should also include issues such as: (a) trade-related capacity-building, including several emerging issues such as trade facilitation and the Aid for Trade Initiative; (b) the World Trade Organization process, addressing not only the Doha Round of trade talks, but also the development dimension, the issue of convergence or divergence between regionalism and multilateralism and strengthened operational rules on special and differential treatment; and (c) free trade agreements, including bilateral, subregional or biregional free trade agreements and the related negotiation, implementation and administration processes. Policy dialogue should also address one of the main disadvantages of India and Latin American and the Caribbean in global markets today: the lack of infrastructure, trade-related logistics and efficiency in production and trading processes, which make their products less competitive on global markets.
The Indian and Latin American authorities should institutionalize the policy dialogue process by holding periodic high-level meetings and even summits, with the active participation of the private sector.


Annex


65
India and Latin America and the Caribbean: opportunities and challenges in trade and investment relations
Table A.1 LATIN AMERICA AND THE CARIBBEAN: EXPORTS TO SELECTED COUNTRIES AND ASIA-PACIFIC GROUPINGS, ACCUMULATED 2008-2010a
(Millions of dollars and percentages)
Total exports by destination Share in total exports for Latin America
and the Caribbean Share in total exports of each country
ASEA
N
Aust
ralia
and
Ne
w Z
eala
nd
Chin
a
Indi
a
Japa
n
Rep.
of K
orea
Asia
- Pa
cific
Wor
ld
ASEA
N
Aust
ralia
and
Ne
w Z
eala
nd
Chin
a
Indi
a
Japa
n
Rep.
of K
orea
Asia
- Pa
cific
ASEA
N
Aust
ralia
and
Ne
w Z
eala
nd
Chin
a
Indi
a
Japa
n
Rep.
of K
orea
Asia
- Pa
cific
Wor
ld
Latin America and the Caribbean
36 253 8 112 152 956 20 901 53 618 29 801 301 640 2 418 928 100.0 100.0 100.0 100.0 100.0 100.0 100.0 1.5 0.3 6.3 0.9 2.2 1.2 12.5 100.0
Andean countries 2 247 628 17 902 1 482 7 836 4 499 34 595 272 191 6.2 7.7 11.7 7.1 14.6 15.1 11.5 0.8 0.2 6.6 0.5 2.9 1.7 12.7 100.0
Bolivia (Plur. State of) 32 114 468 13 977 1 675 3 279 19 068 0.1 1.4 0.3 0.1 1.8 5.6 1.1 0.2 0.6 2.5 0.1 5.1 8.8 17.2 100.0
Colombia 1 223 96 3 359 830 1 219 593 7 320 110 298 3.4 1.2 2.2 4.0 2.3 2.0 2.4 1.1 0.1 3.0 0.8 1.1 0.5 6.6 100.0
Ecuador 234 68 836 31 613 35 1 816 49 725 0.6 0.8 0.5 0.1 1.1 0.1 0.6 0.5 0.1 1.7 0.1 1.2 0.1 3.7 100.0
Peru 759 351 13 239 609 5 027 2 197 22 180 93 100 2.1 4.3 8.7 2.9 9.4 7.4 7.4 0.8 0.4 14.2 0.7 5.4 2.4 23.8 100.0
Mexico and Central America
3 767 2 160 10 378 3 914 6 824 2 513 29 555 923 085 10.4 26.6 6.8 18.7 12.7 8.4 9.8 0.4 0.2 1.1 0.4 0.7 0.3 3.2 100.0
Costa Rica 561 106 1 647 79 240 196 2 829 27 626 1.5 1.3 1.1 0.4 0.4 0.7 0.9 2.0 0.4 6.0 0.3 0.9 0.7 10.2 100.0
El Salvador 34 9 13 13 57 24 150 12 846 0.1 0.1 0.0 0.1 0.1 0.1 0.0 0.3 0.1 0.1 0.1 0.4 0.2 1.2 100.0
Guatemala 193 15 97 77 368 179 929 23 405 0.5 0.2 0.1 0.4 0.7 0.6 0.3 0.8 0.1 0.4 0.3 1.6 0.8 4.0 100.0
Honduras 1 2 42 4 19 52 120 2 628 0.0 0.0 0.0 0.0 0.0 0.2 0.0 0.0 0.1 1.6 0.2 0.7 2.0 4.6 100.0
Mexico 2 869 2 002 8 448 3 701 5 570 1 965 24 556 819 282 7.9 24.7 5.5 17.7 10.4 6.6 8.1 0.4 0.2 1.0 0.5 0.7 0.2 3.0 100.0
Nicaragua 3 17 17 19 43 7 106 5 778 0.0 0.2 0.0 0.1 0.1 0.0 0.0 0.1 0.3 0.3 0.3 0.7 0.1 1.8 100.0
Panama 105 9 113 21 528 89 865 31 520 0.3 0.1 0.1 0.1 1.0 0.3 0.3 0.3 0.0 0.4 0.1 1.7 0.3 2.7 100.0
Southern Cone 29 982 5 260 124 146 15 243 38 573 22 394 235 597 1 163 459 82.7 64.8 81.2 72.9 71.9 75.1 78.1 2.6 0.5 10.7 1.3 3.3 1.9 20.2 100.0
Argentina 8 145 973 15 820 2 800 1 867 1 955 31 560 193 825 22.5 12.0 10.3 13.4 3.5 6.6 10.5 4.2 0.5 8.2 1.4 1.0 1.0 16.3 100.0
Brazil 18 288 2 493 67 346 7 999 17 508 9 496 123 130 548 294 50.4 30.7 44.0 38.3 32.7 31.9 40.8 3.3 0.5 12.3 1.5 3.2 1.7 22.5 100.0
Chile 3 058 1 789 39 117 4 233 18 932 10 832 77 960 190 825 8.4 22.1 25.6 20.3 35.3 36.3 25.8 1.6 0.9 20.5 2.2 9.9 5.7 40.9 100.0
Paraguay 237 2 163 166 170 49 788 12 164 0.7 0.0 0.1 0.8 0.3 0.2 0.3 1.9 0.0 1.3 1.4 1.4 0.4 6.5 100.0
Uruguay 207 2 405 19 49 45 727 11 327 0.6 0.0 0.3 0.1 0.1 0.1 0.2 1.8 0.0 3.6 0.2 0.4 0.4 6.4 100.0
Venezuela (Bol. Rep. of)b
46 1 1 294 27 46 17 1 432 207 024 0.1 0.0 0.8 0.1 0.1 0.1 0.5 0.0 0.0 0.6 0.0 0.0 0.0 0.7 100.0
Caribbean countries 257 63 531 262 385 395 1 893 60 192 0.7 0.8 0.3 1.3 0.7 1.3 0.6 0.4 0.1 0.9 0.4 0.6 0.7 3.1 100.0
Antigua and Barbuda 0 0 0 0 0 0 1 241 0.0 0.0 0.0 0.0 0.0 0.0 0.0 0.0 0.1 0.1 0.0 0.0 0.0 0.2 100.0
Bahamas 0 4 5 0 3 0 13 1 286 0.0 0.0 0.0 0.0 0.0 0.0 0.0 0.0 0.3 0.4 0.0 0.2 0.0 1.0 100.0
Barbados 5 1 6 5 0 1 17 1 091 0.0 0.0 0.0 0.0 0.0 0.0 0.0 0.4 0.1 0.5 0.4 0.0 0.1 1.5 100.0
Belize 0 0 2 0 19 0 21 827 0.0 0.0 0.0 0.0 0.0 0.0 0.0 0.0 0.0 0.2 0.0 2.3 0.0 2.5 100.0
Dominica 0 0 0 0 108 0.0 0.0 0.0 0.0 0.0 0.0 0.0 0.0 0.0 0.0 0.0 0.0 0.0 0.0 100.0
Dominican Rep. 130 16 340 58 120 1 665 15 667 0.4 0.2 0.2 0.3 0.2 0.0 0.2 0.8 0.1 2.2 0.4 0.8 0.0 4.2 100.0
Grenada 0 0 0 0 1 0 1 31 0.0 0.0 0.0 0.0 0.0 0.0 0.0 0.0 0.1 0.6 0.0 3.7 0.0 4.5 100.0
Guyana 27 6 42 14 18 3 108 2 555 0.1 0.1 0.0 0.1 0.0 0.0 0.0 1.0 0.2 1.6 0.5 0.7 0.1 4.2 100.0
Jamaica 35 10 20 2 77 19 163 5 082 0.1 0.1 0.0 0.0 0.1 0.1 0.1 0.7 0.2 0.4 0.0 1.5 0.4 3.2 100.0
Saint Kitts and Nevis 0 0 0 0 0 51 0.0 0.0 0.0 0.0 0.0 0.0 0.0 0.0 0.0 0.0 0.0 0.3 0.0 0.4 100.0
Saint Lucia 1 0 1 1 0 0 2 164 0.0 0.0 0.0 0.0 0.0 0.0 0.0 0.3 0.0 0.6 0.4 0.0 0.1 1.4 100.0
Saint Vincent and the Grenadines
0 0 0 0 0 0 143 0.0 0.0 0.0 0.0 0.0 0.0 0.0 0.1 0.0 0.0 0.0 0.0 0.0 0.1 100.0
Suriname 5 1 52 2 11 0 71 5 171 0.0 0.0 0.0 0.0 0.0 0.0 0.0 0.1 0.0 1.0 0.0 0.2 0.0 1.4 100.0
Trinidad and Tobago 55 26 63 179 137 371 831 27 776 0.2 0.3 0.0 0.9 0.3 1.2 0.3 0.2 0.1 0.2 0.6 0.5 1.3 3.0 100.0
Source: Economic Commission for Latin America and the Caribbean (ECLAC), on the basis of United Nations Commodity Trade Statistics Database (COMTRADE).
a Data are not available for Antigua and Barbuda, and Honduras from 2008 ; for Grenada, Saint Kitts and Nevis and Saint Lucia from 2009; or for Bahamas, Grenada, Honduras, Saint Kitts and Nevis, Saint Lucia, Trinidad and Tobago and Uruguay from 2010.
b Oil statistics were estimated by COMTRADE and may not be included for every country.

66
Economic Commission for Latin America and the Caribbean (ECLAC)
Table A.2 LATIN AMERICA AND THE CARIBBEAN: IMPORTS FROM SELECTED COUNTRIES AND ASIA-PACIFIC GROUPINGS, ACCUMULATED 2008-2010a
(Millions of dollars and percentages)
Total imports by origin Share in total imports to Latin America
and the Caribbean Share in total importsof each country
ASEA
N
Aust
ralia
and
Ne
w Z
eala
nd
Chin
a
Indi
a
Japa
n
Rep.
of K
orea
Asia
- Pa
cific
Wor
ld
ASEA
N
Aust
ralia
and
Ne
w Z
eala
nd
Chin
a
Indi
a
Japa
n
Rep.
of K
orea
Asia
- Pa
cific
ASEA
N
Aust
ralia
and
Ne
w Z
eala
nd
Chin
a
Indi
a
Japa
n
Rep.
of K
orea
Asia
- Pa
cific
Wor
ld
Latin America and the Caribbean
75 670 11 027 293 875 23 114 93 729 79 666 577 081 2 337 958 100.0 100.0 100.0 100.0 100.0 100.0 100.0 3.2 0.5 12.6 1.0 4.0 3.4 24.7 100.0
Andean countries 5 568 550 33 165 3 518 10 222 7 182 60 205 264 102 7.4 5.0 11.3 15.2 10.9 9.0 10.4 2.1 0.2 12.6 1.3 3.9 2.7 22.8 100.0
Bolivia (Plur. State of) 146 17 1 320 115 1 118 98 2 813 14 781 0.2 0.2 0.4 0.5 1.2 0.1 0.5 1.0 0.1 8.9 0.8 7.6 0.7 19.0 100.0
Colombia 2 168 161 13 741 1 719 3 135 2 540 23 464 113 249 2.9 1.5 4.7 7.4 3.3 3.2 4.1 1.9 0.1 12.1 1.5 2.8 2.2 20.7 100.0
Ecuador 1 323 35 5 650 372 2 395 2 052 11 825 54 370 1.7 0.3 1.9 1.6 2.6 2.6 2.0 2.4 0.1 10.4 0.7 4.4 3.8 21.7 100.0
Peru 1 932 338 12 454 1 313 3 574 2 492 22 103 81 702 2.6 3.1 4.2 5.7 3.8 3.1 3.8 2.4 0.4 15.2 1.6 4.4 3.1 27.1 100.0
Mexico and Central America
41 723 3 941 129 480 5 455 48 065 40 561 269 225 1 015 294 55.1 35.7 44.1 23.6 51.3 50.9 46.7 4.1 0.4 12.8 0.5 4.7 4.0 26.5 100.0
Costa Rica 660 51 2 556 205 1 980 577 6 028 40 760 0.9 0.5 0.9 0.9 2.1 0.7 1.0 1.6 0.1 6.3 0.5 4.9 1.4 14.8 100.0
El Salvador 230 134 1 298 85 442 266 2 455 25 494 0.3 1.2 0.4 0.4 0.5 0.3 0.4 0.9 0.5 5.1 0.3 1.7 1.0 9.6 100.0
Guatemala 517 140 2 860 380 929 1 084 5 910 39 873 0.7 1.3 1.0 1.6 1.0 1.4 1.0 1.3 0.4 7.2 1.0 2.3 2.7 14.8 100.0
Honduras 81 17 278 47 94 43 560 5 954 0.1 0.2 0.1 0.2 0.1 0.1 0.1 1.4 0.3 4.7 0.8 1.6 0.7 9.4 100.0
Mexico 34 481 3 482 112 827 4 297 42 694 37 204 234 986 844 449 45.6 31.6 38.4 18.6 45.6 46.7 40.7 4.1 0.4 13.4 0.5 5.1 4.4 27.8 100.0
Nicaragua 203 20 930 182 307 270 1 913 12 414 0.3 0.2 0.3 0.8 0.3 0.3 0.3 1.6 0.2 7.5 1.5 2.5 2.2 15.4 100.0
Panama 5 551 96 8 731 259 1 619 1 118 17 374 46 350 7.3 0.9 3.0 1.1 1.7 1.4 3.0 12.0 0.2 18.8 0.6 3.5 2.4 37.5 100.0
Southern Cone 27 007 6 043 124 436 13 490 33 077 31 341 235 393 955 070 35.7 54.8 42.3 58.4 35.3 39.3 40.8 2.8 0.6 13.0 1.4 3.5 3.3 24.6 100.0
Argentina 4 211 836 19 575 1 427 3 478 2 316 31 843 152 749 5.6 7.6 6.7 6.2 3.7 2.9 5.5 2.8 0.5 12.8 0.9 2.3 1.5 20.8 100.0
Brazil 18 050 3 602 61 487 9 989 19 145 18 649 130 920 481 303 23.9 32.7 20.9 43.2 20.4 23.4 22.7 3.8 0.7 12.8 2.1 4.0 3.9 27.2 100.0
Chile 3 005 982 21 535 1 155 7 308 8 758 42 743 160 559 4.0 8.9 7.3 5.0 7.8 11.0 7.4 1.9 0.6 13.4 0.7 4.6 5.5 26.6 100.0
Paraguay 434 5 7 956 153 1 146 362 10 056 26 013 0.6 0.0 2.7 0.7 1.2 0.5 1.7 1.7 0.0 30.6 0.6 4.4 1.4 38.7 100.0
Uruguay 137 40 1 727 122 162 147 2 335 15 976 0.2 0.4 0.6 0.5 0.2 0.2 0.4 0.9 0.2 10.8 0.8 1.0 0.9 14.6 100.0
Venezuela (Bol. Rep. of)b
1 170 578 12 155 645 1 839 1 109 17 495 118 470 1.5 5.2 4.1 2.8 2.0 1.4 3.0 1.0 0.5 10.3 0.5 1.6 0.9 14.8 100.0
Caribbean countries 1 372 494 6 795 650 2 365 582 12 258 103 493 1.8 4.5 2.3 2.8 2.5 0.7 2.1 1.3 0.5 6.6 0.6 2.3 0.6 11.8 100.0
Antigua and Barbuda 10 3 59 2 37 2 113 793 0.0 0.0 0.0 0.0 0.0 0.0 0.0 1.3 0.3 7.4 0.2 4.7 0.3 14.3 100.0
Bahamas - 7 - - 37 - 43 5 928 0.0 0.1 0.0 0.0 0.0 0.0 0.0 0.0 0.1 0.0 0.0 0.6 0.0 0.7 100.0
Barbados 82 85 173 24 148 32 544 4 281 0.1 0.8 0.1 0.1 0.2 0.0 0.1 1.9 2.0 4.0 0.6 3.4 0.7 12.7 100.0
Belize 19 2 197 8 17 12 255 2 202 0.0 0.0 0.1 0.0 0.0 0.0 0.0 0.8 0.1 8.9 0.4 0.8 0.5 11.6 100.0
Dominica 3 1 19 2 28 1 54 679 0.0 0.0 0.0 0.0 0.0 0.0 0.0 0.5 0.1 2.8 0.4 4.1 0.2 8.0 100.0
Dominican Rep. 534 83 4 133 229 826 274 6 078 43 534 0.7 0.8 1.4 1.0 0.9 0.3 1.1 1.2 0.2 9.5 0.5 1.9 0.6 14.0 100.0
Grenada 5 5 22 2 23 3 60 645 0.0 0.0 0.0 0.0 0.0 0.0 0.0 0.7 0.8 3.3 0.3 3.6 0.5 9.2 100.0
Guyana 69 39 220 65 135 24 551 3 970 0.1 0.4 0.1 0.3 0.1 0.0 0.1 1.7 1.0 5.5 1.6 3.4 0.6 13.9 100.0
Jamaica 242 149 791 73 433 71 1 759 18 755 0.3 1.4 0.3 0.3 0.5 0.1 0.3 1.3 0.8 4.2 0.4 2.3 0.4 9.4 100.0
Saint Kitts and Nevis 3 0 4 1 10 1 18 325 0.0 0.0 0.0 0.0 0.0 0.0 0.0 0.9 0.1 1.1 0.2 3.0 0.3 5.7 100.0
Saint Lucia 13 6 7 1 28 5 59 656 0.0 0.1 0.0 0.0 0.0 0.0 0.0 1.9 0.9 1.1 0.1 4.3 0.7 9.1 100.0
Saint Vincent and the Grenadines
7 9 40 4 28 2 90 1 086 0.0 0.1 0.0 0.0 0.0 0.0 0.0 0.6 0.9 3.7 0.3 2.6 0.2 8.3 100.0
Suriname 61 1 292 37 153 7 551 4 092 0.1 0.0 0.1 0.2 0.2 0.0 0.1 1.5 0.0 7.1 0.9 3.7 0.2 13.5 100.0
Trinidad and Tobago 325 103 839 204 463 148 2 082 16 547 0.4 0.9 0.3 0.9 0.5 0.2 0.4 2.0 0.6 5.1 1.2 2.8 0.9 12.6 100.0
Source: Economic Commission for Latin America and the Caribbean (ECLAC), on the basis of United Nations Commodity Trade Statistics Database (COMTRADE).
a Data are not available for Antigua and Barbuda and Honduras from 2008; for Saint Kitts and Nevis and Saint Lucia from 2009; or for Bahamas, Grenada, Honduras, Saint Kitts and Nevis, Saint Lucia, Trinidad and Tobago and Uruguay from 2010.
b Oil statistics were estimated by COMTRADE and may not be included for every country.

67
India and Latin America and the Caribbean: opportunities and challenges in trade and investment relations
Table A.3 INDIAN COMPANIES IN LATIN AMERICA AND THE CARIBBEAN: MAJOR OPERATONS AND FUTURE PROJECTS, BY SECTOR
A. Information technology
Mahindra Satyam (Satyam Computer Service Ltd)
This software development company set up its first design centre in Brazil in São Paulo in May 2007 and its second in Londrina in the state of Paraná. It employs 900 Brazilian employees.
Patni ComputersIt opened its first delivery centre in Latin America in June 2009 to augment its global delivery capabilities and serve the North American and Latin American markets. It has a centre in Querétaro, Mexico, and acquired a Brazilian company in Campinas in the state of São Paulo, Brazil.
Tata Consultancy Services (TCS)
This company has operations in Argentina, Brazil, Chile, Colombia, Ecuador, Mexico, and Uruguay. It employs 7,500 software professionals in these countries. It has signed a contract worth US$ 200 million with ABN Amro Bank in Brazil to be implemented in five years. It has also signed a US$ 140 million contract with Banco Pichincha of Ecuador to be implemented in five years. It has a US$ 200 million contract from the Social Security Institute of Mexico (IMSS). It has established a Global Delivery Centre and a separate Regional Training Centre in Montevideo, Uruguay. It set up a Global Delivery Centre in Guadalajara, Mexico, in May 2007. It is expected to set up operations in Peru.
Infosys Technologies Ltd
It set up its first development centre in Belo Horizonte in December 2009, offering a complete set of services to Brazilian clients and Brazilian subsidiaries. It will also provide language support in English, Portuguese and Spanish. One of its major clients is Philips Latin America. It also has two other centres in Mexico that serve 32 clients and employ 357 professionals.
Aegis
Aegis is part of Essar Group. It acquired Actionline, an Argentine business process outsourcing (BPO) company with 5,000 staff, in 2010. It is the largest Indian BPO in Latin America and the Caribbean. It has centres in Buenos Aires, Córdoba, Tucumán and Bahía Blanca. The company has another centre in Costa Rica.
Cognizant The company has set up operations in Argentina with 200 staff.
Copal partners This financial research company established an office in Buenos Aires in the second half of 2010.
HCL TechnologiesIt opened centres in Buenos Aires, São Paulo and Porto Alegre in June 2009 to service local and global clients.
PolarisThis company identifies Latin America as an integral growth market for its expansion strategy. It opened a Regional Innovation and Development Centre in Santiago, Chile, in May 2009, hiring 100 people.
Sasken Communications It has set up a subsidiary company for IT development and support in Nuevo León, Mexico.
Wipro
This company set up operations in Monterrey, Mexico, in 2007 to serve North America and Latin America and has a payroll of approximately 1,000 employees. It has a BPO centre in Curitiba, Brazil, that provides shared services to AmBev, a leading brewery company, and recently inaugurated its new global delivery centre in the city.

68
Economic Commission for Latin America and the Caribbean (ECLAC)
AptechAptech entered into a 51:49 joint venture with Falgo Group to set up IT training centres in Brazil. At present, the company has centres in Mexico, El Salvador and Peru.
Aptech, NIIT and Tata Infortech
These three companies have collaborated with Colombian universities and private companies to establish about 20 IT education centres in various Colombian cities.
ICICI This company has a BPO in Argentina with 350 employees.
CRISILIREVNA, a division of CRISIL, has set up a knowledge process outsourcing (KPO) unit in Buenos Aires for equity research with 70 Argentine staff.
E-ValueserveThis market research firm started operations in Chile in 2007. It is located in Valparaíso and it currently generates 10% of the global sales of the firm and hires 6% of its labour force.
IflexThis company has contracts for banking solutions worth US$ 40 million in the Bolivarian Republic of Venezuela, Chile, Mexico and Panama, among other countries. It has an office in Santiago, Chile.
Flatworld SolutionsThis company opened a centre in Buenos Aires in January 2010. It has other operation centres in Colombia, Paraguay, Peru and the Plurinational State of Bolivia.
24/7 Costumer It opened a BPO in Guatemala in 2008, employing 500 local staff.
Geodesic Ltd It has acquired a Uruguayan software company with 40 staff in Montevideo.
Hexaware TechnologiesThis company has acquired Fox Frames, a Mexican-based IT company, for US$ 34 million to expand its software business.
Manthan SystemsThis provider of business intelligence and analysis solutions for the retail and consumer goods sectors has opened an office São Paulo.
Global Sourcing SolutionsThis company has call centres and a BPO in Argentina, Colombia, Peru and the Plurinational State of Bolivia.
B. Pharmaceuticals
Ranbaxy Laboratories Limited
This company started up operations in Brazil in 2000. Currently, it is the sixth largest generic drug company in Brazil and it directly hires 130 employees.
CellofarmCellofarm’s facility in Brazil was acquired by Aspen for US$75 million. Aspen is based in South Africa.
GlenmarkGlenmark took over Argentine company Servycal S.A. in 2005. It invested in a new facility near São Paulo and has a plant for the production of oncological medicines in Buenos Aires.
Torrent Torrent has a Brazilian subsidiary, employing 300 Brazilian professionals.
Bilcare Bilcare is setting up a plant in Brazil for the manufacture of pharmaceutical packaging materials.
Zydus CadilaThis company has acquired Brazilian company Nikkho, which has a turnover of over US$ 60 million.

69
India and Latin America and the Caribbean: opportunities and challenges in trade and investment relations
Manish PharmaThis company has acquired companies in the states of São Paulo and Santa Catarina, which are already operational.
Dr.Reddy’s Labs This company acquired a pharmaceutical plant for US$ 60 million in Mexico in 2006.
Cipla Cipla has presence in Brazil and is in the process of forming a subsidiary.
Claris Lifesciences This company has a local subsidiary in Brazil.
PICA Labs This company has production facilities in Brazil and an office in Colombia.
Aurobindo Aurobindo has invested in a warehouse facility in Anápolis, Brazil.
Unichem Unichem, Intas and Sunpharma have established subsidiaries in Brazil.
Lupin, Zydus Cadilla and Emcure
These firms are among the pharmaceutical companies actively looking for acquisition opportunities and joint ventures in the region.
C. Minerals and metals
Videocon Industries Ltd and Bharat Petroresources
This consortium was awarded an exploration contract in Brazil for US$ 283 million. They acquired all of the shares of Encana Brasil Petróleo Limitada that belonged to the Canadian EnCana Corporation.
Jindal Steel and Power Limited
Jindal Steel and Power Limited has branched into the mining sector through a US$ 2.3 billion investment in the El Mutún iron ore project in the Plurinational State of Bolivia. Most of the iron ore will be exported. Jindal Steel and Power Limited has also bought a mine in northern Chile for US$ 53 million to extract magnetite.
Tega Industries LtdTega Industries Ltd acquired Chilean company Acotec S.A. in February 2011. Acotec is a $35 million company providing products and solutions for abrasion, corrosion and fluid transportation systems to the mining industry in Argentina, Chile, Peru and the Plurinational State of Bolivia.
Aditya Birla GroupThe group has acquired three aluminium plants in Pindamonhangaba, Ouro Preto and Aratu in Brazil. It plans to invest US$300 million in increasing its aluminium production capacity by 20% to 250,000 tons by 2014.
GAIL (India) LtdThis company announced, in September 2008, its plans to build a petrochemical complex in Colombia, along with a gas pipeline network.
Ispat Industries LtdThe company will start iron extraction operations in Brazil and carbon exploitation in Colombia. The mine in Brazil has reserves of approximately 300 million to 500 million tons, while the Colombian mine has between 60 million and 70 million tons.
JSW Steel
JSW Steel obtained a licence for exploring and extracting magnetite in an area spanning 1,200 hectares in northern Chile, specifically in the region of Atacama, at a cost of US$ 53 million. This licence was awarded in 2008, and mention has been made of future plans of continuing to expand its operations in the region.

70
Economic Commission for Latin America and the Caribbean (ECLAC)
Arcelor MittalThis company has steel plants in Argentina, Brazil, Mexico and Trinidad and Tobago. It has also acquired steel-finishing and distribution companies in Argentina, Costa Rica and Uruguay.
Essar group
Essar Steel Ltd is building a steel plant in Trinidad and Tobago with a capacity of 2.5 million tons. This is part of the group’s plan to increase its capacity from the present level of 8 million tons to 25 million tons by 2012. The company was awarded a mining concession in Amapá, located in the north of Brazil, and the material from that concession will be processed at the plant in Trinidad and Tobago. The area of the concession in Amapá measures 7,851.69 hectares. It is 150km from the Santana Public Port in Macapá, on the banks of the Amazon river, and close to Essar’s proposed steel plant in Trinidad and Tobago. This would be Essar Steel’s second international raw material deposit.In 2007, Essar Steel acquired Minnesota Steel, which had more than 1.4 billion tons of iron ore resources in the Mesabi Range in the United States.
Indo- Borax Ltd This company acquired a borax mine in Argentina.
NALCO NALCO has announced plans to invest in copper mining in Chile.
Zamin ResourcesZamin Resources, founded by Pramod Agarwal, who is based in London, has won an iron ore mining concession in Uruguay. This billion-dollar project Is one of several investments the company has made in mining in South American countries.
D. Energy
Oil and Natural Gas Corporation Ltd (ONGC)
The company has been awarded oil fields by the Governments of the Bolivarian Republic of Venezuela and Cuba. It has acquired oil fields in Brazil, Colombia and Trinidad and Tobago. Its overseas arm, ONGC Videsh Ltd is expected to invest over a billion dollars in these projects.ONGC signed an agreement to explore Cuban waters in the Gulf of Mexico for oil. This area covered measures 4,300 square kilometres. In 2008, ONGC invested US$ 356 million to acquire 40% of a joint development with Petróleos de Venezuela S.A. (PDVSA) in the fields of San Cristóbal and Junín, both belonging to the Orinoco Oil Belt. ONGC, in a joint venture with Sinopec, acquired Colombian oil company Omimex in 2006. This company has proven reserves totalling more than 300 million barrels and a daily production of approximately 20,000 barrels. In addition, in 2007, the company was awarded a deep water block and a shallow water block in the ninth round of the bidding process opened by the Brazilian regulator, the Agencia Nacional do Petróleo de Brasil. ONGC – along with the Indian Oil Corporation, Oil India, and Reliance Industries – is considering a joint investment in the Orinoco Oil Belt, which has the potential to produce 200,000 barrels of light crude oil per day. The investment in this project would come to between US$ 16 billion and US$ 18 billion.ONGC Videsh Ltd has offshore oilfield concessions in Cuba on its own and as part of a consortium led by Repsol.
Bharat Petro Resources (BPR)
BPR, along with Videocon International, acquired ten blocks in Brazil from EnCana of Canada valued at US$ 280 million. BPR and Videocon have discovered more than 90 feet of high-quality oil in their Wahoo-2 well block, also identified as BM-C-30.

71
India and Latin America and the Caribbean: opportunities and challenges in trade and investment relations
Reliance Industries Ltd
This company acquired the Borojo offshore oil block in the Tumaco basin on the Pacific coast of Colombia. In a joint venture with China National Petroleum Corporation and Pluspetrol Energy, it was awarded block 155 in Puno, Peru. In June 2008, it acquired 10% of block 39.The company signed a technical evaluation agreement, which subsequently became a production and exploration agreement with the National Hydrocarbon Agency (ANH) of Colombia.
Jindal Steel and Power Ltd, Enigma Oil and Gas Exploration Ltd
These companies were awarded blocks 147, 153 and 159 in the round of bids for oil and gas in Peru in 2008. Jindal Steel and Power Ltd also acquired gas blocks in the Plurinational State of Bolivia.
Suzlon Energy LtdIn 2006, Suzlon Energy Ltd secured a contract for a wind energy project in north-east Brazil. The project has a capacity of 225 MW, comprising 107 units of the Suzlon S88 – 2.1 MW turbines for installation in six projects.
Indian Oil Ltd This company is currently exploring the possibility of setting up an ethanol refinery in Brazil.
Assam company
Assam Company has entered into a farmout agreement with Sismopetrol and R3 in Colombia for the exploration and production of an oil block known as ANH El Triunfo located in Casanare in Colombia. The block size is 10,200 hectares and contains one discovered well (La Cabana). Assam Company has a 70% participating interest in the block, with Sismopetrol holds a 30% participating interest.
Burlington Resources Inc.This company set up an alliance with Woodside Petroleum to acquire 50% of block 108 from Pluspetrol Energy, the company that had acquired 90% of block 141 from Pan Andean Resources Plc. in April 2008.
E. Construction
Larsen and ToubroThis company was awarded a project for supplying equipment to Petrobras in 2008. In addition, early this year, the company started operations in Brazil, where it is planning to set up its oil and gas, cement and paper divisions.
DS Construction
In a joint venture with Israeli company Israel Corp., DS Construction acquired assets for power generation in Brazil. Its other assets include natural gas and hydroelectric power plants in Peru and the Plurinational State of Bolivia, and fuel-based power assets in the Dominican Republic, El Salvador, Guatemala, Jamaica, Nicaragua and Panama, with a total capacity of over 2,180 MW.
F. Agribusiness
Shree Renuka Sugars Ltd
In February 2010, the country’s major sugar producer signed a US$ 329 million deal with a Brazilian conglomerate for a 51% share in Brazil’s Equipav S.A. Açúcar e Álcool, which owns two large sugar mills with integrated co-generation facilities and has 115,000 hectares of cane-growing land in south-eastern Brazil.In November 2009, Shree Renuka Sugars Ltd acquired sugar and ethanol producer Vale Do Ivai S.A. Açúcar e Álcool for US$240 million, with its two sugar and ethanol production facilities in the state of Paraná.With these Brazilian acquisitions, Shree Renuka Sugars Ltd became the third biggest sugar company in the world, the number one sugar firm in India and among the top five in Brazil.

72
Economic Commission for Latin America and the Caribbean (ECLAC)
Bajaj Hindustan This company has set up a subsidiary in Brazil and earmarked US$ 500 million for investment.
Sterling Group Sterling Group has bought a 2,000 hectare olive farm in Argentina.
Olam
This non-resident Indian company with headquarters in Singapore has entered into agricultural production in Argentina and cultivates 30,000 hectares. Peanut is the company’s main crop and it has also acquired two peanut processing plants. In addition, it grows soybean and wheat and is starting rice production in Uruguay and Argentina. In Brazil the company has a turnover of US$ 750 million in agrocommodities trading.
Solvent Extractors Association of India
This consortium of 16 companies has a proposal to invest US$ 50 million in acquiring land to grow oilseed in Uruguay.
G. Other sectors
Tata MotorsThis company’s cars are being sold in several Latin American and Caribbean countries. The company has also forged a joint production agreement with Fiat to refloat the Fiat plant operating in Córdoba, Argentina.
Bajaj AutoThis motorcycle producer has entered into an association agreement with the Guerrero Group in order to assemble motorcycles in Argentina.
Mahindra & Mahindra LtdThis manufacturer of all-terrain vehicles and tractors, in a joint venture with Bramont, has set up an assembly plant in Manaus, Brazil. It has also joined with Venezuelan company Corporación Elice 2222 to manufacture tractors on Margarita Island.
TVSThis company has joined up with DAFRA Motos, a Brazilian company of Grupo Itavema, which has a manufacturing plant in Manaus with capacity to produce 200,000 motorcycles annually. TVS Apache RTR 150 motorcycles are now being produced at this plant.
United Phosphorous Ltd
United Phosphorous Ltd has set up two operating plants in Argentina, one in Reposo and the other one in Icona. In addition, it started operations in Brazil in 2003. The company’s has a turnover of about US$ 100 million. In 2008, United Phosphorous Ltd bought Evofarms, a Colombian agrochemical company.
Besco Besco has entered into a joint venture in southern Brazil for the manufacture of railway wagons.
BEML LtdThis company has set up an assembly plant in the state of Espírito Santo, Brazil, to manufacture mining, earthmoving and railway equipments.
Aditya Birla GroupHindalco Industries, part of the Aditya Birla Group, acquired the United States-based aluminum sheet maker Novelis Inc in a deal worth about US$ 6 billion. Novelis has assets in Brazil in the cities of Ouro Preto, Pindamonhangaba and Utinga in the states of Minas Gerais and São Paulo.
Punjab Chemicals and Crop Protection Ltd (PCCPL)
This company acquired Sintesis Quimica, an Argentine company with two factories in Argentina and a turnover of US$ 50 million.

73
India and Latin America and the Caribbean: opportunities and challenges in trade and investment relations
IFFCO
IFFCO, India’s largest fertilizer producer and the world’s largest in the cooperative sector, has invested US$ 25 million in Americas Petrogas, a Canadian company, which has oil and gas projects in Argentina and a potash mine in Peru. IFFCO is working on the potash project in Peru, as part of its global fertilizer production strategy. It is planning the construction of a potassium chloride plant in Bayóvar (Piura), which will involve an investment of US$ 200 million. It is considering a new ammonia plant in Argentina for US$ 800 million.
Pidilite Pidilite has acquired a Brazilian adhesive company with a turnover of US$ 70 million.
HavellsHavells has acquired the assets and business of Sylvania in Latin America, worth US$ 200 million. It has plants in Brazil, Colombia and Costa Rica. The chief of operations of the Americas, Mr. Kapil Gulati, manages the regional business from Costa Rica.
Birlas This company is setting up a carbon black plant in Mexico.
VideoconVideocon acquired a TV manufacturing plant, owned by Thomson, in Mexico for about half a billion dollars.
Vijai Electricals LtdThis company acquired a transformers plant in João Pessoa in the north-east of Brazil for over a million dollars. It will invest more to expand capacity and reach a turnover of over US$ 50 million.
ELGI Equipments Ltd ELGI Equipments Ltd launched a subsidiary in São Paulo, Brazil, to market its products directly.
GodrejGodrej acquired two Argentine companies, Issue Group and Argencos, in 2010. The two companies are in the cosmetics business with their core strength in hair colour. They have a turnover of US$ 50 million and export their products to other Latin American countries.
Essel Propack This company has acquired plants in Colombia and Mexico that produce laminated plastic tubes.
MegathermThis company has set up a Brazilian subsidiary, Megatherm Group Brasil Ltda, in the foundry sector.

74
Economic Commission for Latin America and the Caribbean (ECLAC)
Table A.4LATIN AMERICAN COMPANIES IN INDIA: MAJOR OPERATIONS AND FUTURE PROJECTS
Company Country of origin
Brazil
Marcopolo This company has a joint venture with Tata Motors for the production of buses in India. Production capacity is 14,000 vehicles per year.
Petrobras Petrobras has been awarded three offshore blocks for exploration in collaboration with ONGC Videsh Ltd.
CVRD CVRD has set up an office in India and is looking for investment opportunities.
Weg This supplier of heavy electrical motors and generators has set up a subsidiary operation in India.
Stefanini Stefanini has set up IT design centres in Bangalore and Hyderabad.
Gerdau This company has invested US$ 71 million in a joint venture with Kalyani Steel.
Dedini Dedini has signed a memorandum of understanding with the Walchand Group for the supply of equipment for ethanol production in India.
COFAP COFAP has set up a 50:50 joint venture in India with the Endurance Group for shock absorbers.
Perto This Porto Alegre-based ATM machine manufacturer is setting up facilities in India. It has already sold 825 ATM machines to the State Bank of India.
Argentina
IMPSA IMPSA has set up an office in Gurgaon to seek opportunities in the hydroelectric power sector.
Biosidus This company has shown interest in establishing a plant in India to produce biotech products.
Galileo This global leader in compressed natural gas (CNG) technologies has supplied technology and equipment to Indian companies and is looking for opportunities to work with gas companies such as Reliance.
Mexico
Homex Homex has set up a joint venture with Daksh Builders to construct low-cost housing.
Cinepolis This company will invest US$ 160 million in India to set up multiplexes across four states, making India their largest market outside Mexico.
Chile
CSAV This shipping company has offices in several major cities in India.
Colombia
FANALCA This company has won a contract for garbage collection and processing in one-third of the city of Chennai and employs 2,600 Indian workers.
Cuba
Biocon Biocon has entered into a joint venture for the manufacture of vaccines in India with Cuban technology.
Source: Economic Commission for Latin America and the Caribbean (ECLAC), on the basis of information from R. Viswanathan, “Business with Latin America”, March 2011, www.businesswithlatinamerica.com; SELA (Sistema Economico Latinoamericano y del Caribe), “India’s Economy and Relations with Latin America and the Caribbean: Current Status and Prospects”, SP/ RRREE-CHINA-INDIA-RUSIA-ALC/DT No. 3-09, July, Caracas; and Deloitte and FICCI (Federation of Indian Chambers of Commerce and Industry) (2010), “India and Latin America and the Caribbean (LAC): Business environment and opportunities for Collaboration”, Deloitte-FICCI theme paper, for India LAC Business Summit, 30 March 2010.

India and Latin America and the CaribbeanOpportunities and challenges in trade and investment relations
Comisión Económica para América Latina y el Caribe (CEPAL)Economic Commission for Latin America and the Caribbean (ECLAC)
www.eclac.org