Embed Size (px)
Citation preview

Indexes
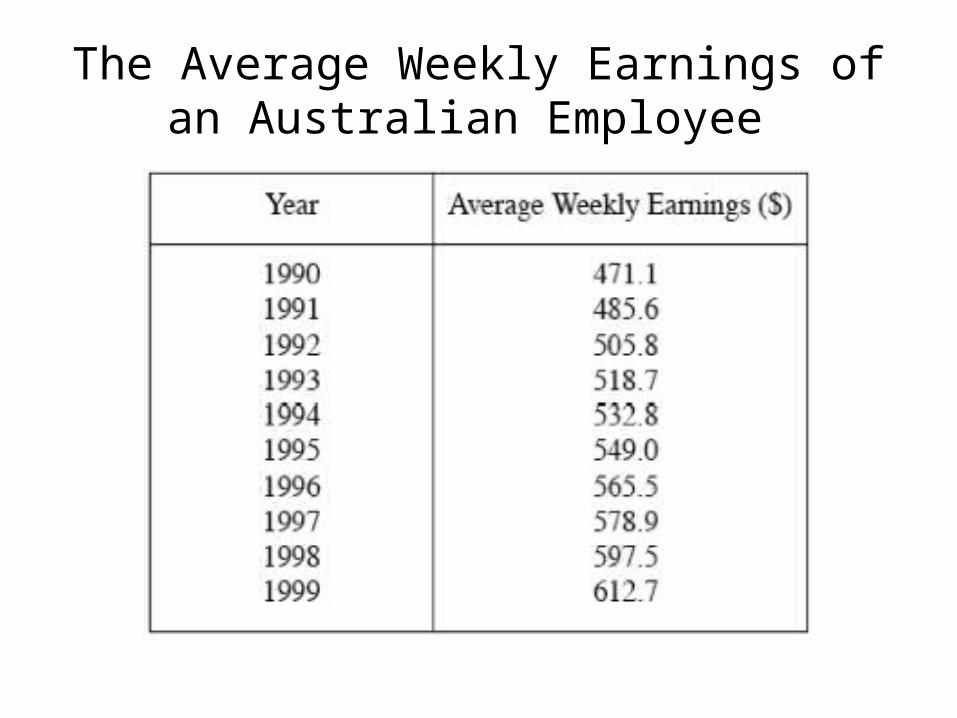
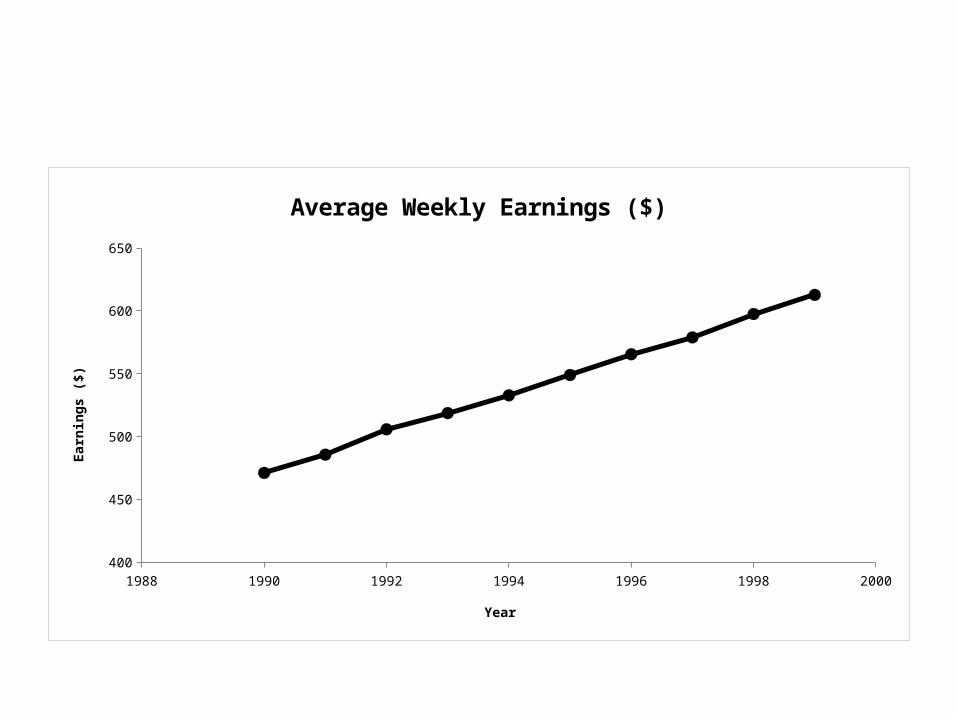
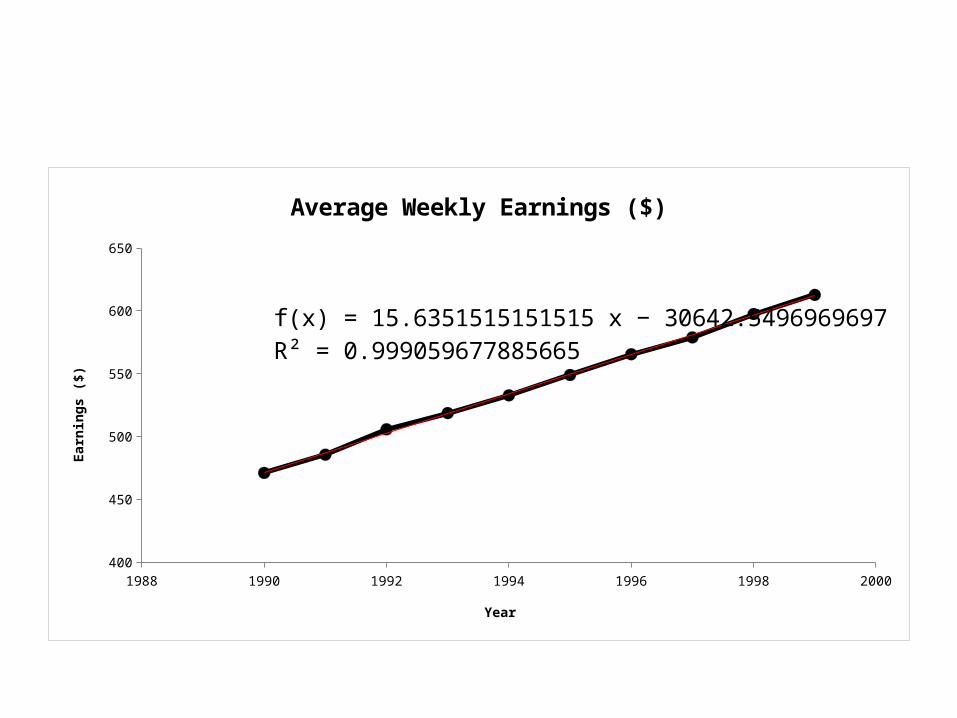
The Average Weekly Earnings of an Australian Employee
1988 1990 1992 1994 1996 1998 2000400
450
500
550
600
650
Average Weekly Earnings ($)
Year
Earn
ings
($)
1988 1990 1992 1994 1996 1998 2000400
450
500
550
600
650
f(x) = 15.6351515151515 x − 30642.5496969697R² = 0.999059677885665
Average Weekly Earnings ($)
Year
Earn
ings
($)
• Multiplying or dividing all the values in a time series by the same constant is called scaling the series.
• Scaling a series does not affect the percentage changes in the series. It is often convenient to scale a series to have a value of 100 in some period. Such a scaled series is called an index.
• Index: A time series that has been scaled so that the value in one period, called the base period, is 100.
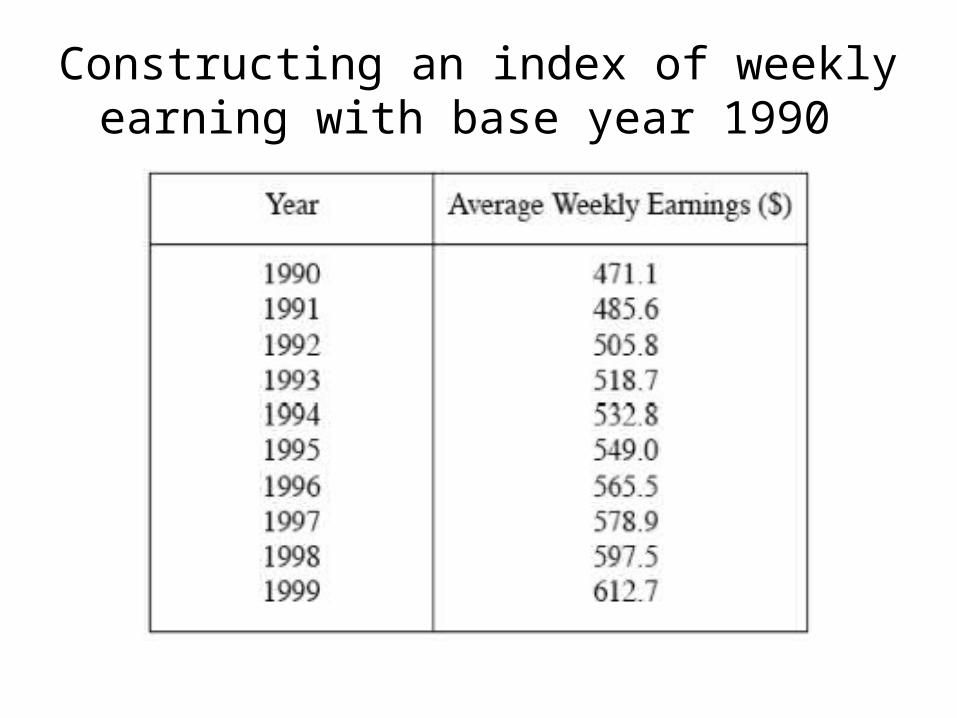
Constructing an index of weekly earning with base year 1990
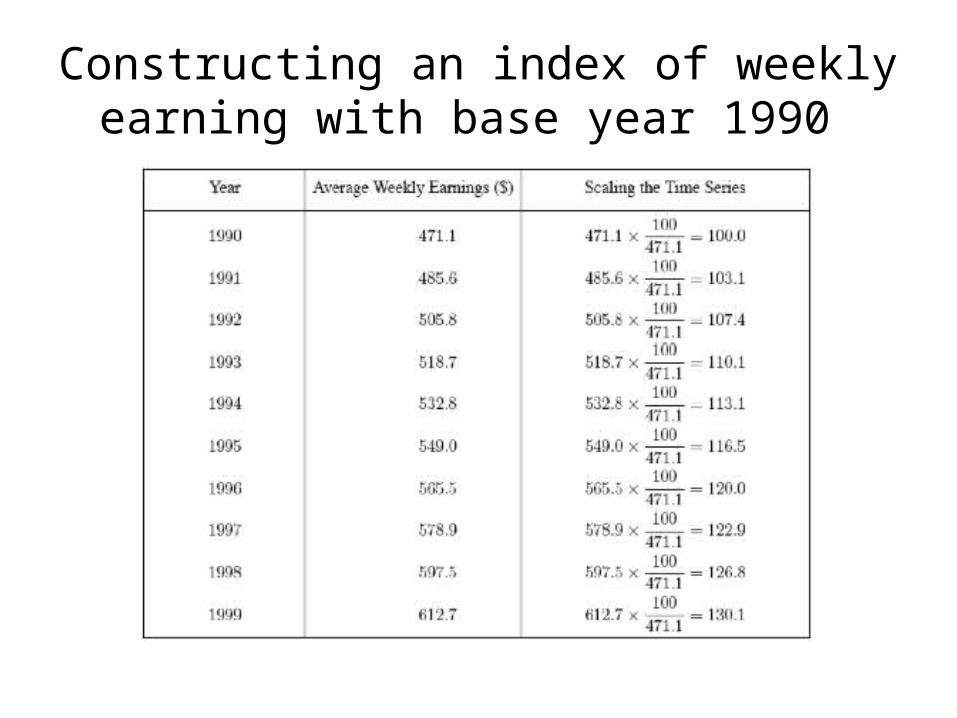
Constructing an index of weekly earning with base year 1990
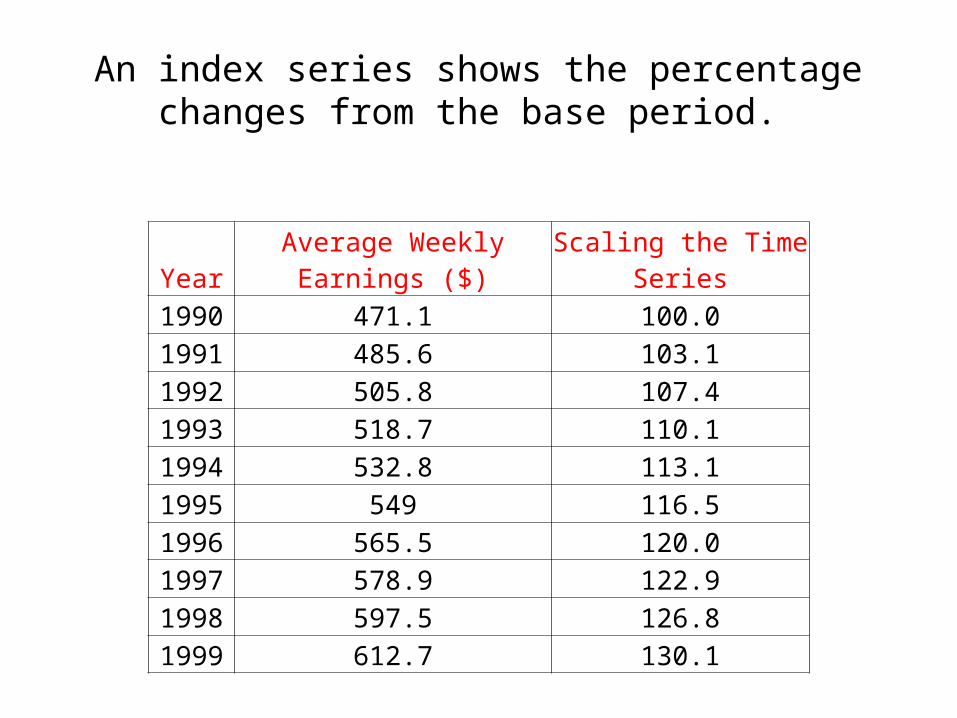
An index series shows the percentage changes from the base period.
Year Average Weekly Earnings ($) Scaling the Time Series1990 471.1 100.01991 485.6 103.11992 505.8 107.41993 518.7 110.11994 532.8 113.11995 549 116.51996 565.5 120.01997 578.9 122.91998 597.5 126.81999 612.7 130.1
Price Indices
• The most widely quoted and used indices are prices indices. These are used to show the percentage change in prices over time.
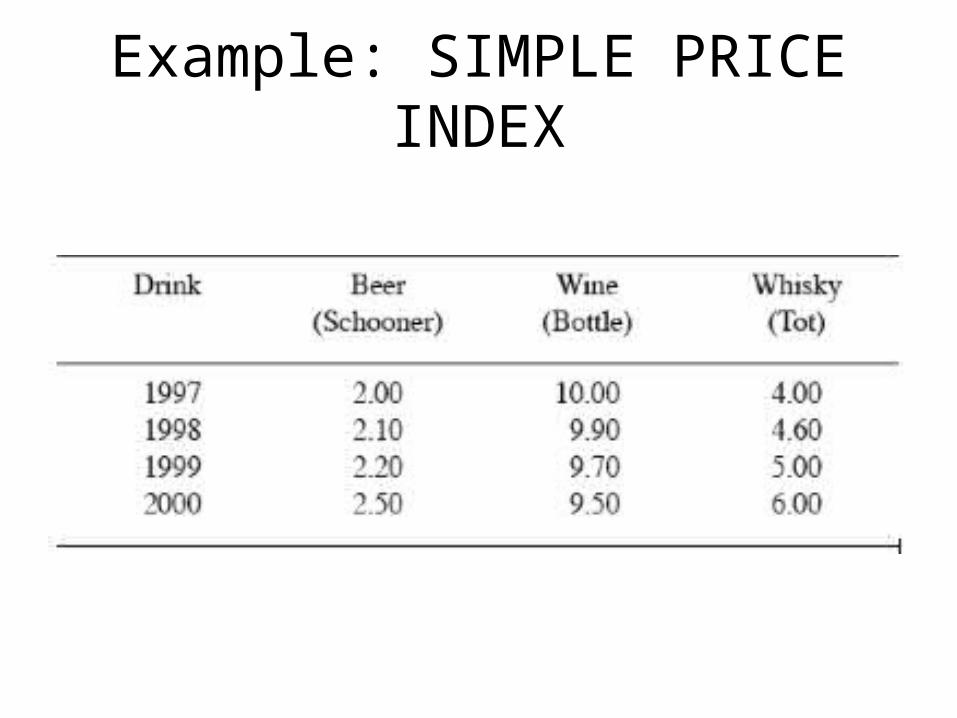
Example: SIMPLE PRICE INDEX
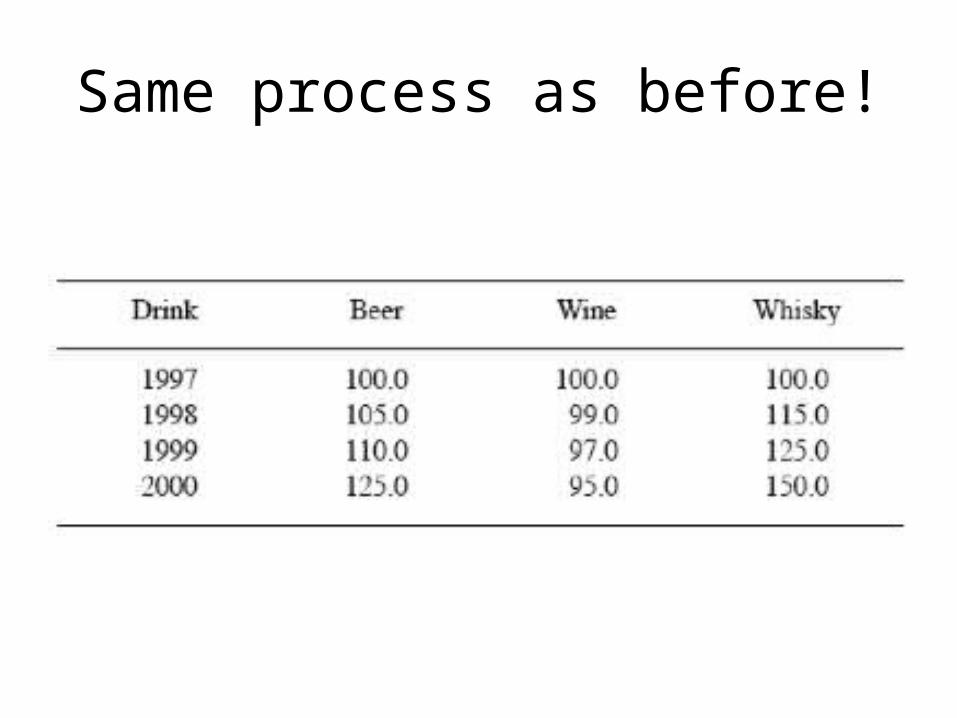
Same process as before!
Compound price index: An index of the prices of a several goods.
• The most important example of this type of index is the consumer price index.
• This index is used to measure the rate of inflation and often impacts on government monetary and fiscal policy.
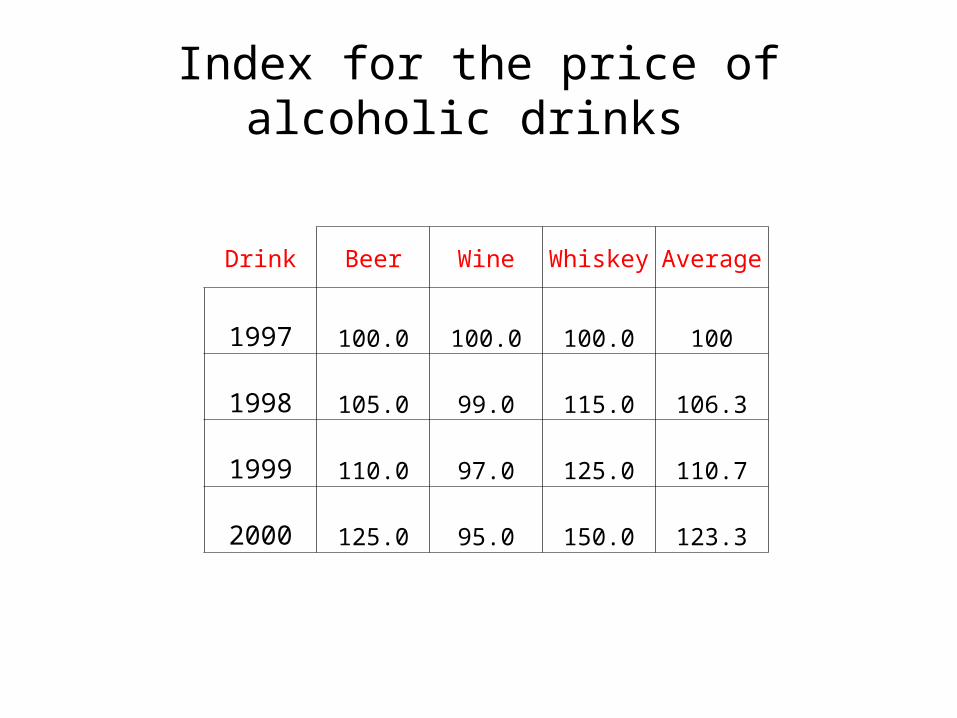
Index for the price of alcoholic drinks
Drink Beer Wine Whiskey Average
1997 100.0 100.0 100.0 100
1998 105.0 99.0 115.0 106.3
1999 110.0 97.0 125.0 110.7
2000 125.0 95.0 150.0 123.3
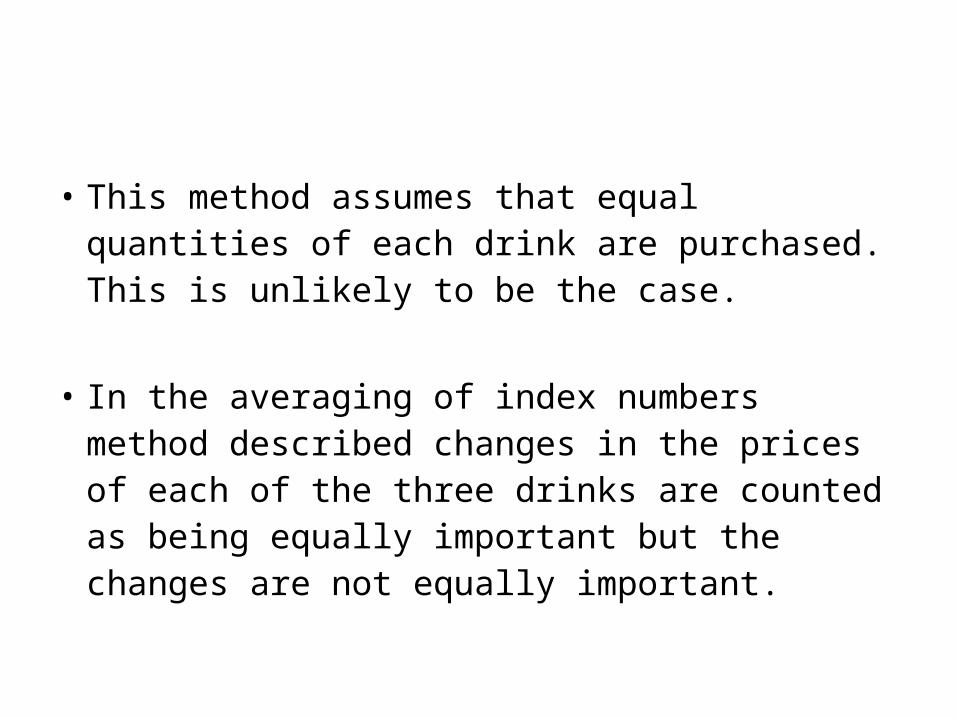
• This method assumes that equal quantities of each drink are purchased. This is unlikely to be the case.
• In the averaging of index numbers method described changes in the prices of each of the three drinks are counted as being equally important but the changes are not equally important.
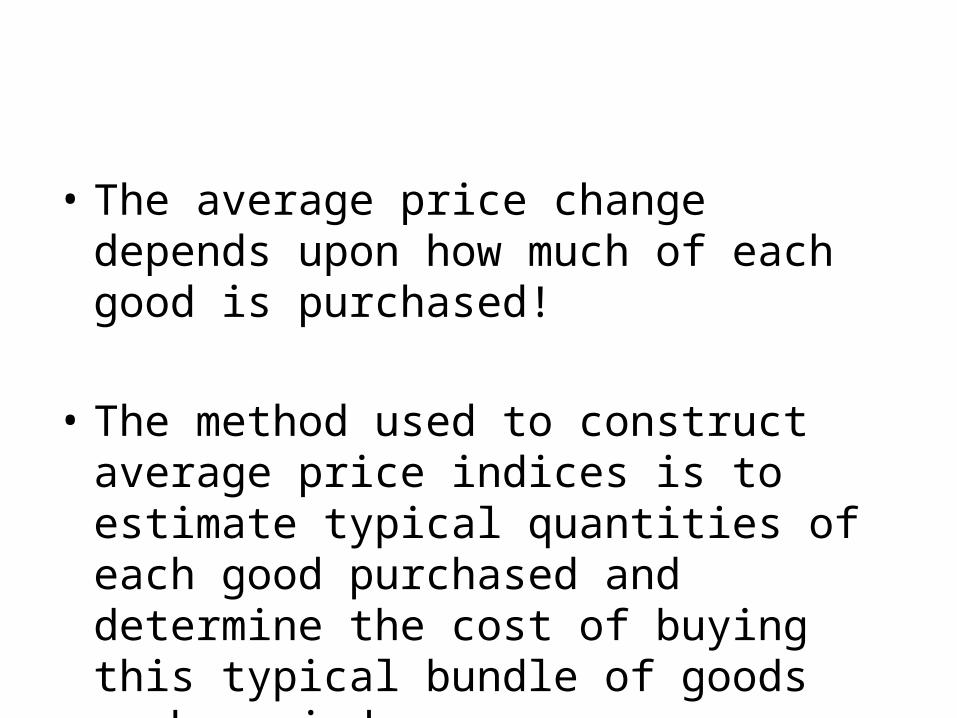
• The average price change depends upon how much of each good is purchased!
• The method used to construct average price indices is to estimate typical quantities of each good purchased and determine the cost of buying this typical bundle of goods each period.
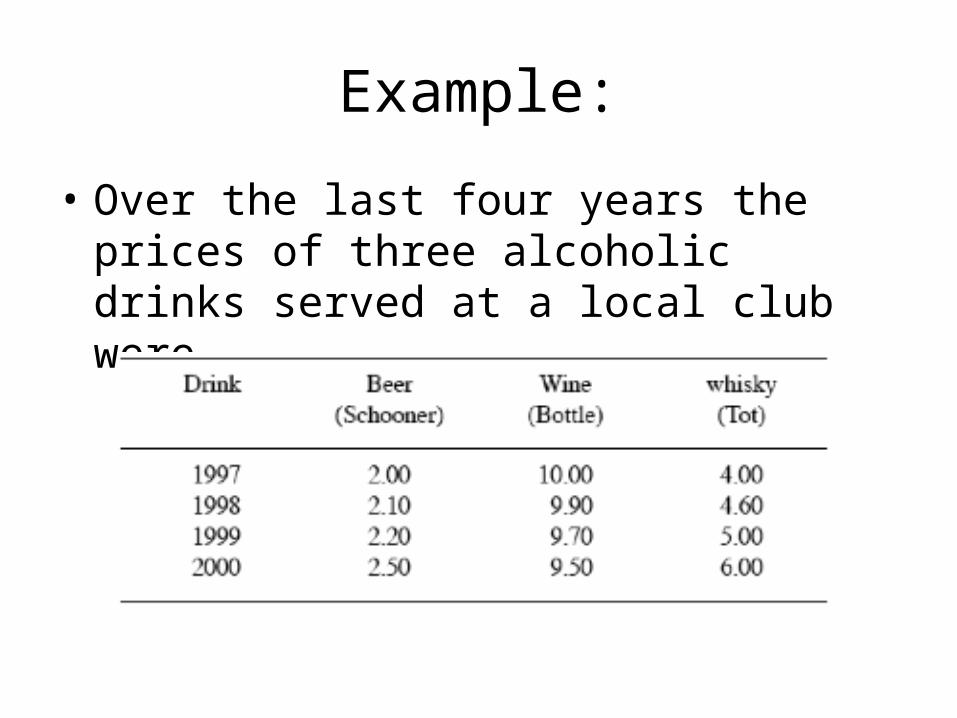
Example:
• Over the last four years the prices of three alcoholic drinks served at a local club were
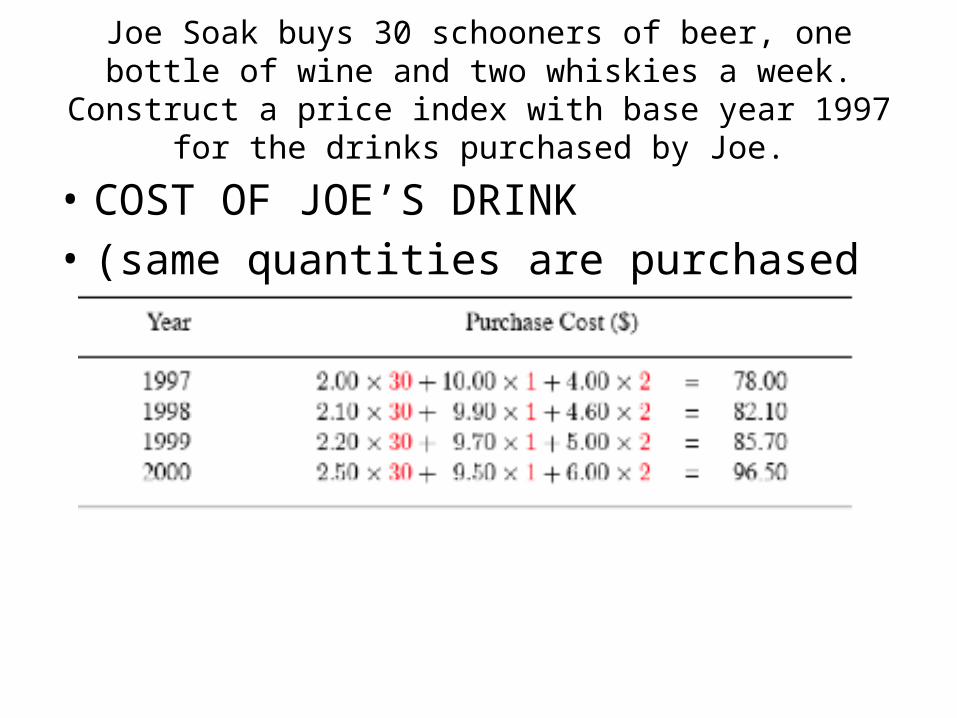
Joe Soak buys 30 schooners of beer, one bottle of wine and two whiskies a week. Construct a price index with base year 1997 for
the drinks purchased by Joe.
• COST OF JOE’S DRINK • (same quantities are purchased each year)
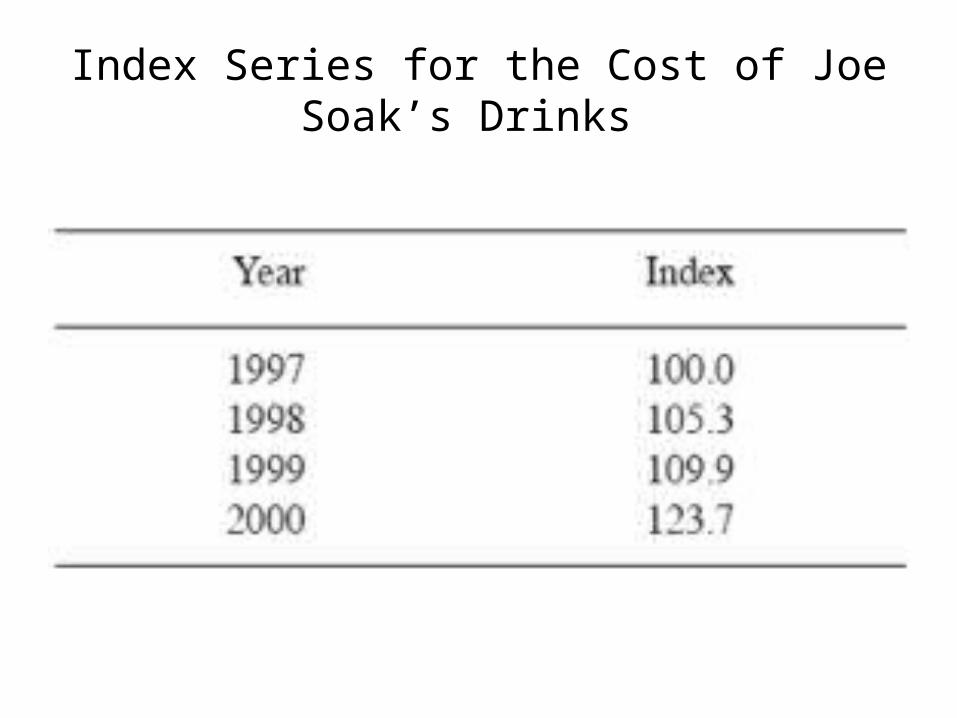
Index Series for the Cost of Joe Soak’s Drinks
• We can use the Consumers Price Index (CPI) to calculate how the 'buying power' of our dollar has changed over time.
The goods and services covered by the Consumers Price Index (CPI) are classified into nine groups, 21 subgroups and 73
sections. The nine groups are:
• Food • Housing • Household Operation • Apparel • Transportation • Tobacco and Alcohol • Personal and Health Care • Recreation and Education • Credit Services
• With the extremely large number of goods and services included in the CPI, it is more convenient, and useful, to calculate separate indices for different groups of goods (food, clothing, housing, etc) and then combine these indices into a single index. This is just an administrative convenience and does not change the nature of the index.
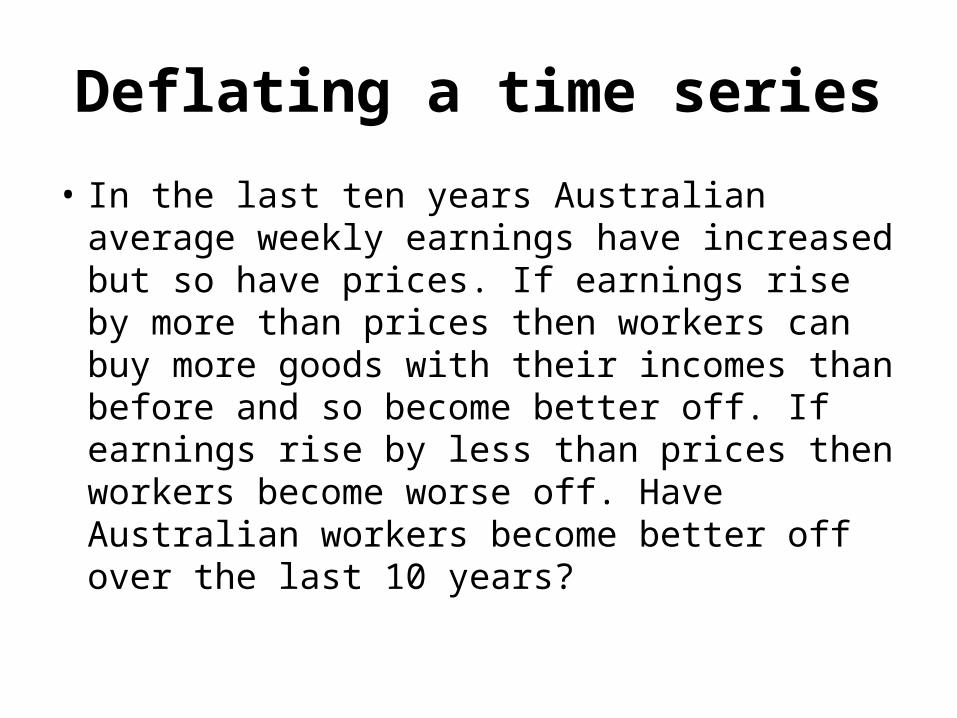
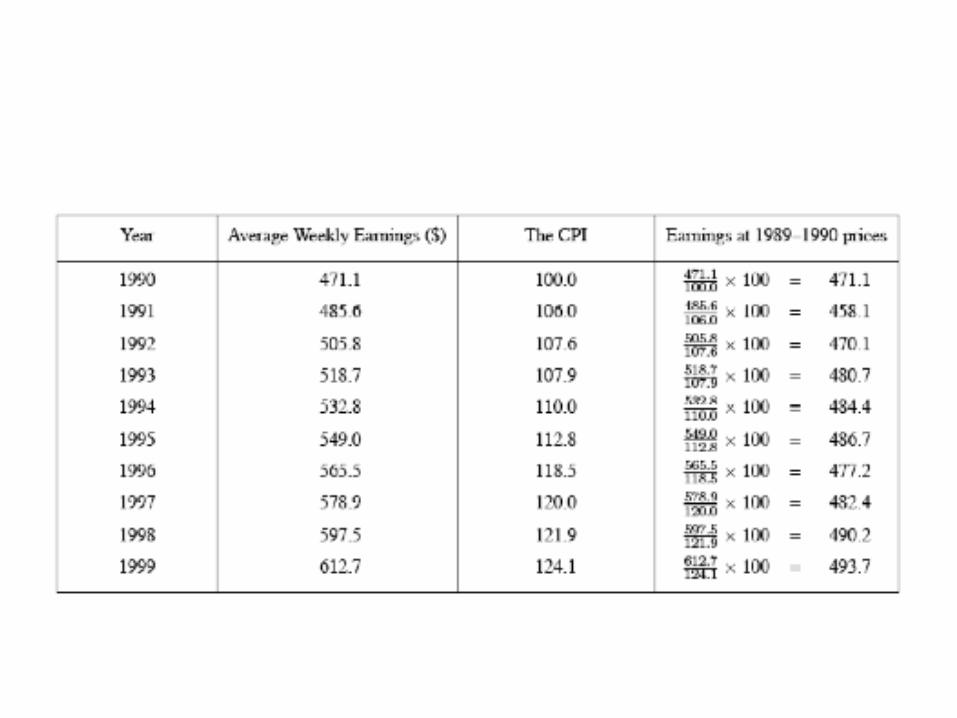
Deflating a time series
• In the last ten years Australian average weekly earnings have increased but so have prices. If earnings rise by more than prices then workers can buy more goods with their incomes than before and so become better off. If earnings rise by less than prices then workers become worse off. Have Australian workers become better off over the last 10 years?
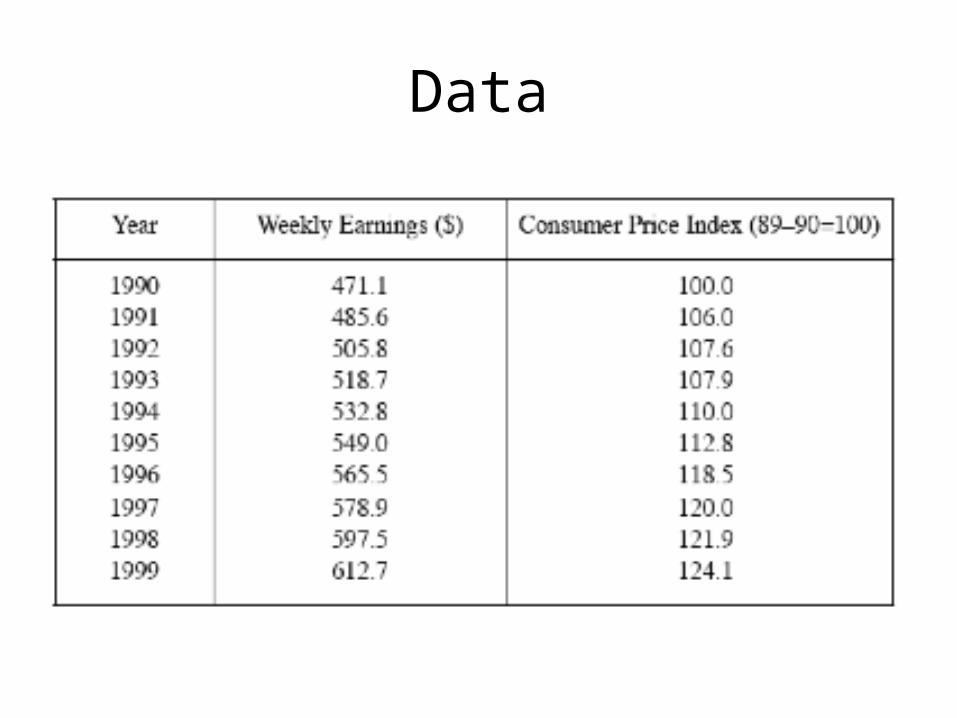
Data
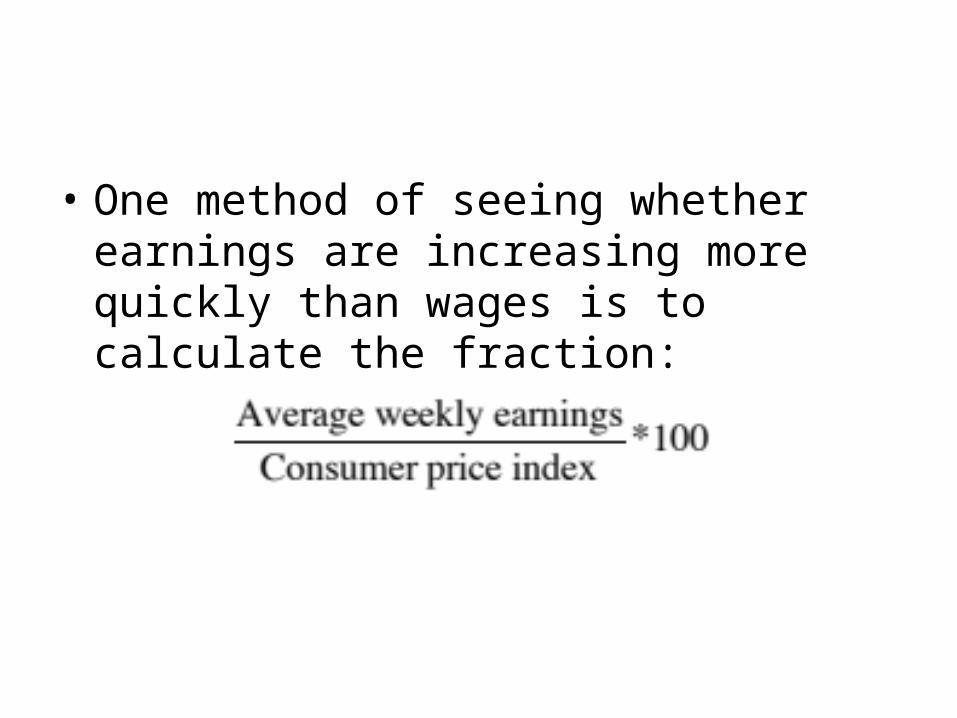
• One method of seeing whether earnings are increasing more quickly than wages is to calculate the fraction:
• A series that has been divided by a price index in this way is said to have been deflated by the price index.
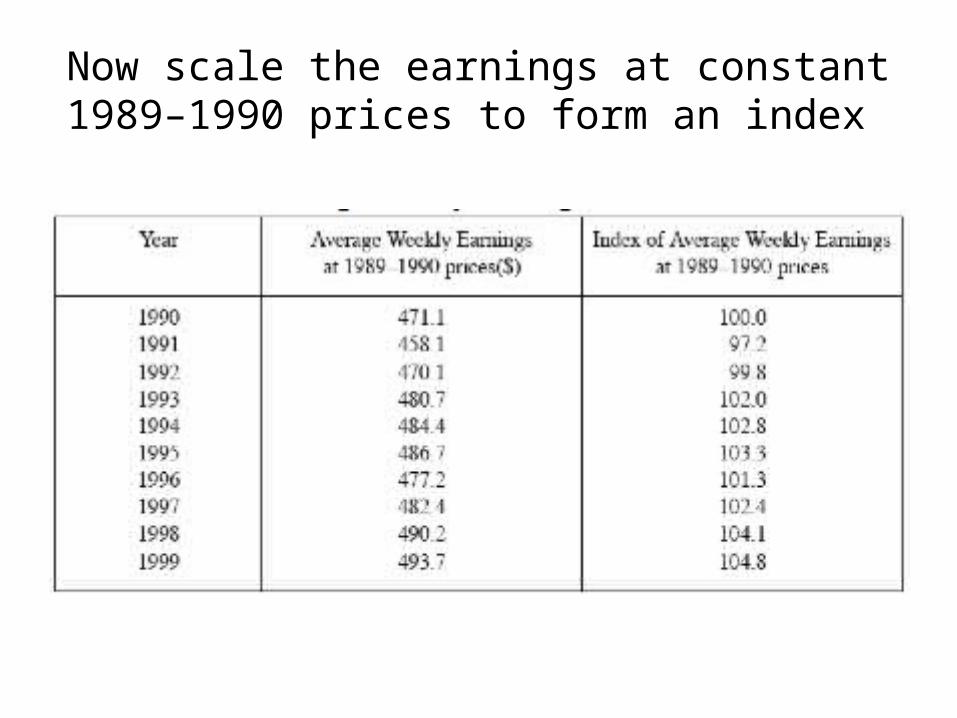
Now scale the earnings at constant 1989–1990 prices to form an index
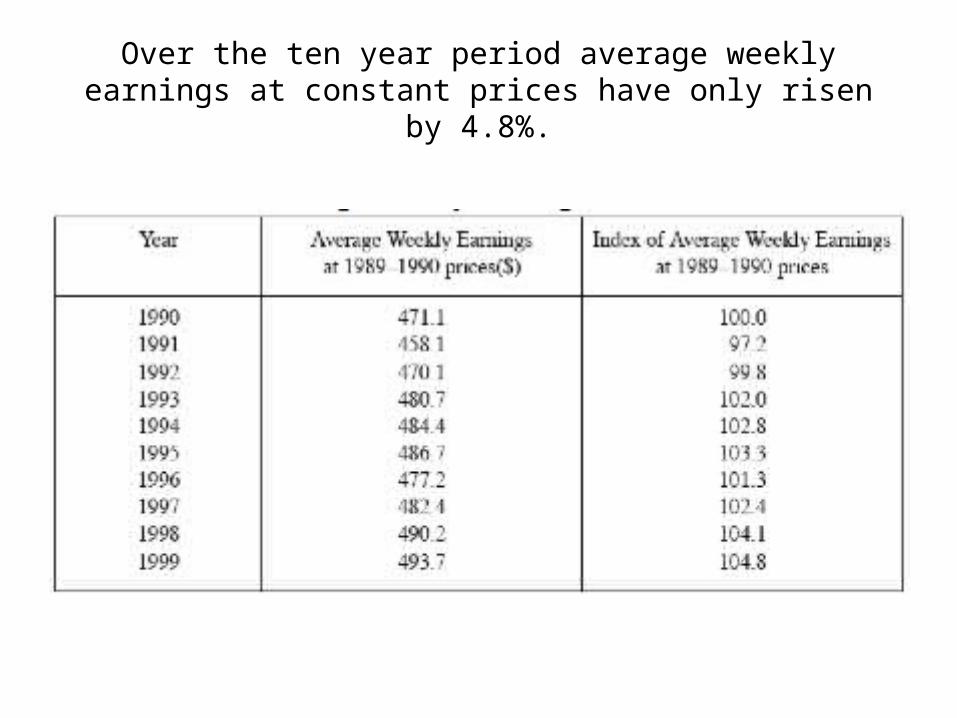
Over the ten year period average weekly earnings at constant prices have only risen by 4.8%.