Embed Size (px)
Citation preview
SPORTON International Inc. No. 52, Hwa Ya 1st Rd., Kwei-Shan Hsiang, TaoYuan Hsien, Taiwan, R.O.C. Ph: 886-3-327-3456 / FAX: 886-3-327-0973 / www.sporton.com.tw
Report Format Version: 02
CE RADIO TEST REPORT
Applicant’s company Ralink Technology Corporation
Applicant Address 5F., No.36, Taiyuan St., Jhubei City, Hsinchu County 302, Taiwan,
R.O.C. Manufacturer’s company Ralink Technology Corporation
Manufacturer Address 5F., No.36, Taiyuan St., Jhubei City, Hsinchu County 302, Taiwan, R.O.C.
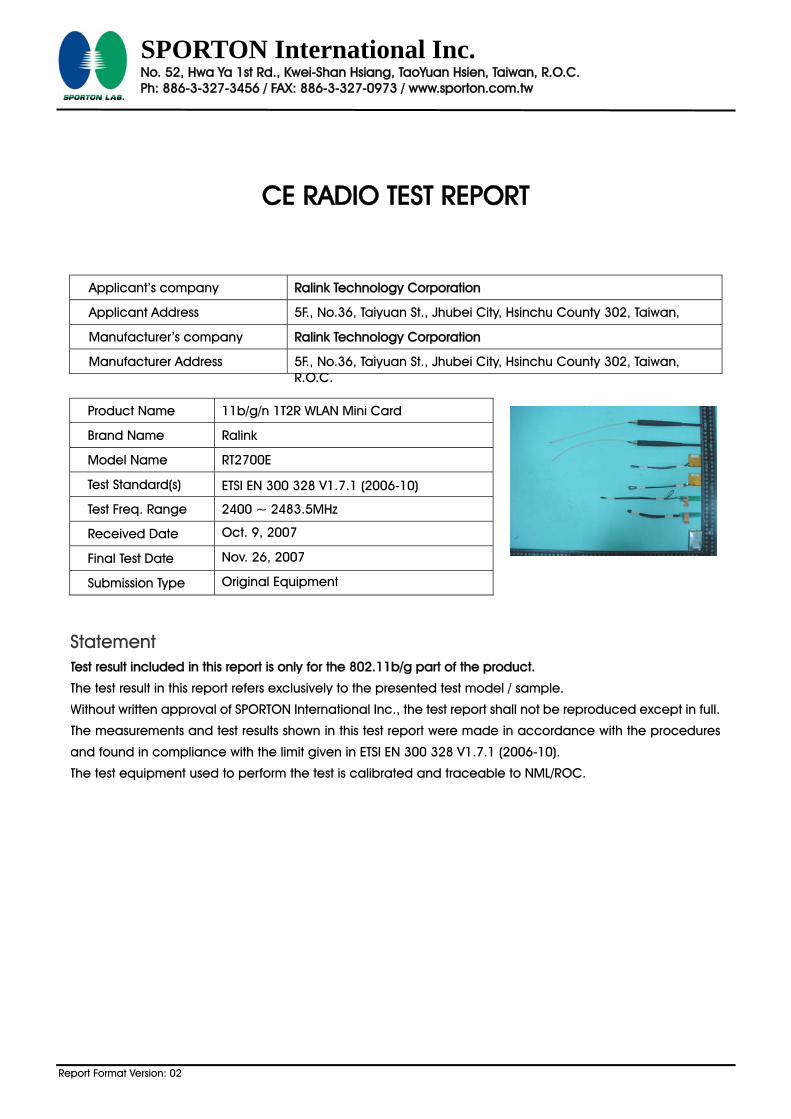
Product Name 11b/g/n 1T2R WLAN Mini Card
Brand Name Ralink
Model Name RT2700E
Test Standard(s) ETSI EN 300 328 V1.7.1 (2006-10)
Test Freq. Range 2400 ~ 2483.5MHz
Received Date Oct. 9, 2007
Final Test Date Nov. 26, 2007
Submission Type Original Equipment
Statement Test result included in this report is only for the 802.11b/g part of the product.
The test result in this report refers exclusively to the presented test model / sample.
Without written approval of SPORTON International Inc., the test report shall not be reproduced except in full.
The measurements and test results shown in this test report were made in accordance with the procedures
and found in compliance with the limit given in ETSI EN 300 328 V1.7.1 (2006-10).
The test equipment used to perform the test is calibrated and traceable to NML/ROC.
Report No.: ER7O1204AB
Report Format Version: 02 Page No. : i of ii
Issued Date : Nov. 29, 2007
Table of Contents
1. CERTIFICATE OF COMPLIANCE ......................................................................................................................... 1 2. SUMMARY OF THE TEST RESULT .......................................................................................................................... 2 3. GENERAL INFORMATION .................................................................................................................................. 3
3.1. Product Details....................................................................................................................................................................................3 3.2. Accessories.........................................................................................................................................................................................3 3.3. Table for Filed Antenna.......................................................................................................................................................................4 3.4. Table for Carrier Frequencies .............................................................................................................................................................5 3.5. Table for Test Modes...........................................................................................................................................................................5 3.6. Table for Testing Locations..................................................................................................................................................................6 3.7. Table for Supporting Units ...................................................................................................................................................................6 3.8. Table for Parameters of Test Software Setting .....................................................................................................................................6 3.9. Test Configurations .............................................................................................................................................................................7
4. TEST RESULT ..................................................................................................................................................... 8 4.1. Equivalent Isotropic Radiated Power Measurement...........................................................................................................................8 4.2. Maximum Spectral Power Density Measurement..............................................................................................................................10 4.3. Frequency Range Measurement......................................................................................................................................................13 4.4. Transmitter Spurious Emissions Measurement ....................................................................................................................................16 4.5. Receiver Spurious Emissions Measurement.......................................................................................................................................58
5. LIST OF MEASURING EQUIPMENTS ................................................................................................................... 84 6. TEST LOCATION.............................................................................................................................................. 86 APPENDIX A. PHOTOGRAPHS OF EUT.........................................................................................................A1 ~ A13
APPENDIX B. TEST PHOTOS.......................................................................................................................... B1 ~ B5
APPENDIX C. ANTENNA LIST...................................................................................................................... C1 ~ C4
Report No.: ER7O1204AB
Report Format Version: 02 Page No. : ii of ii
Issued Date : Nov. 29, 2007
History of This Test Report
Original Issue Date: Nov. 29, 2007
Report No.: ER7O1204AB
■ No additional attachment.
□ Additional attachment were issued as following record:
Attachment No. Issue Date Description
230 207 253
20 0 55
Report No.: ER7O1204AB
Report Format Version: 02 Page No. : 2 of 86
Issued Date : Nov. 29, 2007
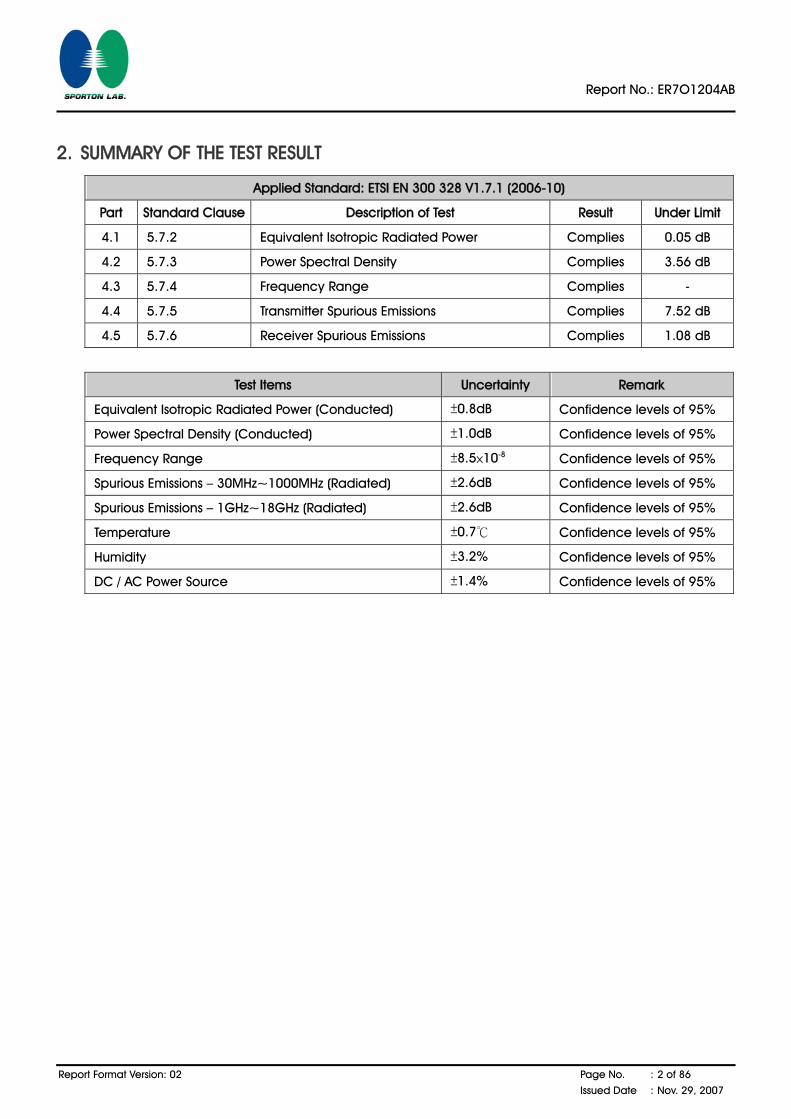
2. SUMMARY OF THE TEST RESULT
Applied Standard: ETSI EN 300 328 V1.7.1 (2006-10)
Part Standard Clause Description of Test Result Under Limit
4.1 5.7.2 Equivalent Isotropic Radiated Power Complies 0.05 dB
4.2 5.7.3 Power Spectral Density Complies 3.56 dB
4.3 5.7.4 Frequency Range Complies -
4.4 5.7.5 Transmitter Spurious Emissions Complies 7.52 dB
4.5 5.7.6 Receiver Spurious Emissions Complies 1.08 dB
Test Items Uncertainty Remark
Equivalent Isotropic Radiated Power (Conducted) ±0.8dB Confidence levels of 95%
Power Spectral Density (Conducted) ±1.0dB Confidence levels of 95%
Frequency Range ±8.5×10⁻⁸ Confidence levels of 95%
Spurious Emissions – 30MHz~1000MHz (Radiated) ±2.6dB Confidence levels of 95%
Spurious Emissions – 1GHz~18GHz (Radiated) ±2.6dB Confidence levels of 95%
Temperature ±0.7℃ Confidence levels of 95%
Humidity ±3.2% Confidence levels of 95%
DC / AC Power Source ±1.4% Confidence levels of 95%
Report No.: ER7O1204AB
Report Format Version: 02 Page No. : 3 of 86
Issued Date : Nov. 29, 2007
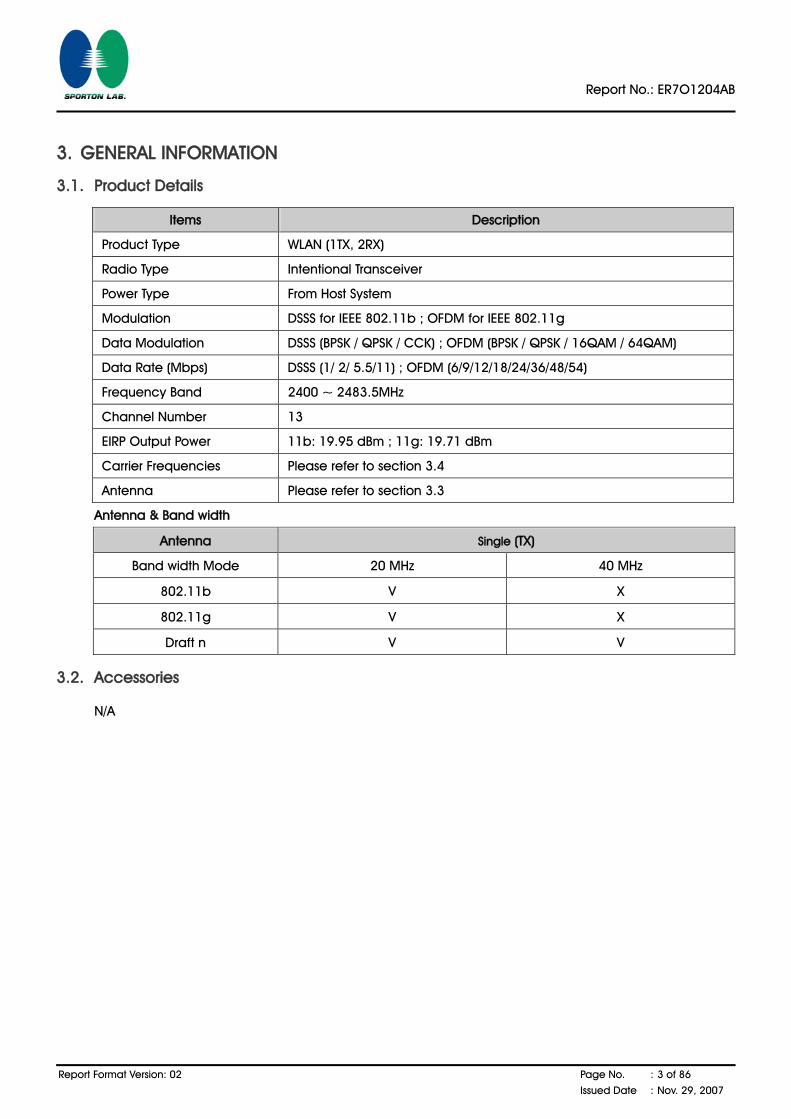
3. GENERAL INFORMATION
3.1. Product Details
Items Description
Product Type WLAN (1TX, 2RX)
Radio Type Intentional Transceiver
Power Type From Host System
Modulation DSSS for IEEE 802.11b ; OFDM for IEEE 802.11g
Data Modulation DSSS (BPSK / QPSK / CCK) ; OFDM (BPSK / QPSK / 16QAM / 64QAM)
Data Rate (Mbps) DSSS (1/ 2/ 5.5/11) ; OFDM (6/9/12/18/24/36/48/54)
Frequency Band 2400 ~ 2483.5MHz
Channel Number 13
EIRP Output Power 11b: 19.95 dBm ; 11g: 19.71 dBm
Carrier Frequencies Please refer to section 3.4
Antenna Please refer to section 3.3
Antenna & Band width
Antenna Single (TX)
Band width Mode 20 MHz 40 MHz
802.11b V X
802.11g V X
Draft n V V
3.2. Accessories
N/A
Report No.: ER7O1204AB
Report Format Version: 02 Page No. : 4 of 86
Issued Date : Nov. 29, 2007
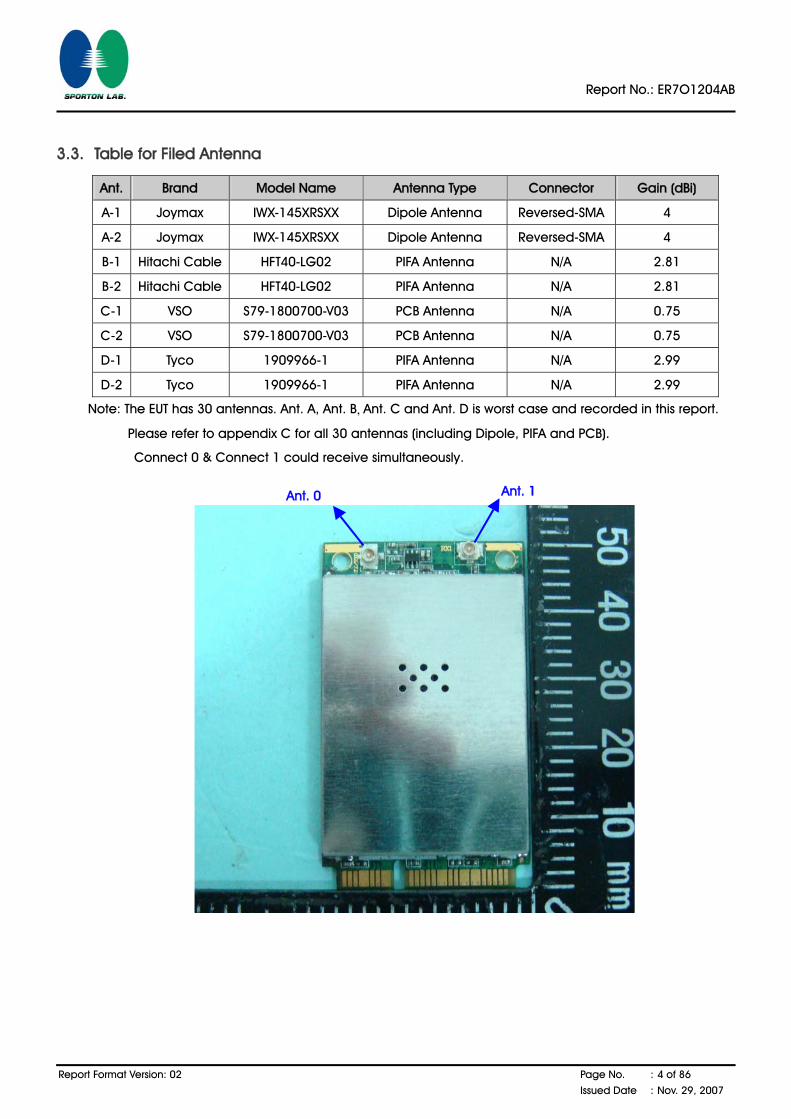
3.3. Table for Filed Antenna
Ant. Brand Model Name Antenna Type Connector Gain (dBi)
A-1 Joymax IWX-145XRSXX Dipole Antenna Reversed-SMA 4
A-2 Joymax IWX-145XRSXX Dipole Antenna Reversed-SMA 4
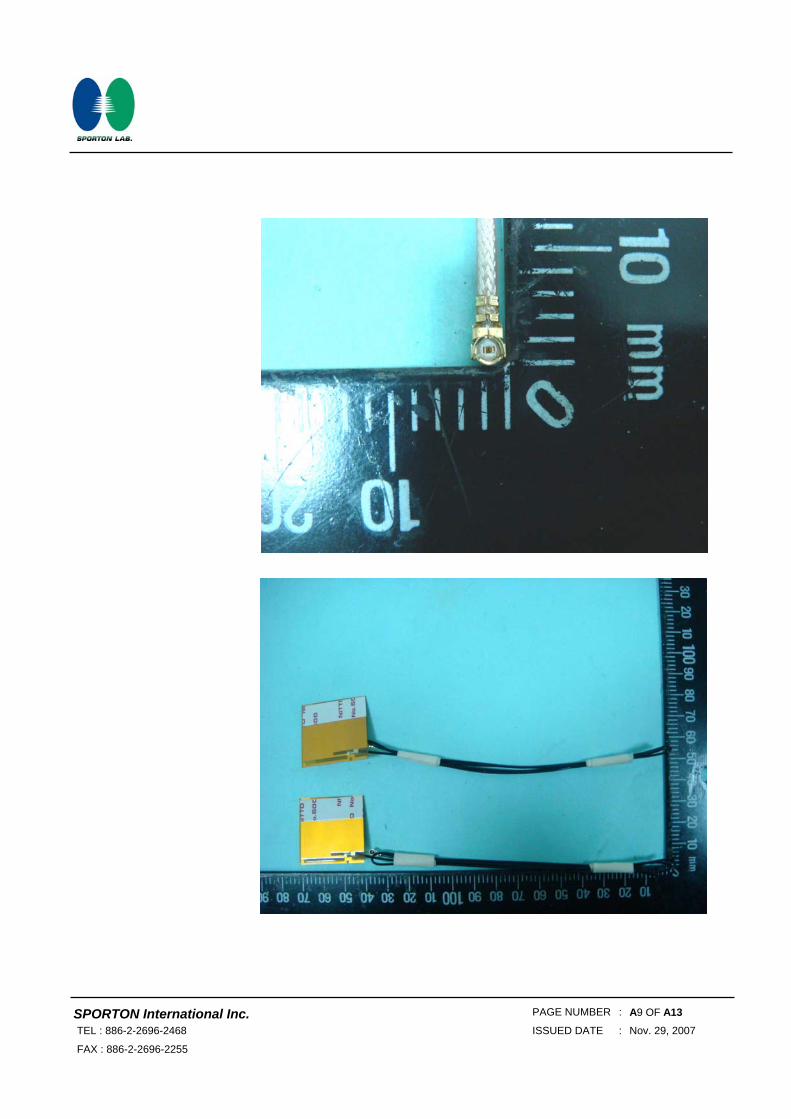
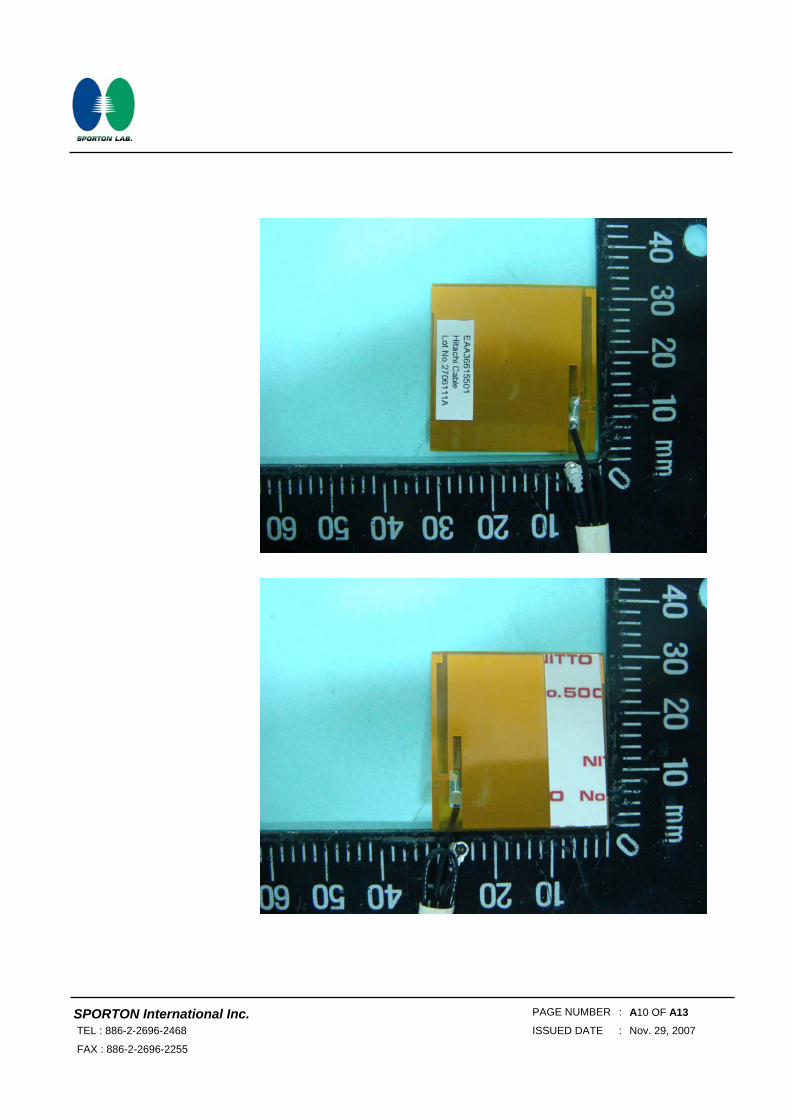
B-1 Hitachi Cable HFT40-LG02 PIFA Antenna N/A 2.81
B-2 Hitachi Cable HFT40-LG02 PIFA Antenna N/A 2.81
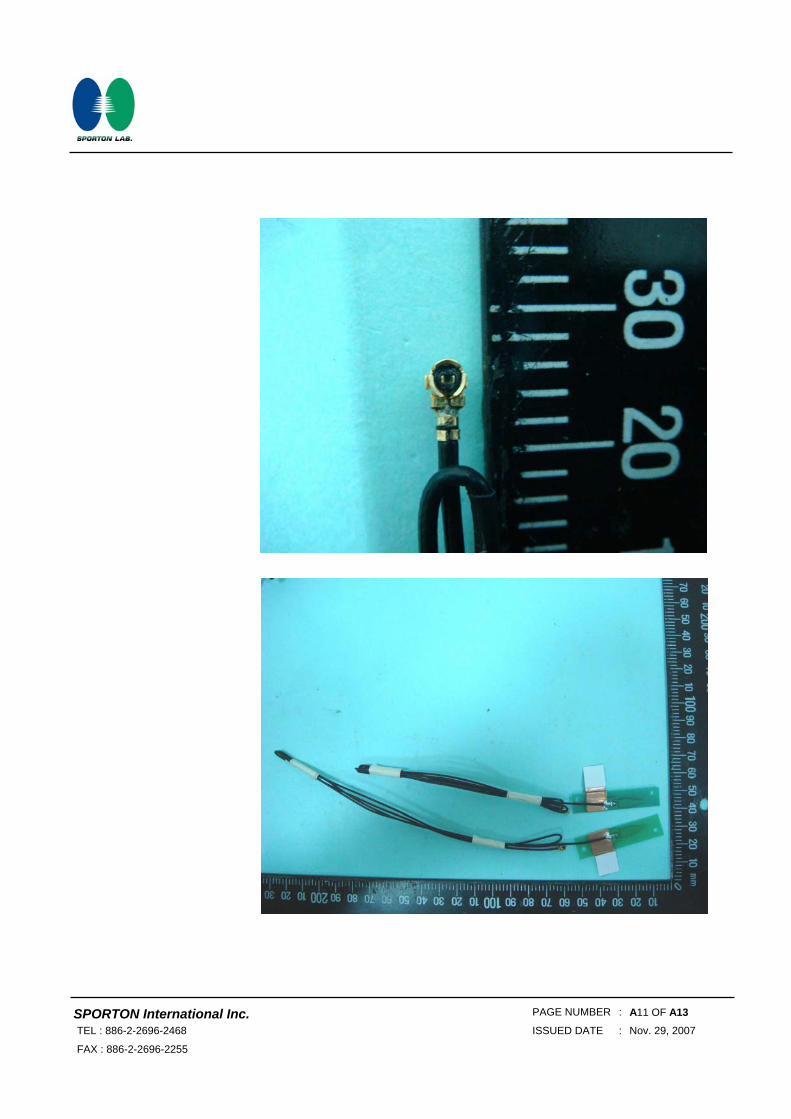
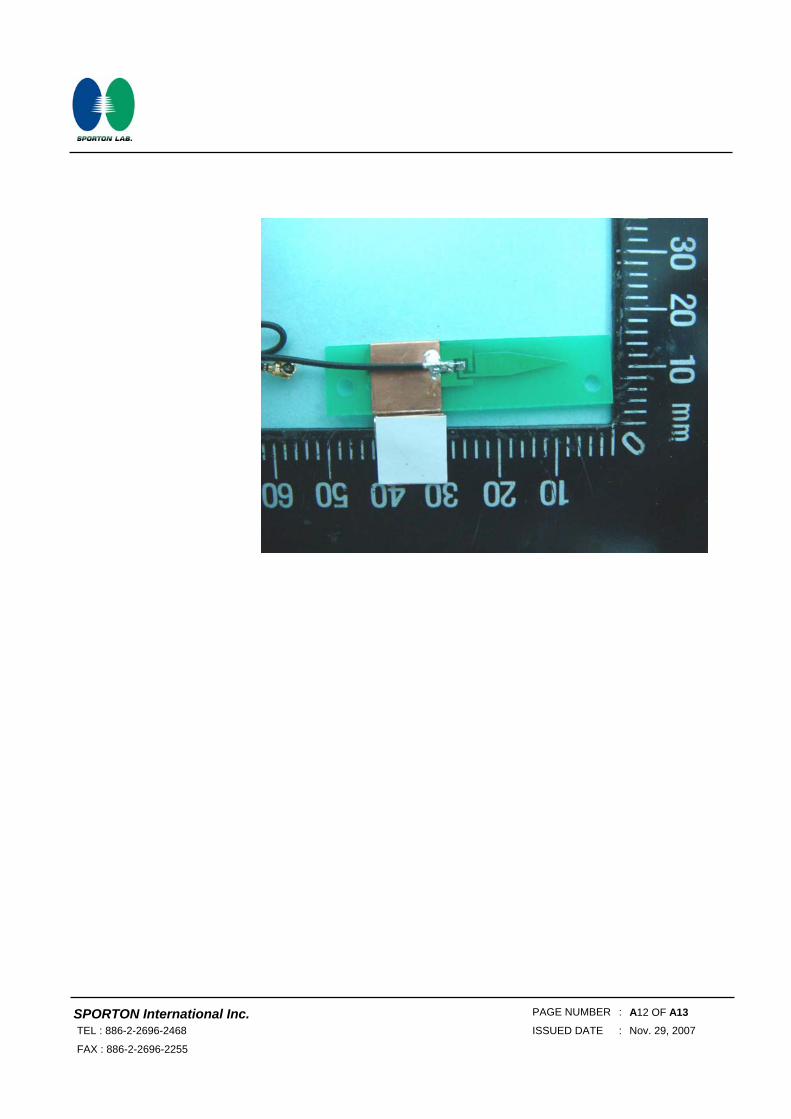
C-1 VSO S79-1800700-V03 PCB Antenna N/A 0.75
C-2 VSO S79-1800700-V03 PCB Antenna N/A 0.75
D-1 Tyco 1909966-1 PIFA Antenna N/A 2.99
D-2 Tyco 1909966-1 PIFA Antenna N/A 2.99
Note: The EUT has 30 antennas. Ant. A, Ant. B, Ant. C and Ant. D is worst case and recorded in this report.
Please refer to appendix C for all 30 antennas (including Dipole, PIFA and PCB).
Connect 0 & Connect 1 could receive simultaneously.
Ant. 0 Ant. 1
Report No.: ER7O1204AB
Report Format Version: 02 Page No. : 5 of 86
Issued Date : Nov. 29, 2007
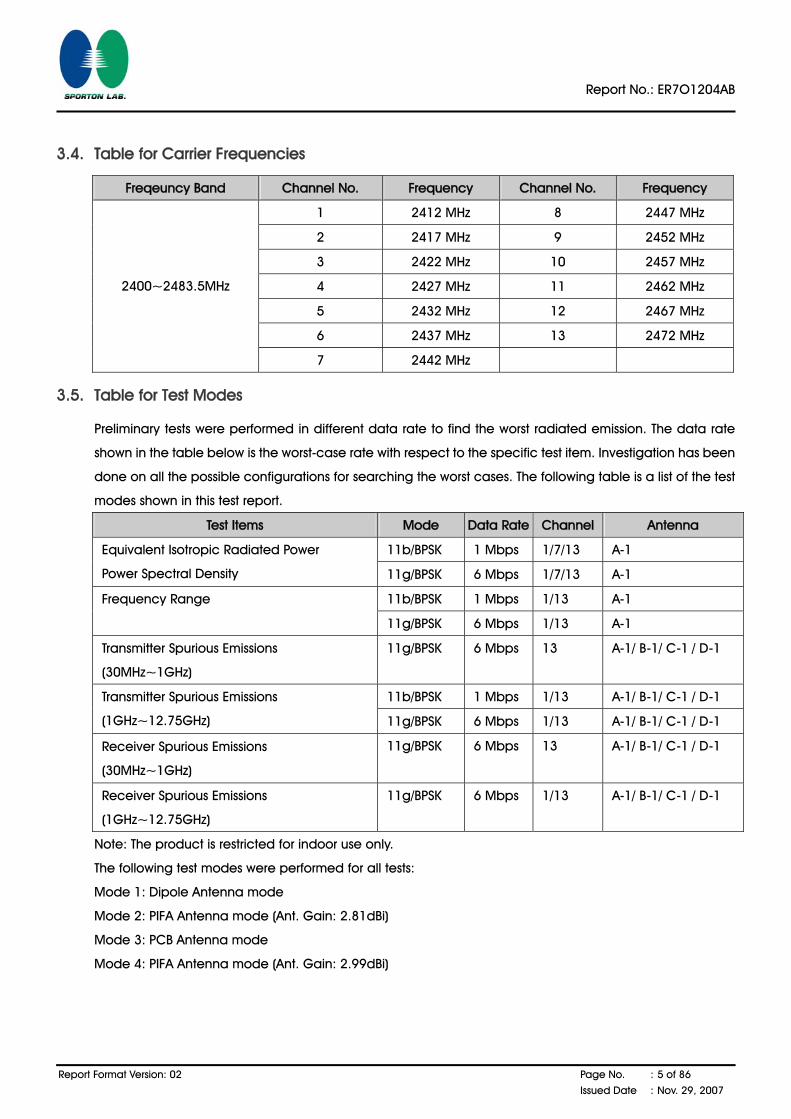
3.4. Table for Carrier Frequencies
Freqeuncy Band Channel No. Frequency Channel No. Frequency
1 2412 MHz 8 2447 MHz
2 2417 MHz 9 2452 MHz
3 2422 MHz 10 2457 MHz
4 2427 MHz 11 2462 MHz
5 2432 MHz 12 2467 MHz
6 2437 MHz 13 2472 MHz
2400~2483.5MHz
7 2442 MHz
3.5. Table for Test Modes
Preliminary tests were performed in different data rate to find the worst radiated emission. The data rate
shown in the table below is the worst-case rate with respect to the specific test item. Investigation has been
done on all the possible configurations for searching the worst cases. The following table is a list of the test
modes shown in this test report.
Test Items Mode Data Rate Channel Antenna
11b/BPSK 1 Mbps 1/7/13 A-1 Equivalent Isotropic Radiated Power
Power Spectral Density 11g/BPSK 6 Mbps 1/7/13 A-1
11b/BPSK 1 Mbps 1/13 A-1 Frequency Range
11g/BPSK 6 Mbps 1/13 A-1
Transmitter Spurious Emissions
(30MHz~1GHz)
11g/BPSK 6 Mbps 13 A-1/ B-1/ C-1 / D-1
11b/BPSK 1 Mbps 1/13 A-1/ B-1/ C-1 / D-1 Transmitter Spurious Emissions
(1GHz~12.75GHz) 11g/BPSK 6 Mbps 1/13 A-1/ B-1/ C-1 / D-1
Receiver Spurious Emissions
(30MHz~1GHz)
11g/BPSK 6 Mbps 13 A-1/ B-1/ C-1 / D-1
Receiver Spurious Emissions
(1GHz~12.75GHz)
11g/BPSK 6 Mbps 1/13 A-1/ B-1/ C-1 / D-1
Note: The product is restricted for indoor use only.
The following test modes were performed for all tests:
Mode 1: Dipole Antenna mode
Mode 2: PIFA Antenna mode (Ant. Gain: 2.81dBi)
Mode 3: PCB Antenna mode
Mode 4: PIFA Antenna mode (Ant. Gain: 2.99dBi)
Report No.: ER7O1204AB
Report Format Version: 02 Page No. : 6 of 86
Issued Date : Nov. 29, 2007
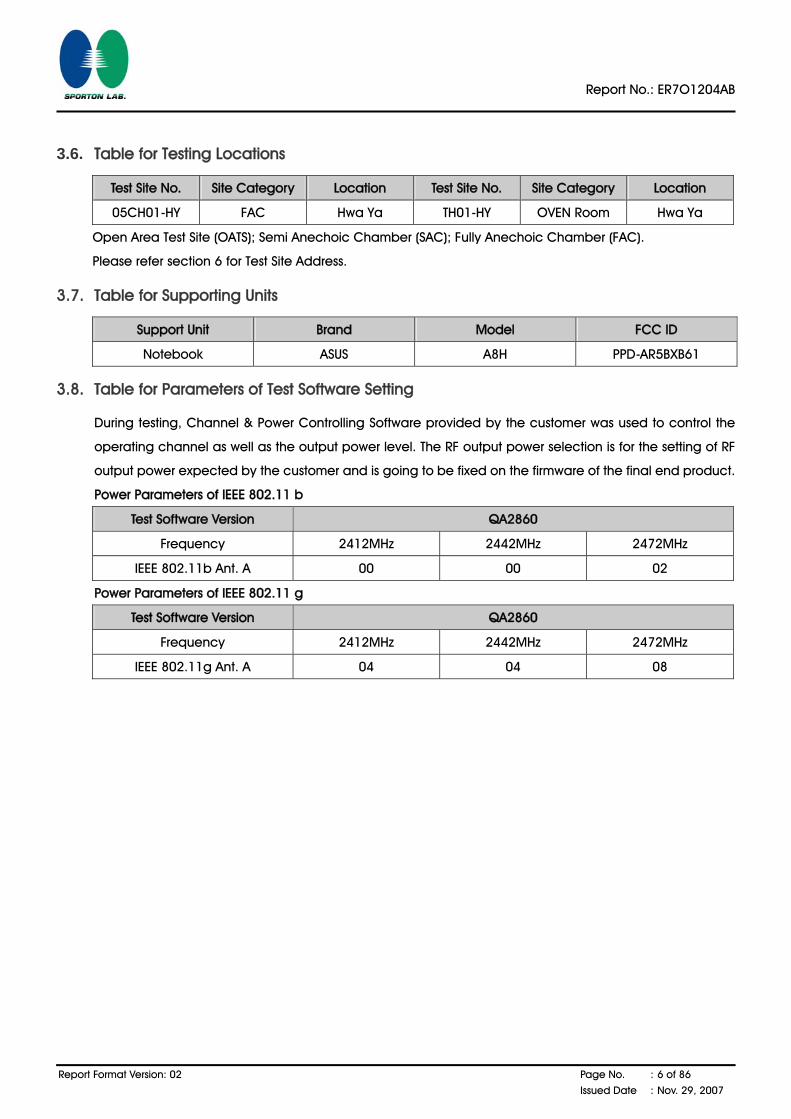
3.6. Table for Testing Locations
Test Site No. Site Category Location Test Site No. Site Category Location
05CH01-HY FAC Hwa Ya TH01-HY OVEN Room Hwa Ya
Open Area Test Site (OATS); Semi Anechoic Chamber (SAC); Fully Anechoic Chamber (FAC).
Please refer section 6 for Test Site Address.
3.7. Table for Supporting Units
Support Unit Brand Model FCC ID
Notebook ASUS A8H PPD-AR5BXB61
3.8. Table for Parameters of Test Software Setting
During testing, Channel & Power Controlling Software provided by the customer was used to control the
operating channel as well as the output power level. The RF output power selection is for the setting of RF
output power expected by the customer and is going to be fixed on the firmware of the final end product.
Power Parameters of IEEE 802.11 b
Test Software Version QA2860
Frequency 2412MHz 2442MHz 2472MHz
IEEE 802.11b Ant. A 00 00 02
Power Parameters of IEEE 802.11 g
Test Software Version QA2860
Frequency 2412MHz 2442MHz 2472MHz
IEEE 802.11g Ant. A 04 04 08
Report No.: ER7O1204AB
Report Format Version: 02 Page No. : 7 of 86
Issued Date : Nov. 29, 2007
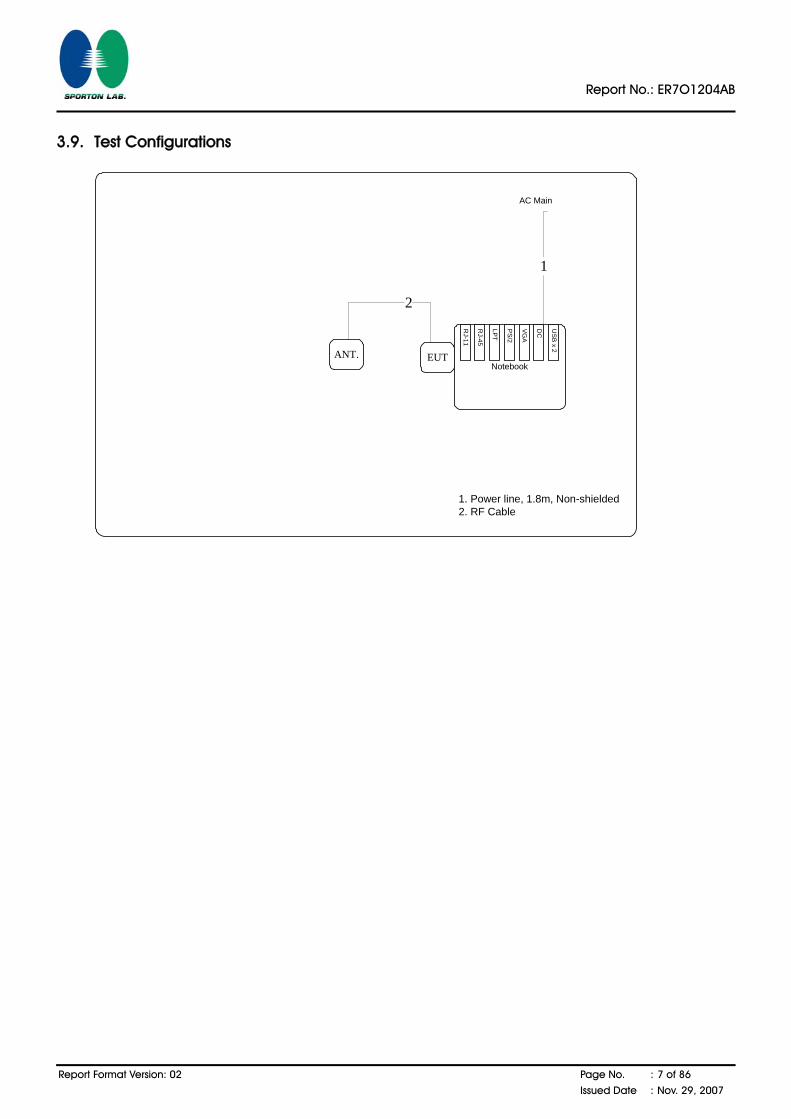
3.9. Test Configurations
EUT
1
AC Main
1. Power line, 1.8m, Non-shielded2. RF Cable
Notebook
RJ-45
LPT
PS
/2
VG
A
DC
USB x 2
RJ-11
ANT.
2
Report No.: ER7O1204AB
Report Format Version: 02 Page No. : 8 of 86
Issued Date : Nov. 29, 2007
4. TEST RESULT
4.1. Equivalent Isotropic Radiated Power Measurement
4.1.1. Limit
The equivalent isotropic radiated power is defined as the total power of the transmitter. The equivalent
isotropic radiated power shall be equal to or less than -10dBW (100 mW) e.i.r.p. This limit shall apply for
any combination of power level and intended antenna assembly.
4.1.2. Measuring Instruments and Setting
Please refer to section 5 of equipments list in this report. The following table is the setting of the power
meter.
Power Meter Parameter Setting
Filter No. Auto
Measurement time 0.135 s ~ 26 s
Used Average Sensor NRV-Z55
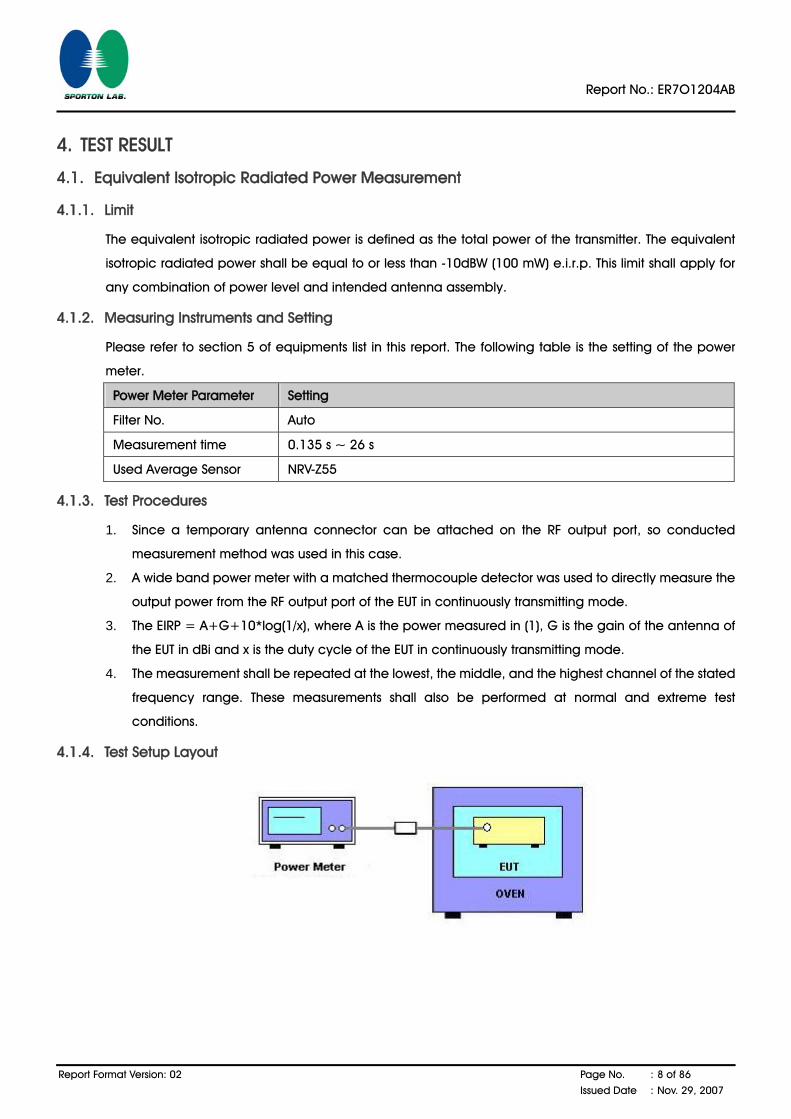
4.1.3. Test Procedures
1. Since a temporary antenna connector can be attached on the RF output port, so conducted
measurement method was used in this case.
2. A wide band power meter with a matched thermocouple detector was used to directly measure the
output power from the RF output port of the EUT in continuously transmitting mode.
3. The EIRP = A+G+10*log(1/x), where A is the power measured in (1), G is the gain of the antenna of
the EUT in dBi and x is the duty cycle of the EUT in continuously transmitting mode.
4. The measurement shall be repeated at the lowest, the middle, and the highest channel of the stated
frequency range. These measurements shall also be performed at normal and extreme test
conditions.
4.1.4. Test Setup Layout
Report No.: ER7O1204AB
Report Format Version: 02 Page No. : 9 of 86
Issued Date : Nov. 29, 2007
4.1.5. Test Deviation
There is no deviation with the original standard.
4.1.6. EUT Operation during Test
The EUT was programmed to be in continuously transmitting mode.
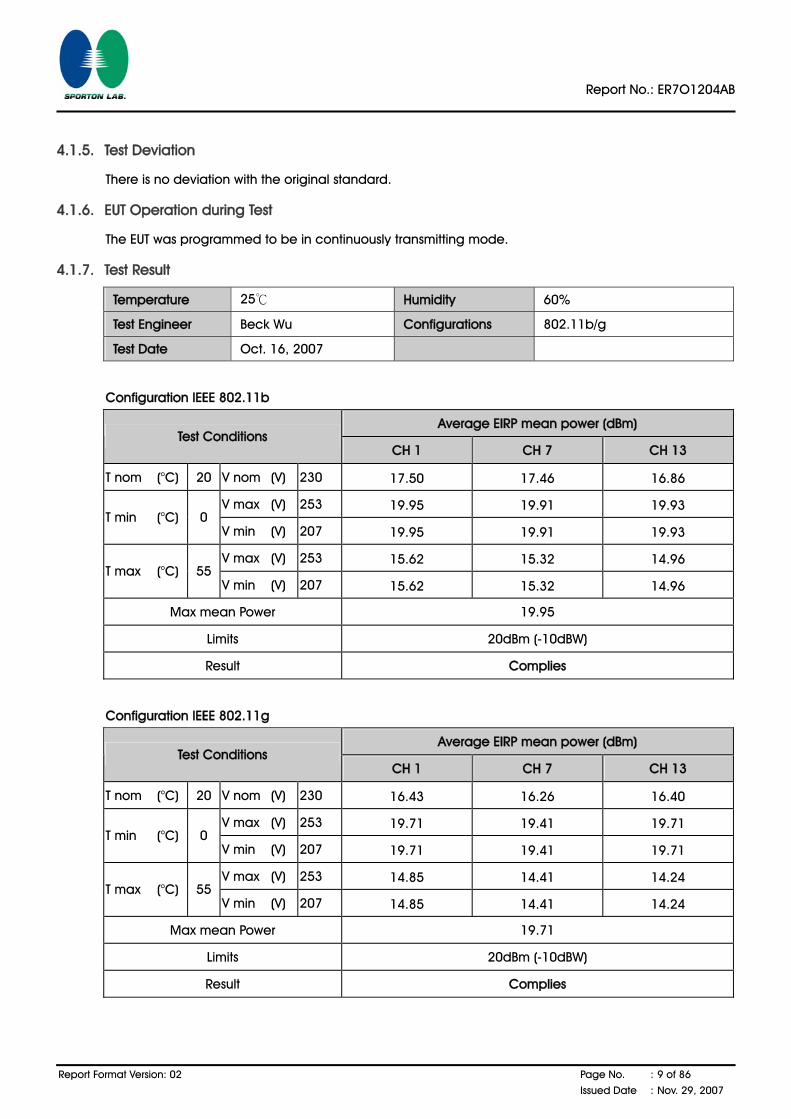
4.1.7. Test Result
Temperature 25℃ Humidity 60%
Test Engineer Beck Wu Configurations 802.11b/g
Test Date Oct. 16, 2007
Configuration IEEE 802.11b
Average EIRP mean power (dBm) Test Conditions
CH 1 CH 7 CH 13
T nom (°C) 20 V nom (V) 230 17.50 17.46 16.86
V max (V) 253 19.95 19.91 19.93 T min (°C) 0
V min (V) 207 19.95 19.91 19.93
V max (V) 253 15.62 15.32 14.96 T max (°C) 55
V min (V) 207 15.62 15.32 14.96
Max mean Power 19.95
Limits 20dBm (-10dBW)
Result Complies
Configuration IEEE 802.11g
Average EIRP mean power (dBm) Test Conditions
CH 1 CH 7 CH 13
T nom (°C) 20 V nom (V) 230 16.43 16.26 16.40
V max (V) 253 19.71 19.41 19.71 T min (°C) 0
V min (V) 207 19.71 19.41 19.71
V max (V) 253 14.85 14.41 14.24 T max (°C) 55
V min (V) 207 14.85 14.41 14.24
Max mean Power 19.71
Limits 20dBm (-10dBW)
Result Complies
Report No.: ER7O1204AB
Report Format Version: 02 Page No. : 10 of 86
Issued Date : Nov. 29, 2007
4.2. Maximum Spectral Power Density Measurement
4.2.1. Limit
The maximum spectral power density is defined as the highest level of power in Watts per Hertz
generated by the transmitter within the power envelope. For wide band modulations other than FHSS
(e.g. DSSS, OFDM, etc.), the maximum spectrum power density is limited to 10 mW per MHz e.i.r.p.
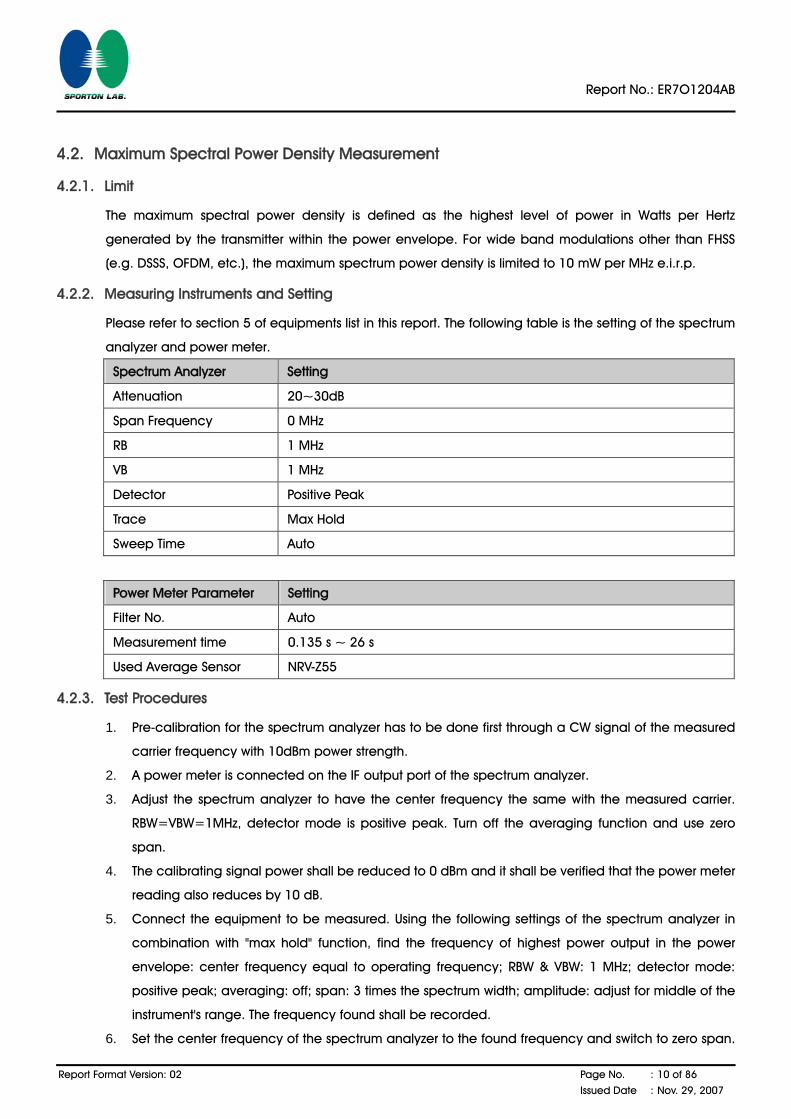
4.2.2. Measuring Instruments and Setting
Please refer to section 5 of equipments list in this report. The following table is the setting of the spectrum
analyzer and power meter.
Spectrum Analyzer Setting
Attenuation 20~30dB
Span Frequency 0 MHz
RB 1 MHz
VB 1 MHz
Detector Positive Peak
Trace Max Hold
Sweep Time Auto
Power Meter Parameter Setting
Filter No. Auto
Measurement time 0.135 s ~ 26 s
Used Average Sensor NRV-Z55
4.2.3. Test Procedures
1. Pre-calibration for the spectrum analyzer has to be done first through a CW signal of the measured
carrier frequency with 10dBm power strength.
2. A power meter is connected on the IF output port of the spectrum analyzer.
3. Adjust the spectrum analyzer to have the center frequency the same with the measured carrier.
RBW=VBW=1MHz, detector mode is positive peak. Turn off the averaging function and use zero
span.
4. The calibrating signal power shall be reduced to 0 dBm and it shall be verified that the power meter
reading also reduces by 10 dB.
5. Connect the equipment to be measured. Using the following settings of the spectrum analyzer in
combination with "max hold" function, find the frequency of highest power output in the power
envelope: center frequency equal to operating frequency; RBW & VBW: 1 MHz; detector mode:
positive peak; averaging: off; span: 3 times the spectrum width; amplitude: adjust for middle of the
instrument's range. The frequency found shall be recorded.
6. Set the center frequency of the spectrum analyzer to the found frequency and switch to zero span.
Report No.: ER7O1204AB
Report Format Version: 02 Page No. : 11 of 86
Issued Date : Nov. 29, 2007
The power meter indicates the measured power density (D). The maximum spectral power density
e.i.r.p. is calculated from the above measured power density (D), the observed duty cycle factor(x),
and the applicable antenna assembly gain "G" in dBi, according to the formula: PD = D + G + 10
log (1/x).
7. The measurement shall be repeated at the lowest, the middle, and the highest channel of the stated
frequency range.
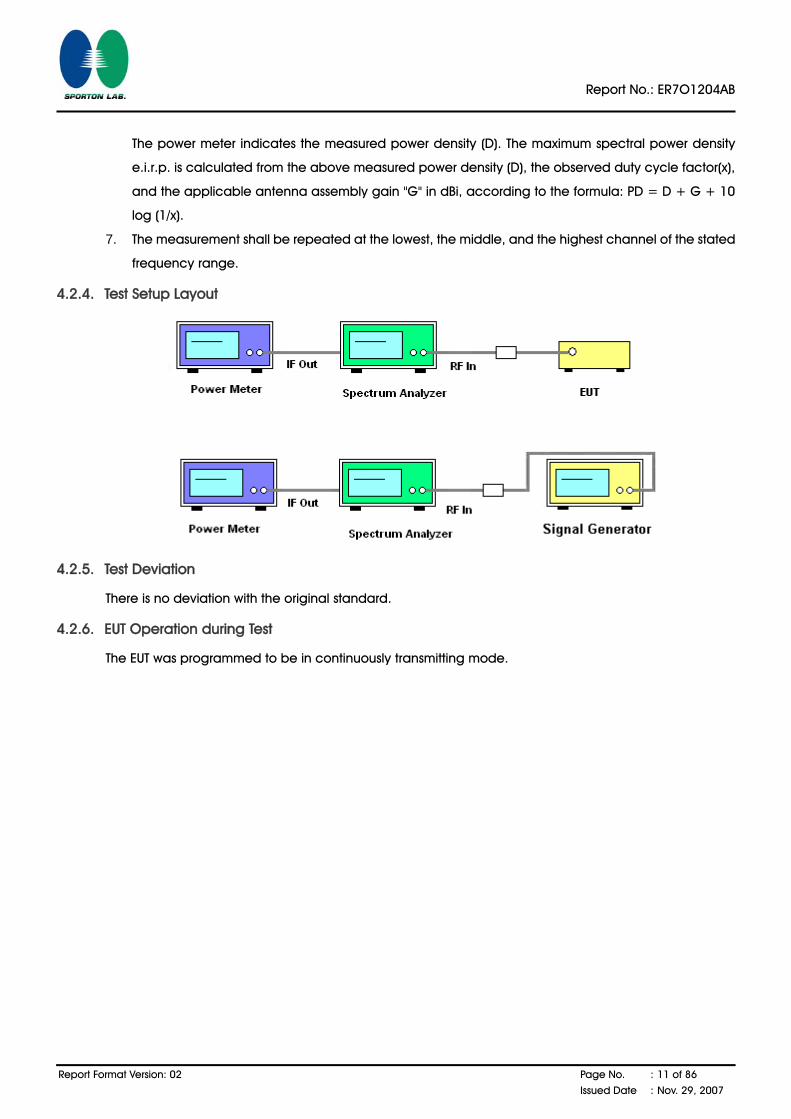
4.2.4. Test Setup Layout
4.2.5. Test Deviation
There is no deviation with the original standard.
4.2.6. EUT Operation during Test
The EUT was programmed to be in continuously transmitting mode.
Report No.: ER7O1204AB
Report Format Version: 02 Page No. : 12 of 86
Issued Date : Nov. 29, 2007
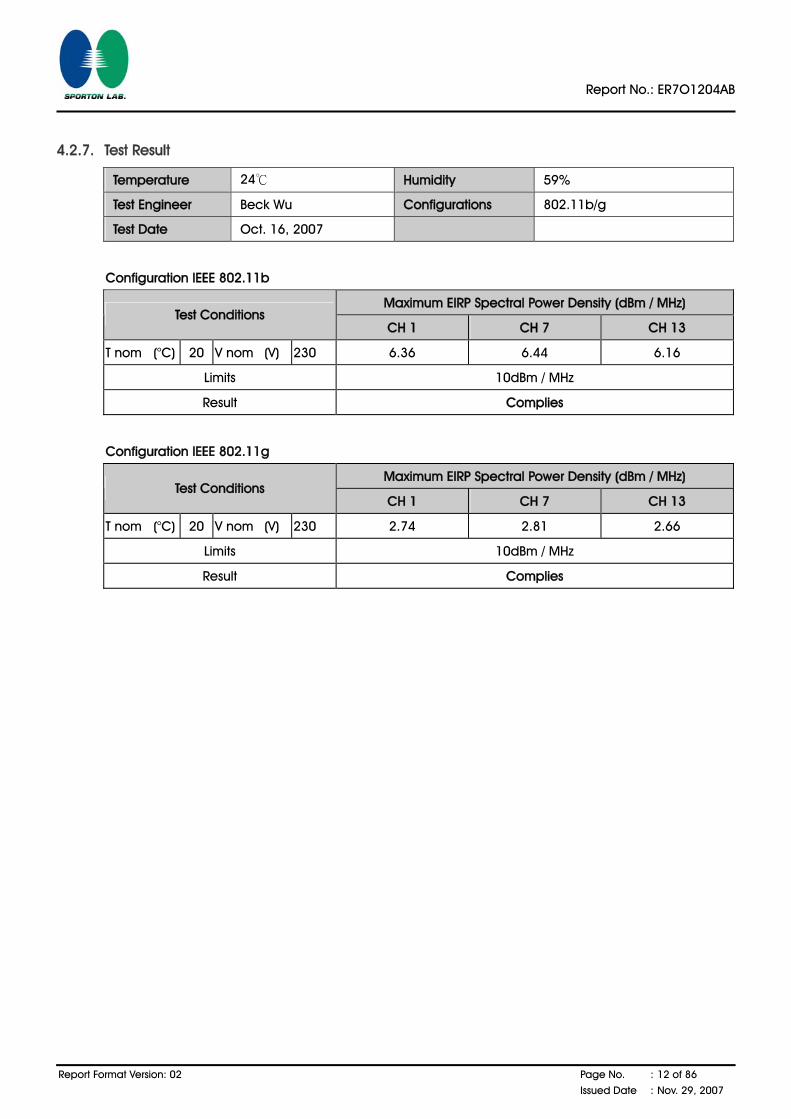
4.2.7. Test Result
Temperature 24℃ Humidity 59%
Test Engineer Beck Wu Configurations 802.11b/g
Test Date Oct. 16, 2007
Configuration IEEE 802.11b
Maximum EIRP Spectral Power Density (dBm / MHz) Test Conditions
CH 1 CH 7 CH 13
T nom (°C) 20 V nom (V) 230 6.36 6.44 6.16
Limits 10dBm / MHz
Result Complies
Configuration IEEE 802.11g
Maximum EIRP Spectral Power Density (dBm / MHz) Test Conditions
CH 1 CH 7 CH 13
T nom (°C) 20 V nom (V) 230 2.74 2.81 2.66
Limits 10dBm / MHz
Result Complies
Report No.: ER7O1204AB
Report Format Version: 02 Page No. : 13 of 86
Issued Date : Nov. 29, 2007
4.3. Frequency Range Measurement
4.3.1. Limit
The frequency range of the equipment is determined by the lowest and highest frequencies occupied
by the power envelope. fH is the highest frequency of the power envelope: it is the frequency furthest
above the frequency of maximum power where the output power drops below the level of -80 dBm/Hz
e.i.r.p. spectral power density (-30 dBm if measured in a 100 kHz bandwidth). fL is the lowest frequency of
the power envelope; it is the frequency furthest below the frequency of maximum power where the
output power drops below the level equivalent to -80 dBm/Hz e.i.r.p. spectral power density (or -30 dBm if
measured in a 100 kHz bandwidth). The frequency range is determined by the lowest value of fL and the
highest value of fH resulting from the adjustment of the equipment to the lowest and highest operating
frequencies.
For all equipment, the frequency range shall lie within the band 2.4 GHz to 2.835 GHz (fL > 2.4 GHz and fH
< 2.4835 GHz).
4.3.2. Measuring Instruments and Setting
Please refer to section 5 of equipments list in this report. The following table is the setting of Spectrum
Analyzer.
Spectrum Analyzer Setting
Attenuation 20~30dB
Span Frequency 40MHz
RB 100 kHz
VB 100 kHz
Detector Average
Trace Average 50 sweeps
4.3.3. Test Procedures
1. The transmitter output (antenna port) was connected to the spectrum analyzer.
2. Added [x] dBi of antenna gain was on the spectrum analyzer.
3. Place the spectrum analyzer in detector averaging mode with a minimum of 50 sweeps selected
and activate transmitter with modulation applied.
4. Select lowest operating frequency of the equipment under test.
5. Find lowest frequency below the operating frequency at which spectral power density drops below
-80 dBm/Hz e.i.r.p. (-30 dBm if measured in a 100 kHz bandwidth). This frequency shall be recorded
(fL).
6. Select the highest operating frequency of the equipment under test.
7. Find the highest frequency at which the spectral power density drops below-80 dBm/Hz e.i.r.p. (-30
dBm if measured in a 100 kHz bandwidth). This frequency shall be recorded (fH).
8. These measurements shall also be performed at normal and extreme test conditions.
Report No.: ER7O1204AB
Report Format Version: 02 Page No. : 14 of 86
Issued Date : Nov. 29, 2007
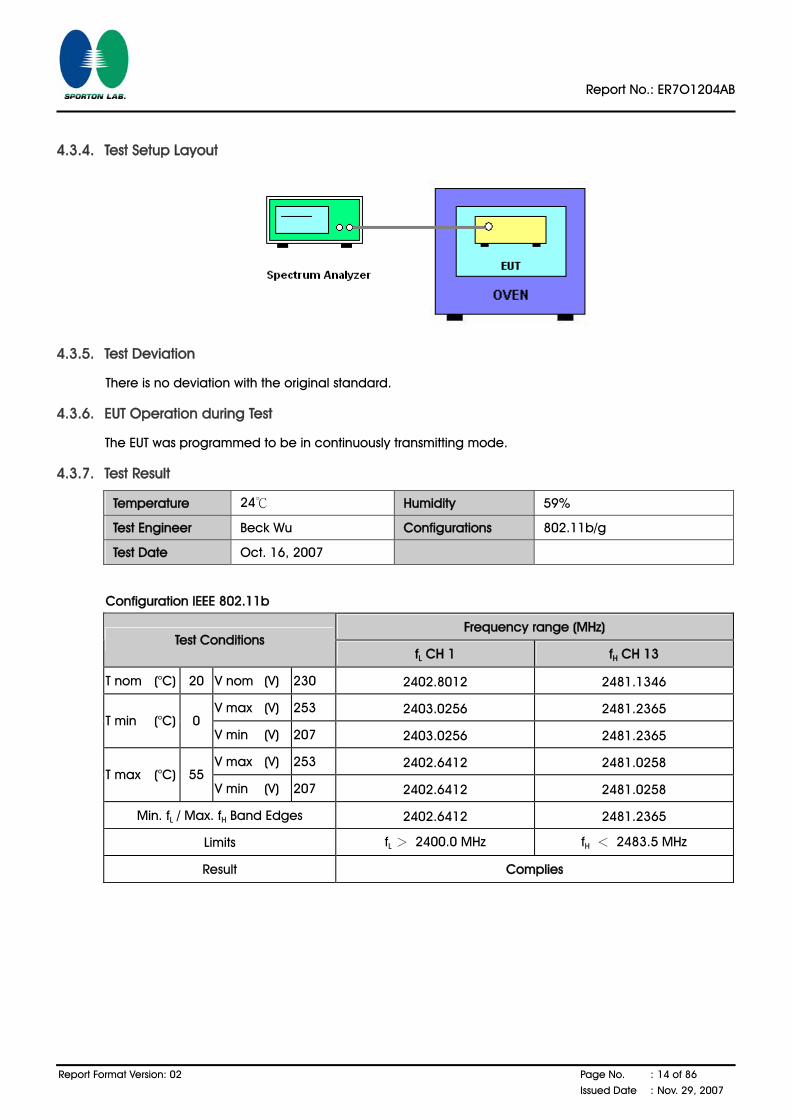
4.3.4. Test Setup Layout
4.3.5. Test Deviation
There is no deviation with the original standard.
4.3.6. EUT Operation during Test
The EUT was programmed to be in continuously transmitting mode.
4.3.7. Test Result
Temperature 24℃ Humidity 59%
Test Engineer Beck Wu Configurations 802.11b/g
Test Date Oct. 16, 2007
Configuration IEEE 802.11b
Frequency range (MHz) Test Conditions
fL CH 1 fH CH 13
T nom (°C) 20 V nom (V) 230 2402.8012 2481.1346
V max (V) 253 2403.0256 2481.2365 T min (°C) 0
V min (V) 207 2403.0256 2481.2365
V max (V) 253 2402.6412 2481.0258 T max (°C) 55
V min (V) 207 2402.6412 2481.0258
Min. fL / Max. fH Band Edges 2402.6412 2481.2365
Limits fL > 2400.0 MHz fH < 2483.5 MHz
Result Complies
Report No.: ER7O1204AB
Report Format Version: 02 Page No. : 15 of 86
Issued Date : Nov. 29, 2007
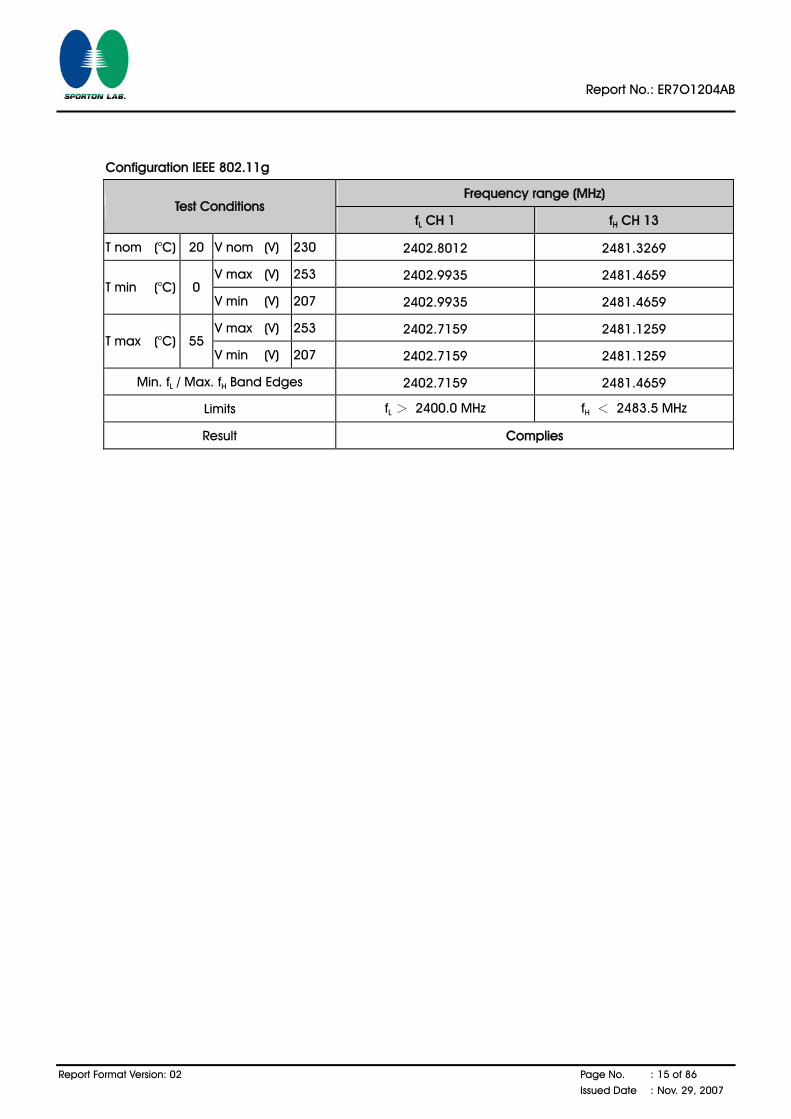
Configuration IEEE 802.11g
Frequency range (MHz) Test Conditions
fL CH 1 fH CH 13
T nom (°C) 20 V nom (V) 230 2402.8012 2481.3269
V max (V) 253 2402.9935 2481.4659 T min (°C) 0
V min (V) 207 2402.9935 2481.4659
V max (V) 253 2402.7159 2481.1259 T max (°C) 55
V min (V) 207 2402.7159 2481.1259
Min. fL / Max. fH Band Edges 2402.7159 2481.4659
Limits fL > 2400.0 MHz fH < 2483.5 MHz
Result Complies
Report No.: ER7O1204AB
Report Format Version: 02 Page No. : 16 of 86
Issued Date : Nov. 29, 2007
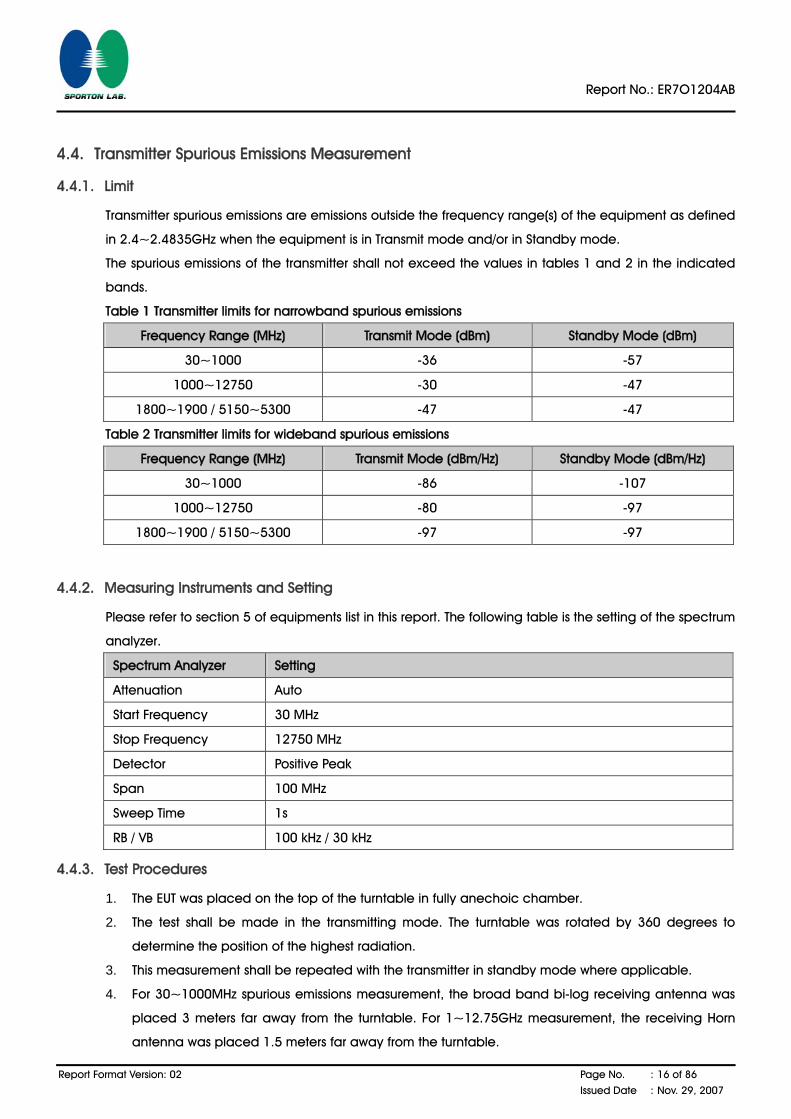
4.4. Transmitter Spurious Emissions Measurement
4.4.1. Limit
Transmitter spurious emissions are emissions outside the frequency range(s) of the equipment as defined
in 2.4~2.4835GHz when the equipment is in Transmit mode and/or in Standby mode.
The spurious emissions of the transmitter shall not exceed the values in tables 1 and 2 in the indicated
bands.
Table 1 Transmitter limits for narrowband spurious emissions
Frequency Range (MHz) Transmit Mode (dBm) Standby Mode (dBm)
30~1000 -36 -57
1000~12750 -30 -47
1800~1900 / 5150~5300 -47 -47
Table 2 Transmitter limits for wideband spurious emissions
Frequency Range (MHz) Transmit Mode (dBm/Hz) Standby Mode (dBm/Hz)
30~1000 -86 -107
1000~12750 -80 -97
1800~1900 / 5150~5300 -97 -97
4.4.2. Measuring Instruments and Setting
Please refer to section 5 of equipments list in this report. The following table is the setting of the spectrum
analyzer.
Spectrum Analyzer Setting
Attenuation Auto
Start Frequency 30 MHz
Stop Frequency 12750 MHz
Detector Positive Peak
Span 100 MHz
Sweep Time 1s
RB / VB 100 kHz / 30 kHz
4.4.3. Test Procedures
1. The EUT was placed on the top of the turntable in fully anechoic chamber.
2. The test shall be made in the transmitting mode. The turntable was rotated by 360 degrees to
determine the position of the highest radiation.
3. This measurement shall be repeated with the transmitter in standby mode where applicable.
4. For 30~1000MHz spurious emissions measurement, the broad band bi-log receiving antenna was
placed 3 meters far away from the turntable. For 1~12.75GHz measurement, the receiving Horn
antenna was placed 1.5 meters far away from the turntable.
Report No.: ER7O1204AB
Report Format Version: 02 Page No. : 17 of 86
Issued Date : Nov. 29, 2007
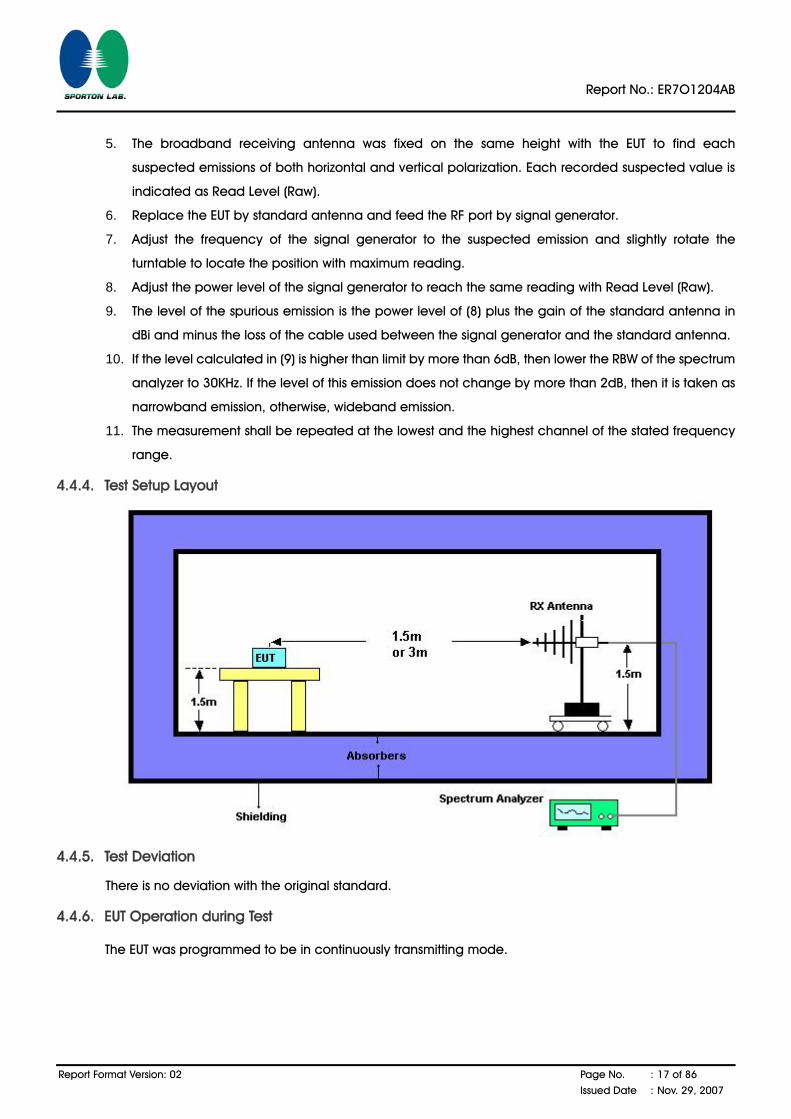
5. The broadband receiving antenna was fixed on the same height with the EUT to find each
suspected emissions of both horizontal and vertical polarization. Each recorded suspected value is
indicated as Read Level (Raw).
6. Replace the EUT by standard antenna and feed the RF port by signal generator.
7. Adjust the frequency of the signal generator to the suspected emission and slightly rotate the
turntable to locate the position with maximum reading.
8. Adjust the power level of the signal generator to reach the same reading with Read Level (Raw).
9. The level of the spurious emission is the power level of (8) plus the gain of the standard antenna in
dBi and minus the loss of the cable used between the signal generator and the standard antenna.
10. If the level calculated in (9) is higher than limit by more than 6dB, then lower the RBW of the spectrum
analyzer to 30KHz. If the level of this emission does not change by more than 2dB, then it is taken as
narrowband emission, otherwise, wideband emission.
11. The measurement shall be repeated at the lowest and the highest channel of the stated frequency
range.
4.4.4. Test Setup Layout
4.4.5. Test Deviation
There is no deviation with the original standard.
4.4.6. EUT Operation during Test
The EUT was programmed to be in continuously transmitting mode.
Report No.: ER7O1204AB
Report Format Version: 02 Page No. : 18 of 86
Issued Date : Nov. 29, 2007
4.4.7. Results of Standby Mode Spurious Emissions
In the initial investigation on standby mode and receiving mode, no significant differences in spurious
emissions were observed between these 2 modes. Therefore, test data for standby mode was omitted in
this section.
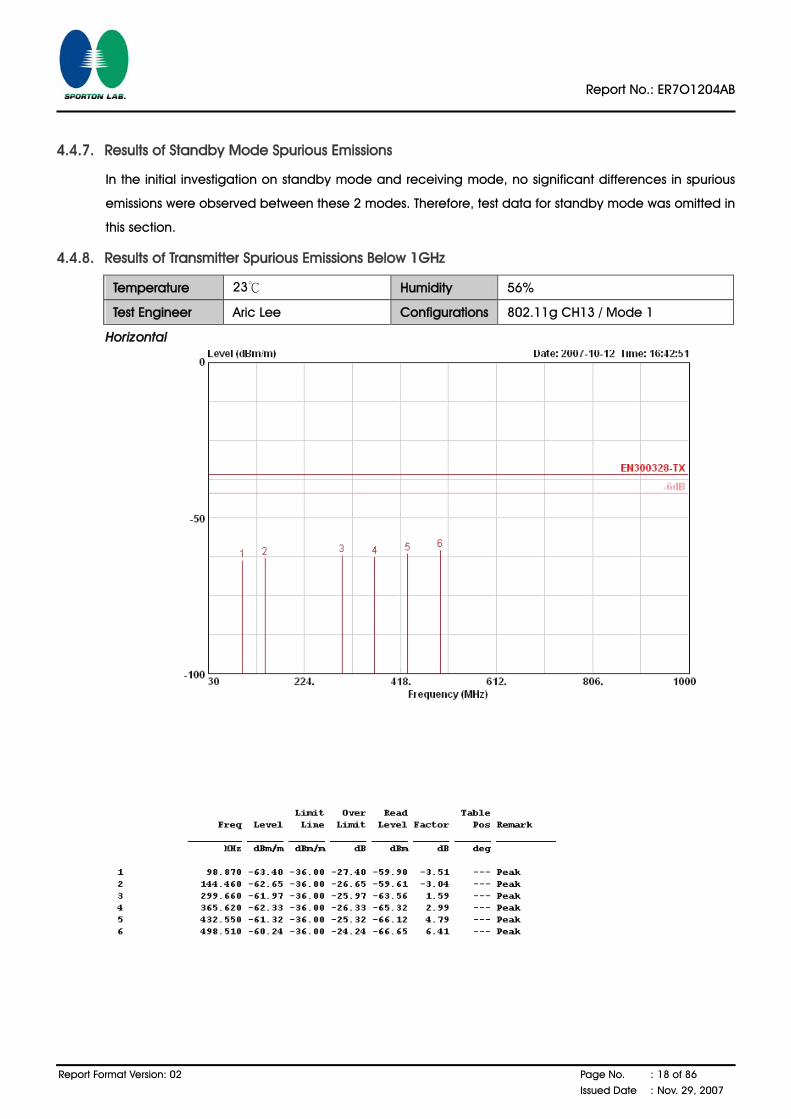
4.4.8. Results of Transmitter Spurious Emissions Below 1GHz
Temperature 23℃ Humidity 56%
Test Engineer Aric Lee Configurations 802.11g CH13 / Mode 1
Horizontal
Report No.: ER7O1204AB
Report Format Version: 02 Page No. : 19 of 86
Issued Date : Nov. 29, 2007
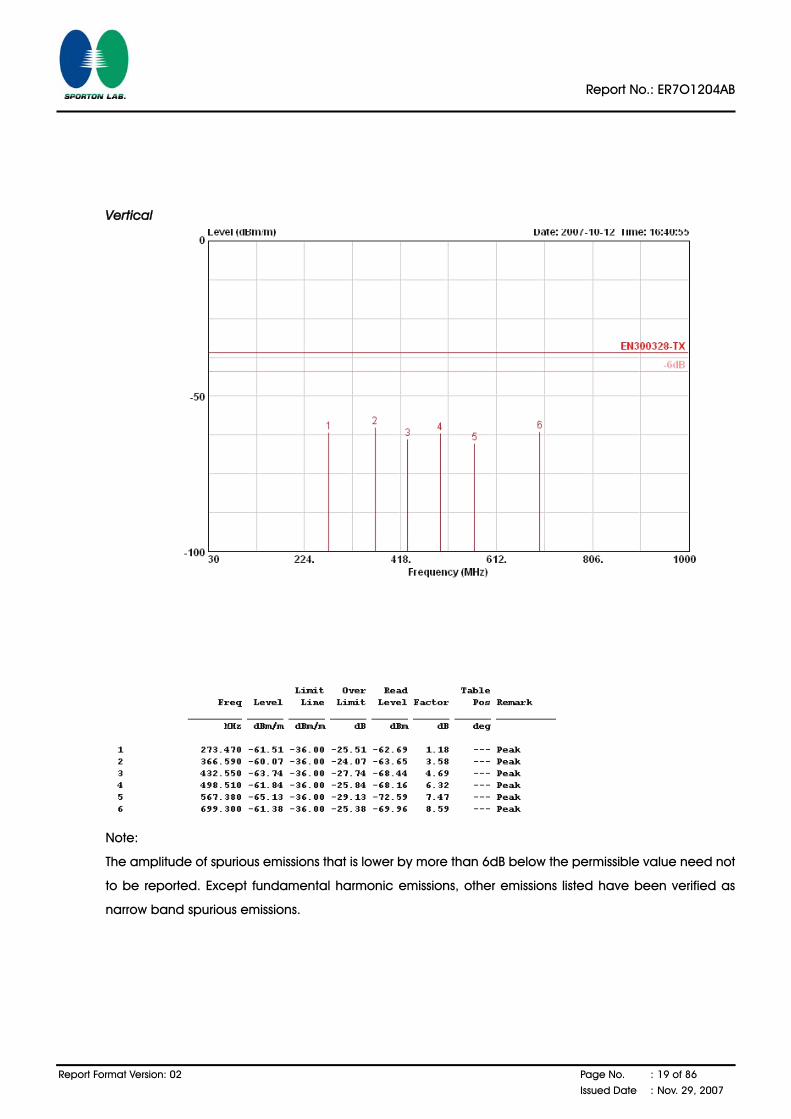
Vertical
Note:
The amplitude of spurious emissions that is lower by more than 6dB below the permissible value need not
to be reported. Except fundamental harmonic emissions, other emissions listed have been verified as
narrow band spurious emissions.

Report No.: ER7O1204AB
Report Format Version: 02 Page No. : 20 of 86
Issued Date : Nov. 29, 2007
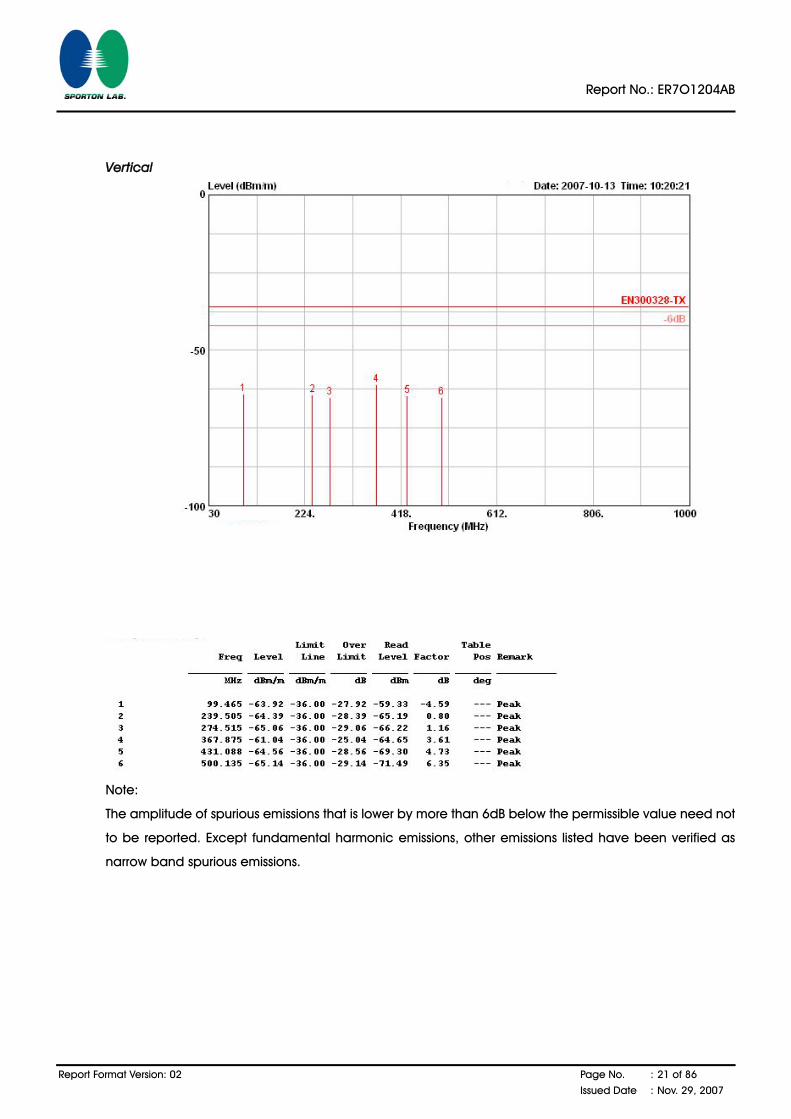
Temperature 23℃ Humidity 56%
Test Engineer Aric Lee Configurations 802.11g CH13 / Mode 2
Horizontal
Report No.: ER7O1204AB
Report Format Version: 02 Page No. : 21 of 86
Issued Date : Nov. 29, 2007
Vertical
Note:
The amplitude of spurious emissions that is lower by more than 6dB below the permissible value need not
to be reported. Except fundamental harmonic emissions, other emissions listed have been verified as
narrow band spurious emissions.
Report No.: ER7O1204AB
Report Format Version: 02 Page No. : 22 of 86
Issued Date : Nov. 29, 2007
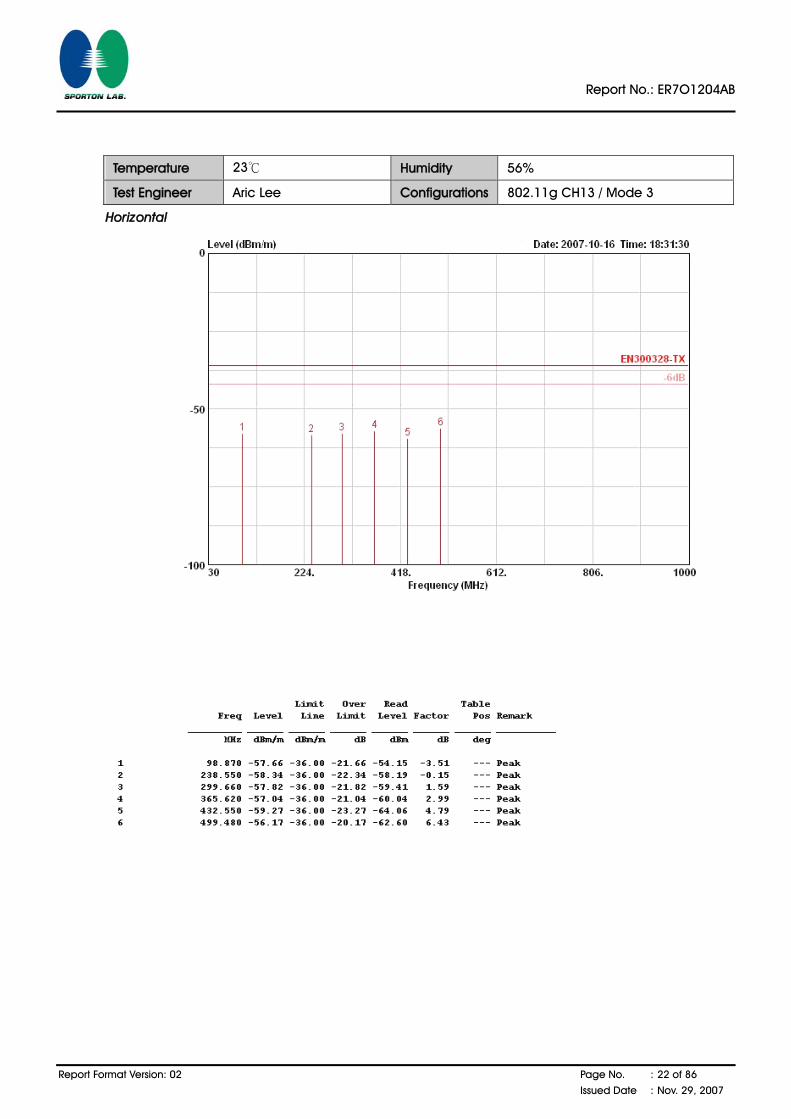
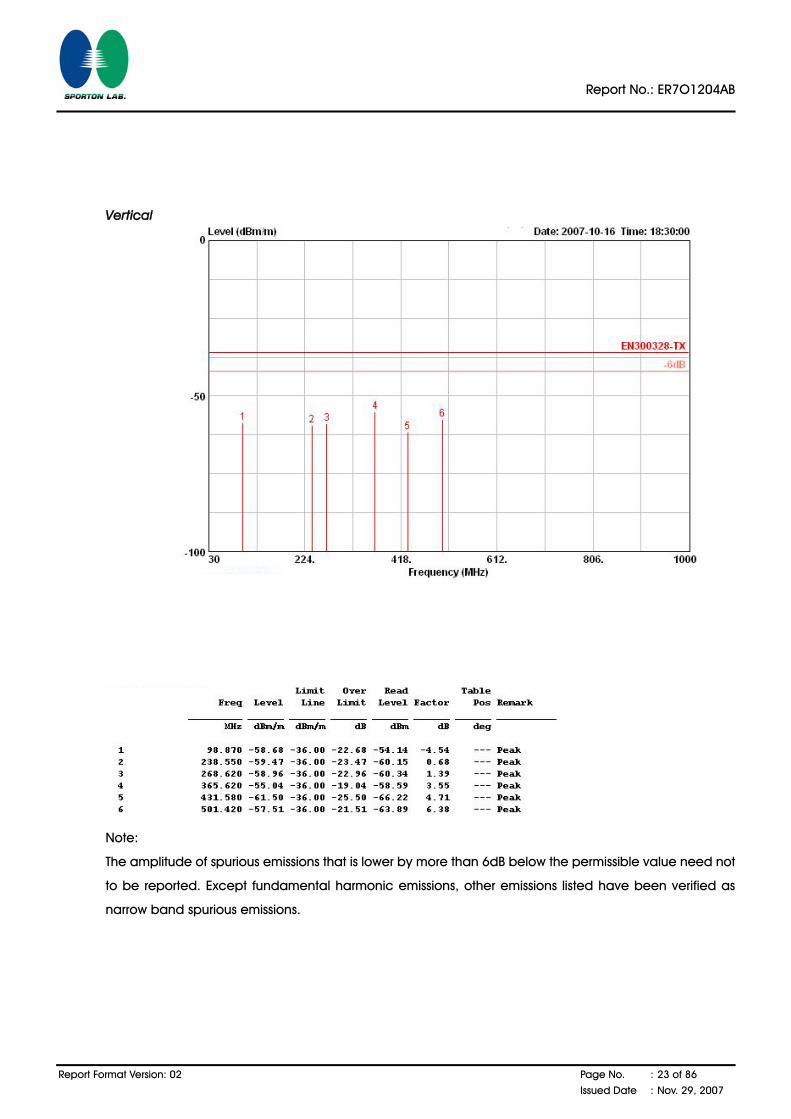
Temperature 23℃ Humidity 56%
Test Engineer Aric Lee Configurations 802.11g CH13 / Mode 3
Horizontal
Report No.: ER7O1204AB
Report Format Version: 02 Page No. : 23 of 86
Issued Date : Nov. 29, 2007
Vertical
Note:
The amplitude of spurious emissions that is lower by more than 6dB below the permissible value need not
to be reported. Except fundamental harmonic emissions, other emissions listed have been verified as
narrow band spurious emissions.
Report No.: ER7O1204AB
Report Format Version: 02 Page No. : 24 of 86
Issued Date : Nov. 29, 2007
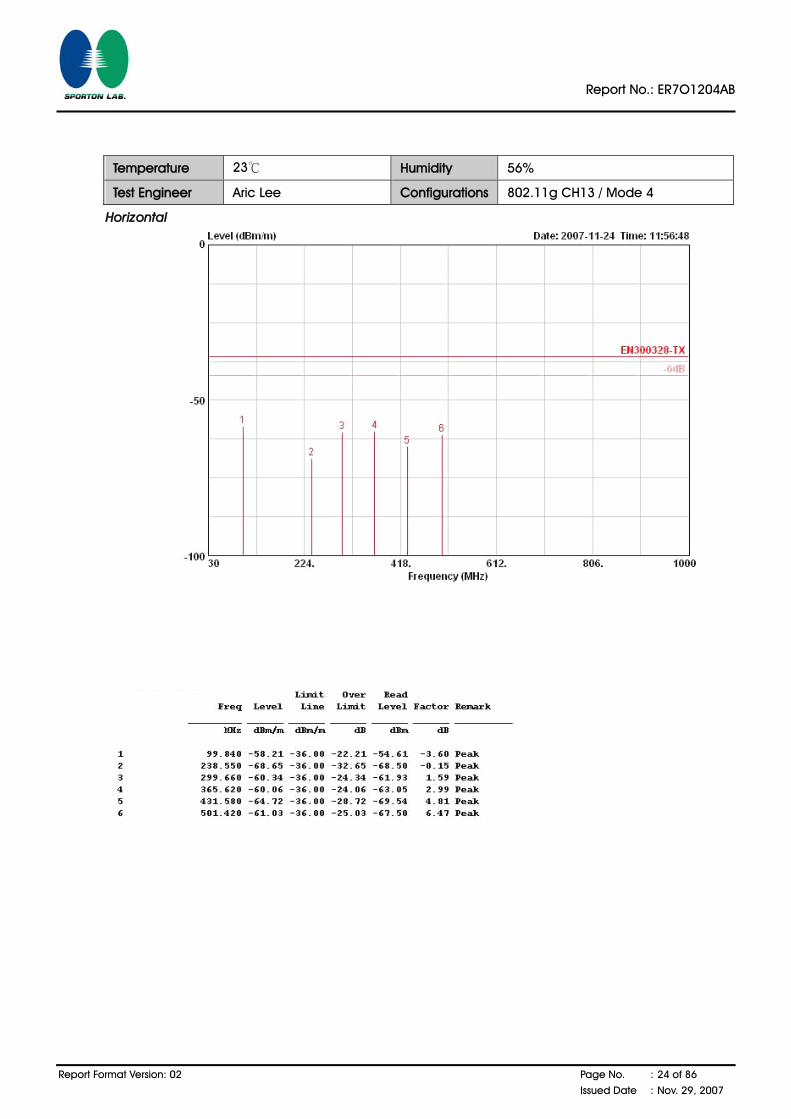
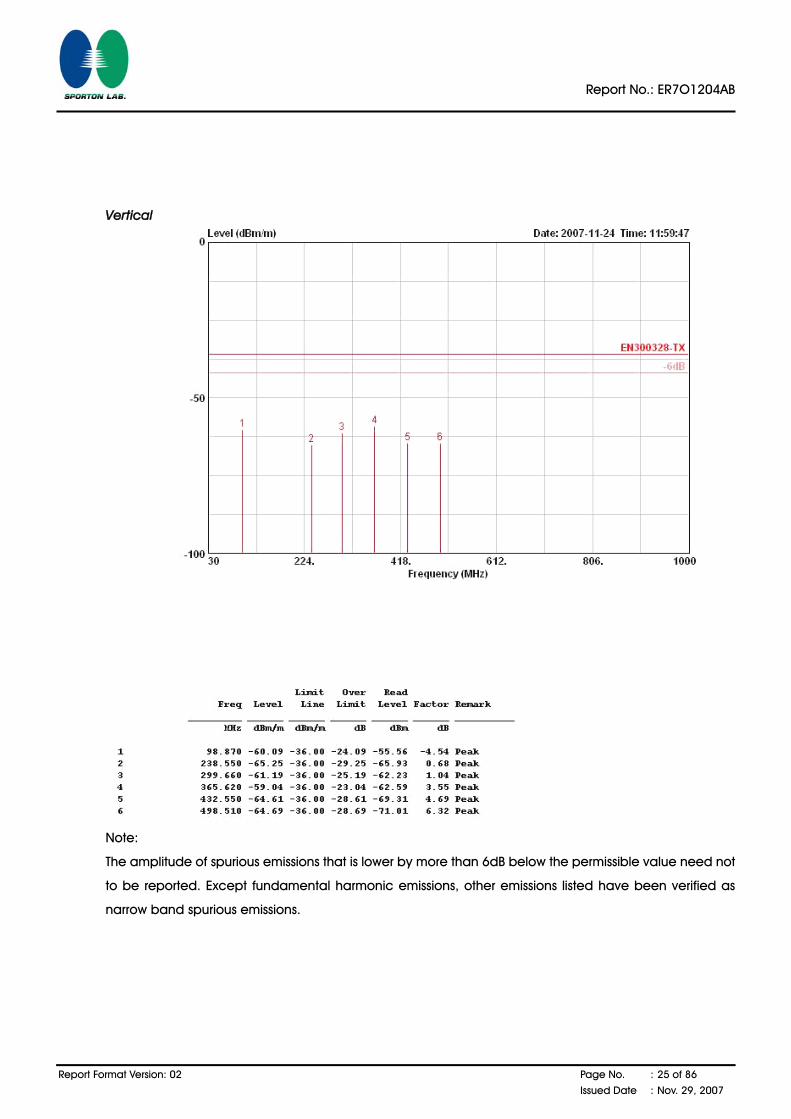
Temperature 23℃ Humidity 56%
Test Engineer Aric Lee Configurations 802.11g CH13 / Mode 4
Horizontal
Report No.: ER7O1204AB
Report Format Version: 02 Page No. : 25 of 86
Issued Date : Nov. 29, 2007
Vertical
Note:
The amplitude of spurious emissions that is lower by more than 6dB below the permissible value need not
to be reported. Except fundamental harmonic emissions, other emissions listed have been verified as
narrow band spurious emissions.
Report No.: ER7O1204AB
Report Format Version: 02 Page No. : 26 of 86
Issued Date : Nov. 29, 2007
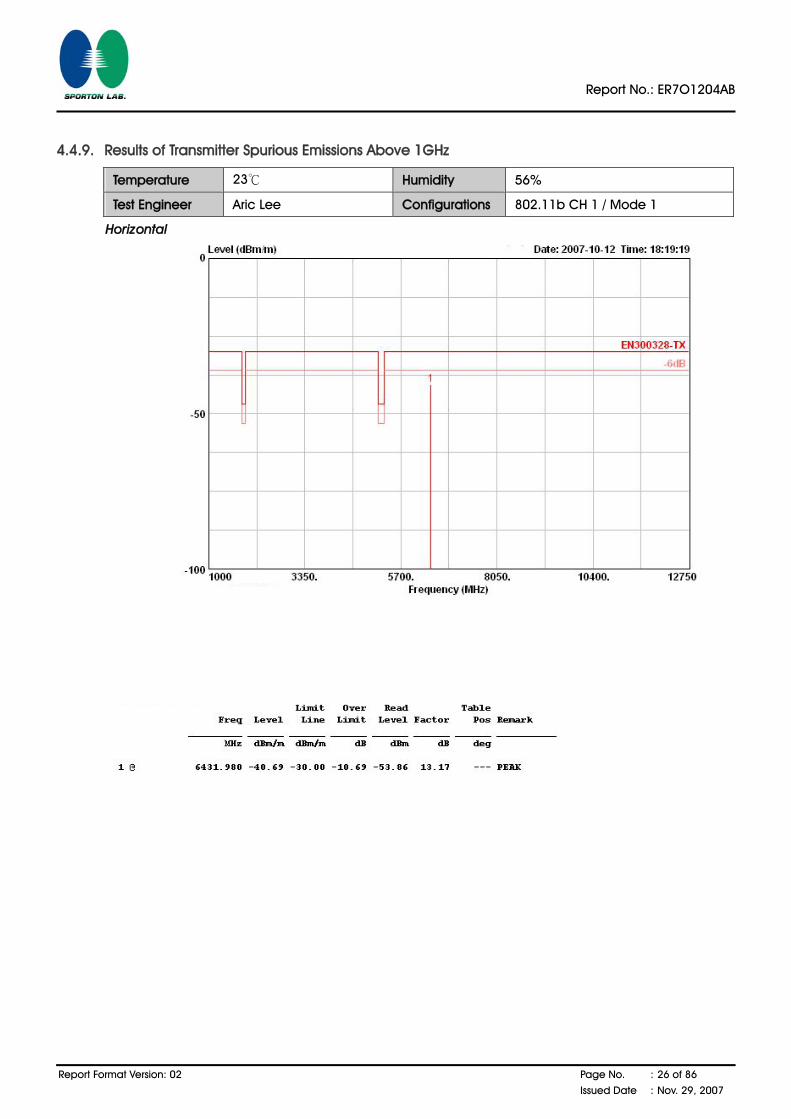
4.4.9. Results of Transmitter Spurious Emissions Above 1GHz
Temperature 23℃ Humidity 56%
Test Engineer Aric Lee Configurations 802.11b CH 1 / Mode 1
Horizontal

Report No.: ER7O1204AB
Report Format Version: 02 Page No. : 27 of 86
Issued Date : Nov. 29, 2007
Vertical
Note:
The amplitude of spurious emissions that is lower by more than 6dB below the permissible value need not
to be reported. Except fundamental harmonic emissions, other emissions listed have been verified as
narrow band spurious emissions.
Report No.: ER7O1204AB
Report Format Version: 02 Page No. : 28 of 86
Issued Date : Nov. 29, 2007
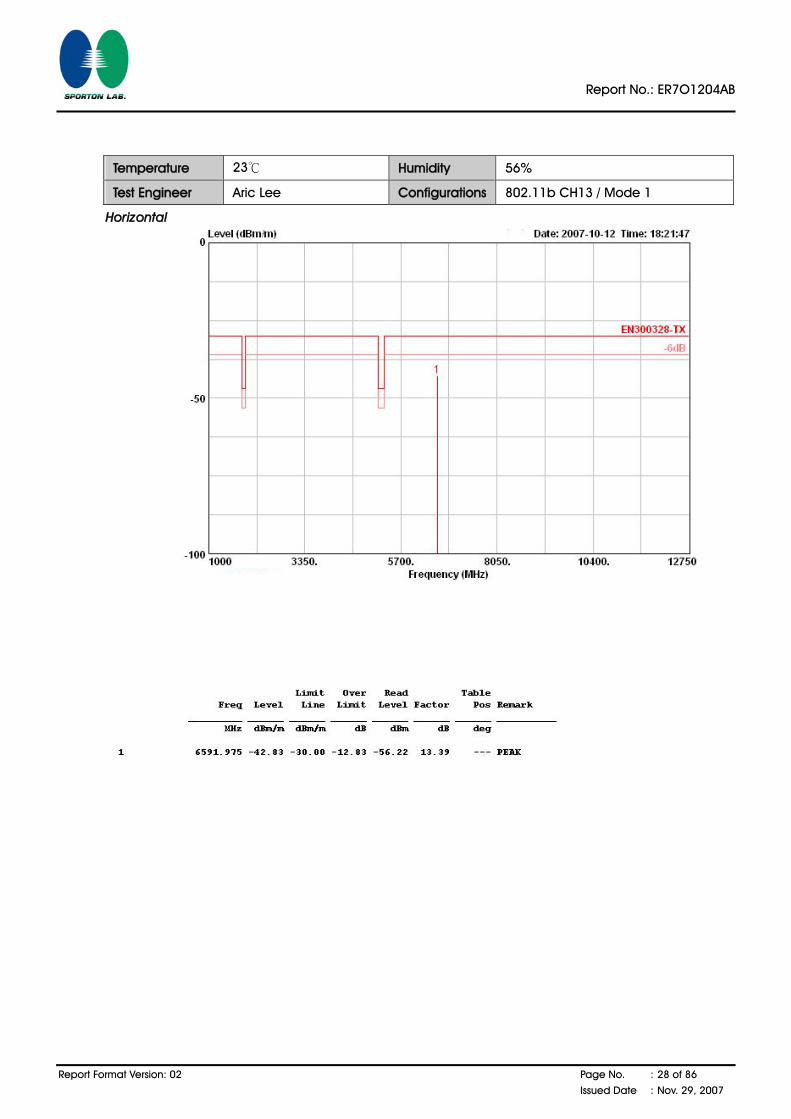
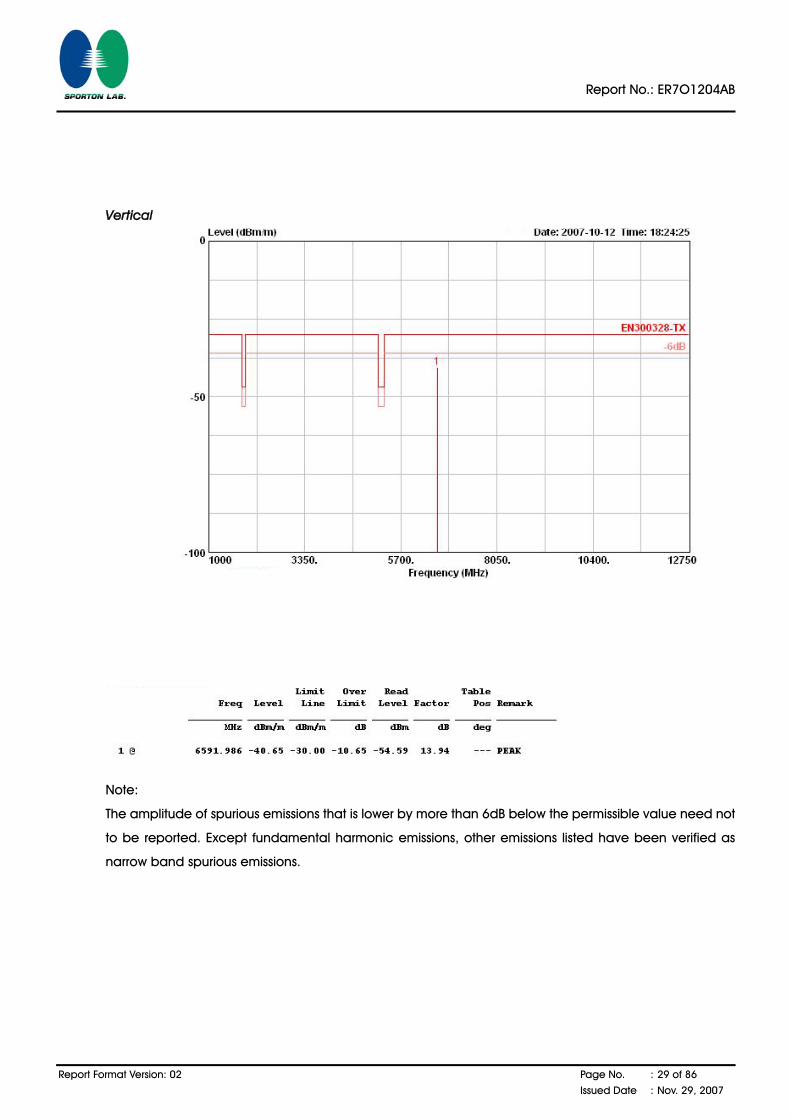
Temperature 23℃ Humidity 56%
Test Engineer Aric Lee Configurations 802.11b CH13 / Mode 1
Horizontal
Report No.: ER7O1204AB
Report Format Version: 02 Page No. : 29 of 86
Issued Date : Nov. 29, 2007
Vertical
Note:
The amplitude of spurious emissions that is lower by more than 6dB below the permissible value need not
to be reported. Except fundamental harmonic emissions, other emissions listed have been verified as
narrow band spurious emissions.

Report No.: ER7O1204AB
Report Format Version: 02 Page No. : 30 of 86
Issued Date : Nov. 29, 2007
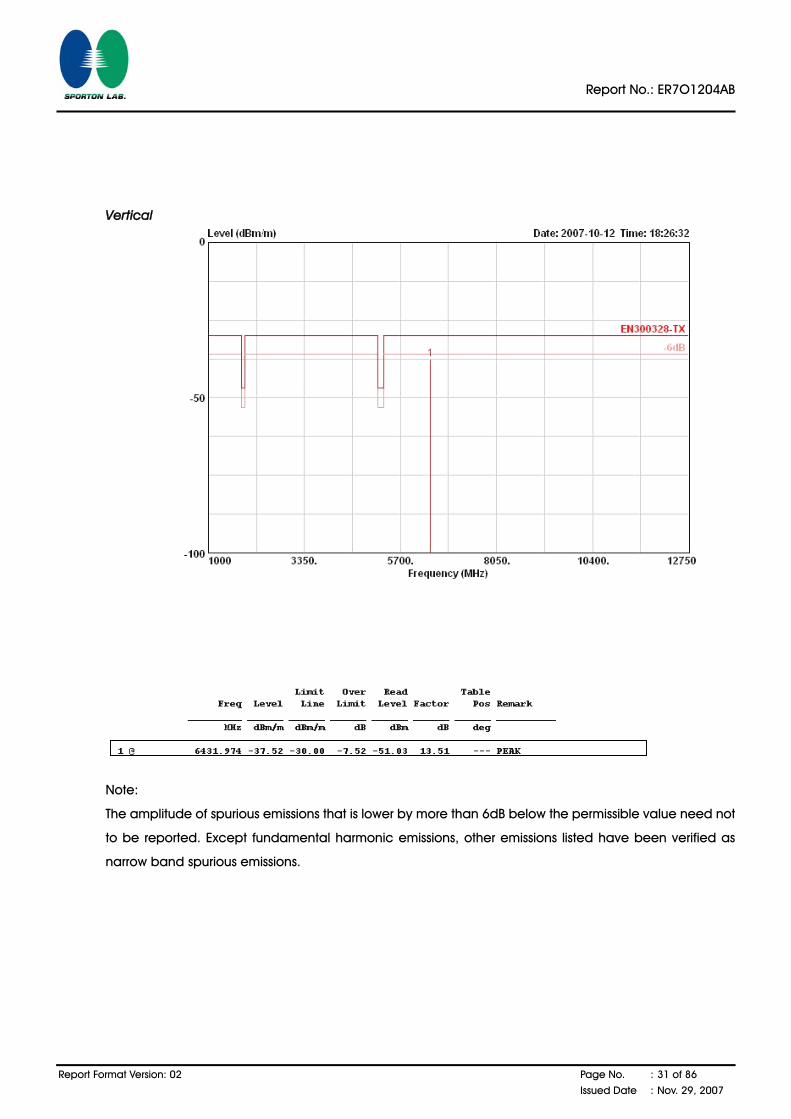
Temperature 23℃ Humidity 56%
Test Engineer Aric Lee Configurations 802.11g Ch 1 / Mode 1
Horizontal
Report No.: ER7O1204AB
Report Format Version: 02 Page No. : 31 of 86
Issued Date : Nov. 29, 2007
Vertical
Note:
The amplitude of spurious emissions that is lower by more than 6dB below the permissible value need not
to be reported. Except fundamental harmonic emissions, other emissions listed have been verified as
narrow band spurious emissions.
Report No.: ER7O1204AB
Report Format Version: 02 Page No. : 32 of 86
Issued Date : Nov. 29, 2007
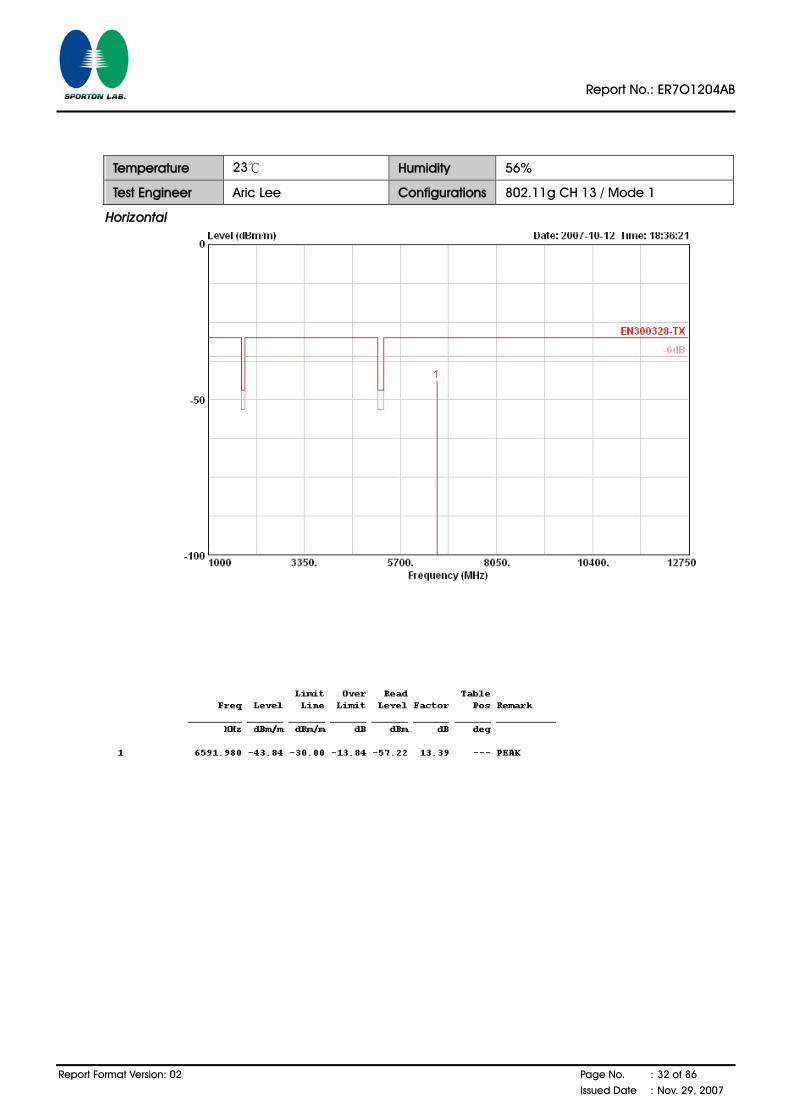
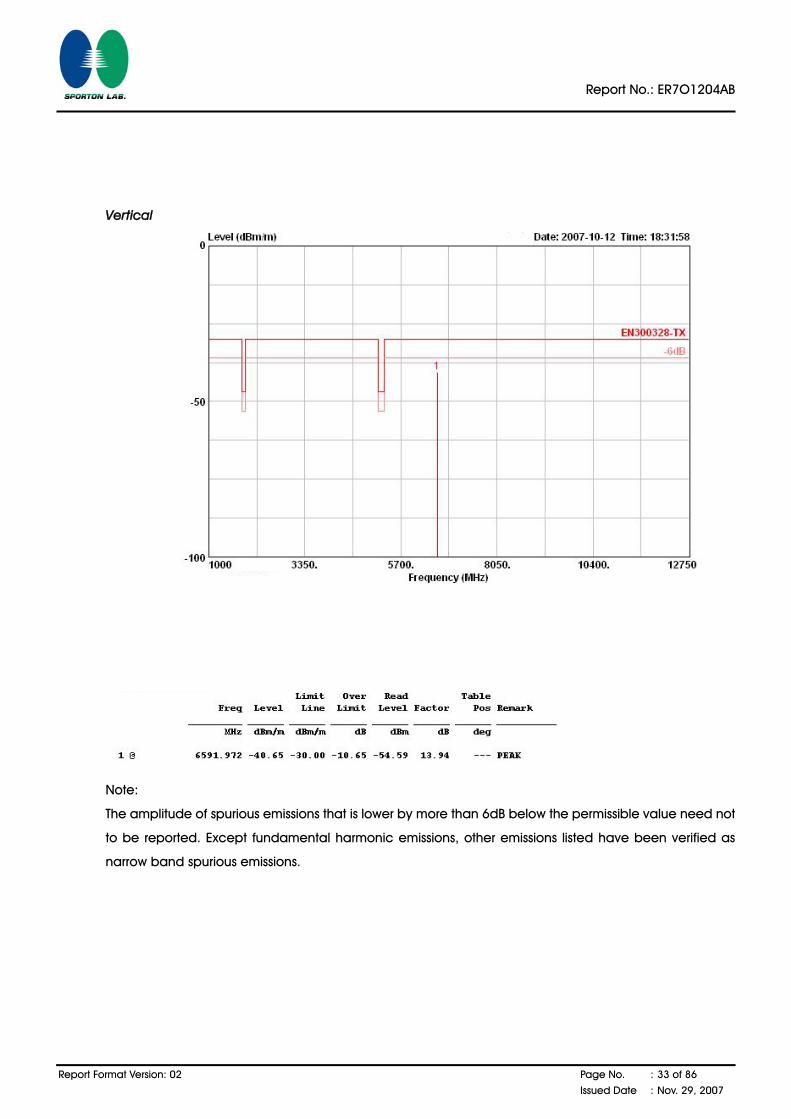
Temperature 23℃ Humidity 56%
Test Engineer Aric Lee Configurations 802.11g CH 13 / Mode 1
Horizontal
Report No.: ER7O1204AB
Report Format Version: 02 Page No. : 33 of 86
Issued Date : Nov. 29, 2007
Vertical
Note:
The amplitude of spurious emissions that is lower by more than 6dB below the permissible value need not
to be reported. Except fundamental harmonic emissions, other emissions listed have been verified as
narrow band spurious emissions.
Report No.: ER7O1204AB
Report Format Version: 02 Page No. : 34 of 86
Issued Date : Nov. 29, 2007
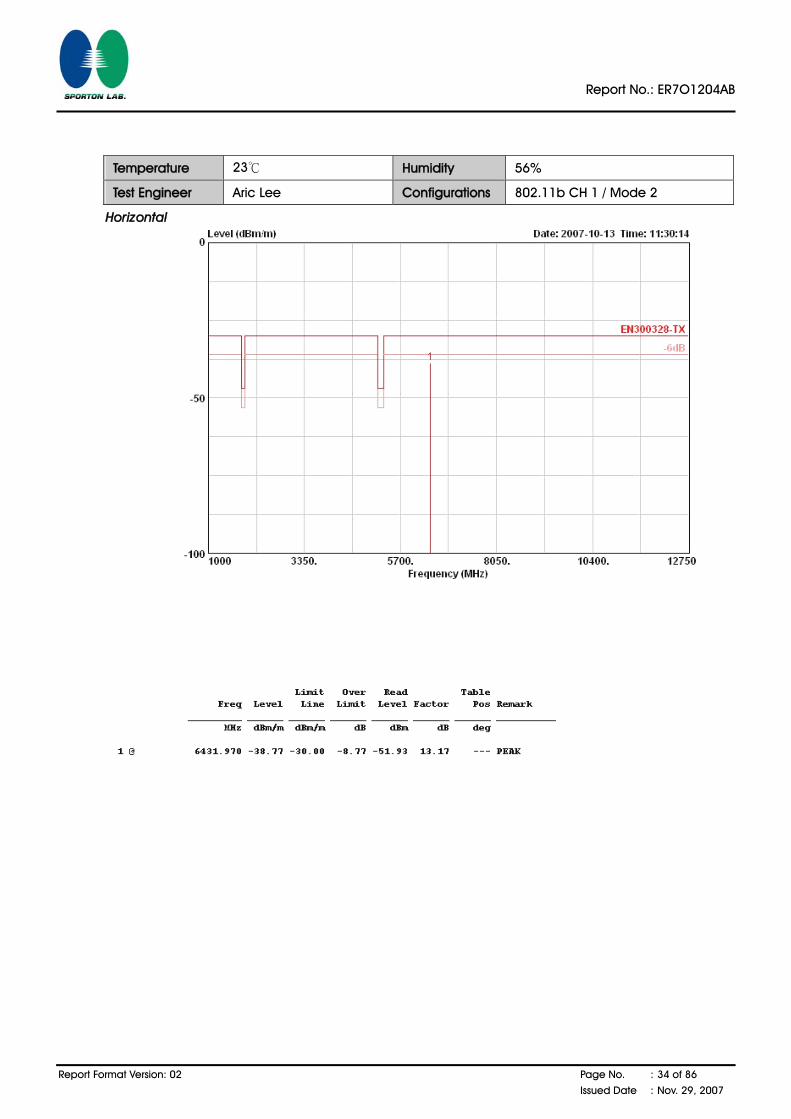
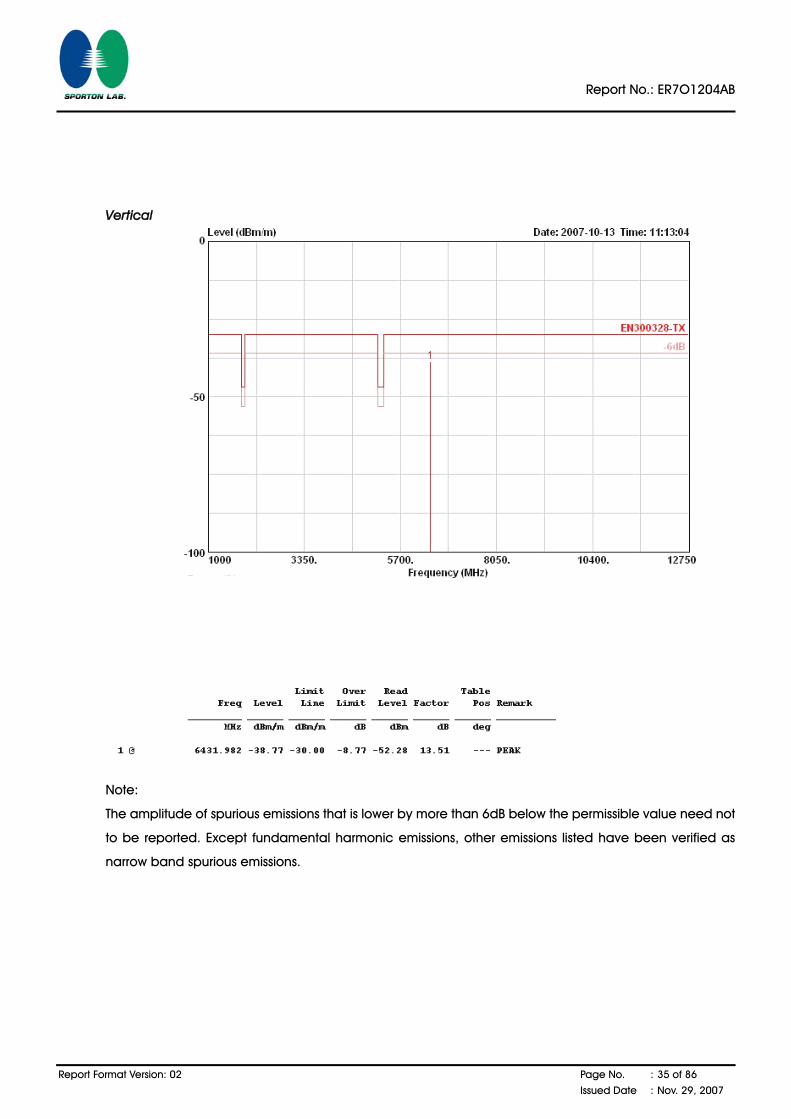
Temperature 23℃ Humidity 56%
Test Engineer Aric Lee Configurations 802.11b CH 1 / Mode 2
Horizontal
Report No.: ER7O1204AB
Report Format Version: 02 Page No. : 35 of 86
Issued Date : Nov. 29, 2007
Vertical
Note:
The amplitude of spurious emissions that is lower by more than 6dB below the permissible value need not
to be reported. Except fundamental harmonic emissions, other emissions listed have been verified as
narrow band spurious emissions.
Report No.: ER7O1204AB
Report Format Version: 02 Page No. : 36 of 86
Issued Date : Nov. 29, 2007
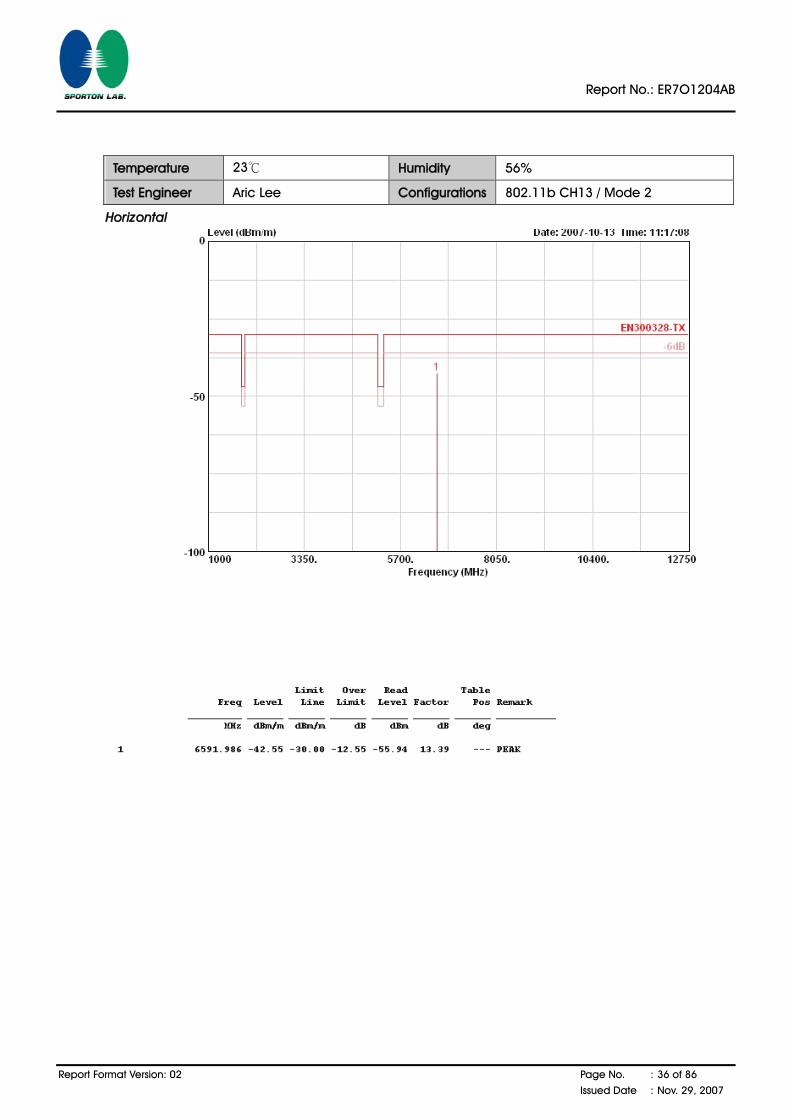
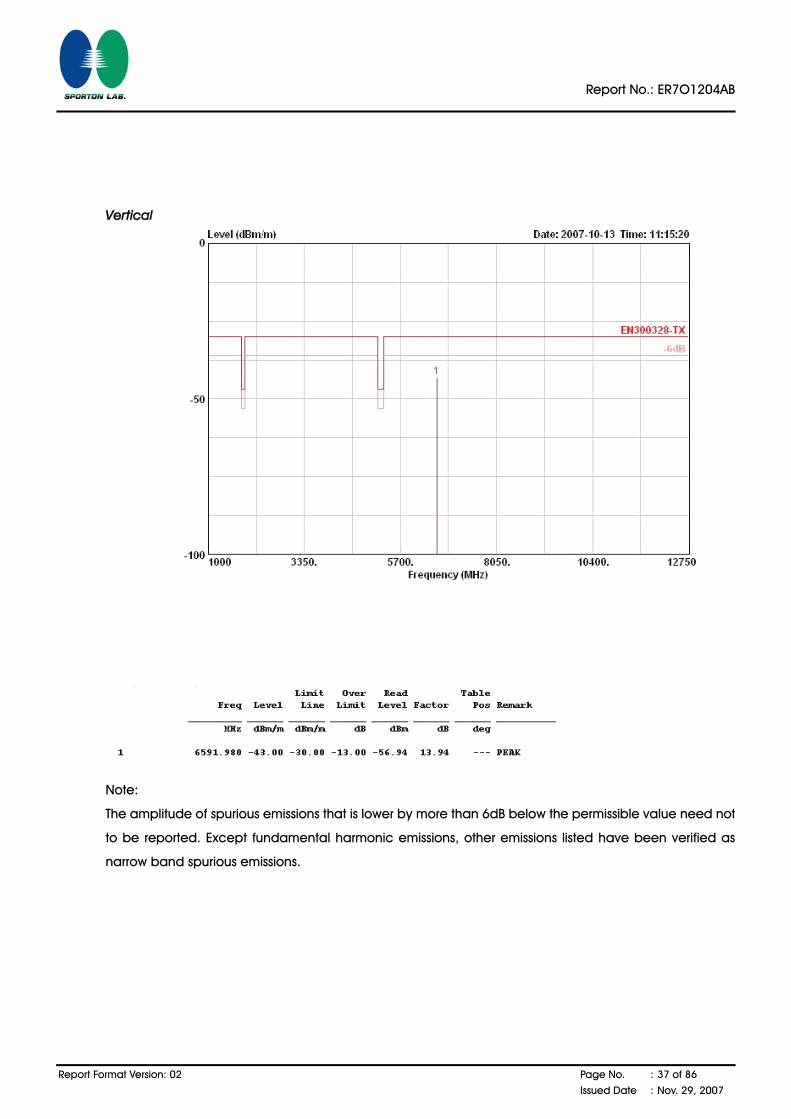
Temperature 23℃ Humidity 56%
Test Engineer Aric Lee Configurations 802.11b CH13 / Mode 2
Horizontal
Report No.: ER7O1204AB
Report Format Version: 02 Page No. : 37 of 86
Issued Date : Nov. 29, 2007
Vertical
Note:
The amplitude of spurious emissions that is lower by more than 6dB below the permissible value need not
to be reported. Except fundamental harmonic emissions, other emissions listed have been verified as
narrow band spurious emissions.

Report No.: ER7O1204AB
Report Format Version: 02 Page No. : 38 of 86
Issued Date : Nov. 29, 2007
Temperature 23℃ Humidity 56%
Test Engineer Aric Lee Configurations 802.11g Ch 1 / Mode 2
Horizontal

Report No.: ER7O1204AB
Report Format Version: 02 Page No. : 39 of 86
Issued Date : Nov. 29, 2007
Vertical
Note:
The amplitude of spurious emissions that is lower by more than 6dB below the permissible value need not
to be reported. Except fundamental harmonic emissions, other emissions listed have been verified as
narrow band spurious emissions.
Report No.: ER7O1204AB
Report Format Version: 02 Page No. : 40 of 86
Issued Date : Nov. 29, 2007
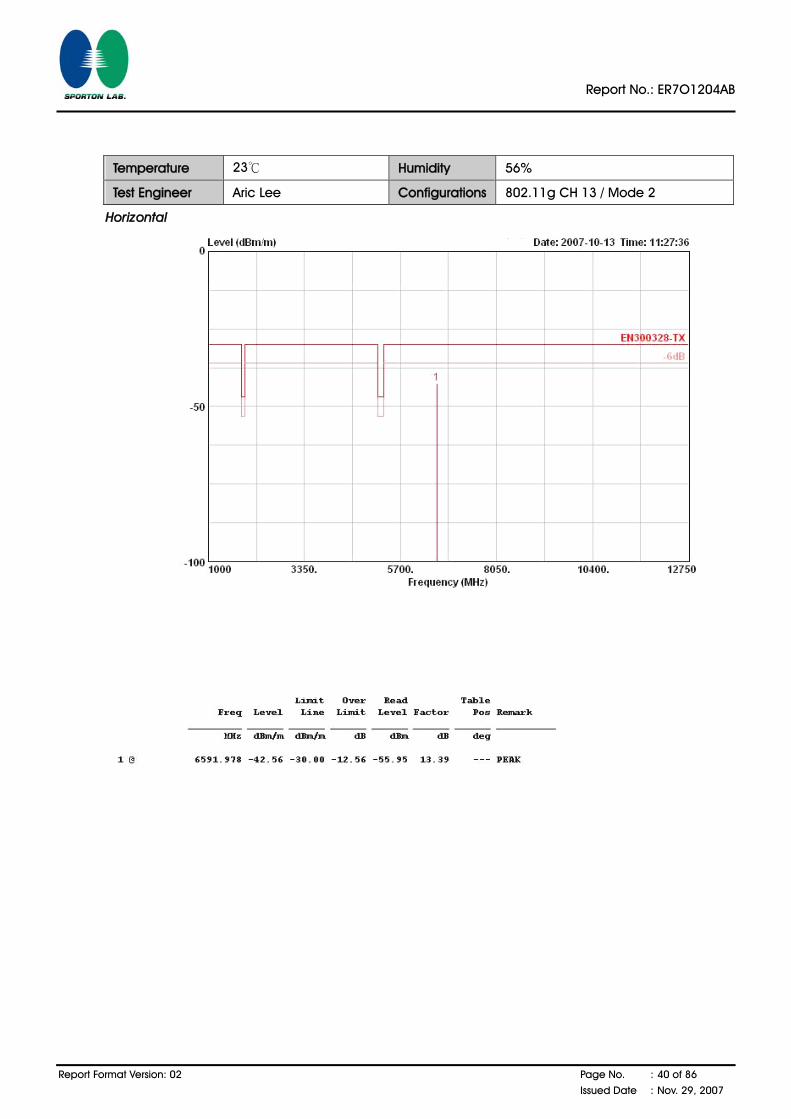
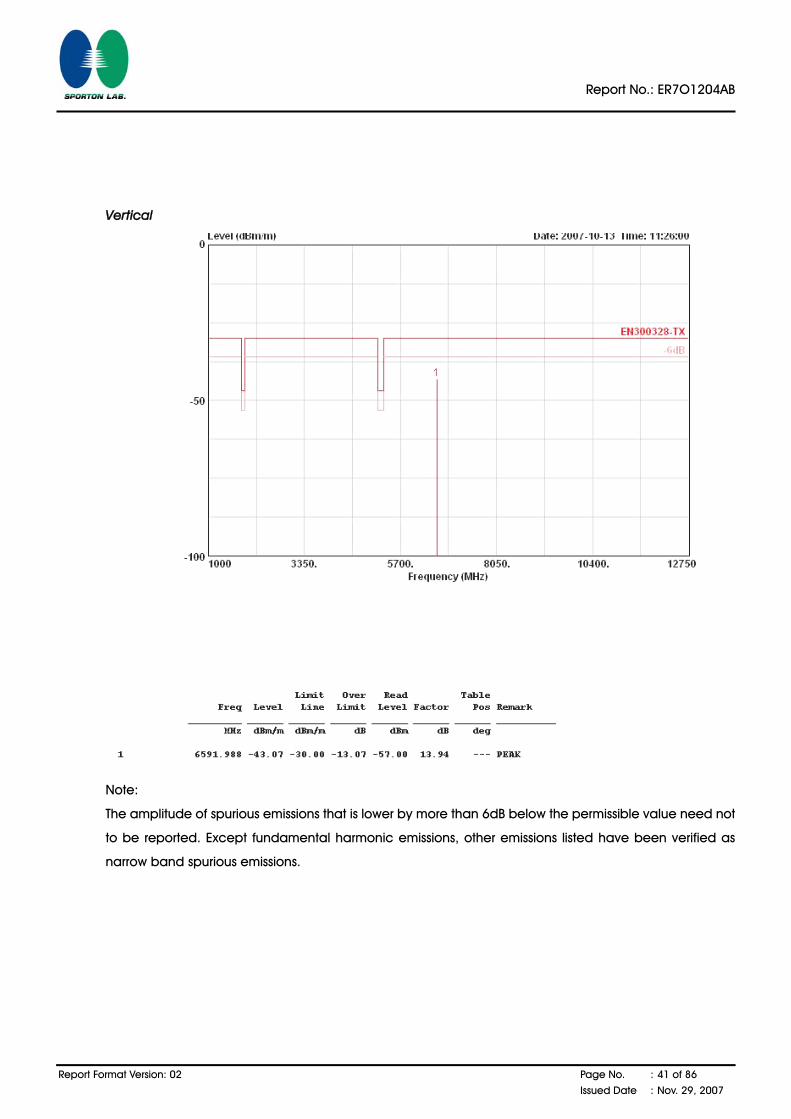
Temperature 23℃ Humidity 56%
Test Engineer Aric Lee Configurations 802.11g CH 13 / Mode 2
Horizontal
Report No.: ER7O1204AB
Report Format Version: 02 Page No. : 41 of 86
Issued Date : Nov. 29, 2007
Vertical
Note:
The amplitude of spurious emissions that is lower by more than 6dB below the permissible value need not
to be reported. Except fundamental harmonic emissions, other emissions listed have been verified as
narrow band spurious emissions.
Report No.: ER7O1204AB
Report Format Version: 02 Page No. : 42 of 86
Issued Date : Nov. 29, 2007
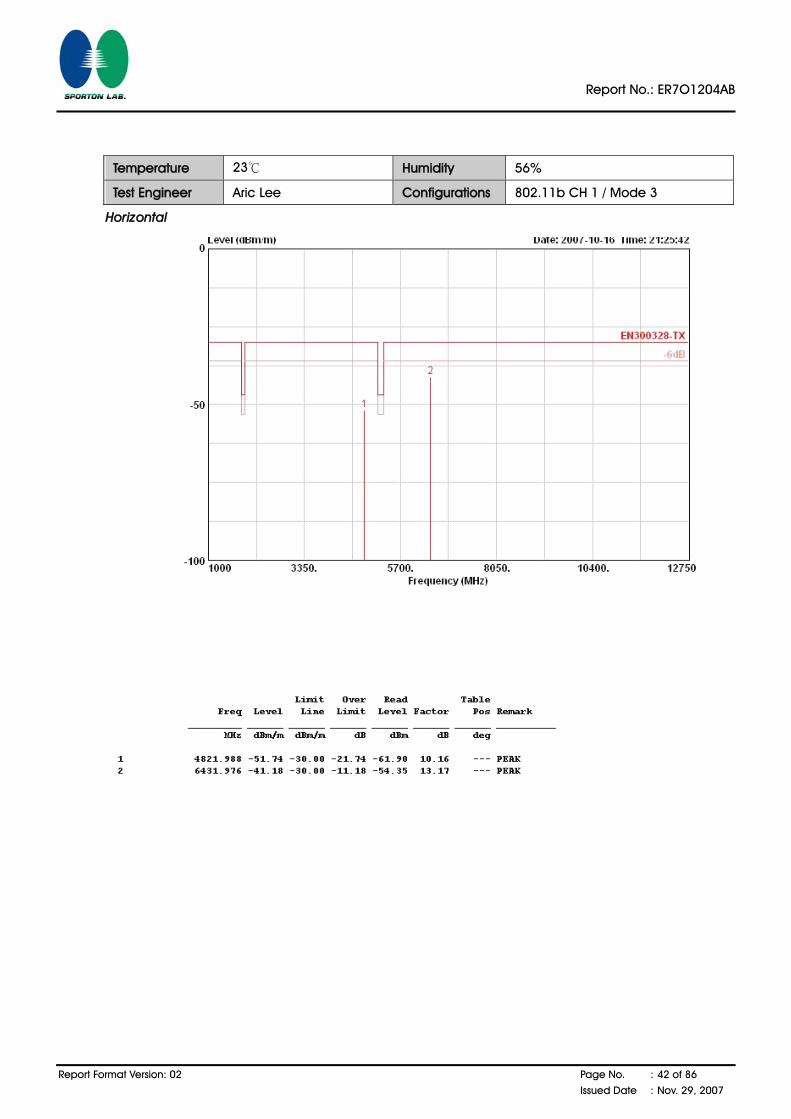
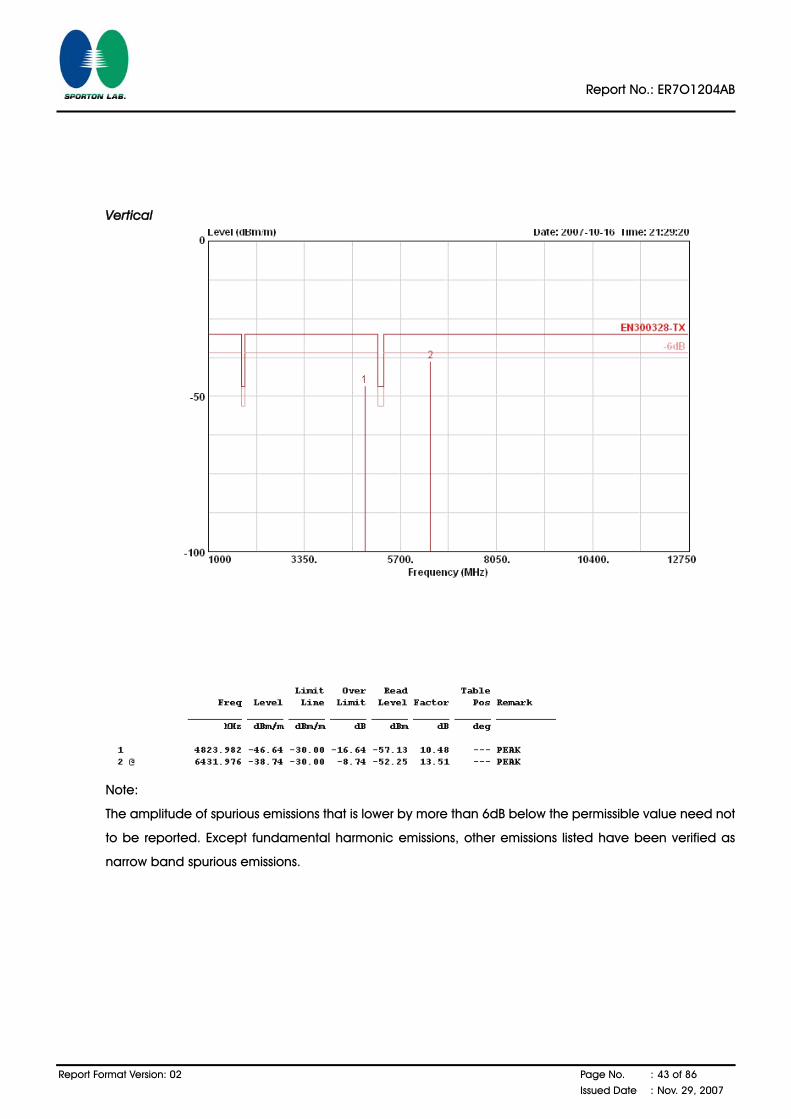
Temperature 23℃ Humidity 56%
Test Engineer Aric Lee Configurations 802.11b CH 1 / Mode 3
Horizontal
Report No.: ER7O1204AB
Report Format Version: 02 Page No. : 43 of 86
Issued Date : Nov. 29, 2007
Vertical
Note:
The amplitude of spurious emissions that is lower by more than 6dB below the permissible value need not
to be reported. Except fundamental harmonic emissions, other emissions listed have been verified as
narrow band spurious emissions.

Report No.: ER7O1204AB
Report Format Version: 02 Page No. : 44 of 86
Issued Date : Nov. 29, 2007
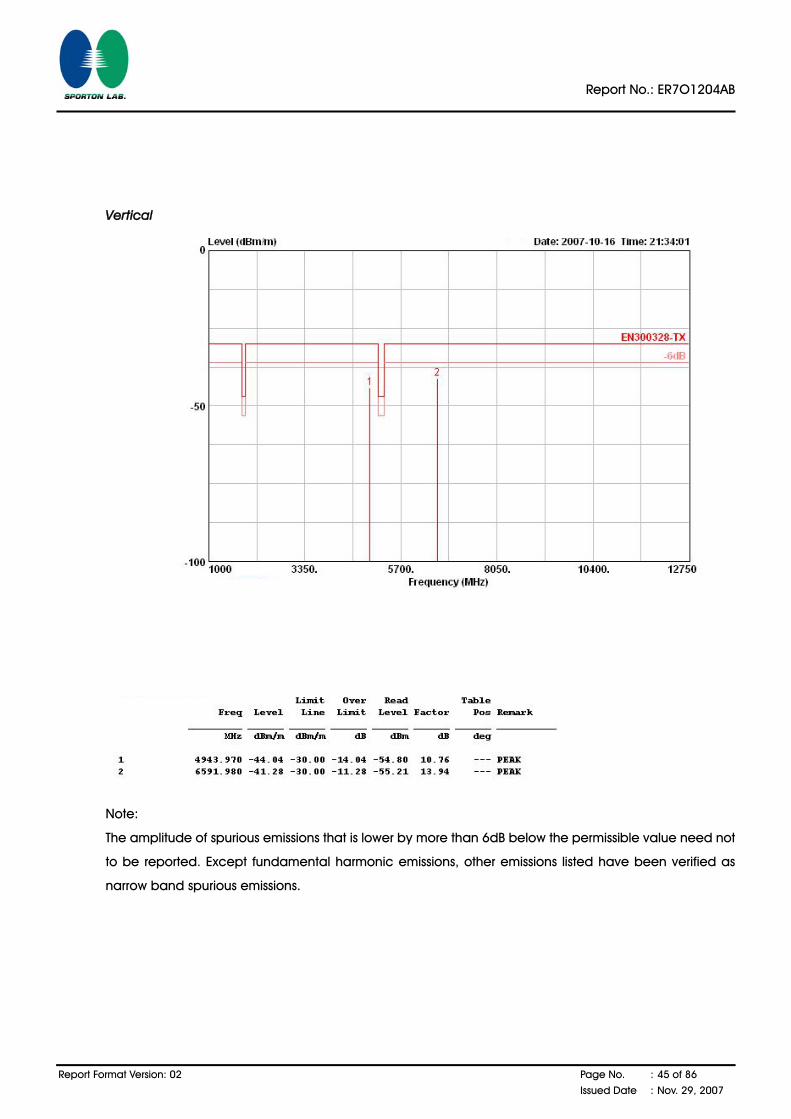
Temperature 23℃ Humidity 56%
Test Engineer Aric Lee Configurations 802.11b CH13 / Mode 3
Horizontal
Report No.: ER7O1204AB
Report Format Version: 02 Page No. : 45 of 86
Issued Date : Nov. 29, 2007
Vertical
Note:
The amplitude of spurious emissions that is lower by more than 6dB below the permissible value need not
to be reported. Except fundamental harmonic emissions, other emissions listed have been verified as
narrow band spurious emissions.
Report No.: ER7O1204AB
Report Format Version: 02 Page No. : 46 of 86
Issued Date : Nov. 29, 2007
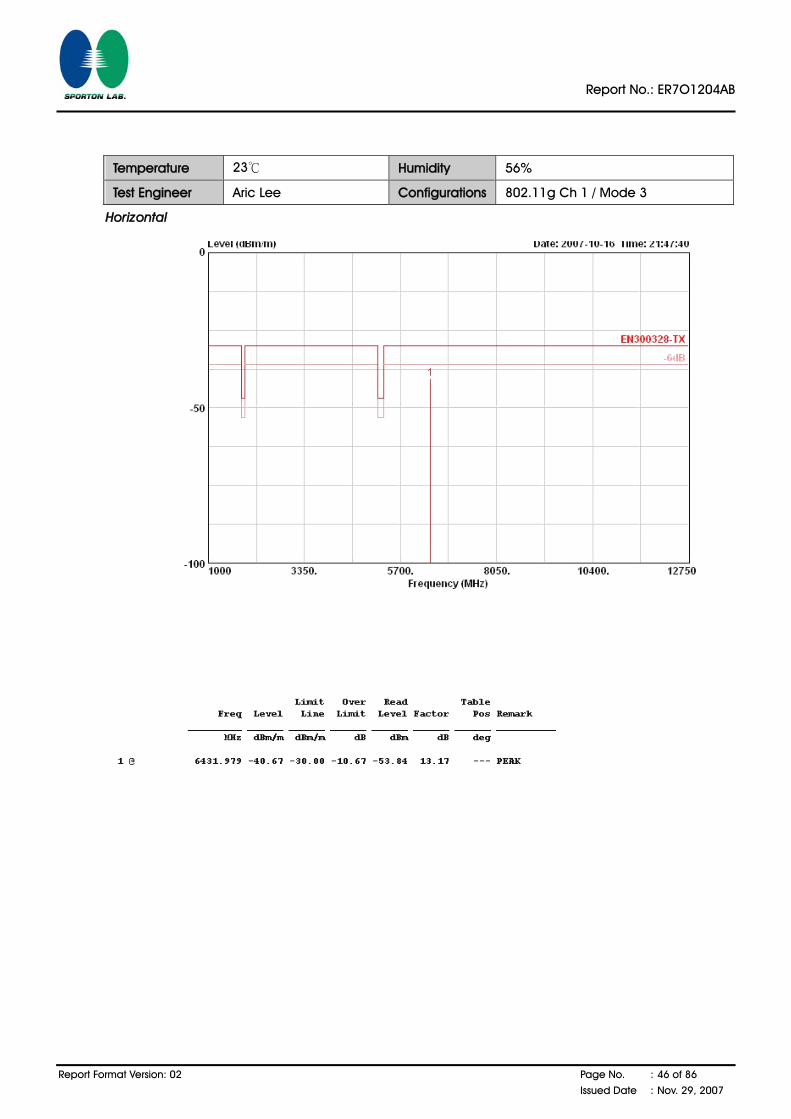
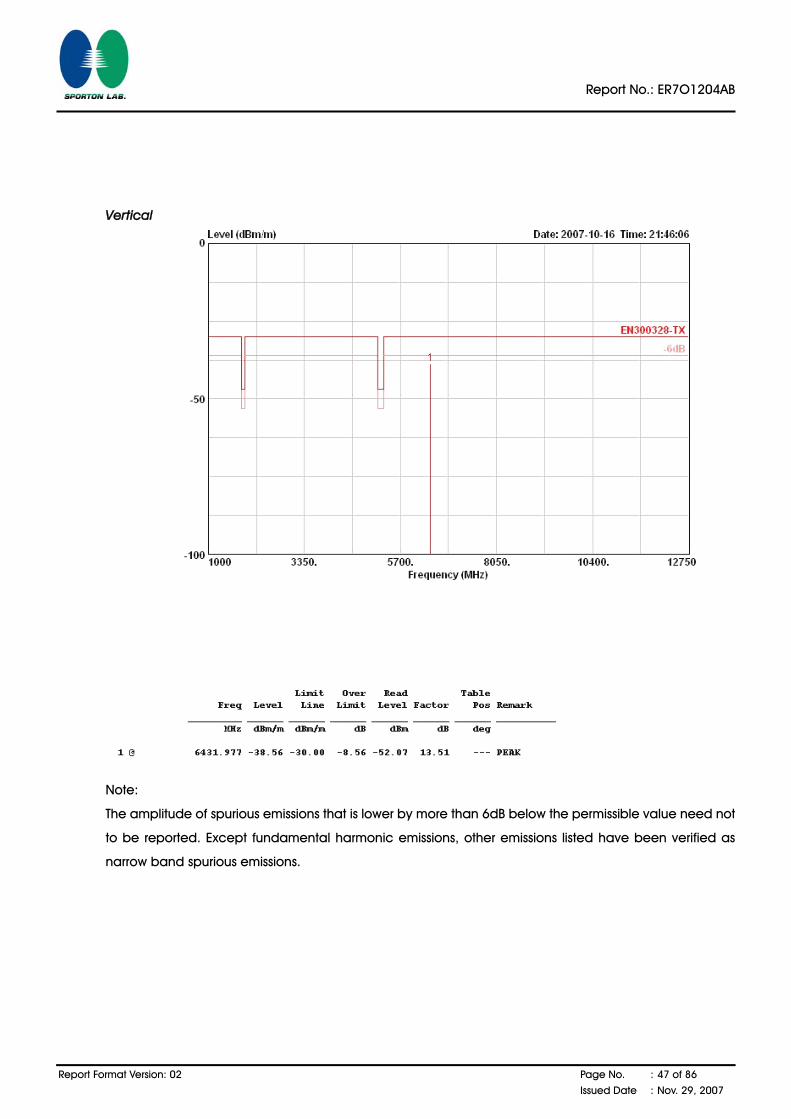
Temperature 23℃ Humidity 56%
Test Engineer Aric Lee Configurations 802.11g Ch 1 / Mode 3
Horizontal
Report No.: ER7O1204AB
Report Format Version: 02 Page No. : 47 of 86
Issued Date : Nov. 29, 2007
Vertical
Note:
The amplitude of spurious emissions that is lower by more than 6dB below the permissible value need not
to be reported. Except fundamental harmonic emissions, other emissions listed have been verified as
narrow band spurious emissions.
Report No.: ER7O1204AB
Report Format Version: 02 Page No. : 48 of 86
Issued Date : Nov. 29, 2007
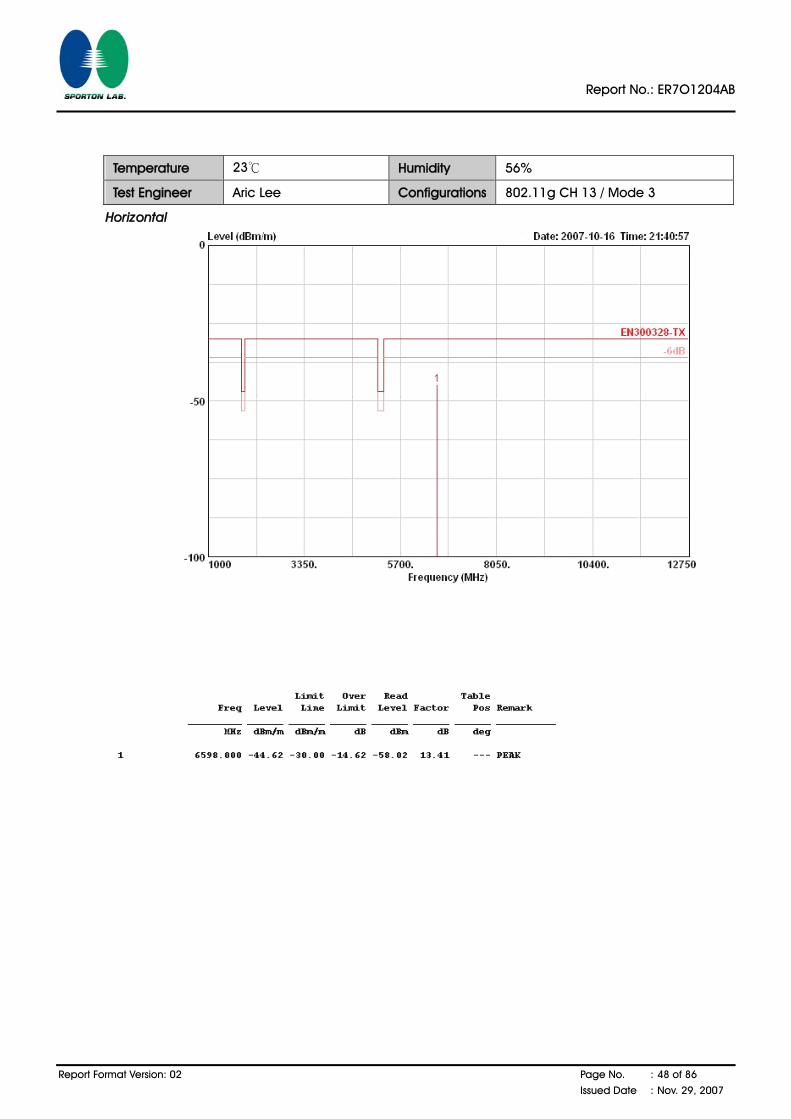
Temperature 23℃ Humidity 56%
Test Engineer Aric Lee Configurations 802.11g CH 13 / Mode 3
Horizontal
Report No.: ER7O1204AB
Report Format Version: 02 Page No. : 49 of 86
Issued Date : Nov. 29, 2007
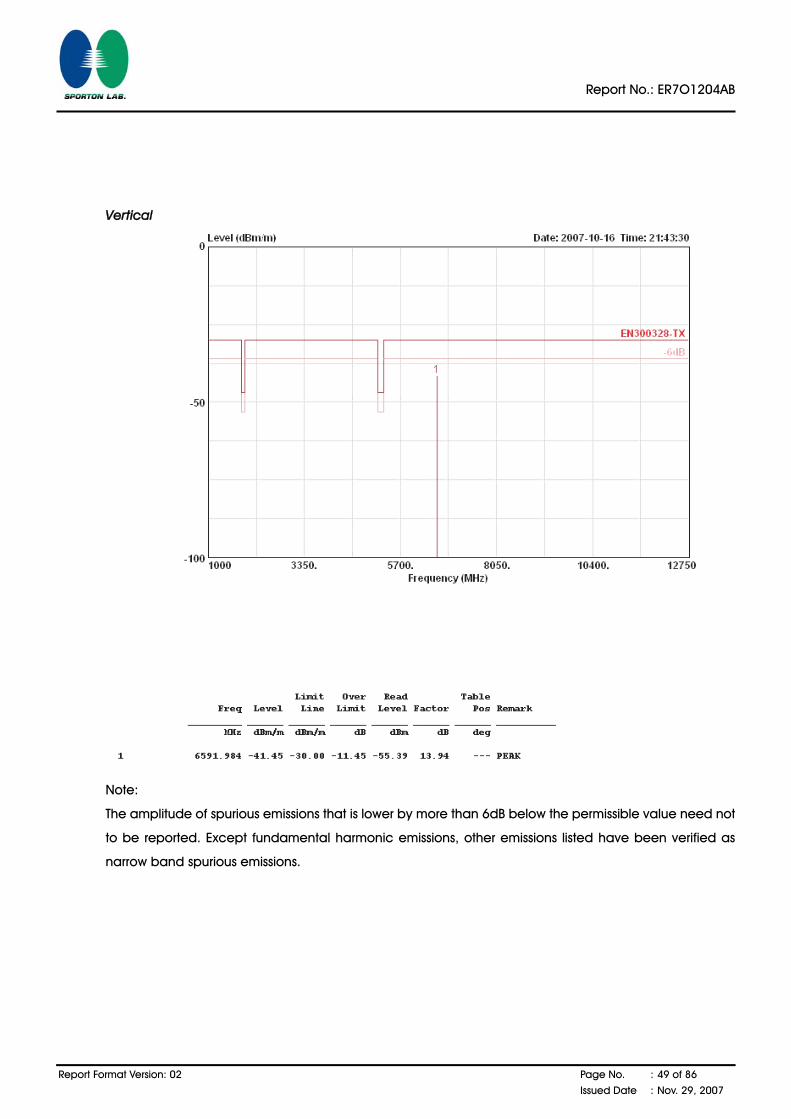
Vertical
Note:
The amplitude of spurious emissions that is lower by more than 6dB below the permissible value need not
to be reported. Except fundamental harmonic emissions, other emissions listed have been verified as
narrow band spurious emissions.
Report No.: ER7O1204AB
Report Format Version: 02 Page No. : 50 of 86
Issued Date : Nov. 29, 2007
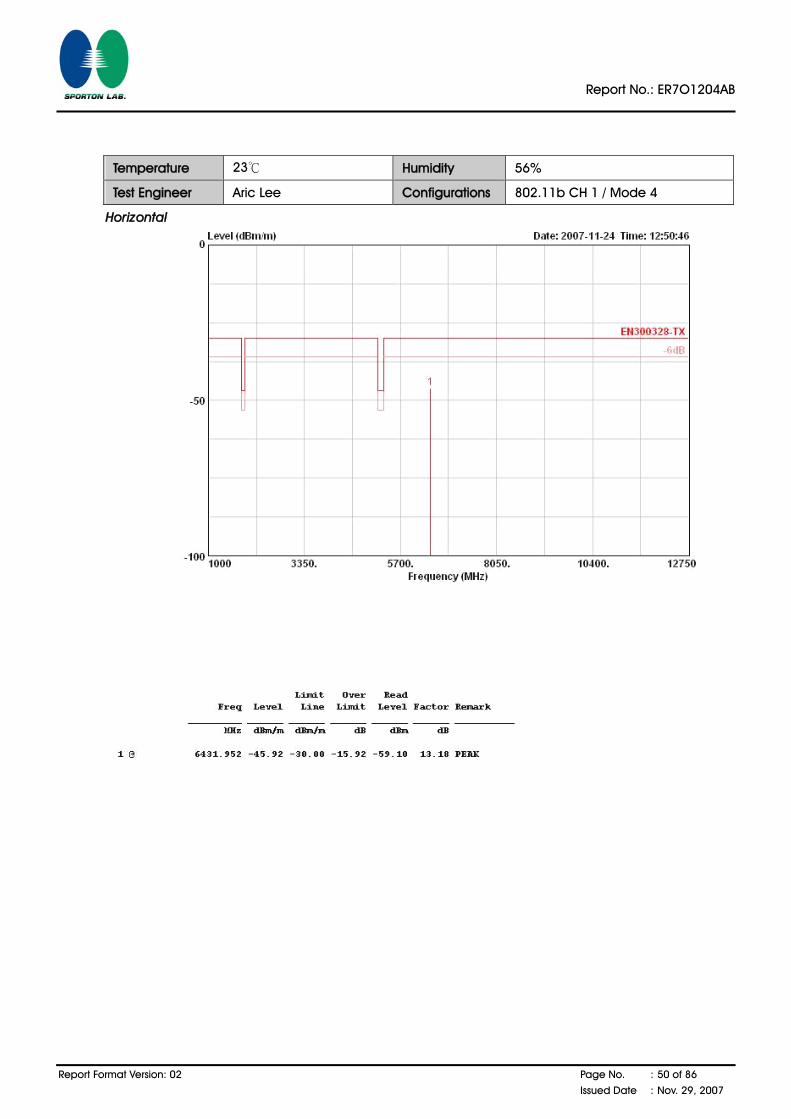
Temperature 23℃ Humidity 56%
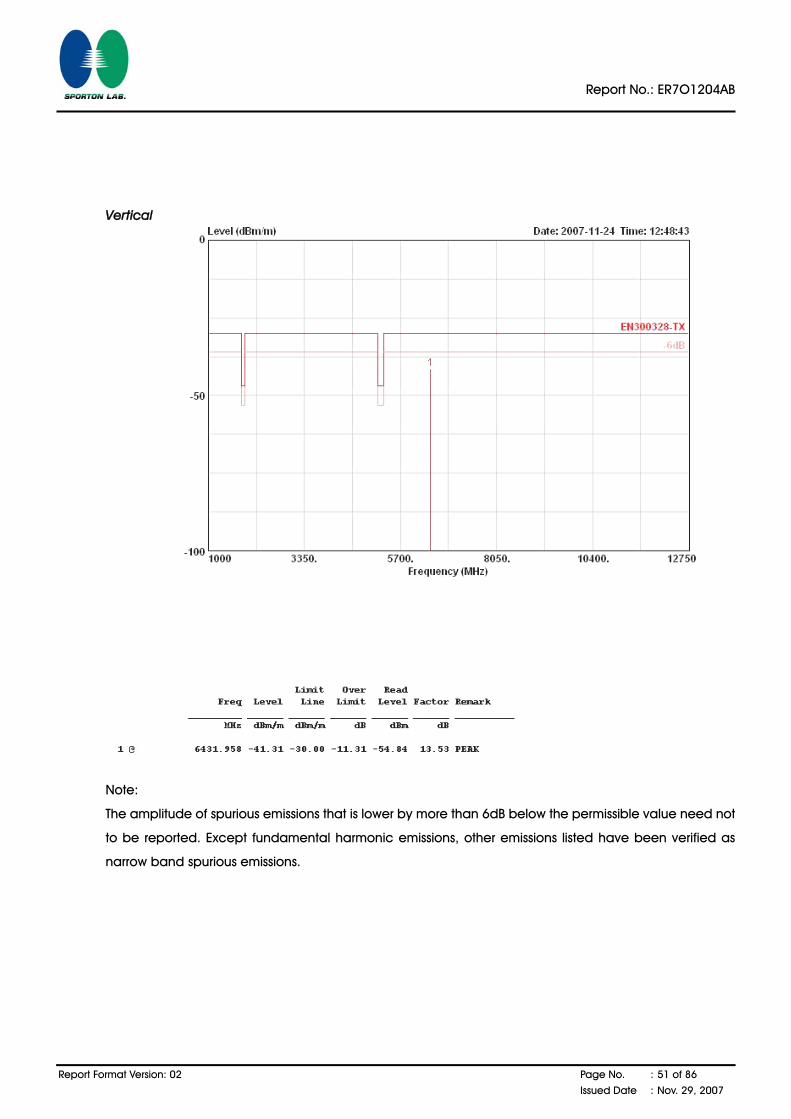
Test Engineer Aric Lee Configurations 802.11b CH 1 / Mode 4
Horizontal
Report No.: ER7O1204AB
Report Format Version: 02 Page No. : 51 of 86
Issued Date : Nov. 29, 2007
Vertical
Note:
The amplitude of spurious emissions that is lower by more than 6dB below the permissible value need not
to be reported. Except fundamental harmonic emissions, other emissions listed have been verified as
narrow band spurious emissions.
Report No.: ER7O1204AB
Report Format Version: 02 Page No. : 52 of 86
Issued Date : Nov. 29, 2007
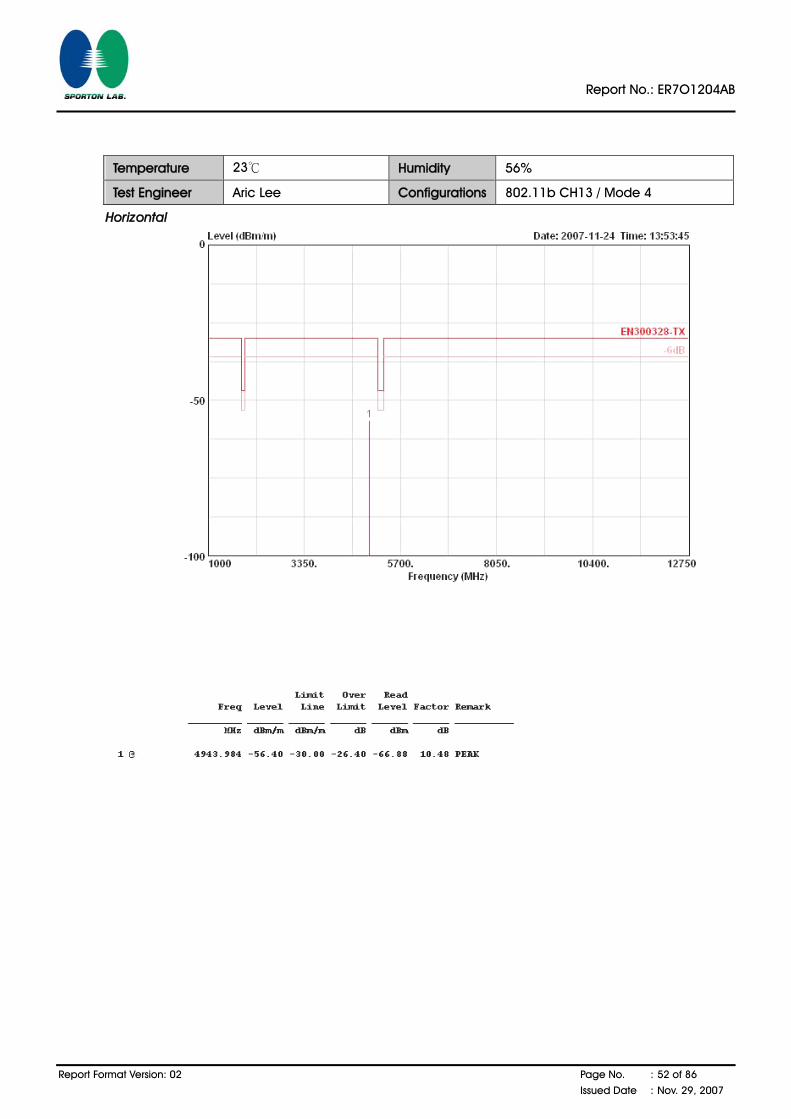
Temperature 23℃ Humidity 56%
Test Engineer Aric Lee Configurations 802.11b CH13 / Mode 4
Horizontal
Report No.: ER7O1204AB
Report Format Version: 02 Page No. : 53 of 86
Issued Date : Nov. 29, 2007
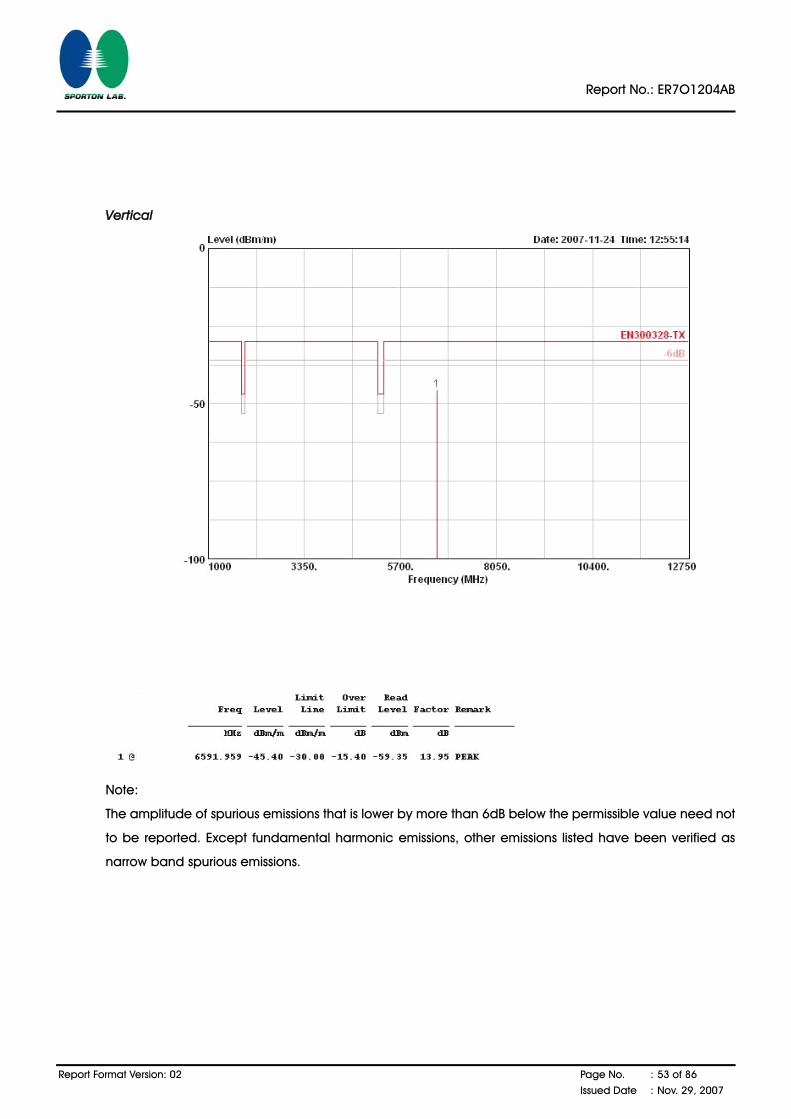
Vertical
Note:
The amplitude of spurious emissions that is lower by more than 6dB below the permissible value need not
to be reported. Except fundamental harmonic emissions, other emissions listed have been verified as
narrow band spurious emissions.
Report No.: ER7O1204AB
Report Format Version: 02 Page No. : 54 of 86
Issued Date : Nov. 29, 2007
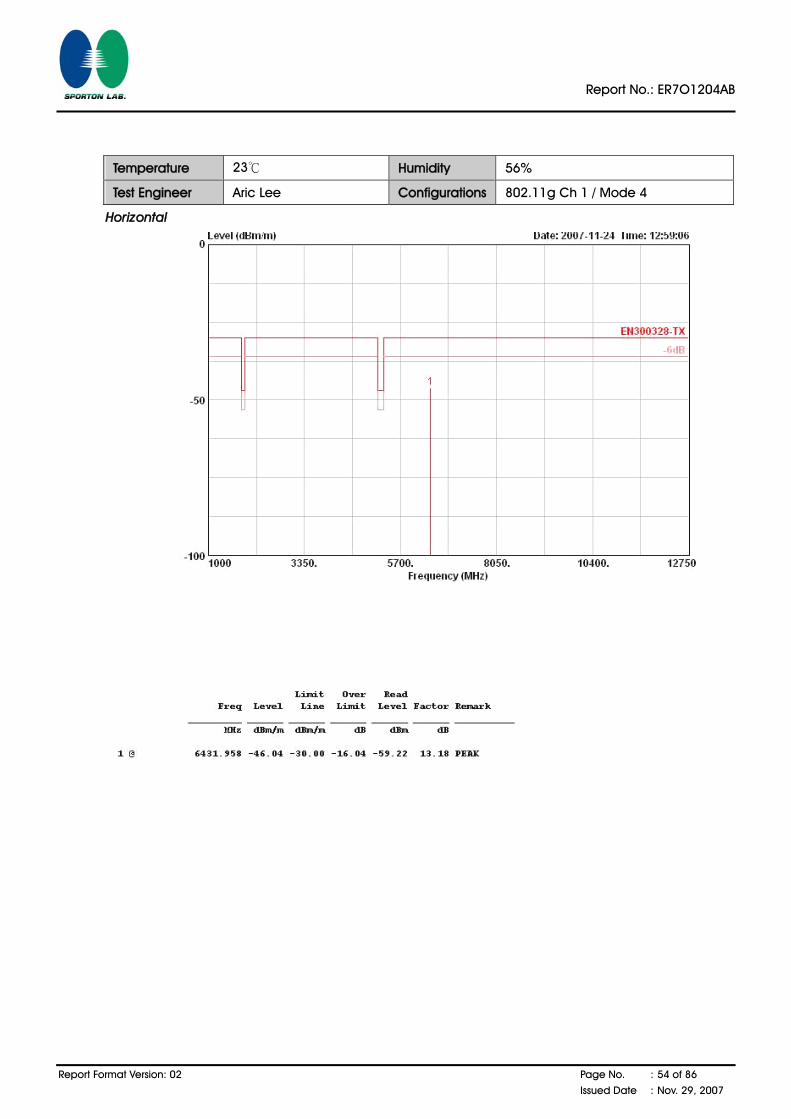
Temperature 23℃ Humidity 56%
Test Engineer Aric Lee Configurations 802.11g Ch 1 / Mode 4
Horizontal
Report No.: ER7O1204AB
Report Format Version: 02 Page No. : 55 of 86
Issued Date : Nov. 29, 2007
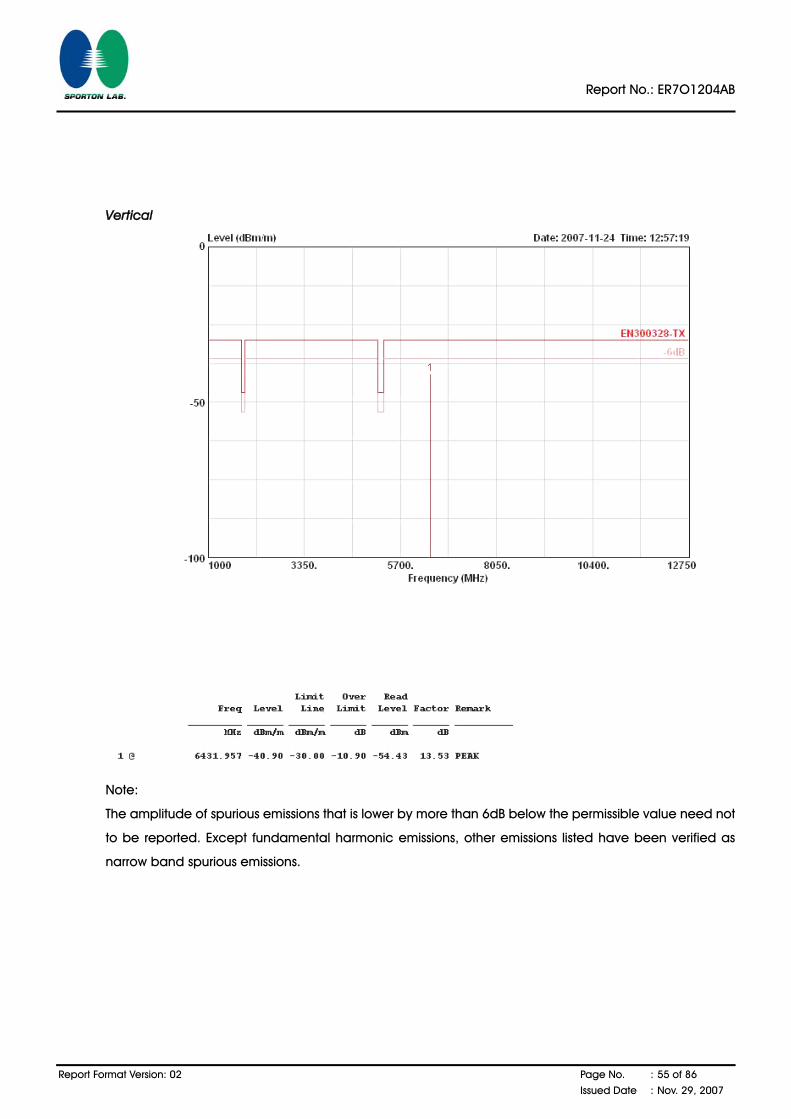
Vertical
Note:
The amplitude of spurious emissions that is lower by more than 6dB below the permissible value need not
to be reported. Except fundamental harmonic emissions, other emissions listed have been verified as
narrow band spurious emissions.
Report No.: ER7O1204AB
Report Format Version: 02 Page No. : 56 of 86
Issued Date : Nov. 29, 2007
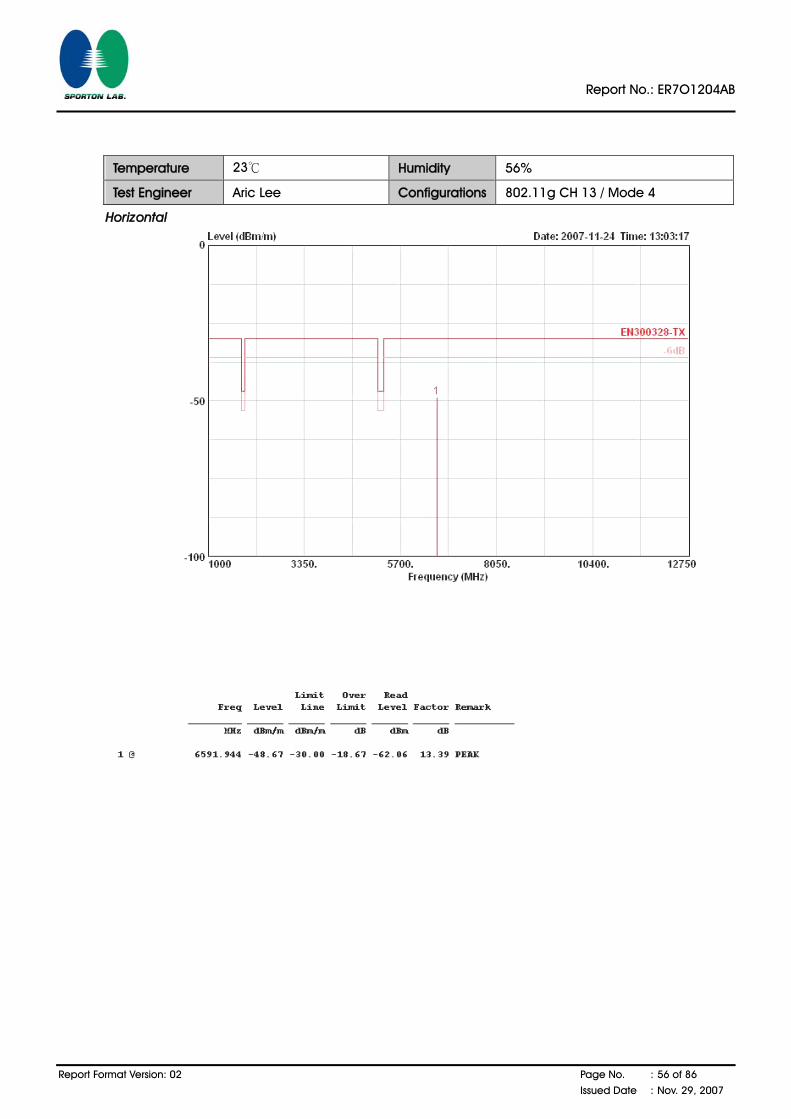
Temperature 23℃ Humidity 56%
Test Engineer Aric Lee Configurations 802.11g CH 13 / Mode 4
Horizontal

Report No.: ER7O1204AB
Report Format Version: 02 Page No. : 57 of 86
Issued Date : Nov. 29, 2007
Vertical
Note:
The amplitude of spurious emissions that is lower by more than 6dB below the permissible value need not
to be reported. Except fundamental harmonic emissions, other emissions listed have been verified as
narrow band spurious emissions.
Report No.: ER7O1204AB
Report Format Version: 02 Page No. : 58 of 86
Issued Date : Nov. 29, 2007
4.5. Receiver Spurious Emissions Measurement
4.5.1. Limit
Receiver spurious emissions are emissions at any frequency when the equipment is in received mode.
The spurious emissions of the reviver shall not exceed the values in tables 1 and 2 in the indicated bands.
Table 1 Receiver limits for narrowband spurious emissions
Frequency Range (MHz) Limit (dBm)
30~1000 -57
1000~12750 -47
Table 2 Receiver limits for wideband spurious emissions
Frequency Range (MHz) Limit (dBm)
30~1000 -107
1000~12750 -97
4.5.2. Measuring Instruments and Setting
Please refer to section 5 of equipments list in this report. The following table is the setting of the spectrum
analyzer.
Spectrum Analyzer Setting
Attenuation Auto
Start Frequency 30 MHz
Stop Frequency 12750 MHz
Detector Positive Peak
Span 100 MHz
Sweep Time 1s
RB / VB 100 kHz / 30 kHz
4.5.3. Test Procedures
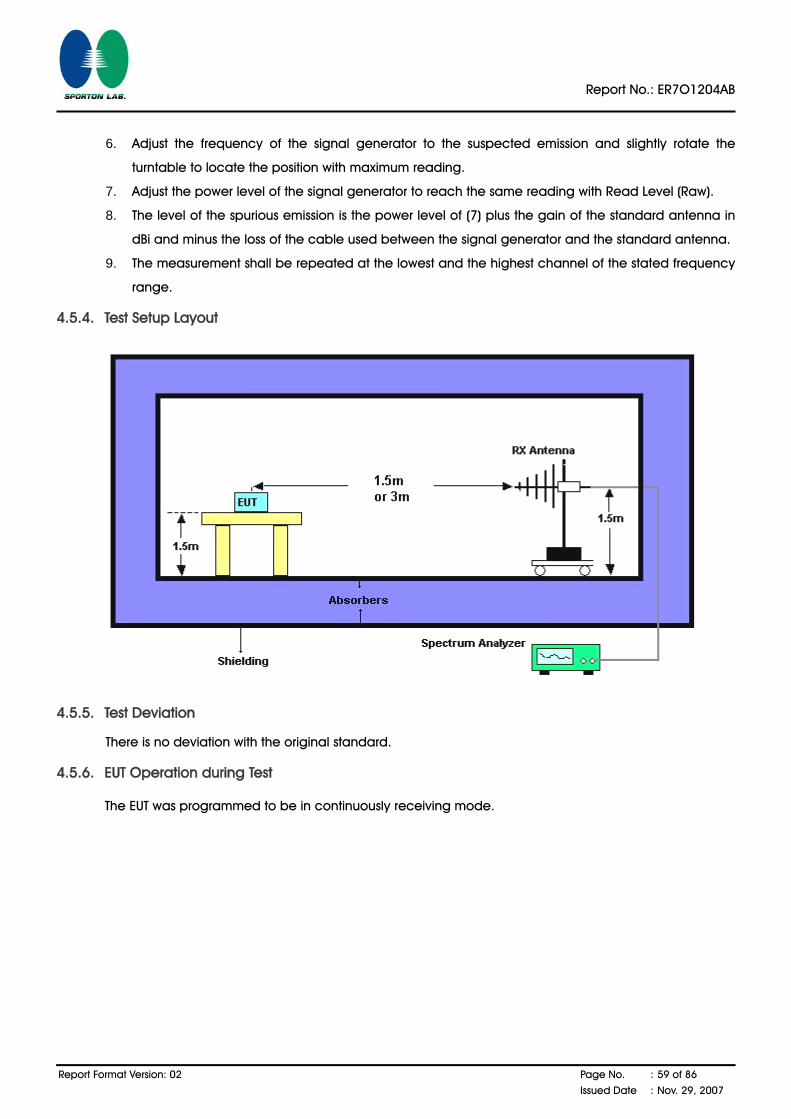
1. The EUT was placed on the top of the turntable in fully anechoic chamber.
2. The test shall be made in the transmitting mode. The turntable was rotated by 360 degrees to
determine the position of the highest radiation.
3. For 30~1000MHz spurious emissions measurement, the broad band bi-log receiving antenna was
placed 3 meters far away from the turntable. For 1~12.75GHz measurement, the receiving Horn
antenna was placed 1.5 meters far away from the turntable.
4. The broadband receiving antenna was fixed on the same height with the EUT to find each
suspected emissions of both horizontal and vertical polarization. Each recorded suspected value is
indicated as Read Level (Raw).
5. Replace the EUT by standard antenna and feed the RF port by signal generator.
Report No.: ER7O1204AB
Report Format Version: 02 Page No. : 59 of 86
Issued Date : Nov. 29, 2007
6. Adjust the frequency of the signal generator to the suspected emission and slightly rotate the
turntable to locate the position with maximum reading.
7. Adjust the power level of the signal generator to reach the same reading with Read Level (Raw).
8. The level of the spurious emission is the power level of (7) plus the gain of the standard antenna in
dBi and minus the loss of the cable used between the signal generator and the standard antenna.
9. The measurement shall be repeated at the lowest and the highest channel of the stated frequency
range.
4.5.4. Test Setup Layout
4.5.5. Test Deviation
There is no deviation with the original standard.
4.5.6. EUT Operation during Test
The EUT was programmed to be in continuously receiving mode.
Report No.: ER7O1204AB
Report Format Version: 02 Page No. : 60 of 86
Issued Date : Nov. 29, 2007
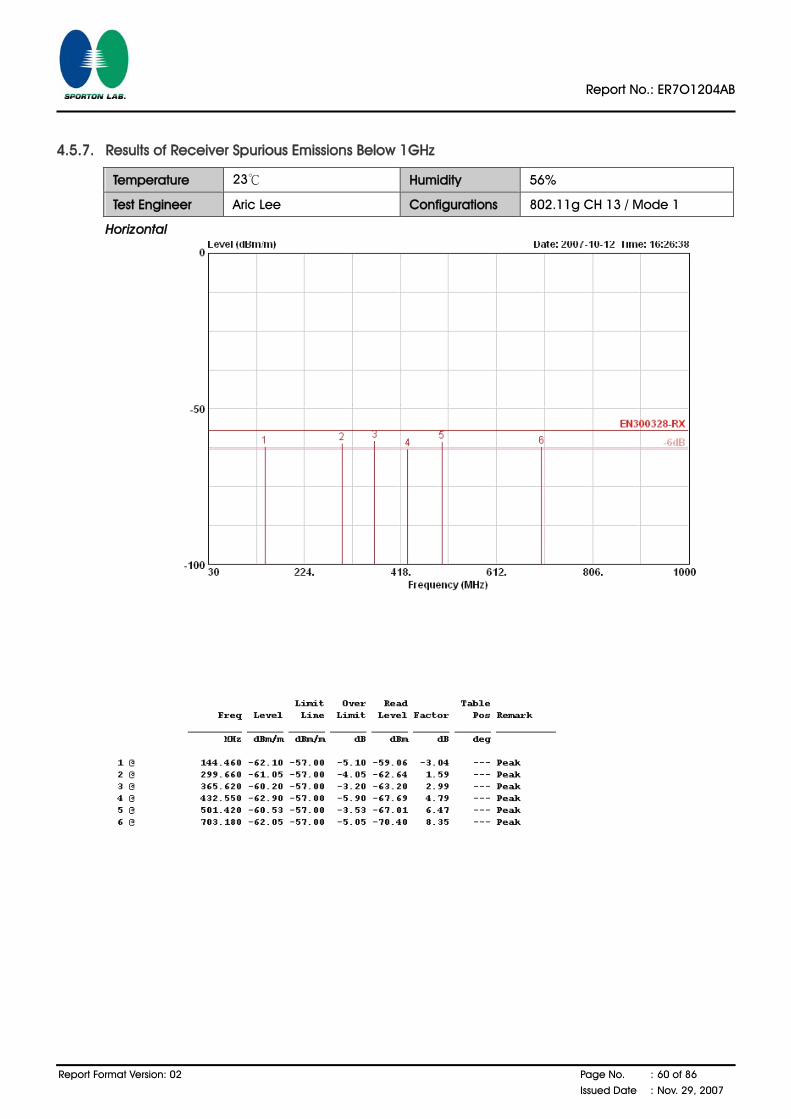
4.5.7. Results of Receiver Spurious Emissions Below 1GHz
Temperature 23℃ Humidity 56%
Test Engineer Aric Lee Configurations 802.11g CH 13 / Mode 1
Horizontal
Report No.: ER7O1204AB
Report Format Version: 02 Page No. : 61 of 86
Issued Date : Nov. 29, 2007
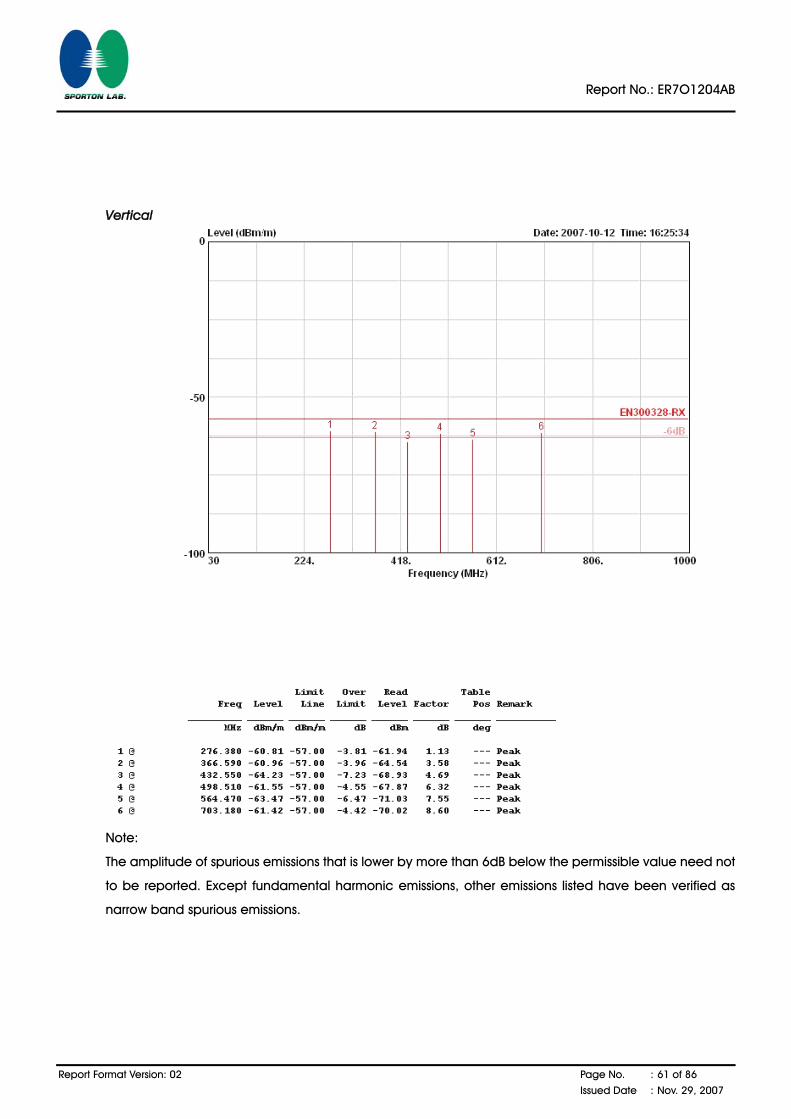
Vertical
Note:
The amplitude of spurious emissions that is lower by more than 6dB below the permissible value need not
to be reported. Except fundamental harmonic emissions, other emissions listed have been verified as
narrow band spurious emissions.
Report No.: ER7O1204AB
Report Format Version: 02 Page No. : 62 of 86
Issued Date : Nov. 29, 2007
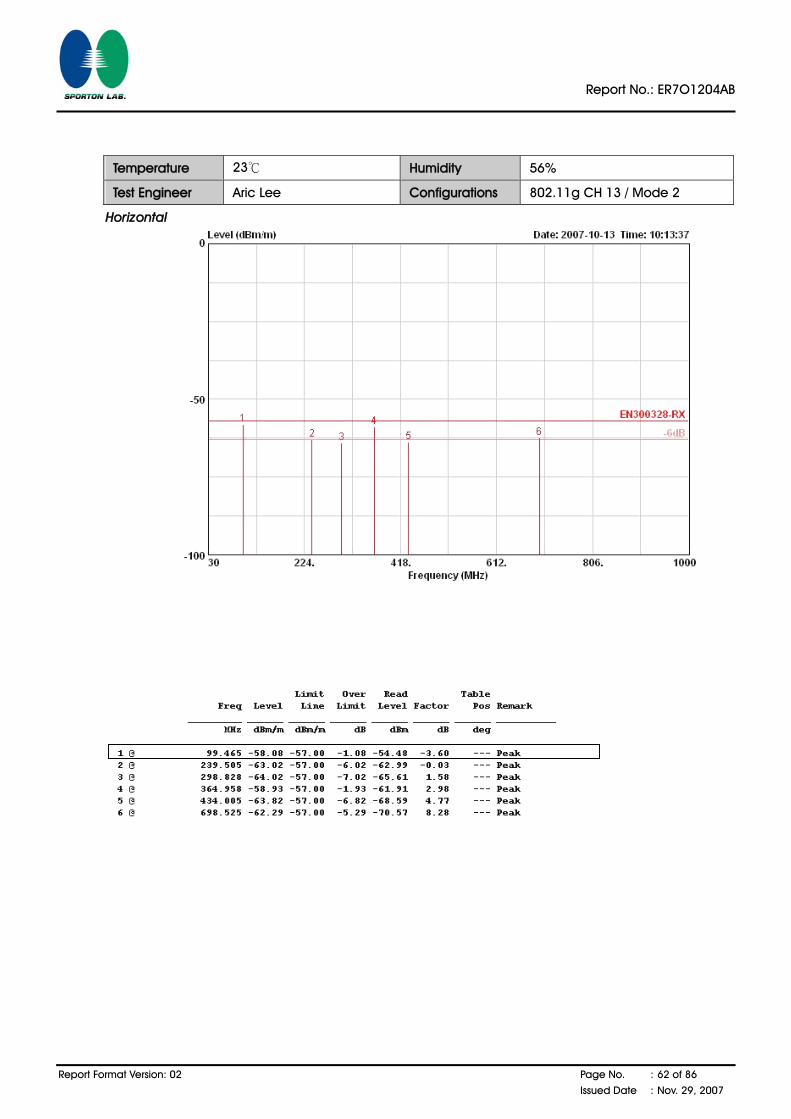
Temperature 23℃ Humidity 56%
Test Engineer Aric Lee Configurations 802.11g CH 13 / Mode 2
Horizontal
Report No.: ER7O1204AB
Report Format Version: 02 Page No. : 63 of 86
Issued Date : Nov. 29, 2007
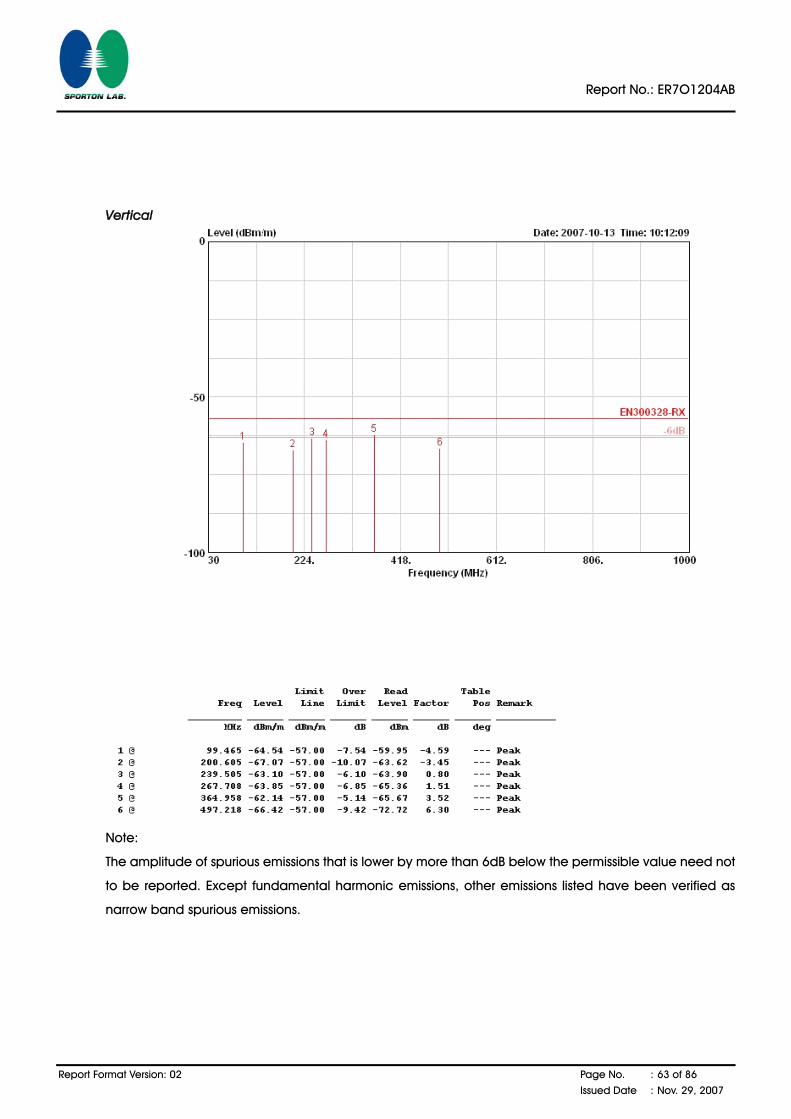
Vertical
Note:
The amplitude of spurious emissions that is lower by more than 6dB below the permissible value need not
to be reported. Except fundamental harmonic emissions, other emissions listed have been verified as
narrow band spurious emissions.

Report No.: ER7O1204AB
Report Format Version: 02 Page No. : 64 of 86
Issued Date : Nov. 29, 2007
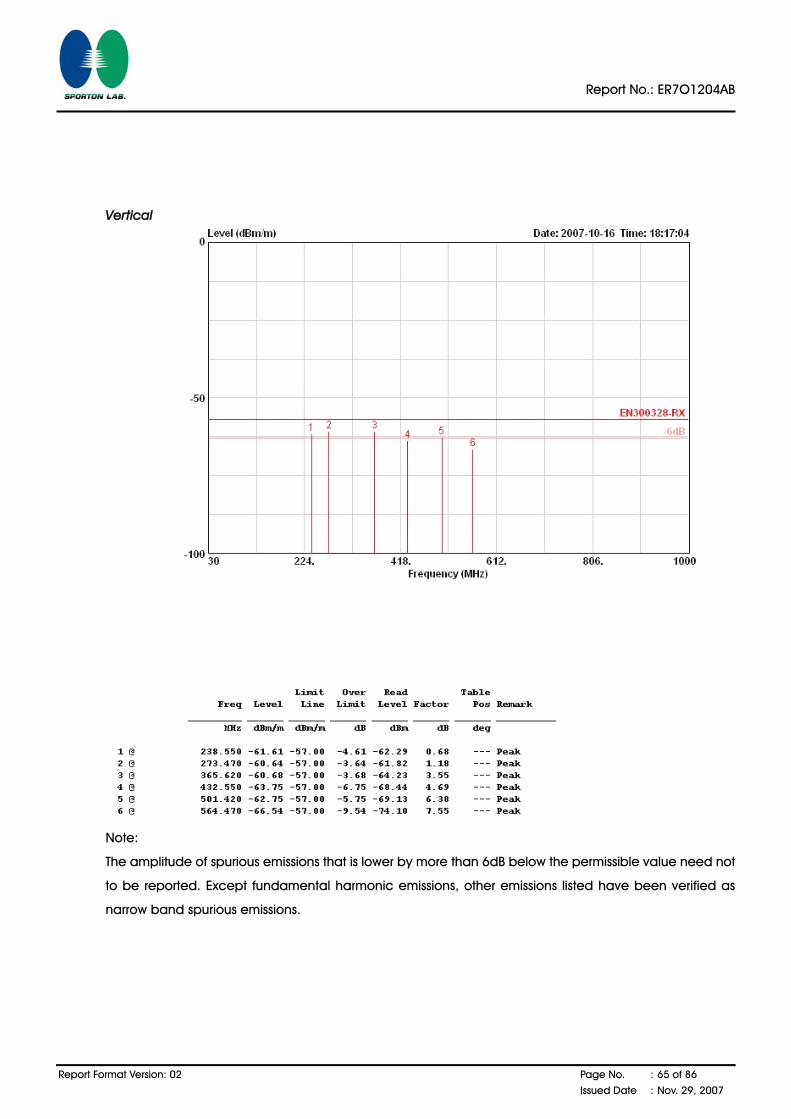
Temperature 23℃ Humidity 56%
Test Engineer Aric Lee Configurations 802.11g CH 13 / Mode 3
Horizontal
Report No.: ER7O1204AB
Report Format Version: 02 Page No. : 65 of 86
Issued Date : Nov. 29, 2007
Vertical
Note:
The amplitude of spurious emissions that is lower by more than 6dB below the permissible value need not
to be reported. Except fundamental harmonic emissions, other emissions listed have been verified as
narrow band spurious emissions.
Report No.: ER7O1204AB
Report Format Version: 02 Page No. : 66 of 86
Issued Date : Nov. 29, 2007
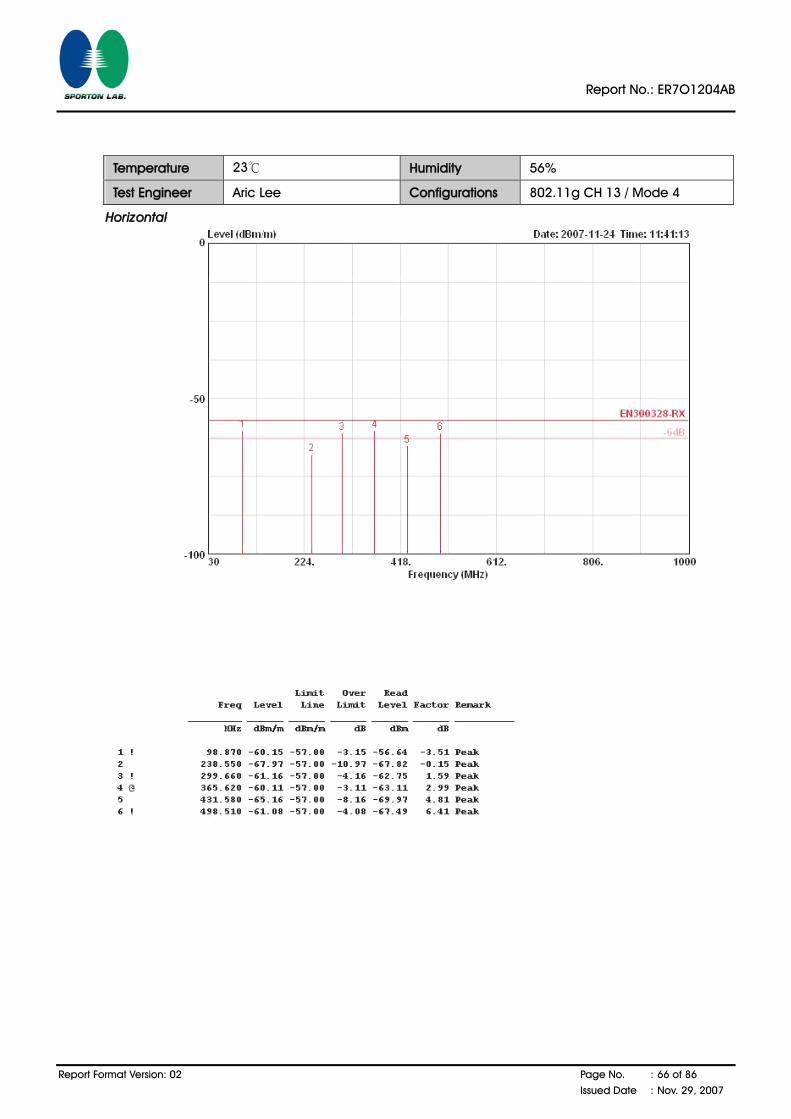
Temperature 23℃ Humidity 56%
Test Engineer Aric Lee Configurations 802.11g CH 13 / Mode 4
Horizontal
Report No.: ER7O1204AB
Report Format Version: 02 Page No. : 67 of 86
Issued Date : Nov. 29, 2007
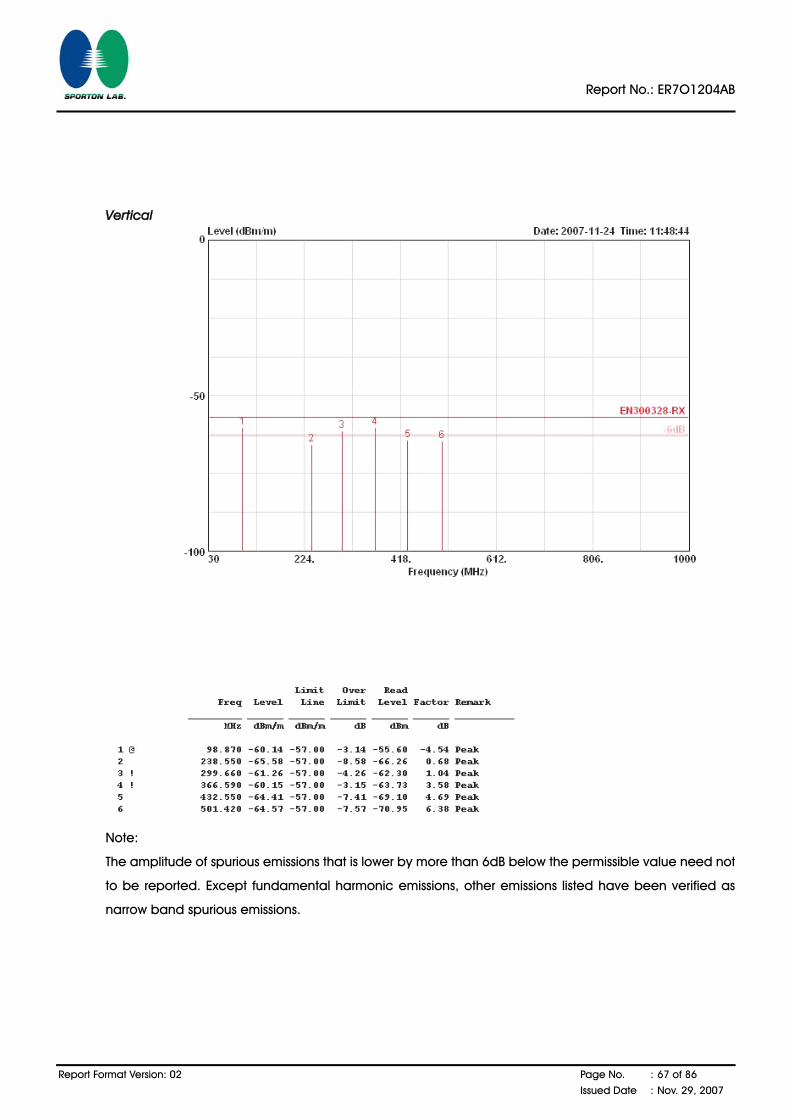
Vertical
Note:
The amplitude of spurious emissions that is lower by more than 6dB below the permissible value need not
to be reported. Except fundamental harmonic emissions, other emissions listed have been verified as
narrow band spurious emissions.
Report No.: ER7O1204AB
Report Format Version: 02 Page No. : 68 of 86
Issued Date : Nov. 29, 2007
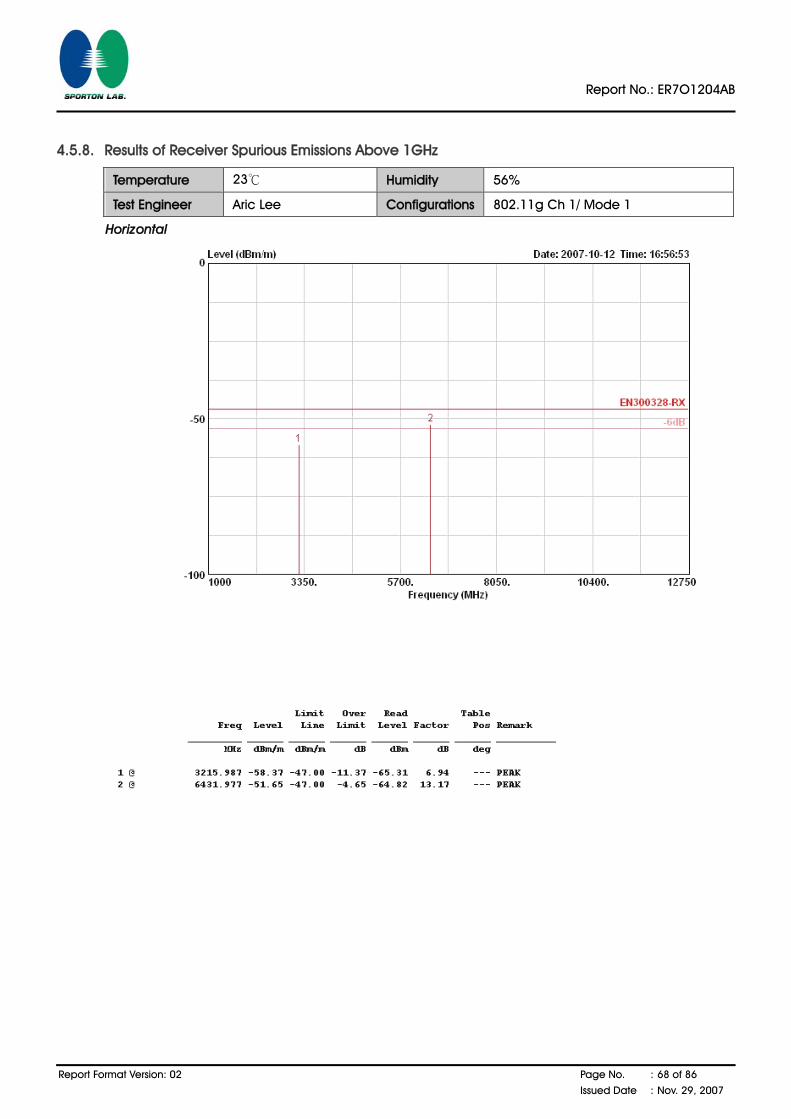
4.5.8. Results of Receiver Spurious Emissions Above 1GHz
Temperature 23℃ Humidity 56%
Test Engineer Aric Lee Configurations 802.11g Ch 1/ Mode 1
Horizontal

Report No.: ER7O1204AB
Report Format Version: 02 Page No. : 69 of 86
Issued Date : Nov. 29, 2007
Vertical
Note:
The amplitude of spurious emissions that is lower by more than 6dB below the permissible value need not
to be reported. Except fundamental harmonic emissions, other emissions listed have been verified as
narrow band spurious emissions.

Report No.: ER7O1204AB
Report Format Version: 02 Page No. : 70 of 86
Issued Date : Nov. 29, 2007
Temperature 24℃ Humidity 59%
Test Engineer Aric Lee Configurations 802.11g Ch 13 / Mode 1
Horizontal

Report No.: ER7O1204AB
Report Format Version: 02 Page No. : 71 of 86
Issued Date : Nov. 29, 2007
Vertical
Note:
The amplitude of spurious emissions that is lower by more than 6dB below the permissible value need not
to be reported. Except fundamental harmonic emissions, other emissions listed have been verified as
narrow band spurious emissions.
Report No.: ER7O1204AB
Report Format Version: 02 Page No. : 72 of 86
Issued Date : Nov. 29, 2007
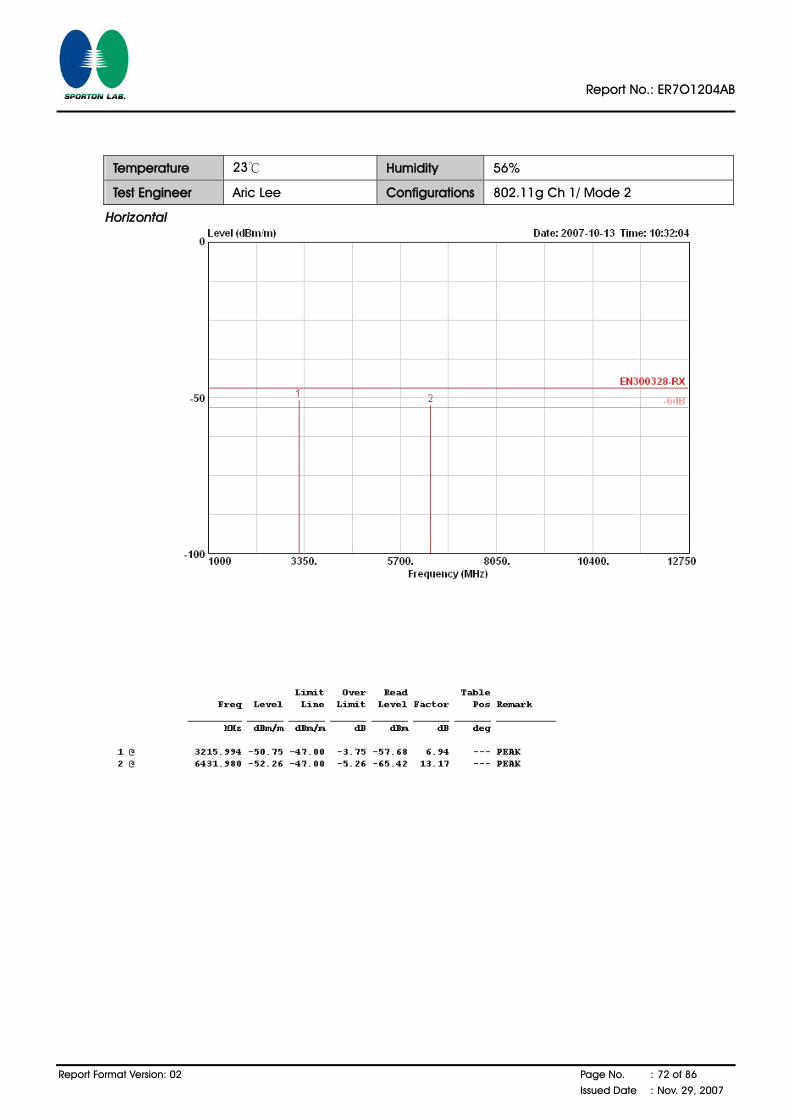
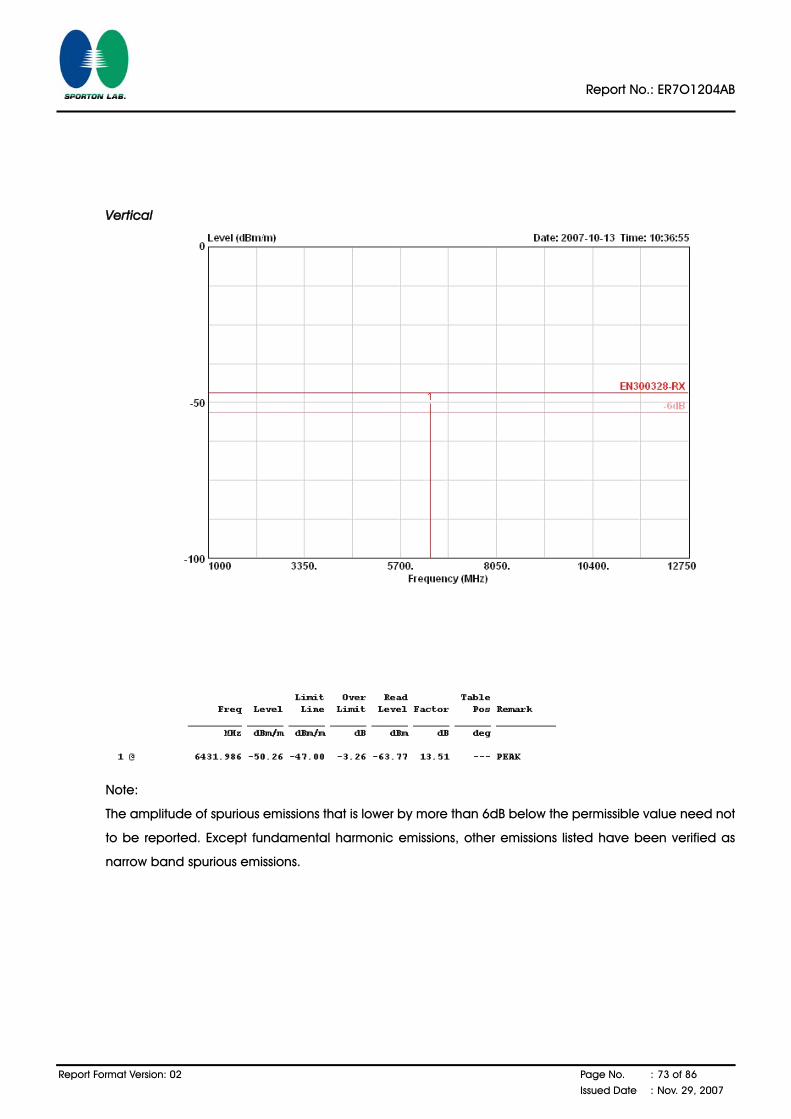
Temperature 23℃ Humidity 56%
Test Engineer Aric Lee Configurations 802.11g Ch 1/ Mode 2
Horizontal
Report No.: ER7O1204AB
Report Format Version: 02 Page No. : 73 of 86
Issued Date : Nov. 29, 2007
Vertical
Note:
The amplitude of spurious emissions that is lower by more than 6dB below the permissible value need not
to be reported. Except fundamental harmonic emissions, other emissions listed have been verified as
narrow band spurious emissions.
Report No.: ER7O1204AB
Report Format Version: 02 Page No. : 74 of 86
Issued Date : Nov. 29, 2007
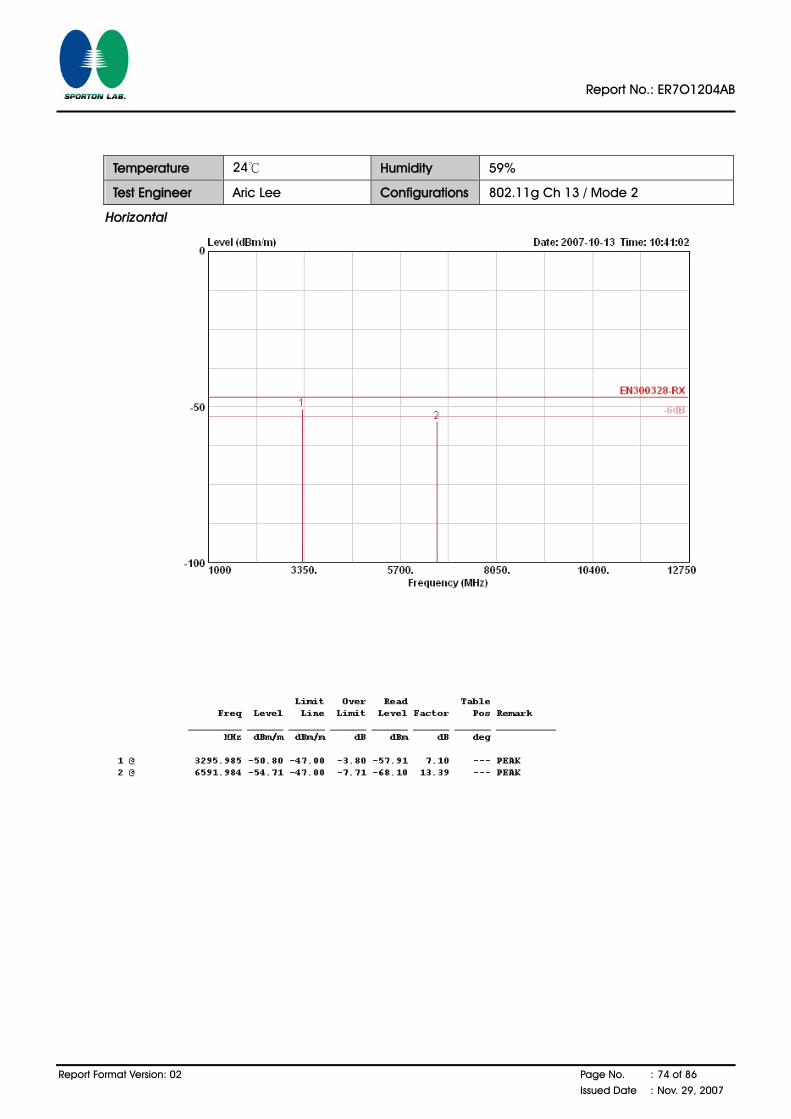
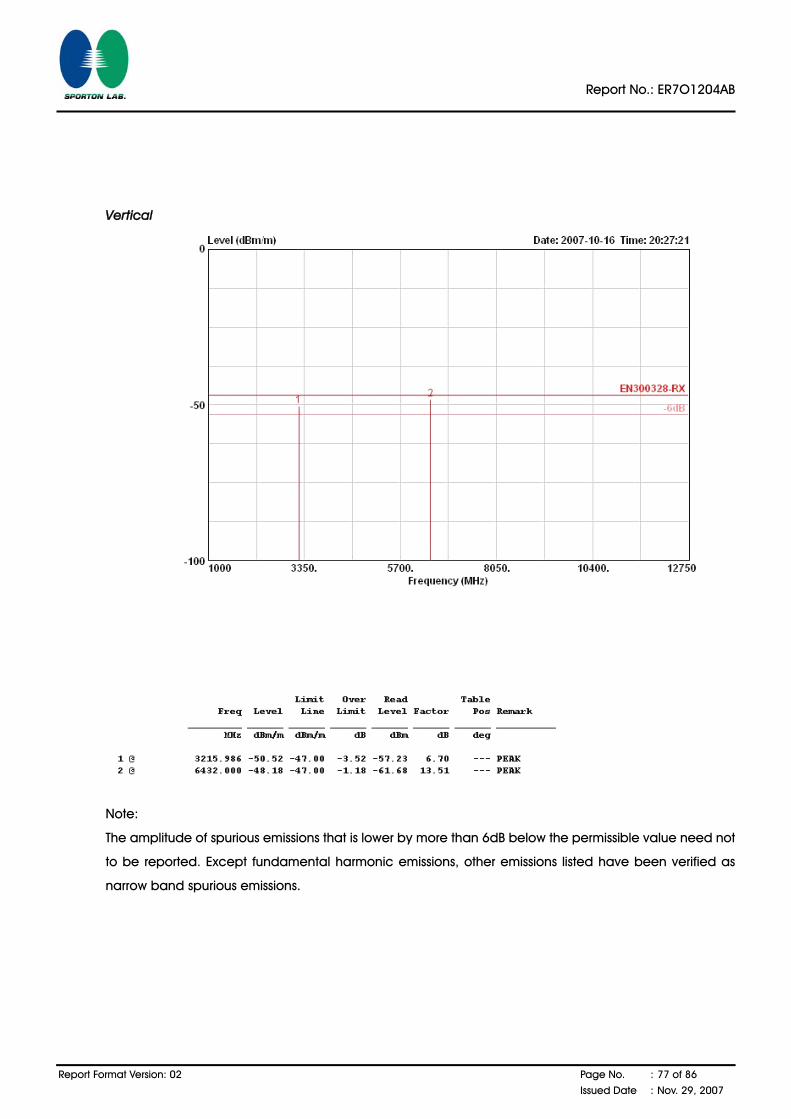
Temperature 24℃ Humidity 59%
Test Engineer Aric Lee Configurations 802.11g Ch 13 / Mode 2
Horizontal

Report No.: ER7O1204AB
Report Format Version: 02 Page No. : 75 of 86
Issued Date : Nov. 29, 2007
Vertical
Note:
The amplitude of spurious emissions that is lower by more than 6dB below the permissible value need not
to be reported. Except fundamental harmonic emissions, other emissions listed have been verified as
narrow band spurious emissions.

Report No.: ER7O1204AB
Report Format Version: 02 Page No. : 76 of 86
Issued Date : Nov. 29, 2007
Temperature 23℃ Humidity 56%
Test Engineer Aric Lee Configurations 802.11g Ch 1/ Mode 3
Horizontal
Report No.: ER7O1204AB
Report Format Version: 02 Page No. : 77 of 86
Issued Date : Nov. 29, 2007
Vertical
Note:
The amplitude of spurious emissions that is lower by more than 6dB below the permissible value need not
to be reported. Except fundamental harmonic emissions, other emissions listed have been verified as
narrow band spurious emissions.

Report No.: ER7O1204AB
Report Format Version: 02 Page No. : 78 of 86
Issued Date : Nov. 29, 2007
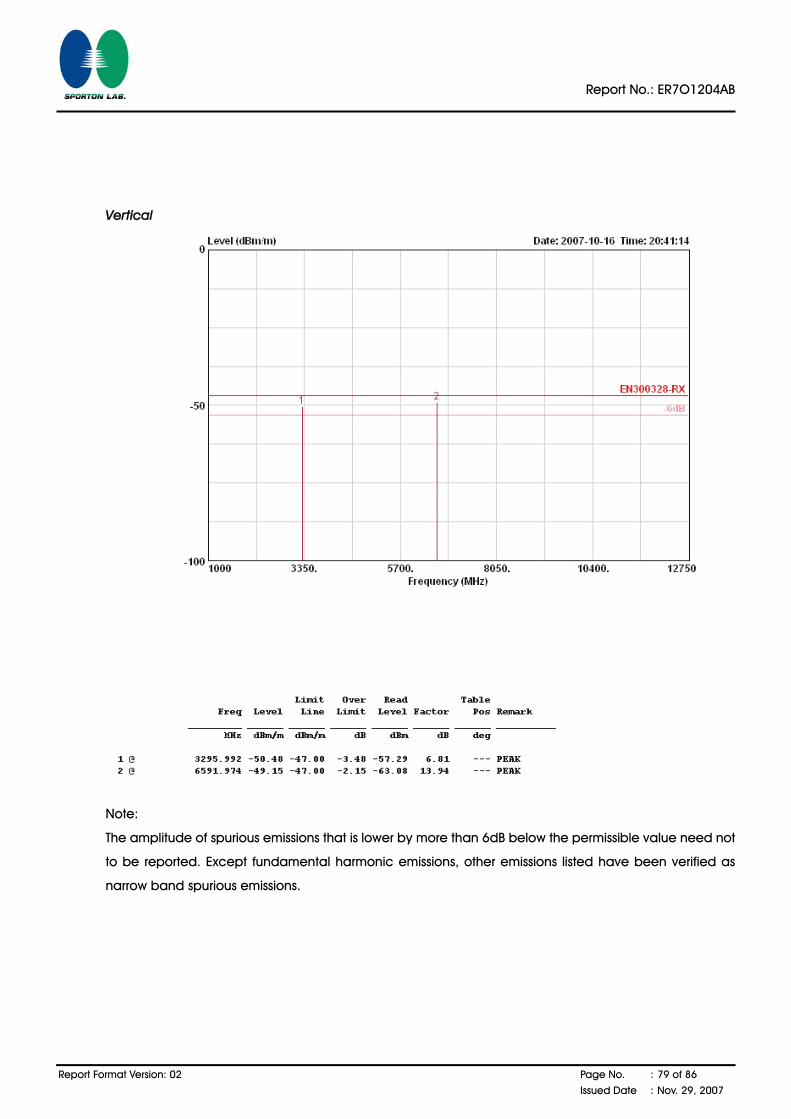
Temperature 24℃ Humidity 59%
Test Engineer Aric Lee Configurations 802.11g Ch 13 / Mode 3
Horizontal
Report No.: ER7O1204AB
Report Format Version: 02 Page No. : 79 of 86
Issued Date : Nov. 29, 2007
Vertical
Note:
The amplitude of spurious emissions that is lower by more than 6dB below the permissible value need not
to be reported. Except fundamental harmonic emissions, other emissions listed have been verified as
narrow band spurious emissions.
Report No.: ER7O1204AB
Report Format Version: 02 Page No. : 80 of 86
Issued Date : Nov. 29, 2007
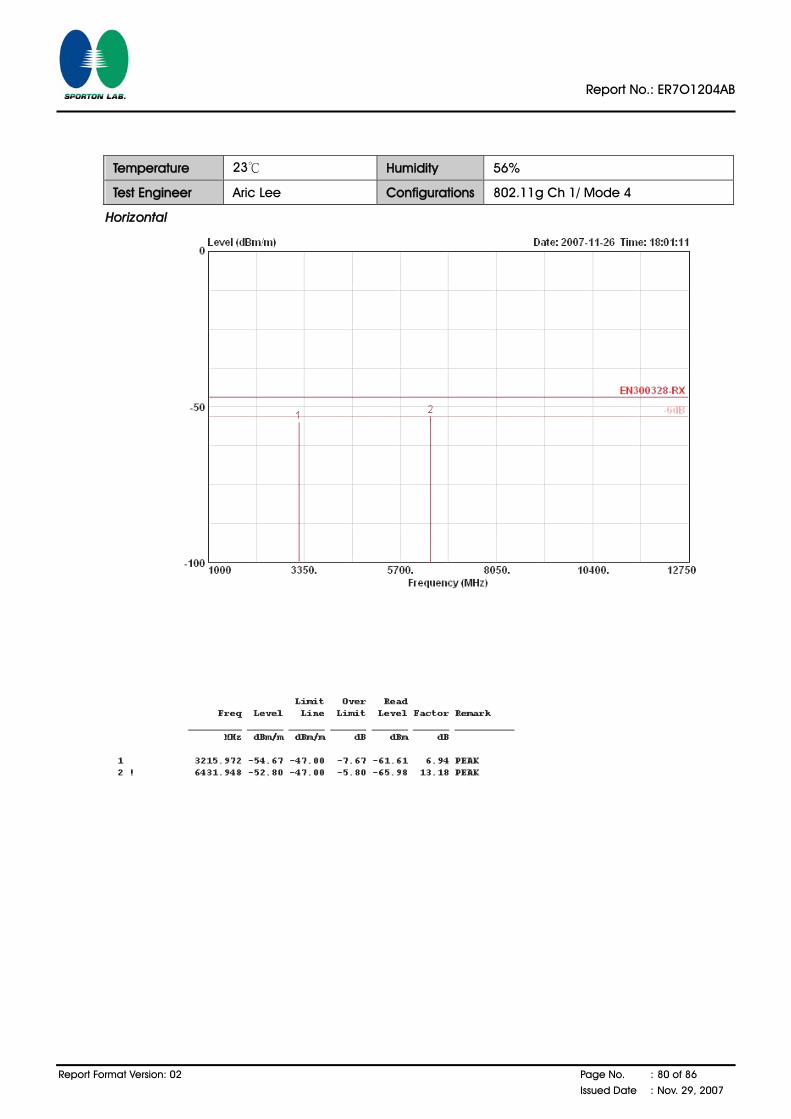
Temperature 23℃ Humidity 56%
Test Engineer Aric Lee Configurations 802.11g Ch 1/ Mode 4
Horizontal
Report No.: ER7O1204AB
Report Format Version: 02 Page No. : 81 of 86
Issued Date : Nov. 29, 2007
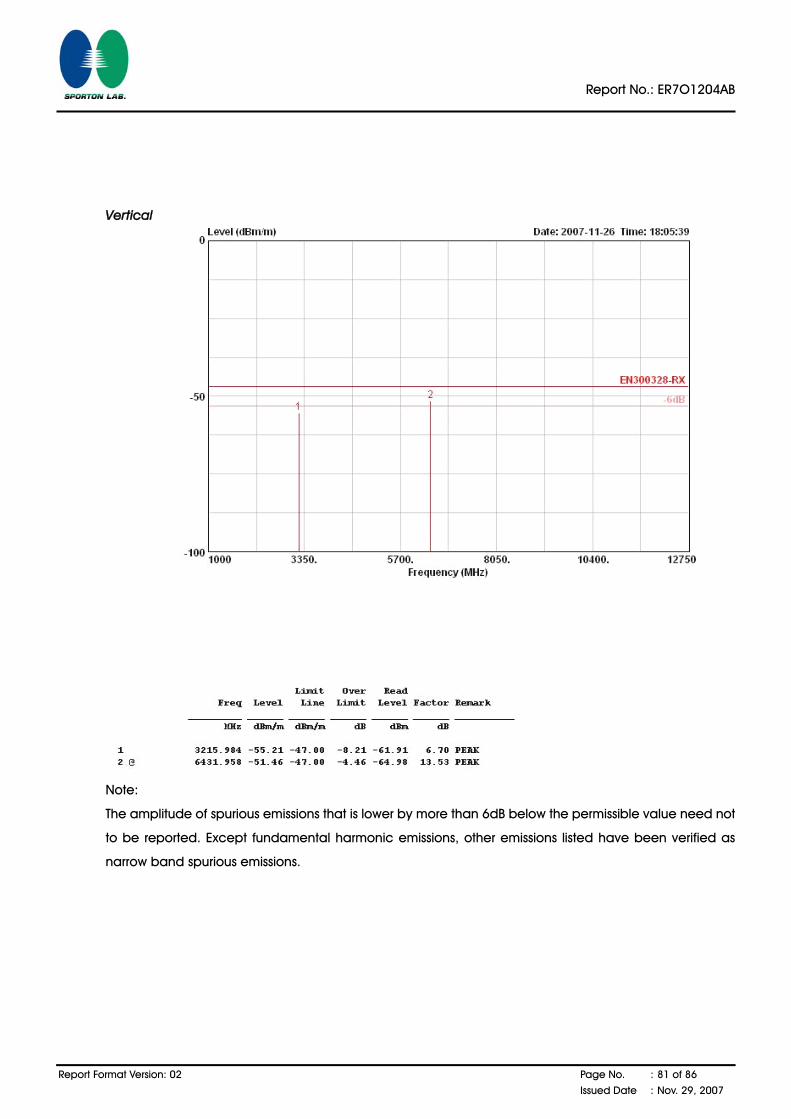
Vertical
Note:
The amplitude of spurious emissions that is lower by more than 6dB below the permissible value need not
to be reported. Except fundamental harmonic emissions, other emissions listed have been verified as
narrow band spurious emissions.
Report No.: ER7O1204AB
Report Format Version: 02 Page No. : 82 of 86
Issued Date : Nov. 29, 2007
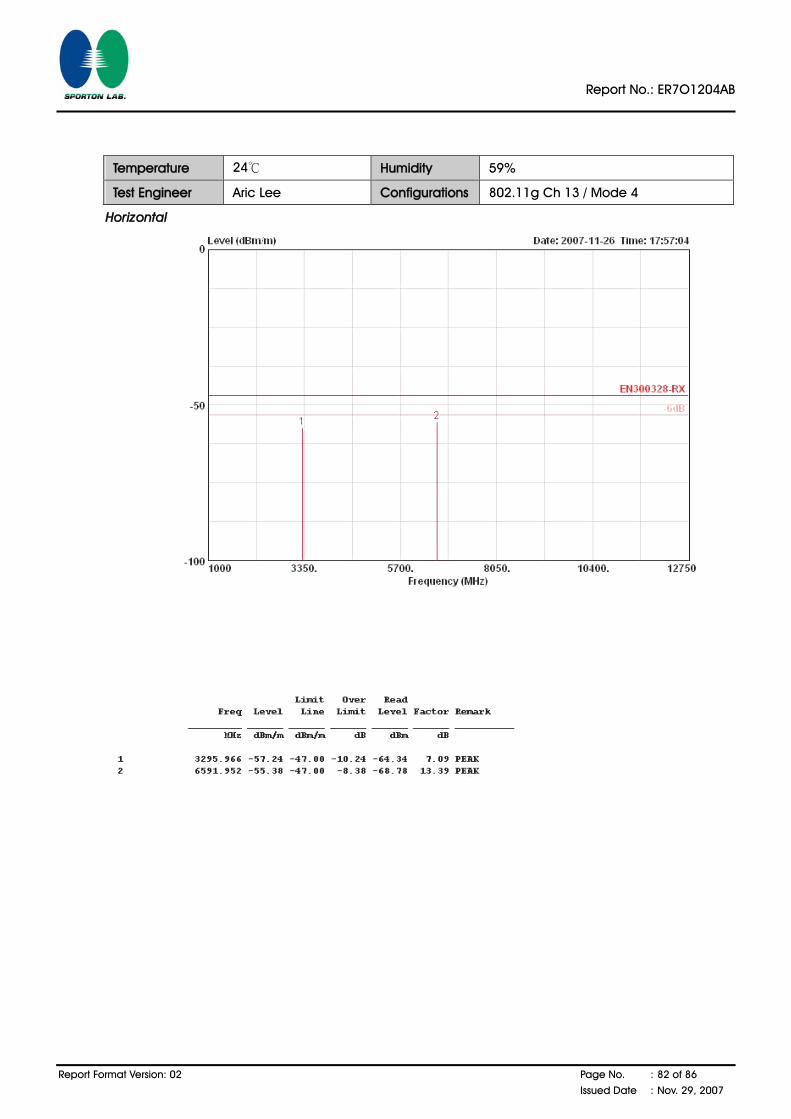
Temperature 24℃ Humidity 59%
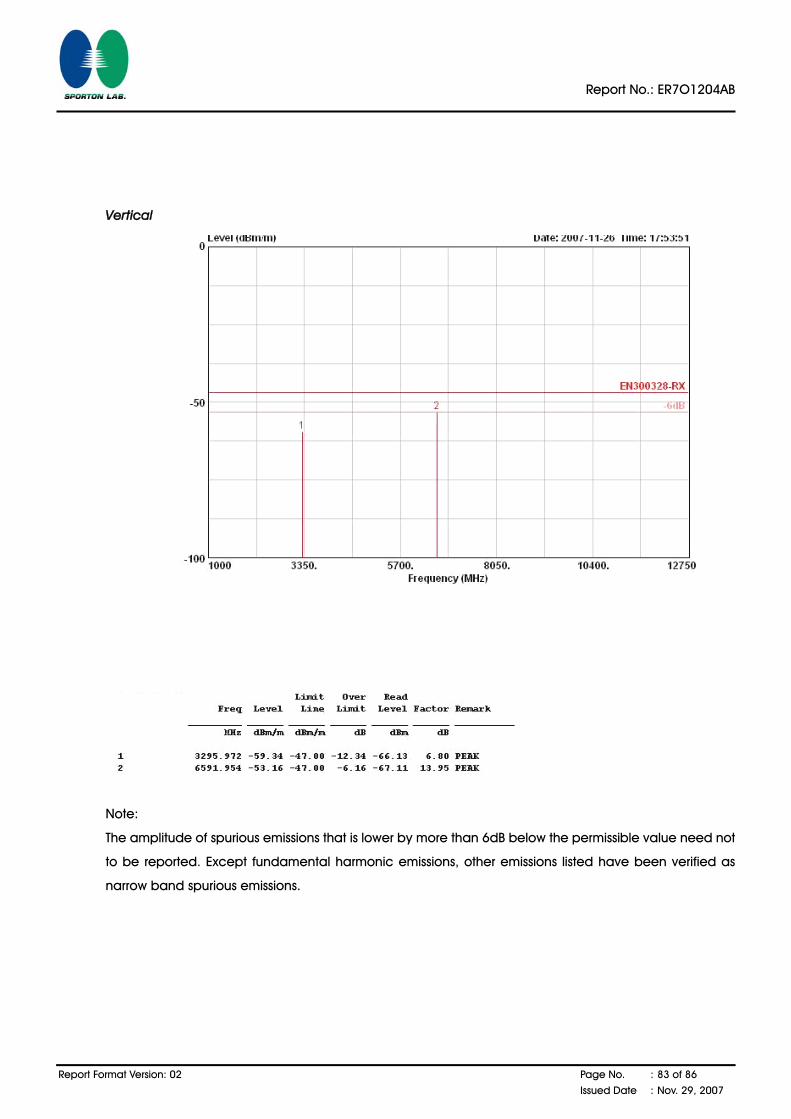
Test Engineer Aric Lee Configurations 802.11g Ch 13 / Mode 4
Horizontal
Report No.: ER7O1204AB
Report Format Version: 02 Page No. : 83 of 86
Issued Date : Nov. 29, 2007
Vertical
Note:
The amplitude of spurious emissions that is lower by more than 6dB below the permissible value need not
to be reported. Except fundamental harmonic emissions, other emissions listed have been verified as
narrow band spurious emissions.
Report No.: ER7O1204AB
Report Format Version: 02 Page No. : 84 of 86
Issued Date : Nov. 29, 2007
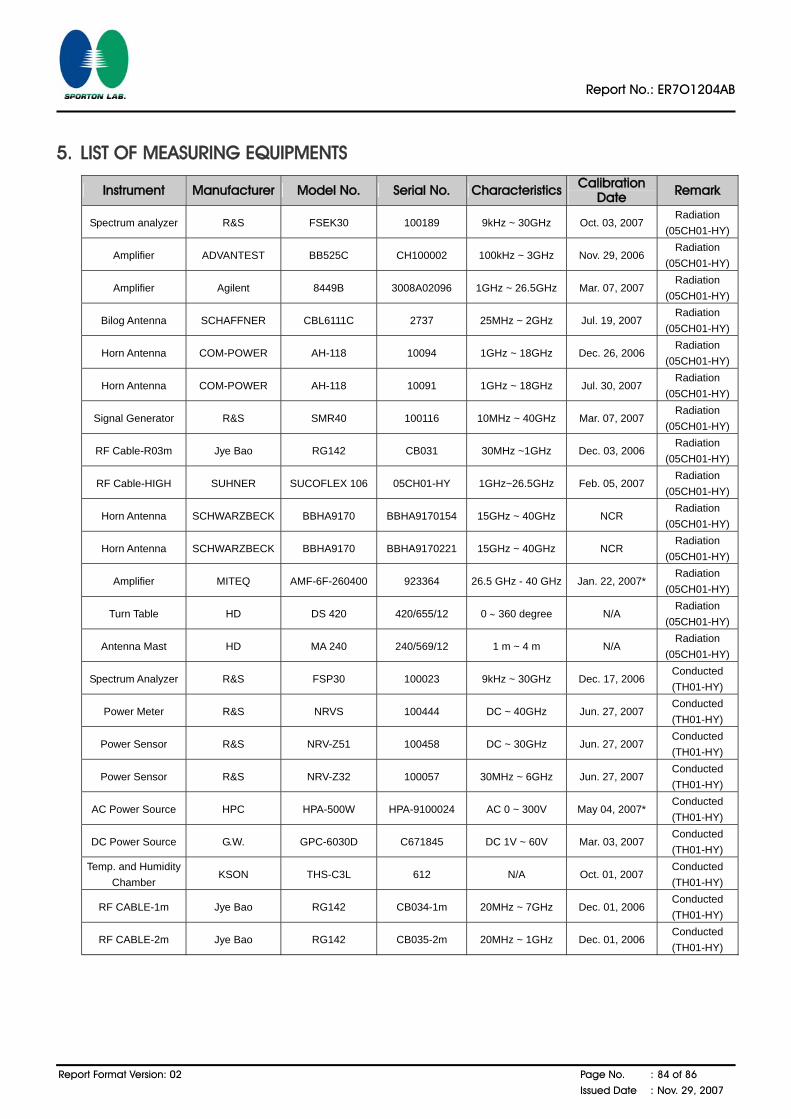
5. LIST OF MEASURING EQUIPMENTS
Instrument Manufacturer Model No. Serial No. Characteristics Calibration Date Remark
Spectrum analyzer R&S FSEK30 100189 9kHz ~ 30GHz Oct. 03, 2007 Radiation
(05CH01-HY)
Amplifier ADVANTEST BB525C CH100002 100kHz ~ 3GHz Nov. 29, 2006 Radiation
(05CH01-HY)
Amplifier Agilent 8449B 3008A02096 1GHz ~ 26.5GHz Mar. 07, 2007 Radiation
(05CH01-HY)
Bilog Antenna SCHAFFNER CBL6111C 2737 25MHz ~ 2GHz Jul. 19, 2007 Radiation
(05CH01-HY)
Horn Antenna COM-POWER AH-118 10094 1GHz ~ 18GHz Dec. 26, 2006 Radiation
(05CH01-HY)
Horn Antenna COM-POWER AH-118 10091 1GHz ~ 18GHz Jul. 30, 2007 Radiation
(05CH01-HY)
Signal Generator R&S SMR40 100116 10MHz ~ 40GHz Mar. 07, 2007 Radiation
(05CH01-HY)
RF Cable-R03m Jye Bao RG142 CB031 30MHz ~1GHz Dec. 03, 2006 Radiation
(05CH01-HY)
RF Cable-HIGH SUHNER SUCOFLEX 106 05CH01-HY 1GHz~26.5GHz Feb. 05, 2007 Radiation
(05CH01-HY)
Horn Antenna SCHWARZBECK BBHA9170 BBHA9170154 15GHz ~ 40GHz NCR Radiation
(05CH01-HY)
Horn Antenna SCHWARZBECK BBHA9170 BBHA9170221 15GHz ~ 40GHz NCR Radiation
(05CH01-HY)
Amplifier MITEQ AMF-6F-260400 923364 26.5 GHz - 40 GHz Jan. 22, 2007* Radiation
(05CH01-HY)
Turn Table HD DS 420 420/655/12 0 ∼ 360 degree N/A Radiation
(05CH01-HY)
Antenna Mast HD MA 240 240/569/12 1 m ~ 4 m N/A Radiation
(05CH01-HY)
Spectrum Analyzer R&S FSP30 100023 9kHz ~ 30GHz Dec. 17, 2006 Conducted (TH01-HY)
Power Meter R&S NRVS 100444 DC ~ 40GHz Jun. 27, 2007 Conducted (TH01-HY)
Power Sensor R&S NRV-Z51 100458 DC ~ 30GHz Jun. 27, 2007 Conducted (TH01-HY)
Power Sensor R&S NRV-Z32 100057 30MHz ~ 6GHz Jun. 27, 2007 Conducted (TH01-HY)
AC Power Source HPC HPA-500W HPA-9100024 AC 0 ~ 300V May 04, 2007* Conducted (TH01-HY)
DC Power Source G.W. GPC-6030D C671845 DC 1V ~ 60V Mar. 03, 2007 Conducted (TH01-HY)
Temp. and Humidity Chamber
KSON THS-C3L 612 N/A Oct. 01, 2007 Conducted (TH01-HY)
RF CABLE-1m Jye Bao RG142 CB034-1m 20MHz ~ 7GHz Dec. 01, 2006 Conducted (TH01-HY)
RF CABLE-2m Jye Bao RG142 CB035-2m 20MHz ~ 1GHz Dec. 01, 2006 Conducted (TH01-HY)
Report No.: ER7O1204AB
Report Format Version: 02 Page No. : 85 of 86
Issued Date : Nov. 29, 2007
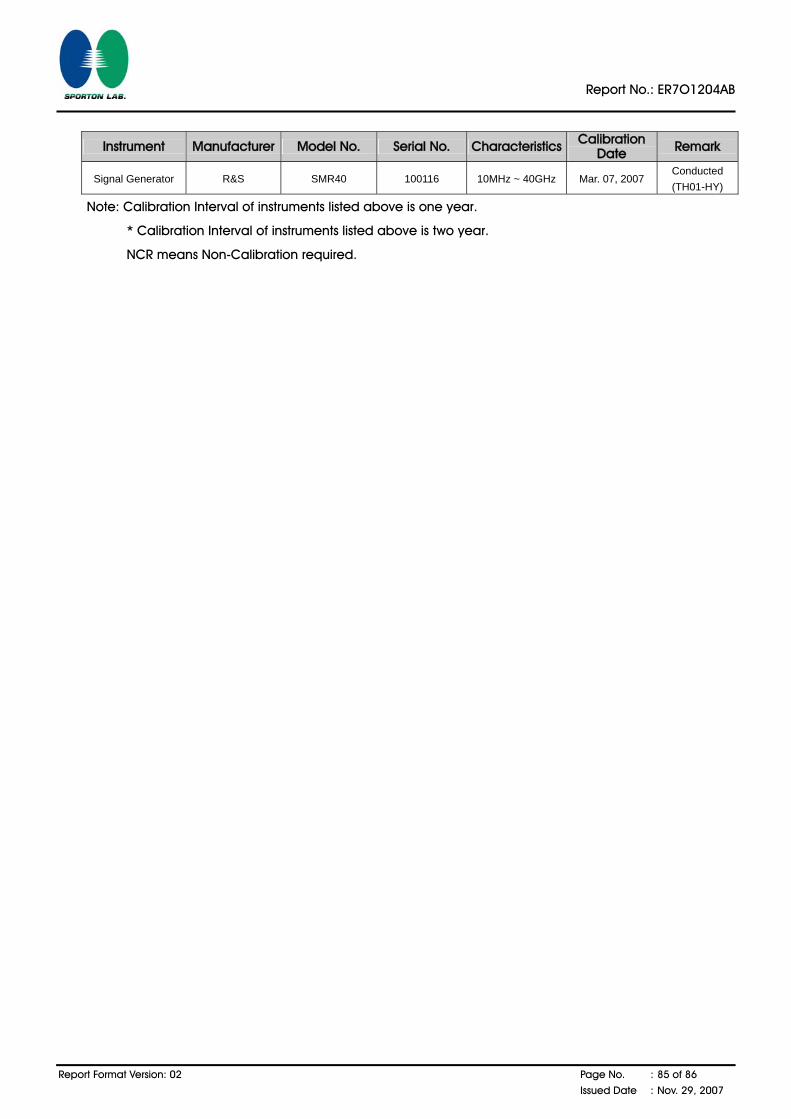
Instrument Manufacturer Model No. Serial No. Characteristics Calibration Date Remark
Signal Generator R&S SMR40 100116 10MHz ~ 40GHz Mar. 07, 2007 Conducted (TH01-HY)
Note: Calibration Interval of instruments listed above is one year.
* Calibration Interval of instruments listed above is two year.
NCR means Non-Calibration required.
Report No.: ER7O1204AB
Report Format Version: 02 Page No. : 86 of 86
Issued Date : Nov. 29, 2007
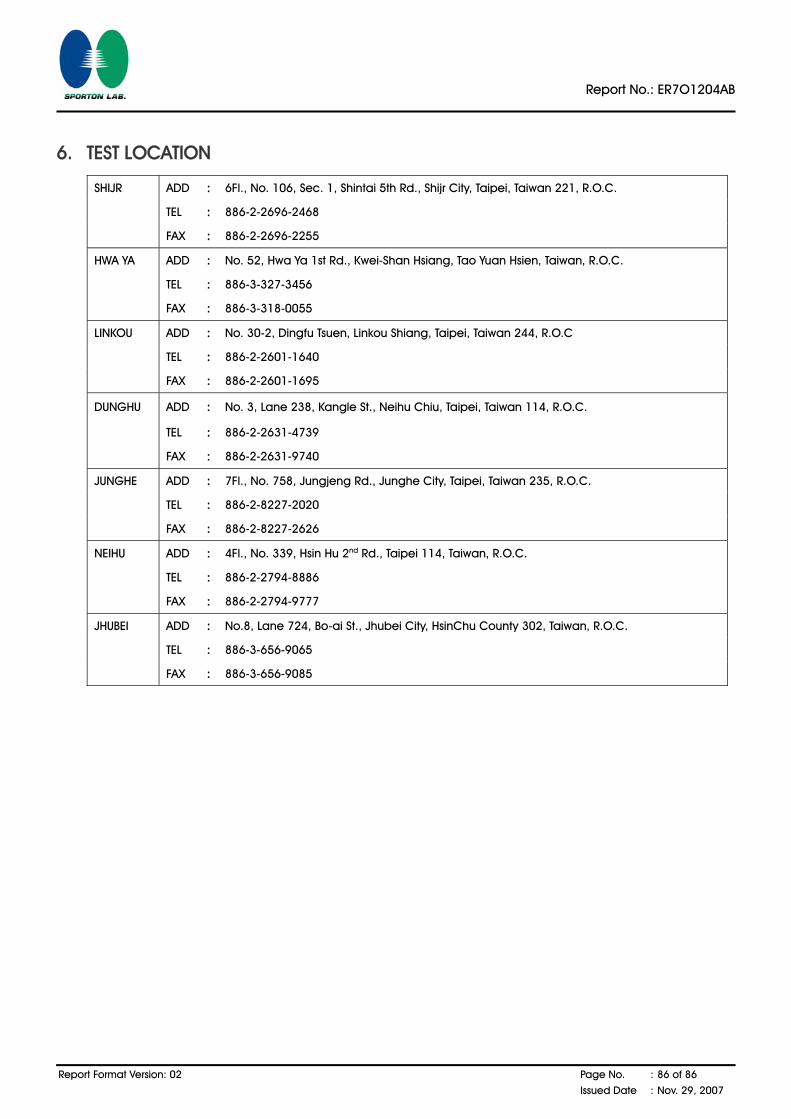
6. TEST LOCATION
SHIJR ADD : 6Fl., No. 106, Sec. 1, Shintai 5th Rd., Shijr City, Taipei, Taiwan 221, R.O.C.
TEL : 886-2-2696-2468
FAX : 886-2-2696-2255
HWA YA ADD : No. 52, Hwa Ya 1st Rd., Kwei-Shan Hsiang, Tao Yuan Hsien, Taiwan, R.O.C.
TEL : 886-3-327-3456
FAX : 886-3-318-0055
LINKOU ADD : No. 30-2, Dingfu Tsuen, Linkou Shiang, Taipei, Taiwan 244, R.O.C
TEL : 886-2-2601-1640
FAX : 886-2-2601-1695
DUNGHU ADD : No. 3, Lane 238, Kangle St., Neihu Chiu, Taipei, Taiwan 114, R.O.C.
TEL : 886-2-2631-4739
FAX : 886-2-2631-9740
JUNGHE ADD : 7Fl., No. 758, Jungjeng Rd., Junghe City, Taipei, Taiwan 235, R.O.C.
TEL : 886-2-8227-2020
FAX : 886-2-8227-2626
NEIHU ADD : 4Fl., No. 339, Hsin Hu 2nd Rd., Taipei 114, Taiwan, R.O.C.
TEL : 886-2-2794-8886
FAX : 886-2-2794-9777
JHUBEI ADD : No.8, Lane 724, Bo-ai St., Jhubei City, HsinChu County 302, Taiwan, R.O.C.
TEL : 886-3-656-9065
FAX : 886-3-656-9085
SPORTON International Inc. PAGE NUMBER : A1 OF A13 TEL : 886-2-2696-2468 ISSUED DATE : Nov. 29, 2007
FAX : 886-2-2696-2255
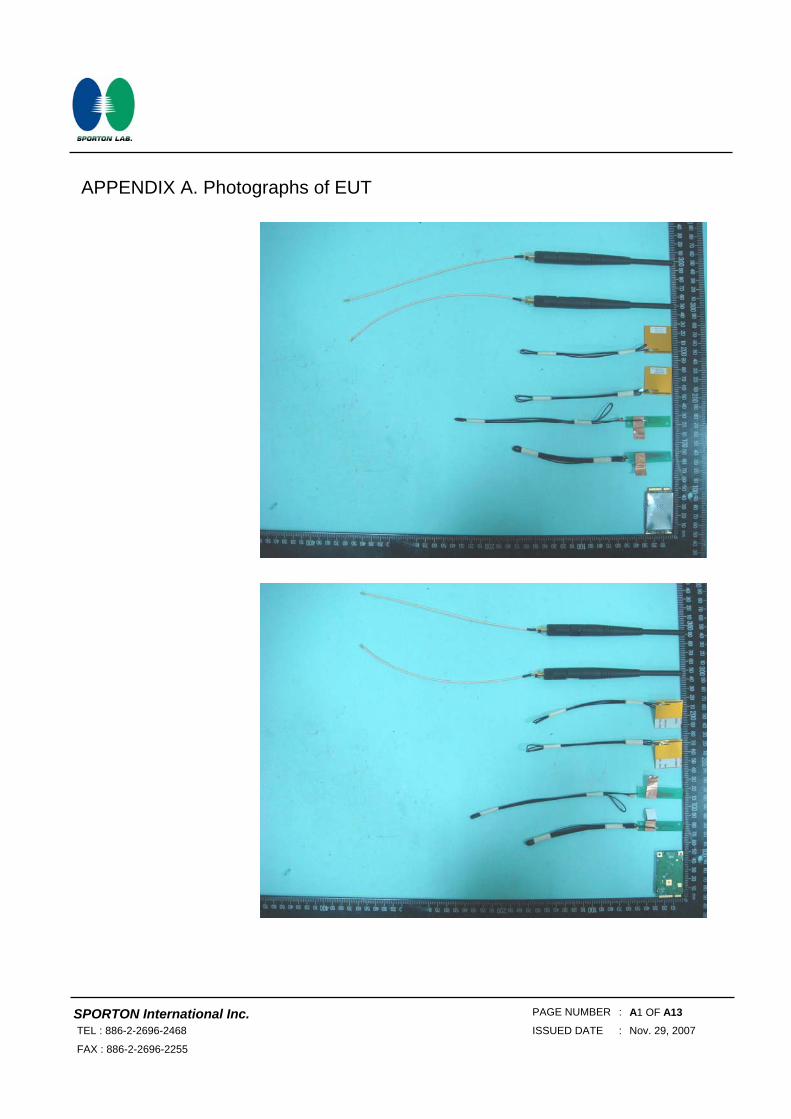
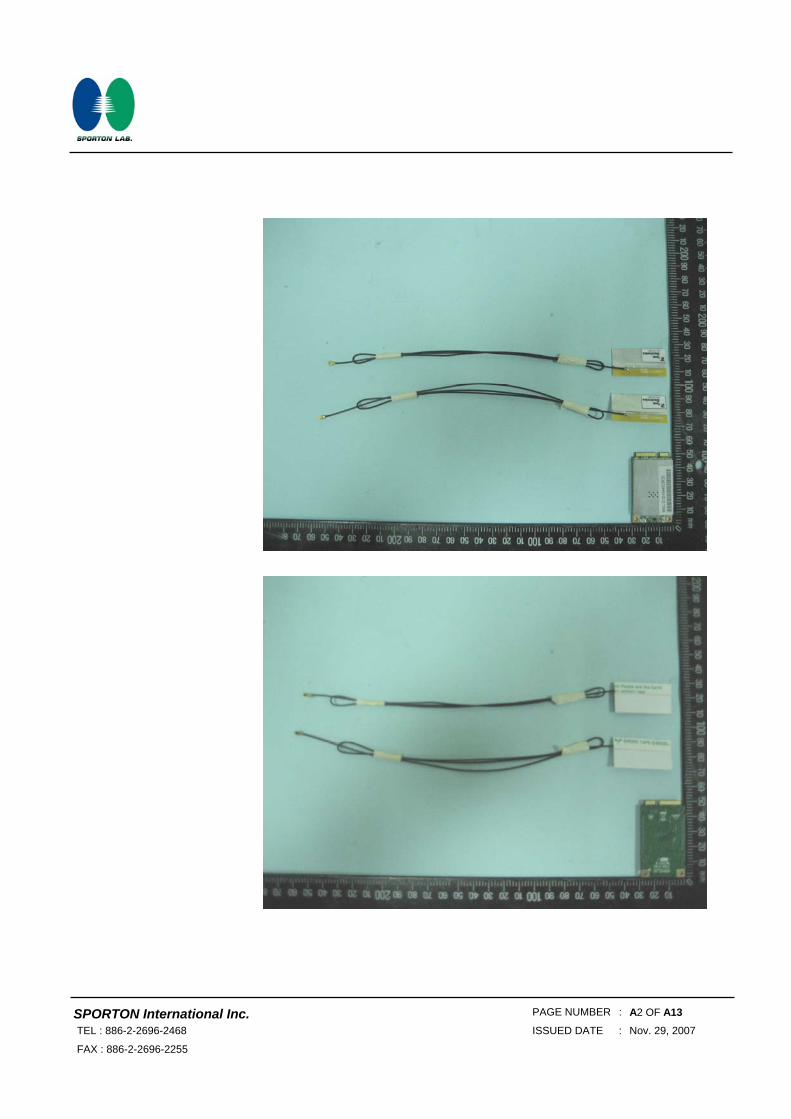
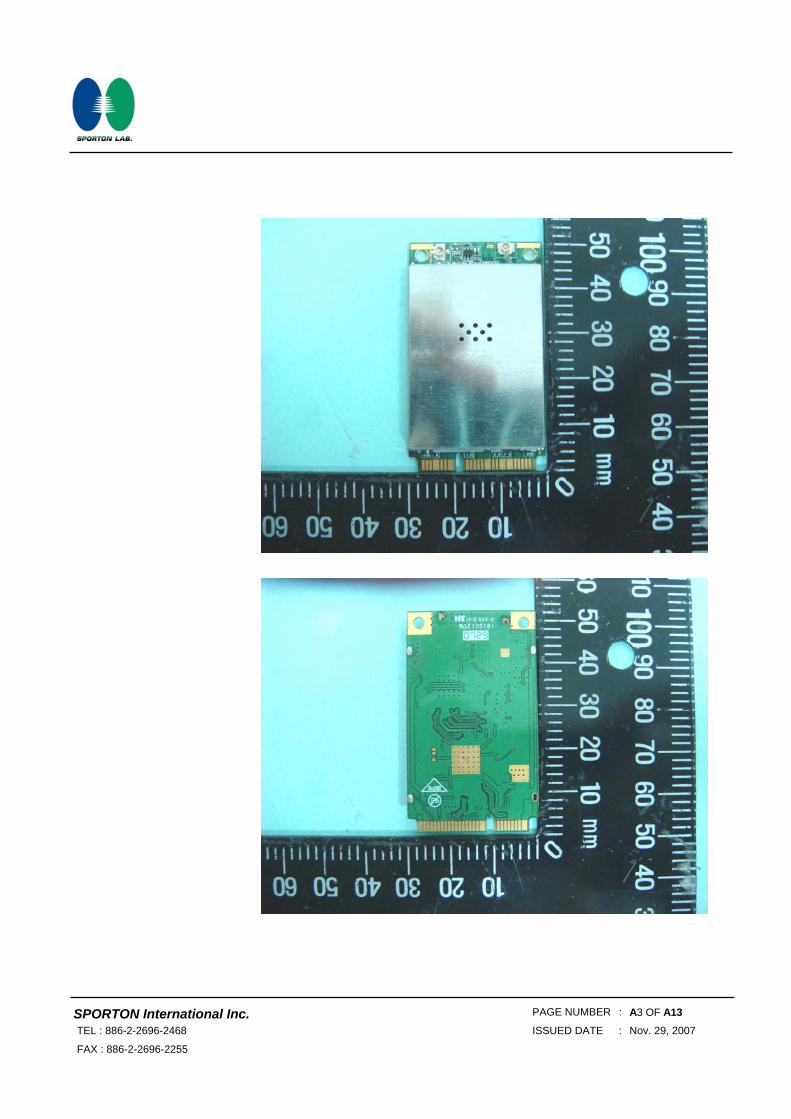
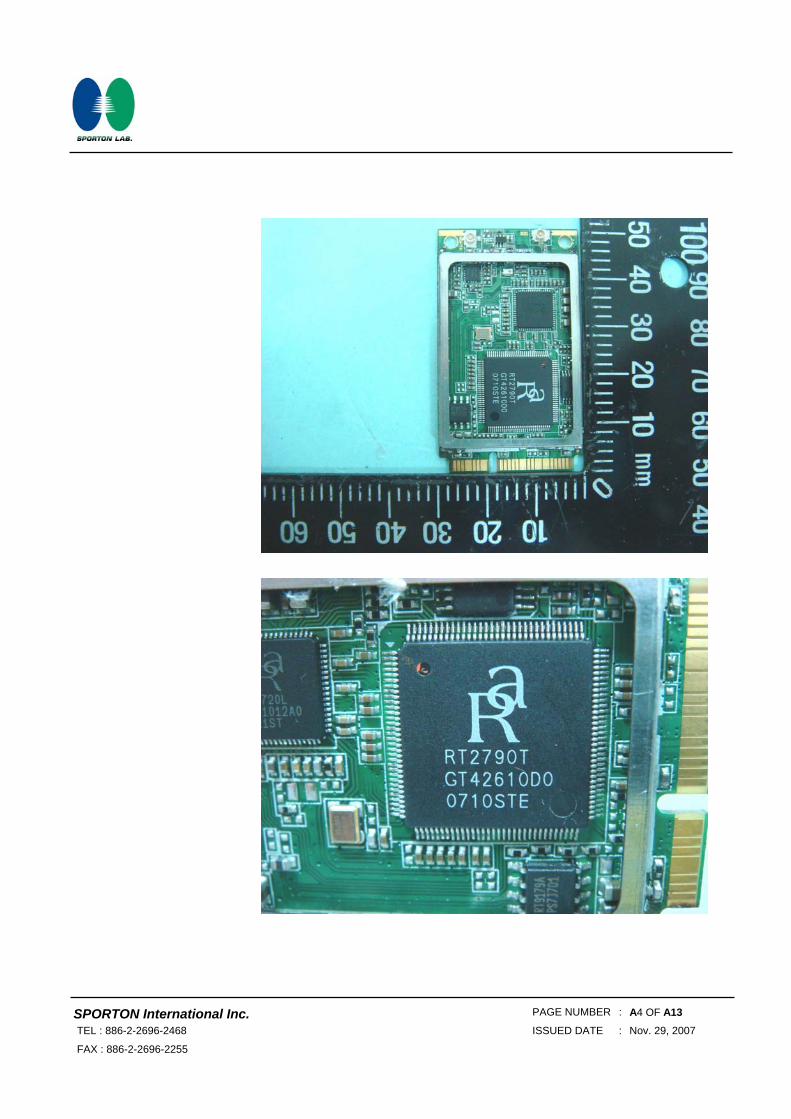
APPENDIX A. Photographs of EUT
SPORTON International Inc. PAGE NUMBER : A2 OF A13 TEL : 886-2-2696-2468 ISSUED DATE : Nov. 29, 2007
FAX : 886-2-2696-2255
SPORTON International Inc. PAGE NUMBER : A3 OF A13 TEL : 886-2-2696-2468 ISSUED DATE : Nov. 29, 2007
FAX : 886-2-2696-2255
SPORTON International Inc. PAGE NUMBER : A4 OF A13 TEL : 886-2-2696-2468 ISSUED DATE : Nov. 29, 2007
FAX : 886-2-2696-2255
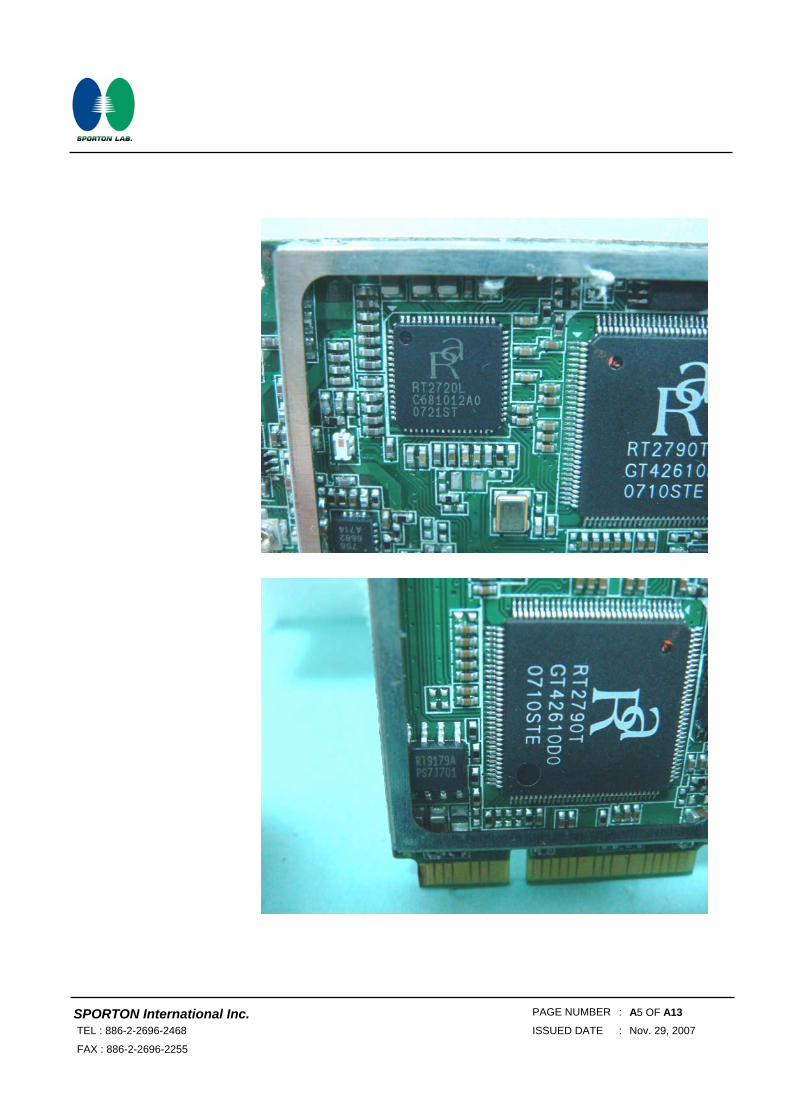
SPORTON International Inc. PAGE NUMBER : A5 OF A13 TEL : 886-2-2696-2468 ISSUED DATE : Nov. 29, 2007
FAX : 886-2-2696-2255
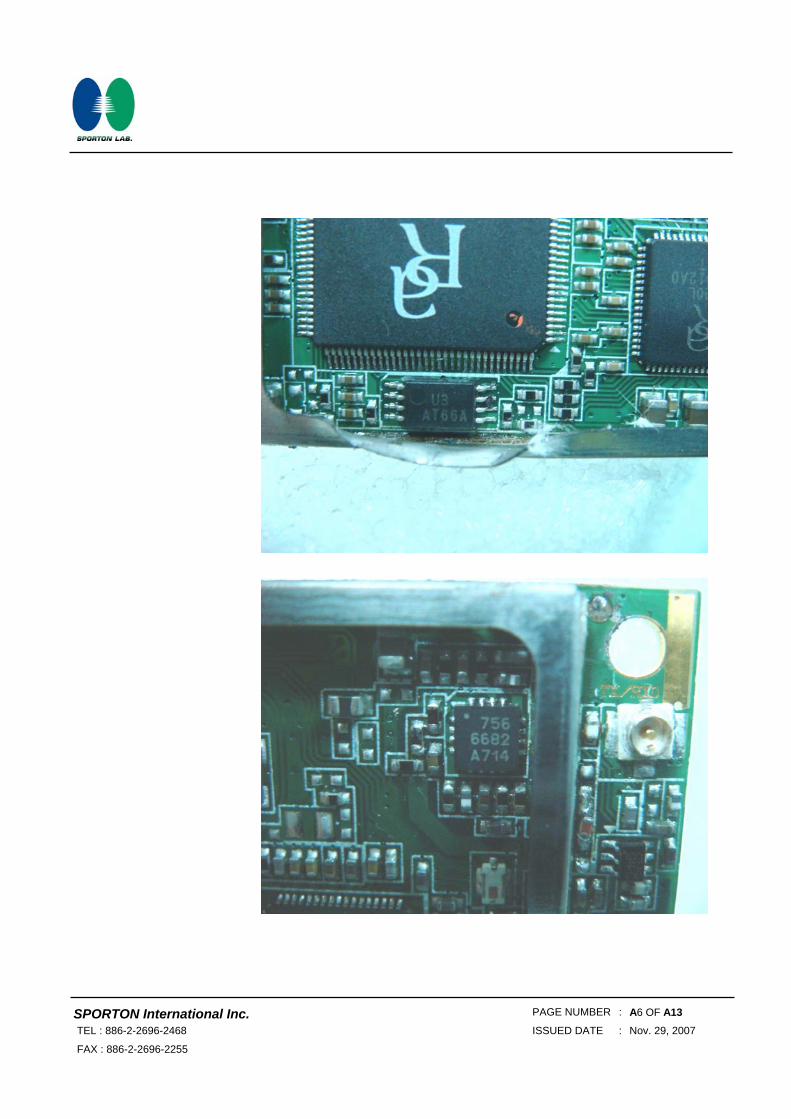
SPORTON International Inc. PAGE NUMBER : A6 OF A13 TEL : 886-2-2696-2468 ISSUED DATE : Nov. 29, 2007
FAX : 886-2-2696-2255
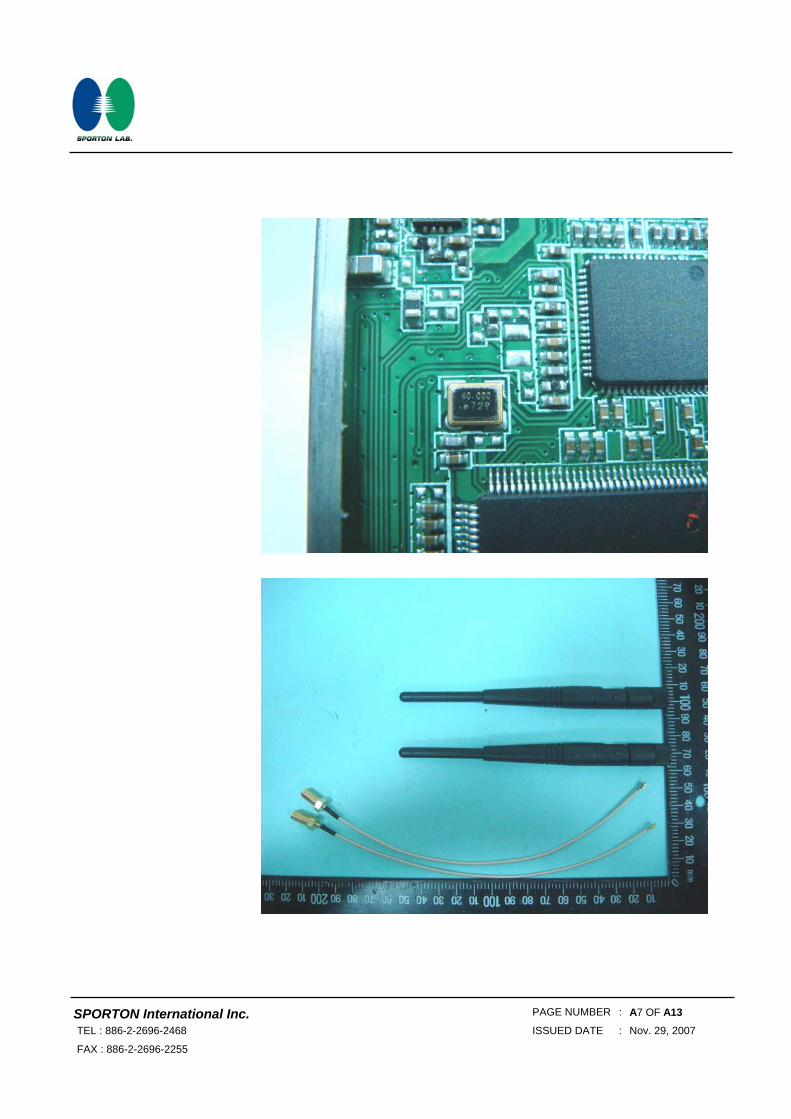
SPORTON International Inc. PAGE NUMBER : A7 OF A13 TEL : 886-2-2696-2468 ISSUED DATE : Nov. 29, 2007
FAX : 886-2-2696-2255
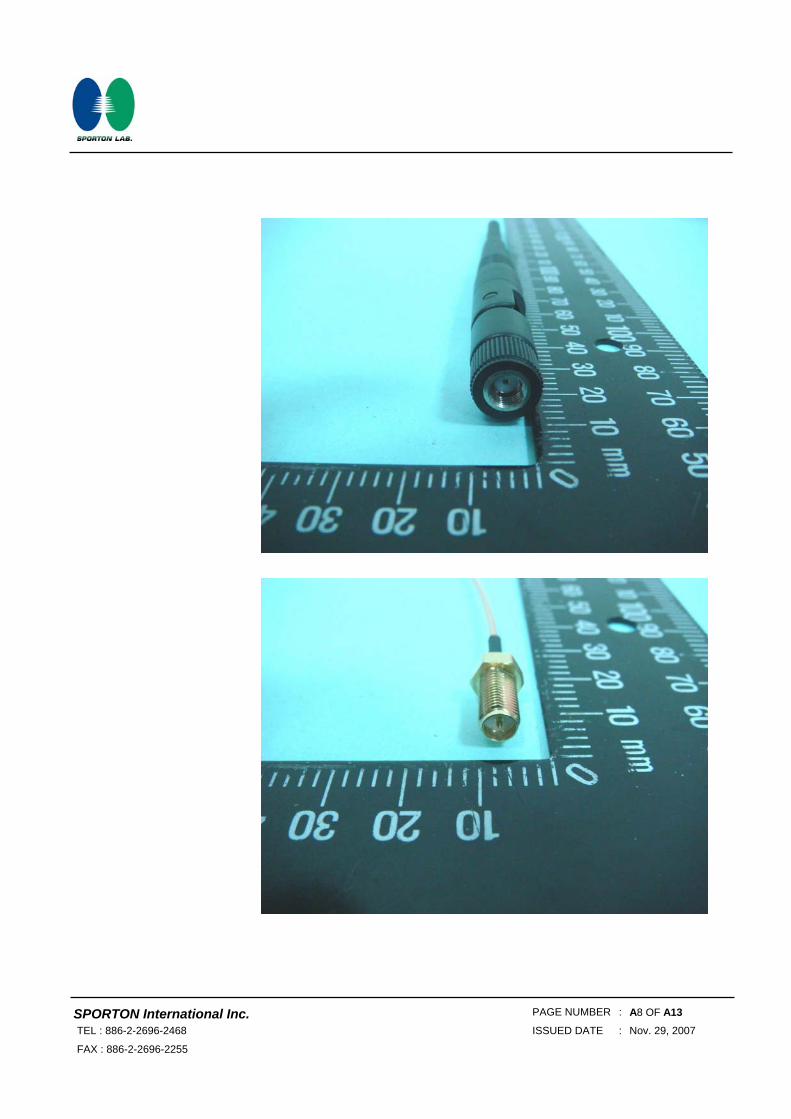
SPORTON International Inc. PAGE NUMBER : A8 OF A13 TEL : 886-2-2696-2468 ISSUED DATE : Nov. 29, 2007
FAX : 886-2-2696-2255
SPORTON International Inc. PAGE NUMBER : A9 OF A13 TEL : 886-2-2696-2468 ISSUED DATE : Nov. 29, 2007
FAX : 886-2-2696-2255
SPORTON International Inc. PAGE NUMBER : A10 OF A13 TEL : 886-2-2696-2468 ISSUED DATE : Nov. 29, 2007
FAX : 886-2-2696-2255
SPORTON International Inc. PAGE NUMBER : A11 OF A13 TEL : 886-2-2696-2468 ISSUED DATE : Nov. 29, 2007
FAX : 886-2-2696-2255
SPORTON International Inc. PAGE NUMBER : A12 OF A13 TEL : 886-2-2696-2468 ISSUED DATE : Nov. 29, 2007
FAX : 886-2-2696-2255
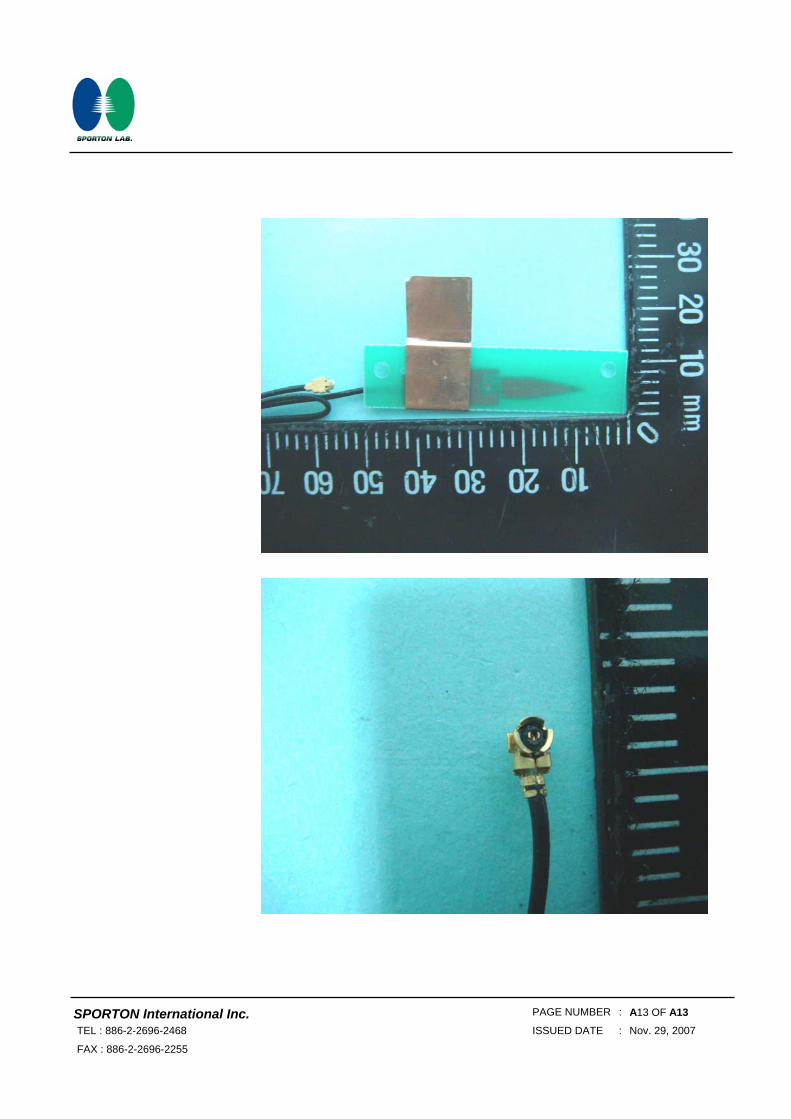
SPORTON International Inc. PAGE NUMBER : A13 OF A13 TEL : 886-2-2696-2468 ISSUED DATE : Nov. 29, 2007
FAX : 886-2-2696-2255
Report No.: ER7O1204
Page No. : B1 of B5
Appendix B. Test Photos

Report No.: ER7O1204
Page No. : B2 of B5
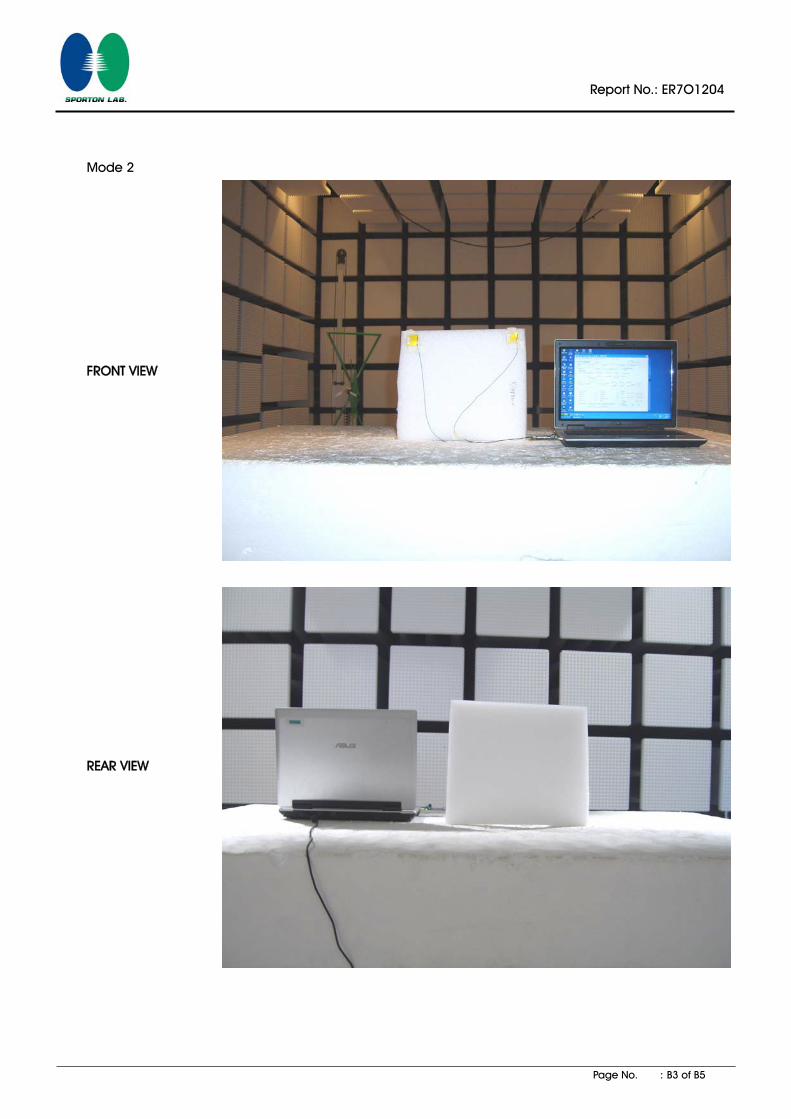
1. Photographs of Radiated Emissions Test Configuration
Mode 1
FRONT VIEW
REAR VIEW
Report No.: ER7O1204
Page No. : B3 of B5
Mode 2
FRONT VIEW
REAR VIEW
Report No.: ER7O1204
Page No. : B4 of B5
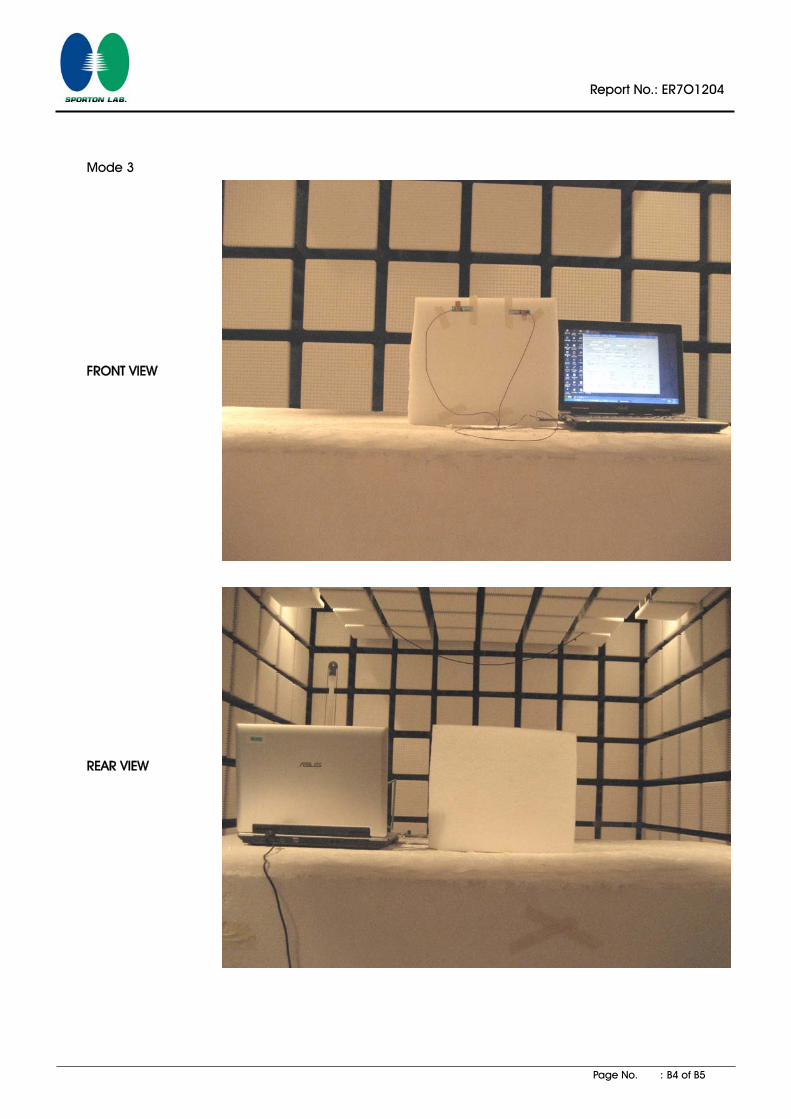
Mode 3
FRONT VIEW
REAR VIEW
Report No.: ER7O1204
Page No. : B5 of B5
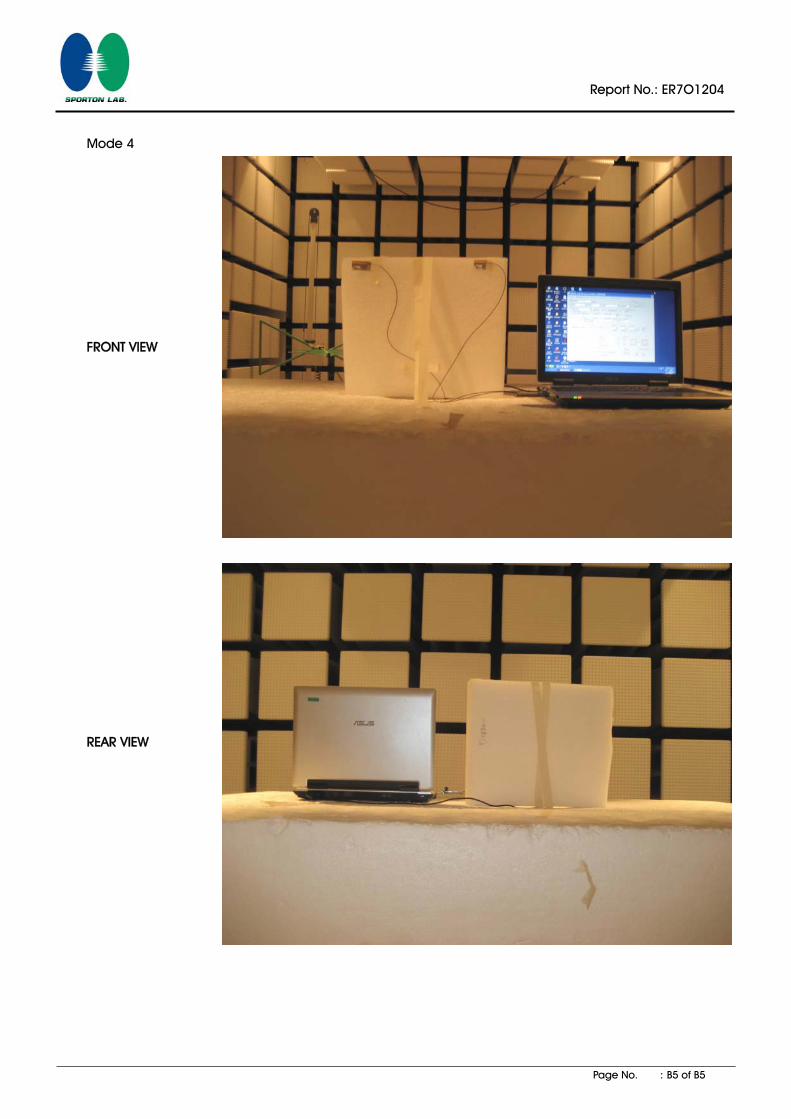
Mode 4
FRONT VIEW
REAR VIEW
Report No.: ER7O1204
Page No. : C1 of C4
Appendix C. Antenna List
Report No.: ER7O1204
Page No. : C2 of C4
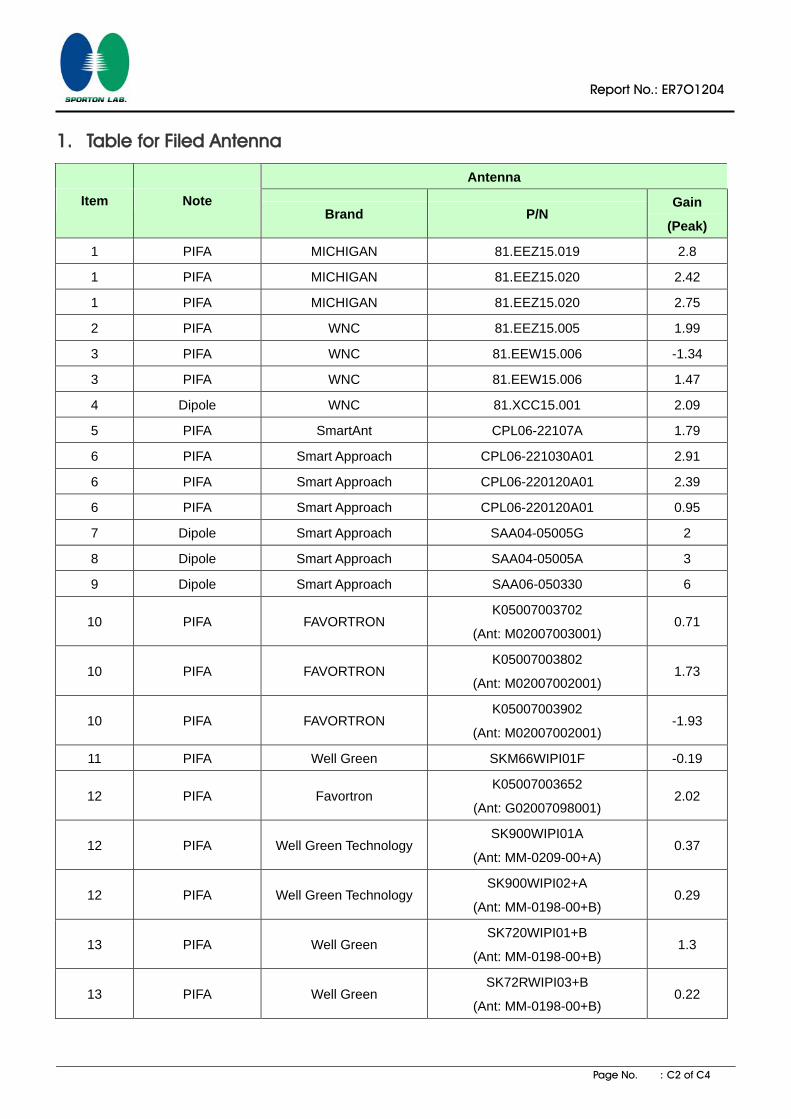
1. Table for Filed Antenna
Antenna
Item Note Brand P/N
Gain
(Peak)
1 PIFA MICHIGAN 81.EEZ15.019 2.8
1 PIFA MICHIGAN 81.EEZ15.020 2.42
1 PIFA MICHIGAN 81.EEZ15.020 2.75
2 PIFA WNC 81.EEZ15.005 1.99
3 PIFA WNC 81.EEW15.006 -1.34
3 PIFA WNC 81.EEW15.006 1.47
4 Dipole WNC 81.XCC15.001 2.09
5 PIFA SmartAnt CPL06-22107A 1.79
6 PIFA Smart Approach CPL06-221030A01 2.91
6 PIFA Smart Approach CPL06-220120A01 2.39
6 PIFA Smart Approach CPL06-220120A01 0.95
7 Dipole Smart Approach SAA04-05005G 2
8 Dipole Smart Approach SAA04-05005A 3
9 Dipole Smart Approach SAA06-050330 6
10 PIFA FAVORTRON K05007003702
(Ant: M02007003001) 0.71
10 PIFA FAVORTRON K05007003802
(Ant: M02007002001) 1.73
10 PIFA FAVORTRON K05007003902
(Ant: M02007002001) -1.93
11 PIFA Well Green SKM66WIPI01F -0.19
12 PIFA Favortron K05007003652
(Ant: G02007098001) 2.02
12 PIFA Well Green Technology SK900WIPI01A
(Ant: MM-0209-00+A) 0.37
12 PIFA Well Green Technology SK900WIPI02+A
(Ant: MM-0198-00+B) 0.29
13 PIFA Well Green SK720WIPI01+B
(Ant: MM-0198-00+B) 1.3
13 PIFA Well Green SK72RWIPI03+B
(Ant: MM-0198-00+B) 0.22
Report No.: ER7O1204
Page No. : C3 of C4
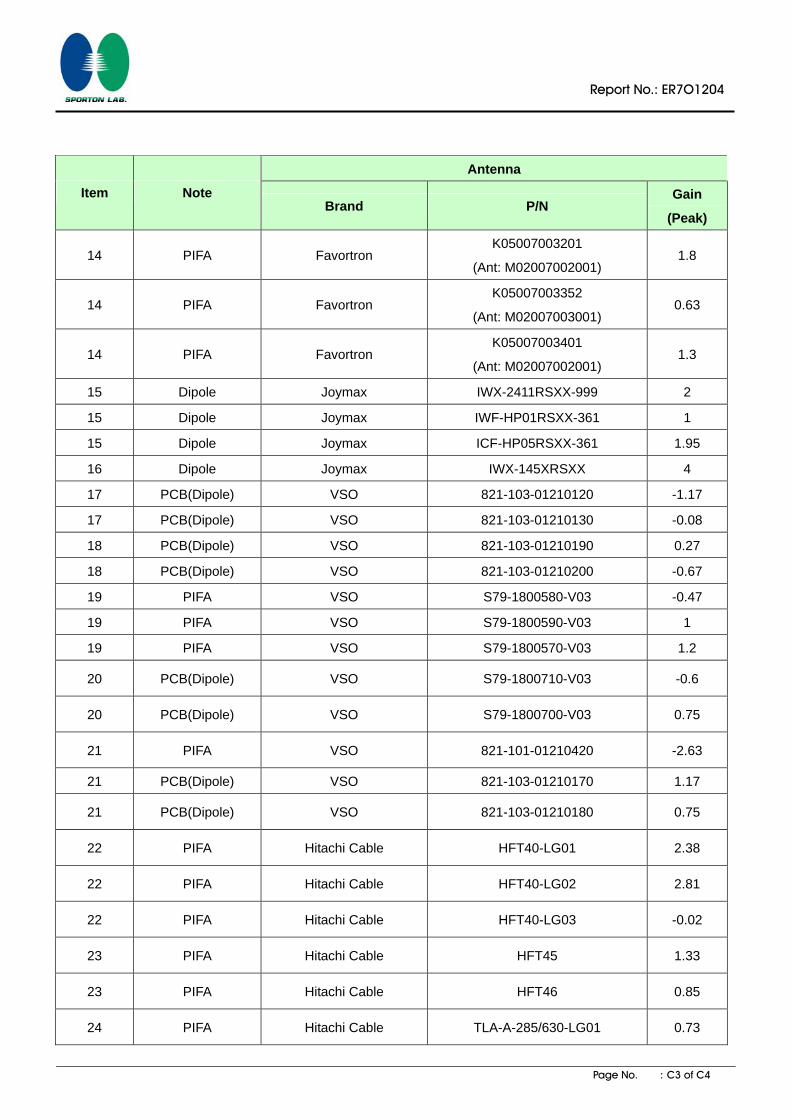
Antenna
Item Note Brand P/N
Gain
(Peak)
14 PIFA Favortron K05007003201
(Ant: M02007002001) 1.8
14 PIFA Favortron K05007003352
(Ant: M02007003001) 0.63
14 PIFA Favortron K05007003401
(Ant: M02007002001) 1.3
15 Dipole Joymax IWX-2411RSXX-999 2
15 Dipole Joymax IWF-HP01RSXX-361 1
15 Dipole Joymax ICF-HP05RSXX-361 1.95
16 Dipole Joymax IWX-145XRSXX 4
17 PCB(Dipole) VSO 821-103-01210120 -1.17
17 PCB(Dipole) VSO 821-103-01210130 -0.08
18 PCB(Dipole) VSO 821-103-01210190 0.27
18 PCB(Dipole) VSO 821-103-01210200 -0.67
19 PIFA VSO S79-1800580-V03 -0.47
19 PIFA VSO S79-1800590-V03 1
19 PIFA VSO S79-1800570-V03 1.2
20 PCB(Dipole) VSO S79-1800710-V03 -0.6
20 PCB(Dipole) VSO S79-1800700-V03 0.75
21 PIFA VSO 821-101-01210420 -2.63
21 PCB(Dipole) VSO 821-103-01210170 1.17
21 PCB(Dipole) VSO 821-103-01210180 0.75
22 PIFA Hitachi Cable HFT40-LG01 2.38
22 PIFA Hitachi Cable HFT40-LG02 2.81
22 PIFA Hitachi Cable HFT40-LG03 -0.02
23 PIFA Hitachi Cable HFT45 1.33
23 PIFA Hitachi Cable HFT46 0.85
24 PIFA Hitachi Cable TLA-A-285/630-LG01 0.73
Report No.: ER7O1204
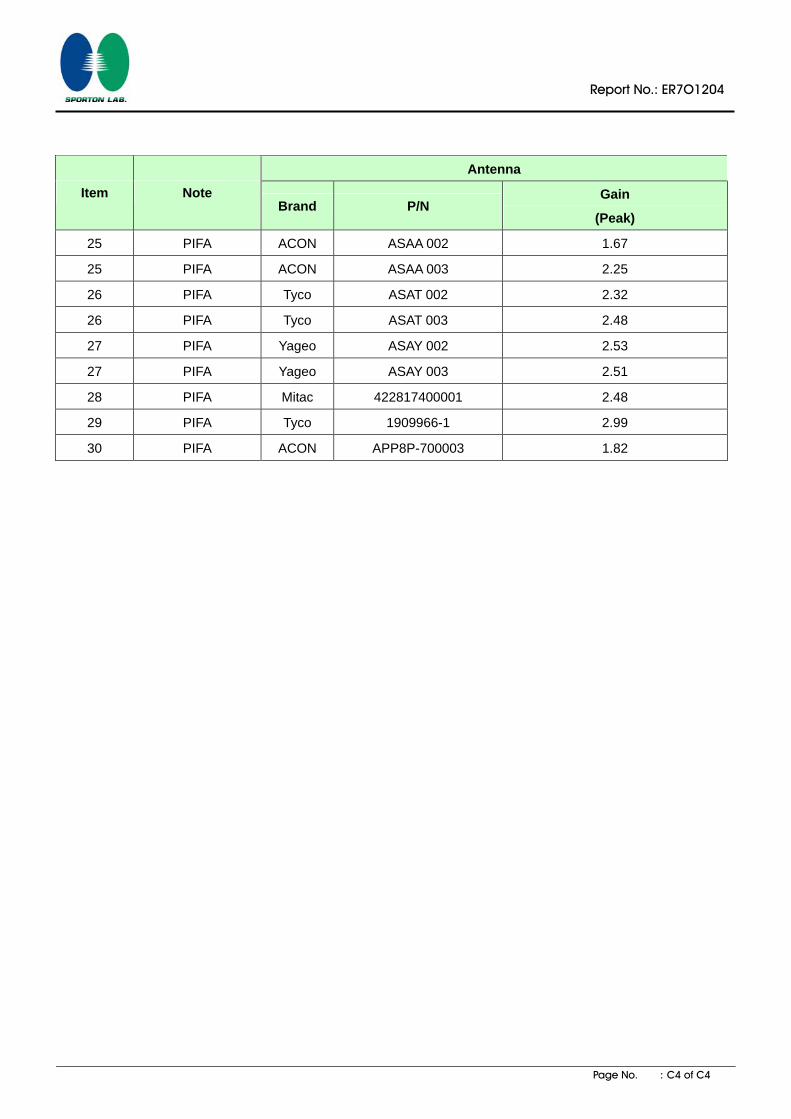
Page No. : C4 of C4
Antenna
Item Note Brand P/N
Gain
(Peak)
25 PIFA ACON ASAA 002 1.67
25 PIFA ACON ASAA 003 2.25
26 PIFA Tyco ASAT 002 2.32
26 PIFA Tyco ASAT 003 2.48
27 PIFA Yageo ASAY 002 2.53
27 PIFA Yageo ASAY 003 2.51
28 PIFA Mitac 422817400001 2.48
29 PIFA Tyco 1909966-1 2.99
30 PIFA ACON APP8P-700003 1.82