Embed Size (px)
Citation preview
Index FAQ
Advanced Calculus
Lecture for first yearby Nguyen Xuan Hung
Index FAQ
Sets
Concepts Union of setsIntersections
Complementary sets
Index FAQ
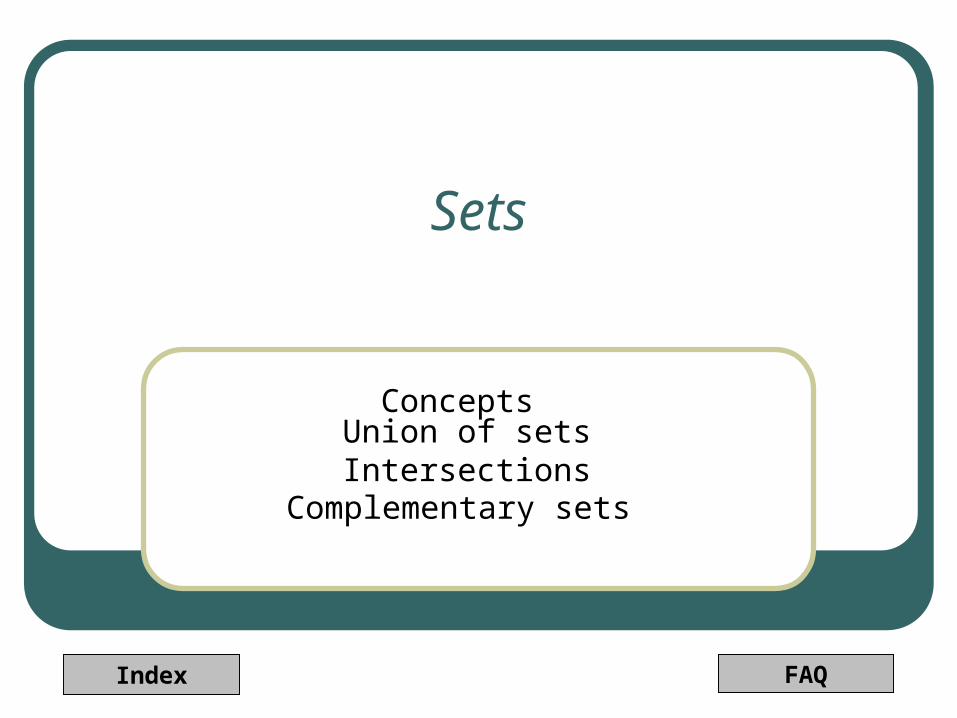
Definition of Sets
Sets are to consist of objects with common properties
Definition
NotationA, B, C, D,E, etc.
Each element belongs to A : x A
ExampleA={0,1, 2, 3, 4, 5, 6, 7}
B={x| -x3-x +2 =0}
Index FAQ
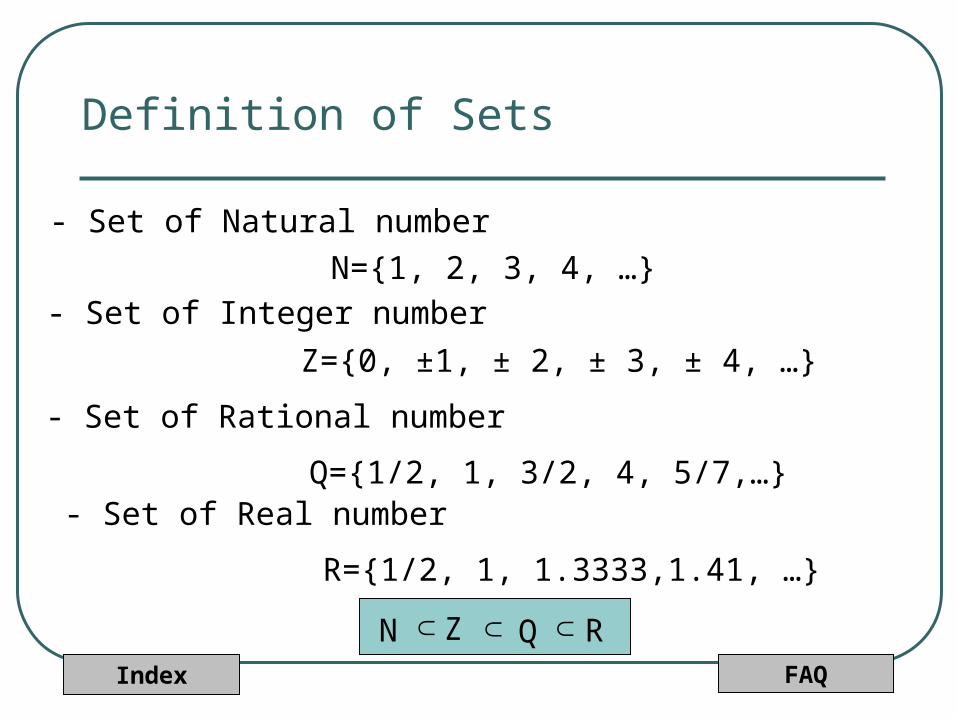
Definition of Sets
- Set of Natural number
N={1, 2, 3, 4, …}
- Set of Integer number
Z={0, ±1, ± 2, ± 3, ± 4, …}
- Set of Rational number
Q={1/2, 1, 3/2, 4, 5/7,…}- Set of Real number
R={1/2, 1, 1.3333,1.41, …}
∩N ∩Z ∩Q R
Index FAQ
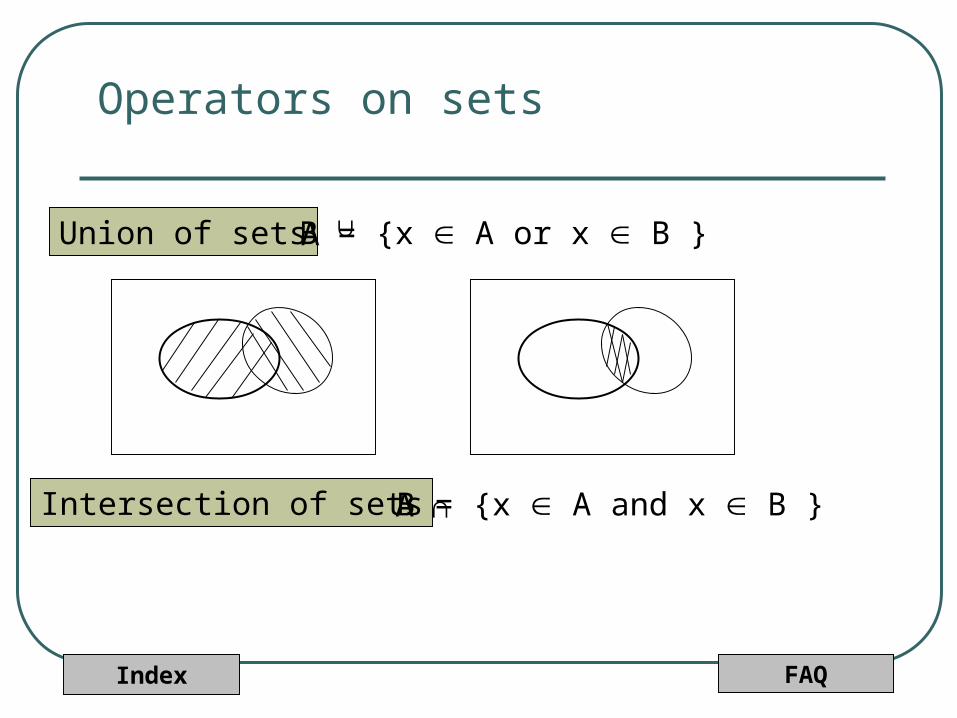
Operators on sets
Union of sets A
∩
B = {x A or x B }
Intersection of sets A ∩ B = {x A and x B }
Index FAQ
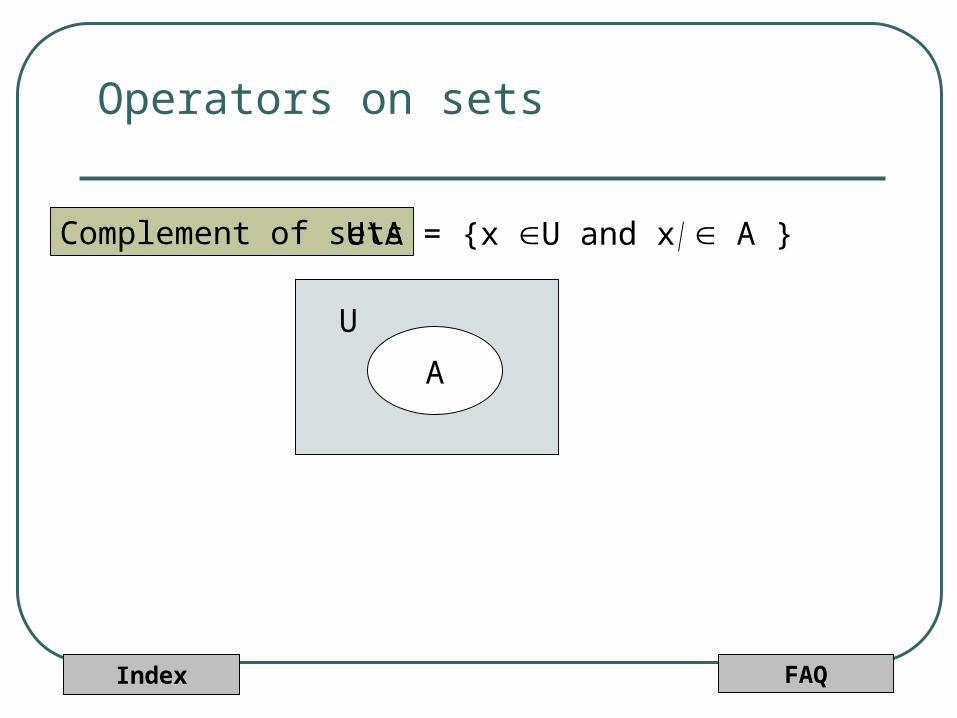
Operators on sets
Complement of sets
A
U
U\A = {x U and x A }
Index FAQ
Functions
Functions and their GraphsInjectivity and Surjectivity
Index FAQ
Definition of Functions
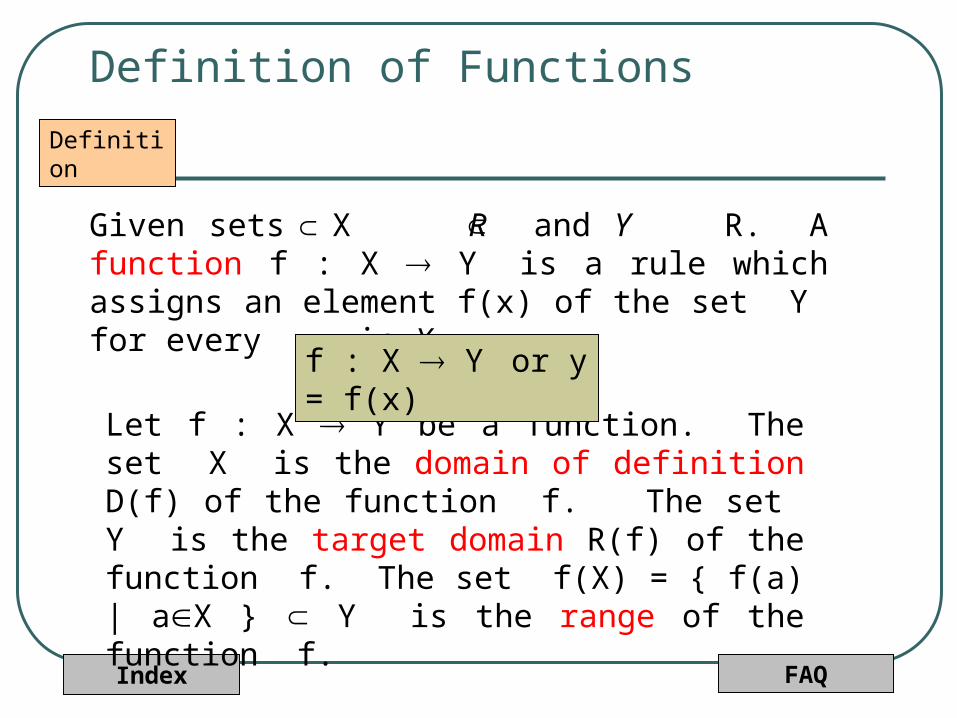
Given sets X R and Y R. A function f : X Y is a rule which assigns an element f(x) of the set Y for every x in X.
Definition
Let f : X Y be a function. The set X is the domain of definition D(f) of the function f. The set Y is the target domain R(f) of the function f. The set f(X) = { f(a) | aX } Y is the range of the function f.
∩ ∩
f : X Y or y = f(x)
Index FAQ
Graphs of Functions
In calculus we are usually concerned with functions
f : defined in terms of explicit expressions for f .x
2The product , | , is called the plane. It is usually pictured
by drawing the -axis horizontally and the -axis vertically. The graph of
a function f : is the graph of the set , f | .
x y x y
x y
x x x
Index FAQ
Graphs of Functions
2
4 3 2 sin( )
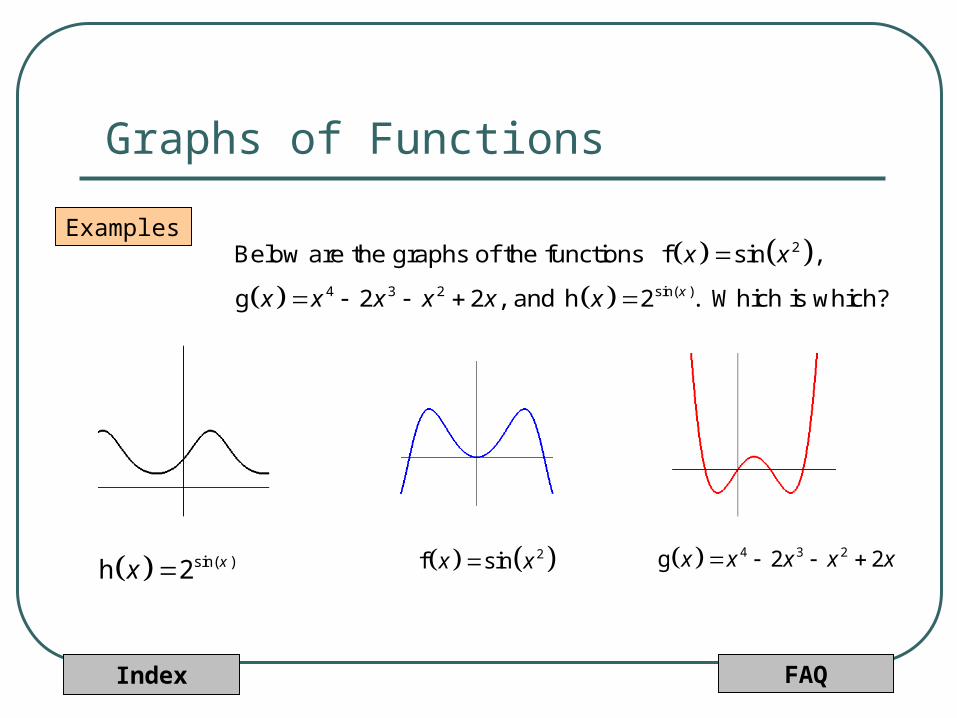
Below are the graphs of the functions f sin ,
g 2 2 , and h 2 . Which is which?x
x x
x x x x x x
Examples
4 3 2g 2 2x x x x x 2f sin x x sin( )h 2 xx
Index FAQ
Curves and Graphs
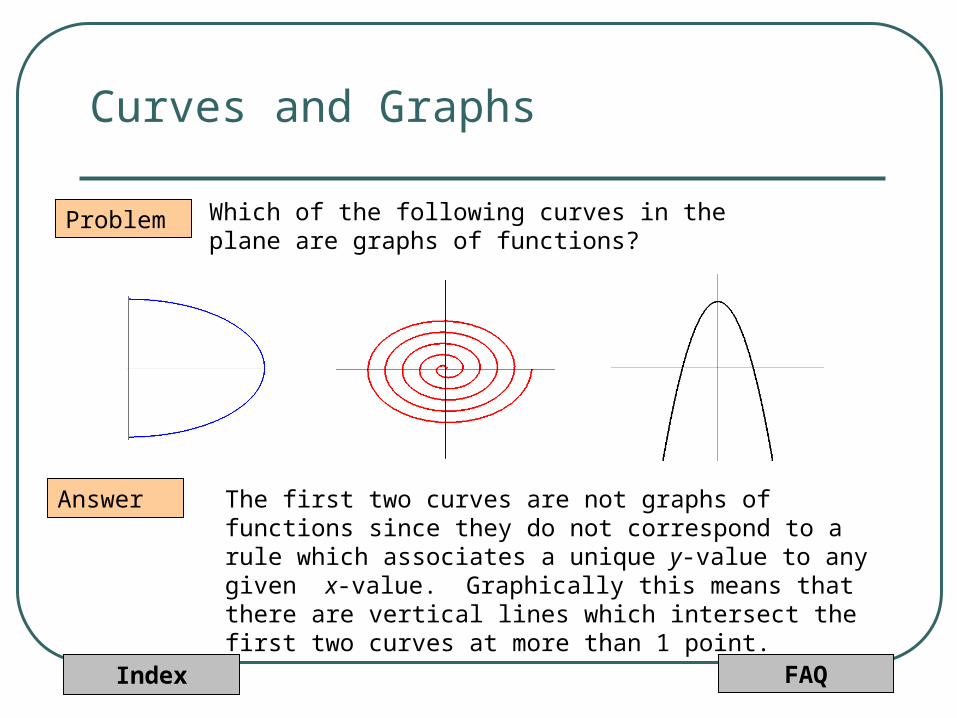
Problem Which of the following curves in the plane are graphs of functions?
Answer The first two curves are not graphs of functions since they do not correspond to a rule which associates a unique y-value to any given x-value. Graphically this means that there are vertical lines which intersect the first two curves at more than 1 point.
Index FAQ
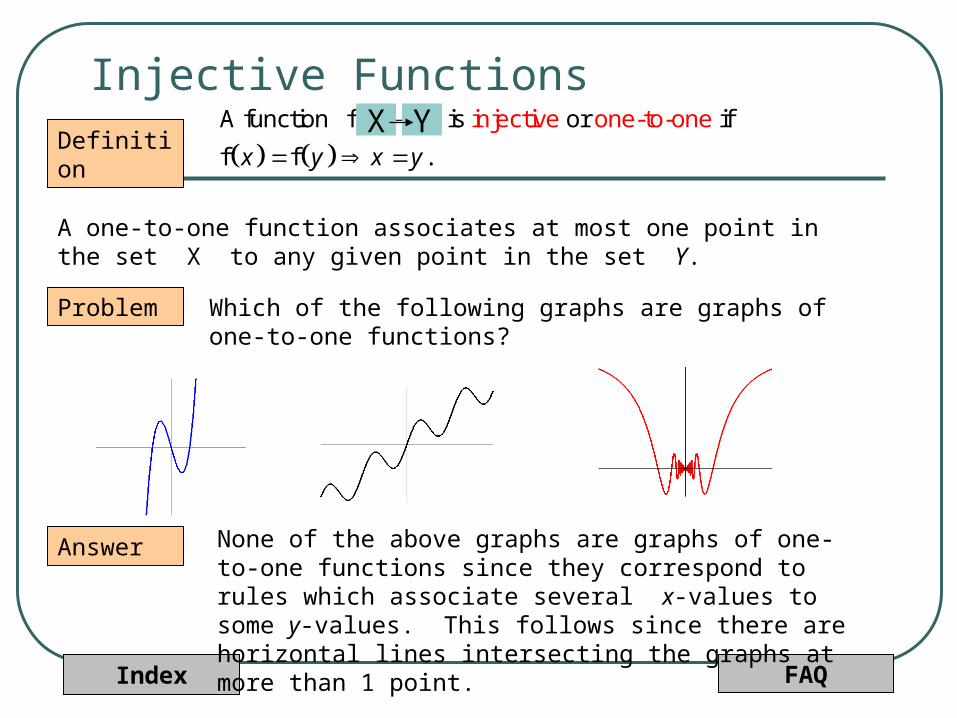
Injective FunctionsDefinition
A one-to-one function associates at most one point in the set X to any given point in the set Y.
Problem Which of the following graphs are graphs of one-to-one functions?
Answer None of the above graphs are graphs of one-to-one functions since they correspond to rules which associate several x-values to some y-values. This follows since there are horizontal lines intersecting the graphs at more than 1 point.
injectiveA function f : is or ione-to-one f
f f .
A B
x y x y
X Y
Index FAQ
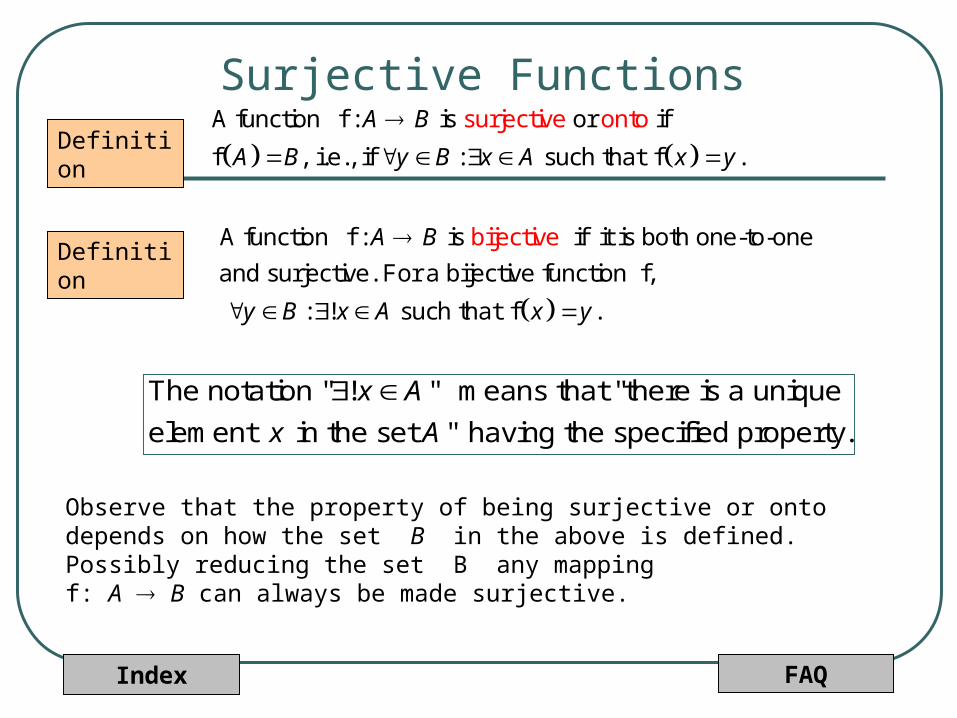
Surjective Functions
A function f : is or if
f , i.e.,
surject
if : such that f .
ive ontoA B
A B y B x A x y
Definition
A function f : is if it is both one-to-one
and surjective. For a bijective function f,
: ! such that f .
bijectiveA B
y B x A x y
Definition
The notation " ! " means that "there is a unique
element in the set " having the specified property.
x A
x A
Observe that the property of being surjective or onto depends on how the set B in the above is defined. Possibly reducing the set B any mapping f: A B can always be made surjective.
Index FAQ
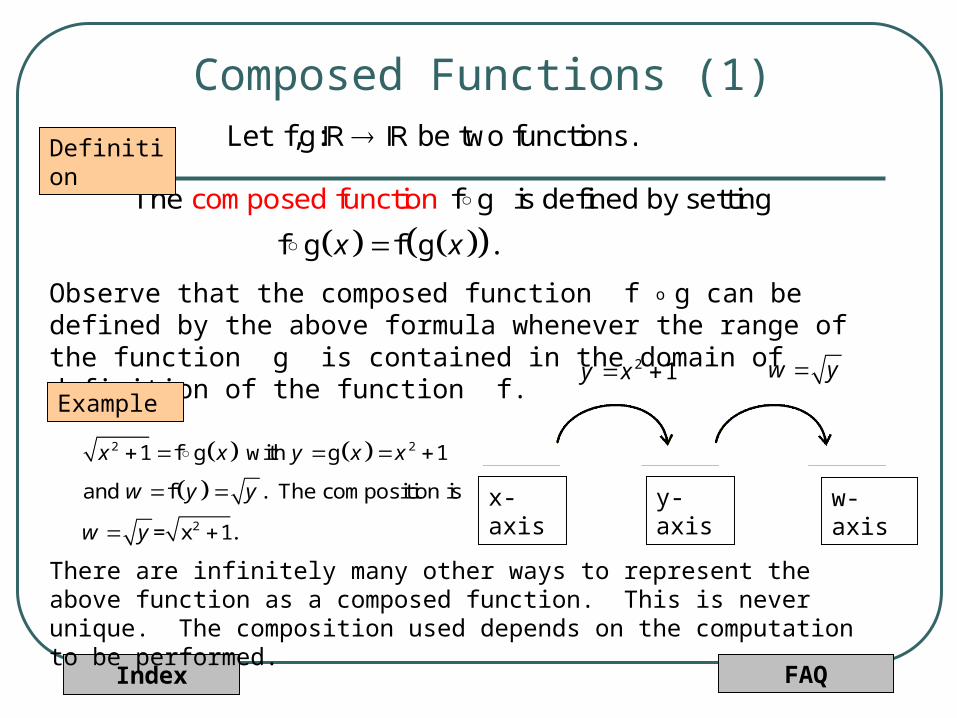
Composed Functions (1)Let f,g: be two functions.
The f g is defined by setting
composed fu
f g f g .
nction
x x
2 2
2
1 f g with g 1
and f . The composition is
= x 1.
x x y x x
w y y
w y
Definition
Observe that the composed function f o g can be defined by the above formula whenever the range of the function g is contained in the domain of definition of the function f.
Example
2 1y x w y
x-axis y-axis w-axis
There are infinitely many other ways to represent the above function as a composed function. This is never unique. The composition used depends on the computation to be performed.
Index FAQ
Composed Functions (2)
Observations
Assume that f and g are functions for which the composed function h = f o g is defined.
1. If both f and g are increasing, then also h is increasing.
2. If f is increasing and g decreasing, then h is decreasing.
3. If f is decreasing and g increasing, then h is decreasing.
4. If both f and g are decreasing, then h is increasing.
Index FAQ
Inverse Functions
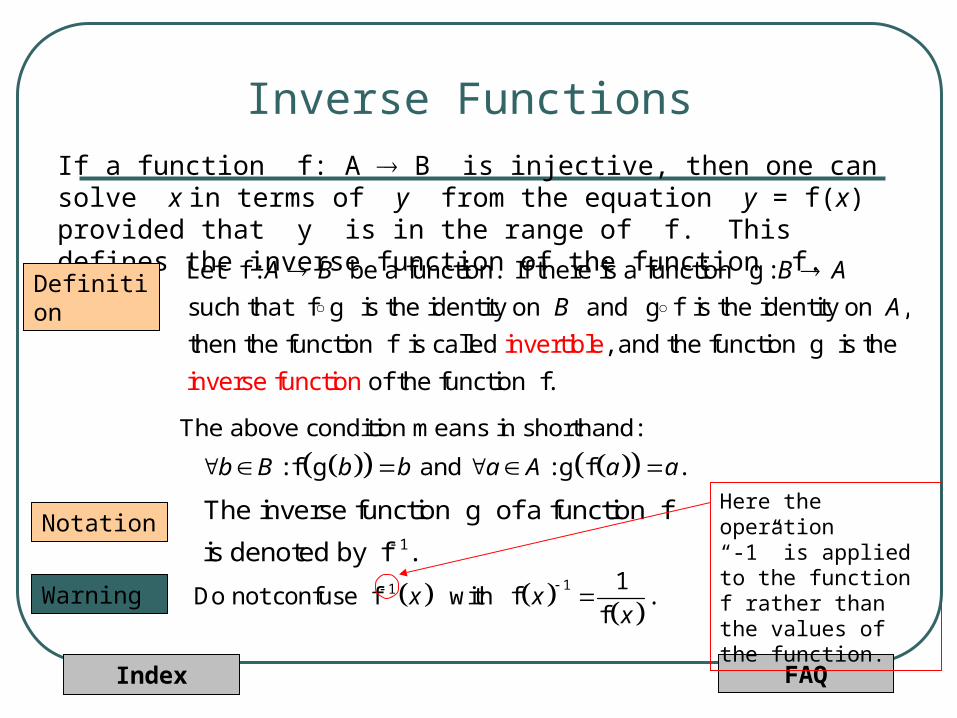
The above condition means in shorthand:
: f g and : g f . b B b b a A a a
If a function f: A B is injective, then one can solve x in terms of y from the equation y = f(x) provided that y is in the range of f. This defines the inverse function of the function f.
Let f : be a function. If there is a function g :
such that f g is the identity on and g f is the identity on ,
then the function invertiblf is called , and the function g is the e
A B B A
B A
of the fuinverse fu nction f.nction
Definition
Notation1
The inverse function g of a function f
is denoted by f .
Warning 11 1
Do not confuse f with f . f
x xx
Here the operation “-1” is applied to the function f rather than the values of the function.
Index FAQ
Finding Inverse Functions
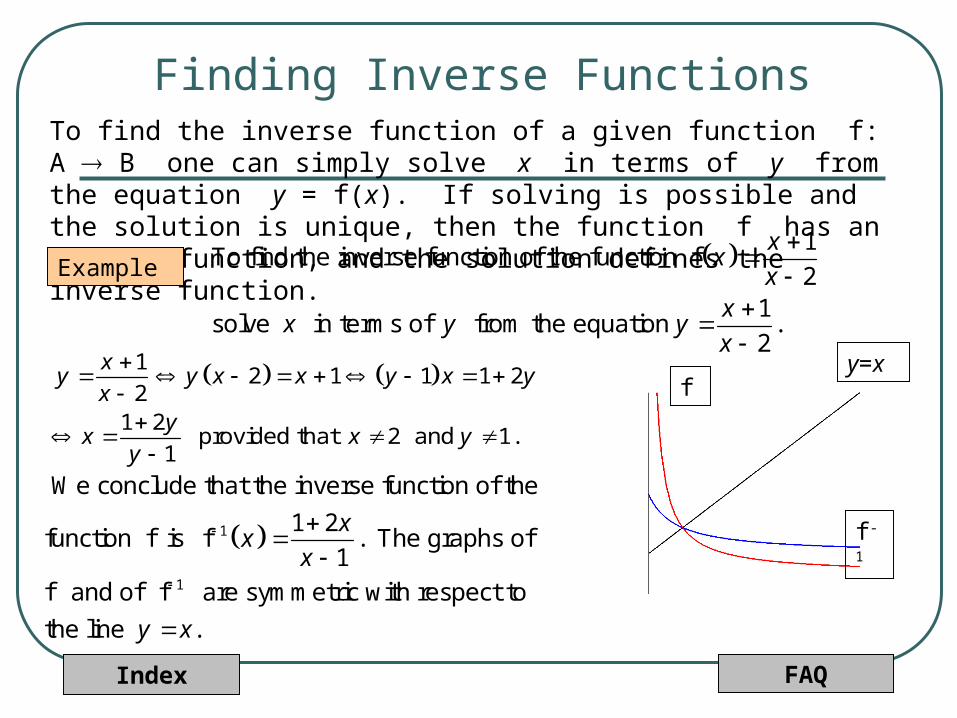
1 2 1 1 1 2
21 2
provided that 2 and 1. 1
xy y x x y x y
xy
x x yy
1
1
We conclude that the inverse function of the
1 2function f is f . The graphs of
1
f and of f are symmetric with respect to
the line .
xx
x
y x
To find the inverse function of a given function f: A B one can simply solve x in terms of y from the equation y = f(x). If solving is possible and the solution is unique, then the function f has an inverse function, and the solution defines the inverse function.
1To find the inverse function of the function f
21
solve in terms of from the equation . 2
xx
xx
x y yx
Example
f
f-1
y=x
Index FAQ
The LogarithmLet a > 0. We know that the exponential function ax is increasing if a > 1 and decreasing if a < 1. In both cases the function ax is injective. Hence the exponential function has an inverse function.
The inverse function of the exponential functi
logarithmic function wi
on
th is t baseh . e xa a
Definition
log x the value of the logarithmic function with
base at the point .a
a x
Notation
The logarithmic function with base e is called
the or simplnatural l y theogarithm logari thm.
Definition
elog x log x ln .x Notation
Index FAQ
Properties of the Logarithm
yThe exponential function has the property and .
These formulae imply the following formulae for the logarithm.
x y x y x xya a a a a
1. log log loga a axy x y
2. log log ya ay x x
log
3. log . Here log the natural logarithm of .loga
ww w w
a
Proof The formulae 1 and 2 follow directly from the properties of the exponential function.
loglog log log log
logx x w
w a w a w x a xa
logOn the other hand, log . Hence log .
logx
a a
ww a w x w
a

Index FAQ
y=sin(x)
The Inverse Function of the Sine Function
The sine function is not injective since there are horizontal lines intersecting the curve at infinitely many points.
Hence one cannot solve x in terms of y uniquely from the equation y=sin(x).
In fact, there are no solutions if y > 1 or y < -1. If -1 y 1, there are infinitely many solutions. The solution becomes unique, if we require it to be between -/2 and /2. This is equivalent to restricting the domain of definition of the sine function to the interval [-/2, /2].
The is the inverse function of
the function si
a
n : , 1
rcsin functio
1 .2
n
,2
Definitiony=sin(x)
y=arcsin(x)
Index FAQ
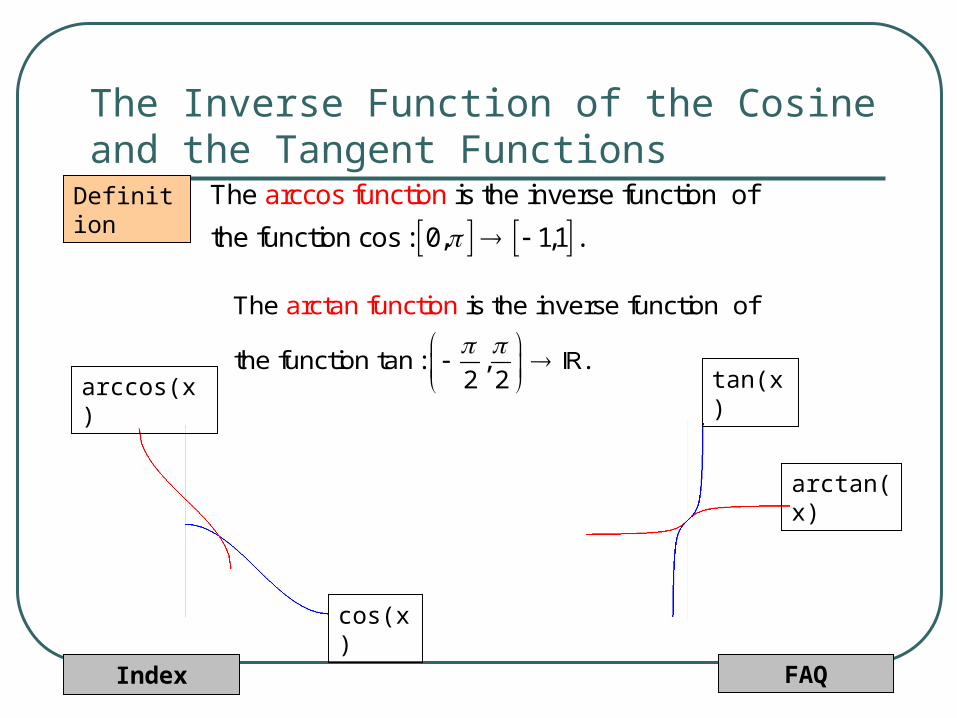
The Inverse Function of the Cosine and the Tangent Functions
The is the inverse function of
the function tan :
arctan funct
, .2
n
2
io
The is the inverse function of
the function
arccos func
cos : 0,
ion
,1
t
1 .
Definition
arccos(x)
cos(x)
tan(x)
arctan(x)
Index FAQ
New Functions from Old
Piecewise Defined FunctionsDeformations of Functions
Composed FunctionsInverse Functions
Inverses of Exponential FunctionsInverses of Trigonometric Functions
Index FAQ
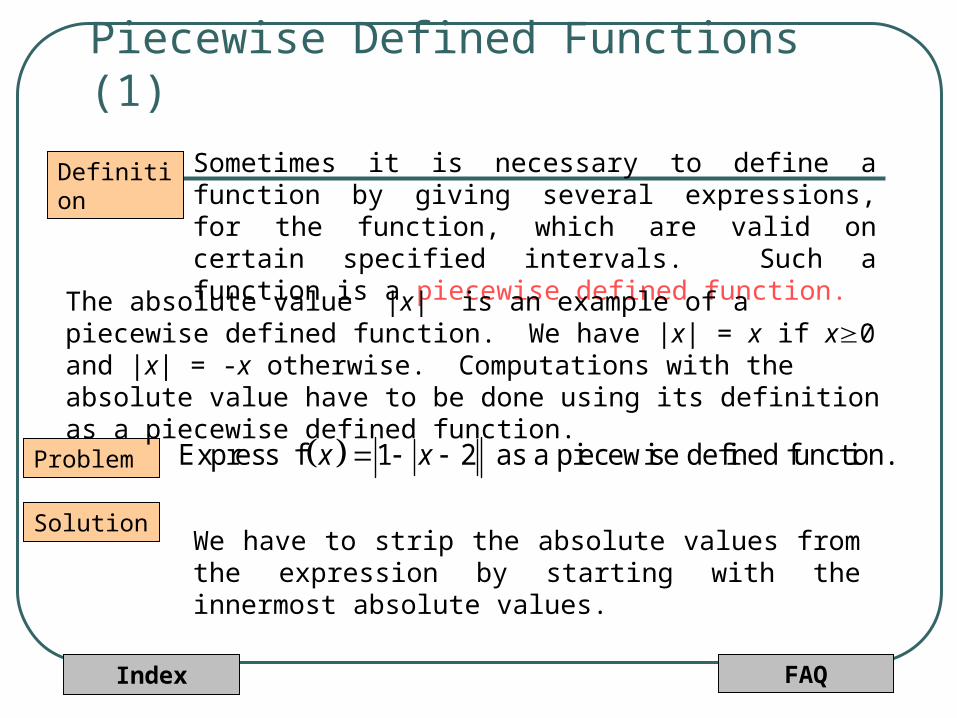
Piecewise Defined Functions (1)
Express f 1 2 as a piecewise defined function.x x
Definition Sometimes it is necessary to define a function by giving several expressions, for the function, which are valid on certain specified intervals. Such a function is a piecewise defined function.
Problem
The absolute value |x| is an example of a piecewise defined function. We have |x| = x if x0 and |x| = -x otherwise. Computations with the absolute value have to be done using its definition as a piecewise defined function.
SolutionWe have to strip the absolute values from the expression by starting with the innermost absolute values.
Index FAQ
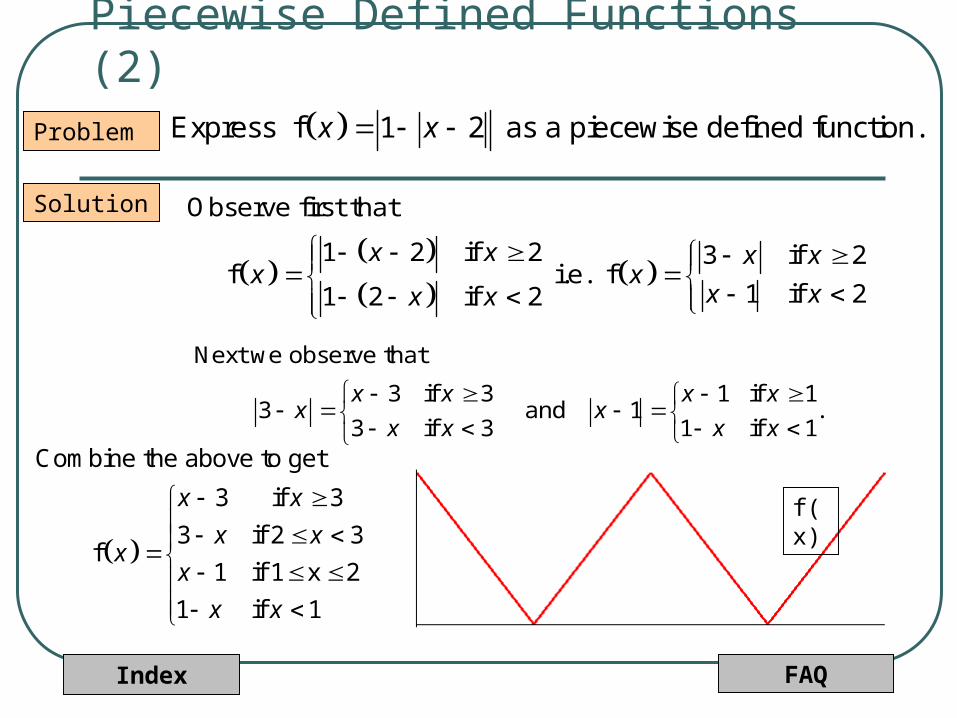
Piecewise Defined Functions (2) Express f 1 2 as a piecewise defined function.x x
Observe first that
1 2 if 2 3 if 2 f i.e. f
1 if 21 2 if 2
x x x xx x
x xx x
Next we observe that
3 if 3 1 if 1 3 and 1 .
3 if 3 1 if 1
x x x xx x
x x x x
Problem
Solution
Combine the above to get
3 if 3
3 if 2 3 f
1 if 1 x 2
1 if 1
x x
x xx
x
x x
f(x)
Index FAQ
f(x)
0.5f(x)
1.5 f(x)
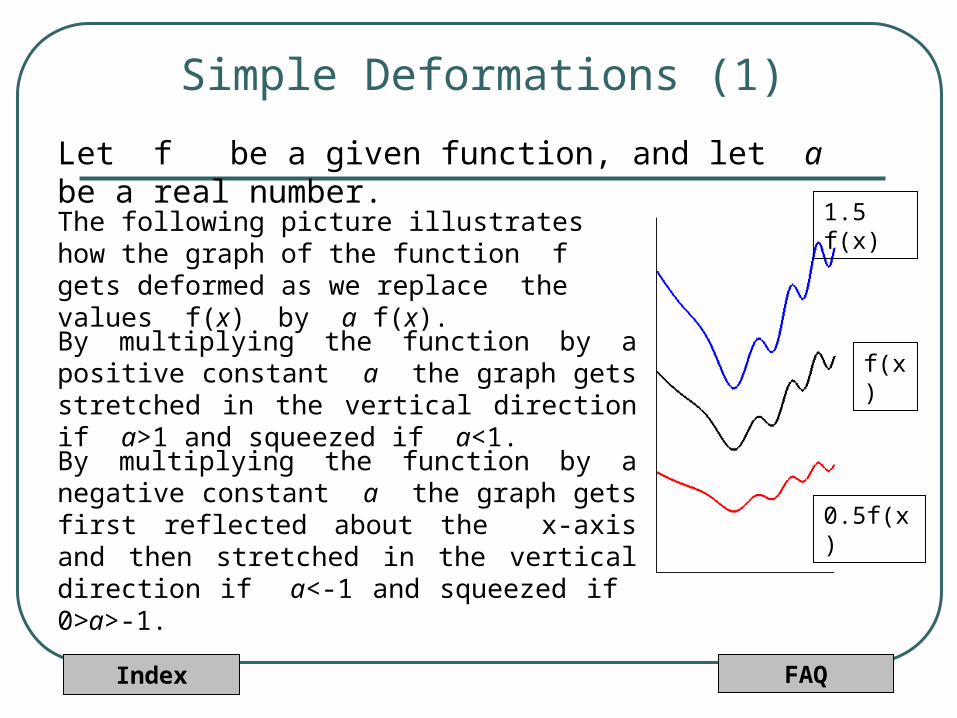
Simple Deformations (1)
Let f be a given function, and let a be a real number.
The following picture illustrates how the graph of the function f gets deformed as we replace the values f(x) by a f(x).
By multiplying the function by a positive constant a the graph gets stretched in the vertical direction if a>1 and squeezed if a<1.
By multiplying the function by a negative constant a the graph gets first reflected about the x-axis and then stretched in the vertical direction if a<-1 and squeezed if 0>a>-1.
Index FAQ
f(x)
0.5f(x)
1.5 f(x)
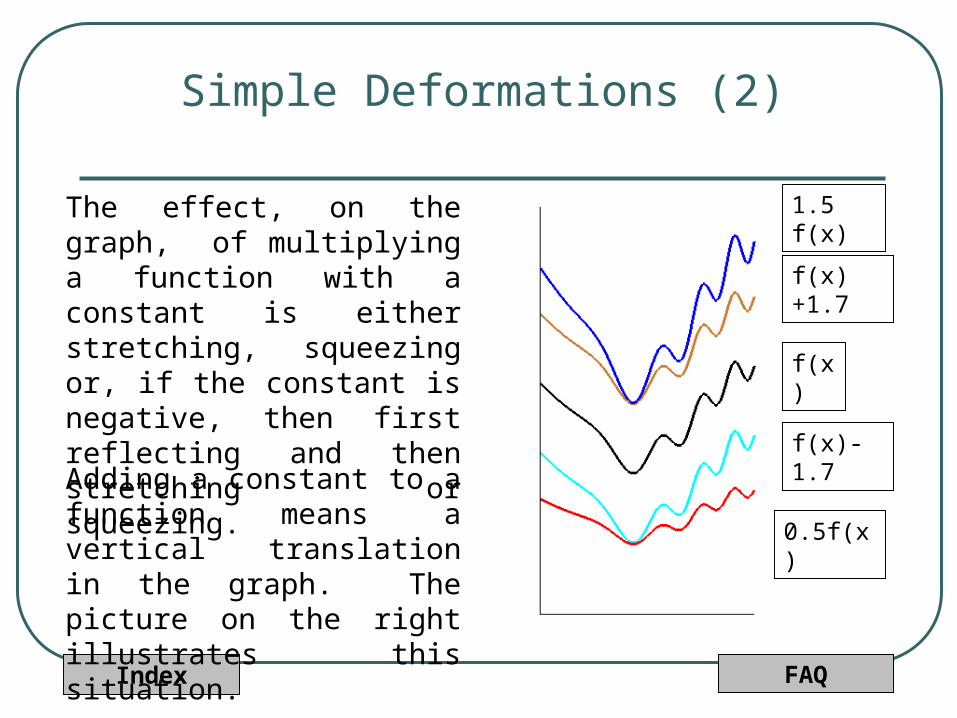
Simple Deformations (2)
f(x)-1.7
f(x)+1.7
The effect, on the graph, of multiplying a function with a constant is either stretching, squeezing or, if the constant is negative, then first reflecting and then stretching or squeezing.
Adding a constant to a function means a vertical translation in the graph. The picture on the right illustrates this situation.
Index FAQ
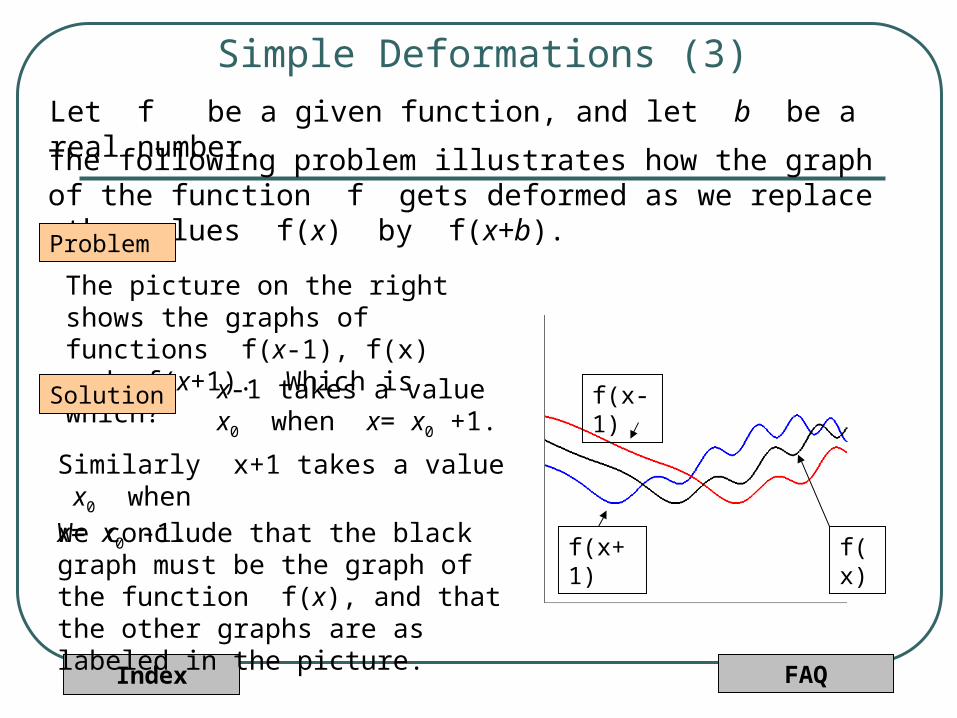
Simple Deformations (3)Let f be a given function, and let b be a real number.
The following problem illustrates how the graph of the function f gets deformed as we replace the values f(x) by f(x+b).
Problem
The picture on the right shows the graphs of functions f(x-1), f(x) and f(x+1). Which is which?
f(x)
f(x-1)
f(x+1)
Solution x-1 takes a value x0 when x= x0 +1.
Similarly x+1 takes a value x0 when
x= x0 -1. We conclude that the black graph must be the graph of the function f(x), and that the other graphs are as labeled in the picture.