Embed Size (px)
DESCRIPTION
Independent Evaluation of Budget Support to Tanzania 2005/06 – 2011/12. Presentation of conclusions and their implications Andrew Lawson Copenhagen, November 2013. Objective of the Evaluation. - PowerPoint PPT Presentation
Citation preview

Independent Evaluation of Budget Support to Tanzania
2005/06 – 2011/12Presentation of conclusions and their
implicationsAndrew Lawson
Copenhagen, November 2013

Objective of the Evaluation
To Assess: How effective have GBS & SBS been in contributing to sustainable results on growth and poverty reduction (2006-12)?
1.How successful have GBS and SBS been in providing the means to the Government of Tanzania to implement its national and sectoral strategies?2.How successful have GBS and SBS been in facilitating improvements in the design and implementation of these strategies?3.As a consequence, how successful have GBS and SBS been in attaining successful outcomes and impacts on growth and poverty reduction?

1.How successful have GBS and SBS been in providing the means to the Government of Tanzania to implement its national and sectoral strategies?
Budget Support has been a major source of public funding – US $ 5 billion over 7 years, on
average$690 million or $16 per head per year
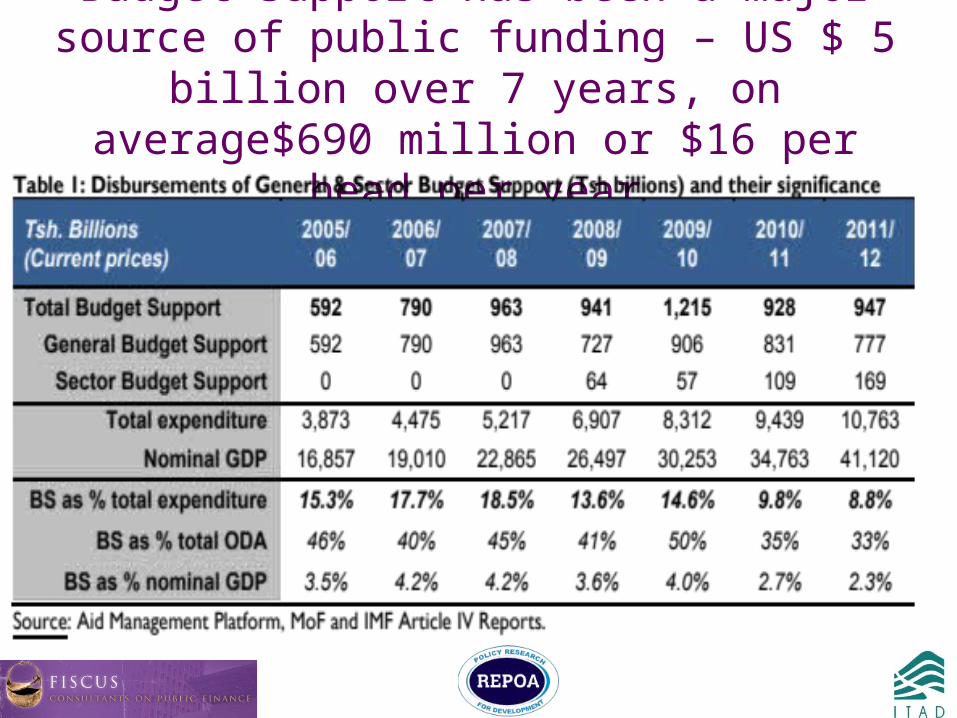
Budget Support has comprised 37% of ODA…and 13.7% of public spending

The annual predictability of BS Funds has been better than other modalities
(actual annual disbursements as % of planned disbursement)Source: Own computation from data provided by MoF
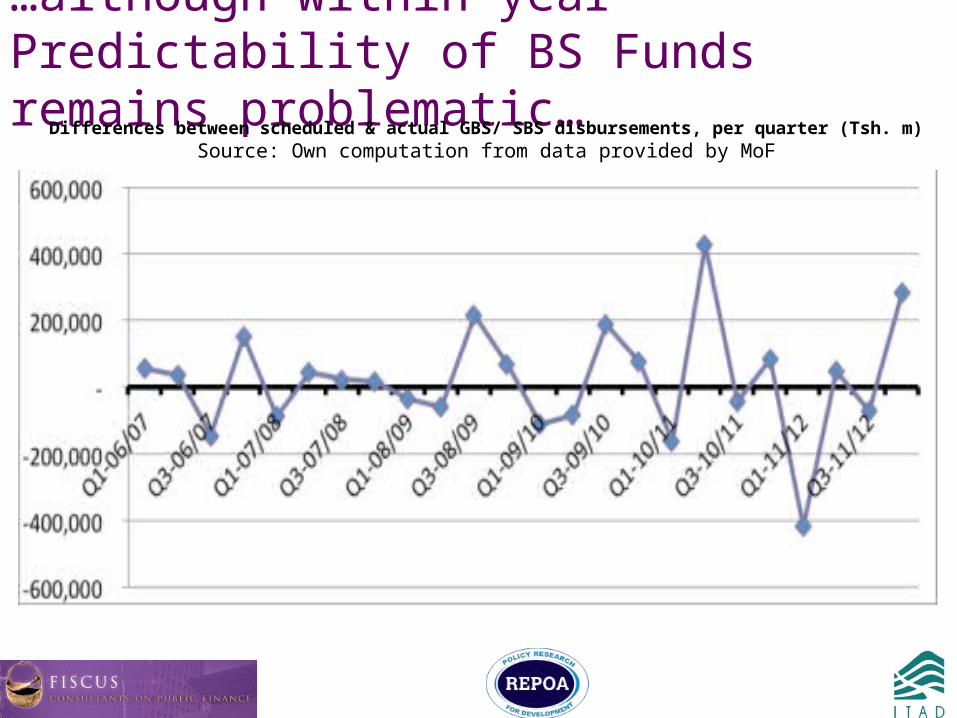
…although within-year Predictability of BS Funds remains problematic…
Differences between scheduled & actual GBS/ SBS disbursements, per quarter (Tsh. m)Source: Own computation from data provided by MoF
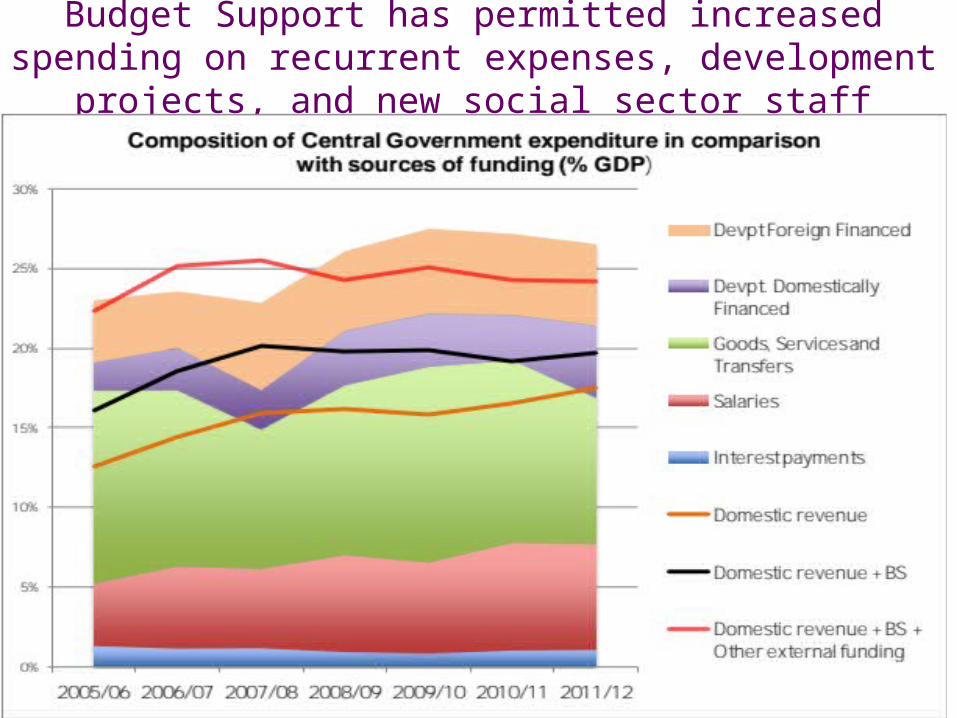
Budget Support has permitted increased spending on recurrent expenses, development projects, and new social sector staff
……..
8
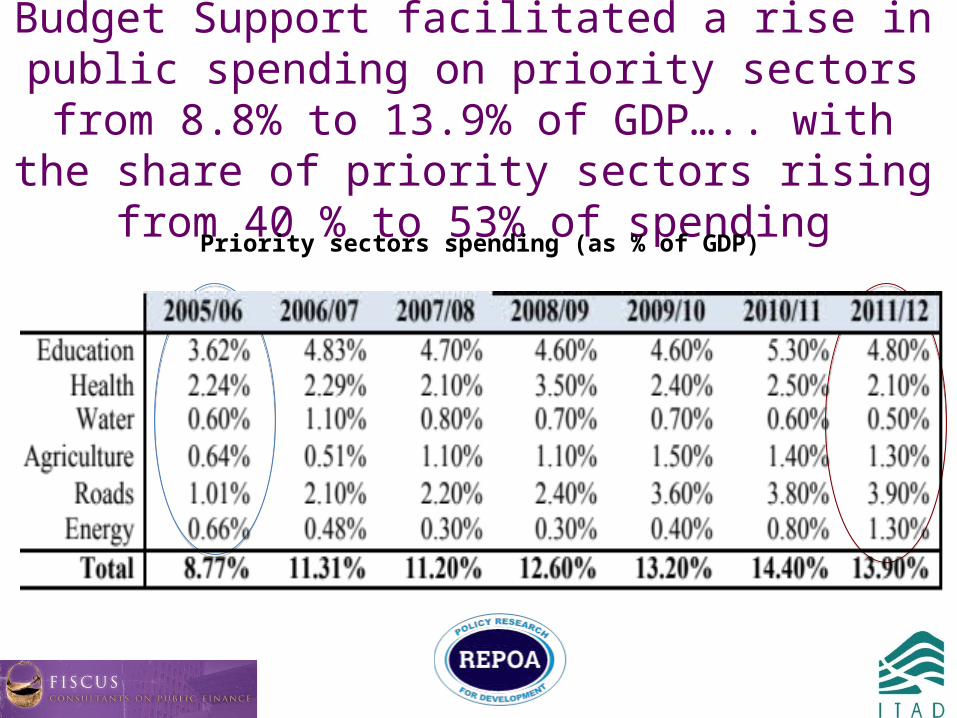
Budget Support facilitated a rise in public spending on priority sectors from 8.8% to 13.9% of GDP…..
with the share of priority sectors rising from 40 % to 53% of spending
Priority sectors spending (as % of GDP)
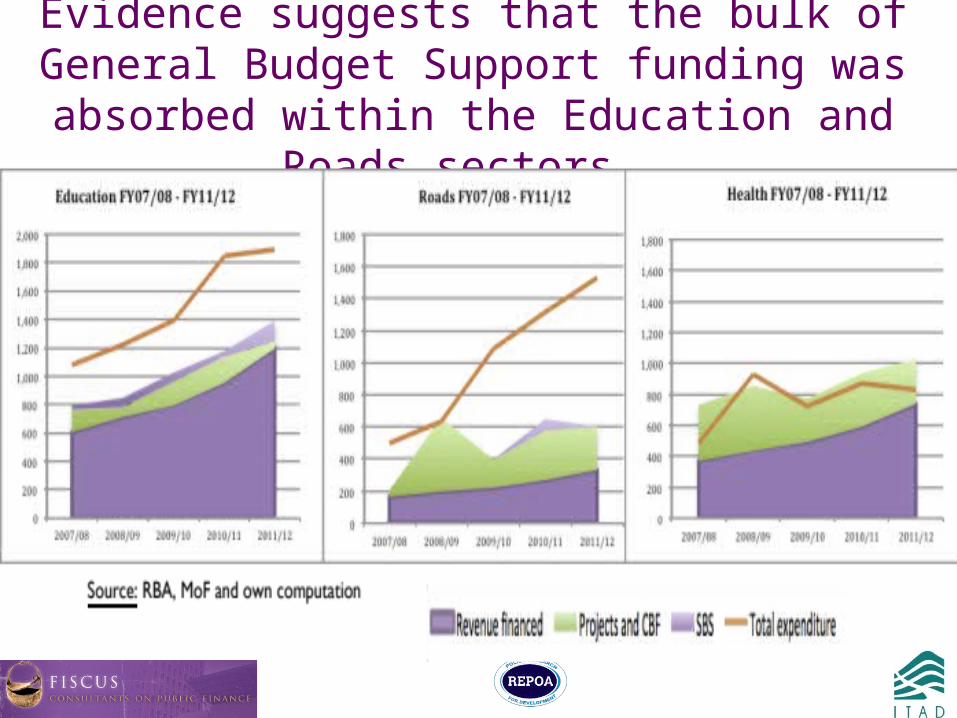
Evidence suggests that the bulk of General Budget Support funding was absorbed within the Education
and Roads sectors……
Contributing the means to implement Government policies:
• Budget Support has allowed public spending to be 13 % higher than it otherwise would have been
• BS funding has been significantly more predictable than other modalities, but could be better
• This funding allowed expansion of social sector staffing, of non-salary recurrent spending, and of Development spending
• Additional spending accrued to the 6 Priority Sectors but especially to the Education and Road sectors
3. How successful have GBS and SBS been in attaining successful outcomes and impacts on growth and poverty reduction?
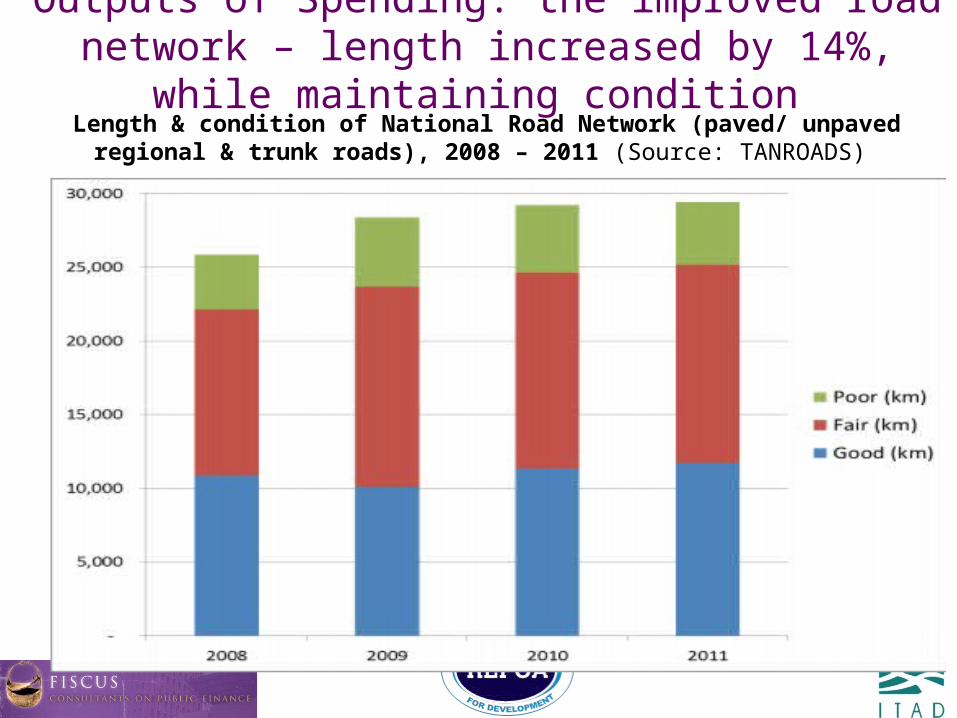
Outputs of Spending: the improved road network – length increased by 14%, while maintaining condition
Length & condition of National Road Network (paved/ unpaved regional & trunk roads), 2008 – 2011 (Source: TANROADS)
Improved Outputs & outcomes in the Education Sector…..
Enrolment in primary schools doubled, with a GER of 102.3% in 2011 and 98.4% in 2012, while the Net Enrolment Rate (NER) was 94% in 2011 and 92% in 2012.
Transition rate from primary to secondary education more than doubled from 20.2% in 2006 to 53.6% in 2012. The 2ary GER rose from 9.4% in 2005 to 36.9% in 2012.
The number of university students rose from 45,500 in 2005/6 to 139,600 in 2010/11.
Gender parity in enrolment has been achieved at primary level.

…but also many continuing challenges in the Education Sector
Quality of education remains an issue: o From 2007 to 2010 20% drop in the pass rate for the primary school leavers
exam,o although an increase in the pass rates was achieved from 2010 to 2011.
Secondary Pass rates remain very low, especially for Community Schoolso In 2011, 10% of pupils passed the Certificate of Secondary Education
Examination, a fall from 11.6% in 2010.o Pass rates vary according to type of school. In 2011 was 41.2% for
seminaries, 35.1% for Government Schools, 19.5 % for Non-Government Schools and 6% for Community Schools.
Teacher retention is a key difficulty in rural areas.
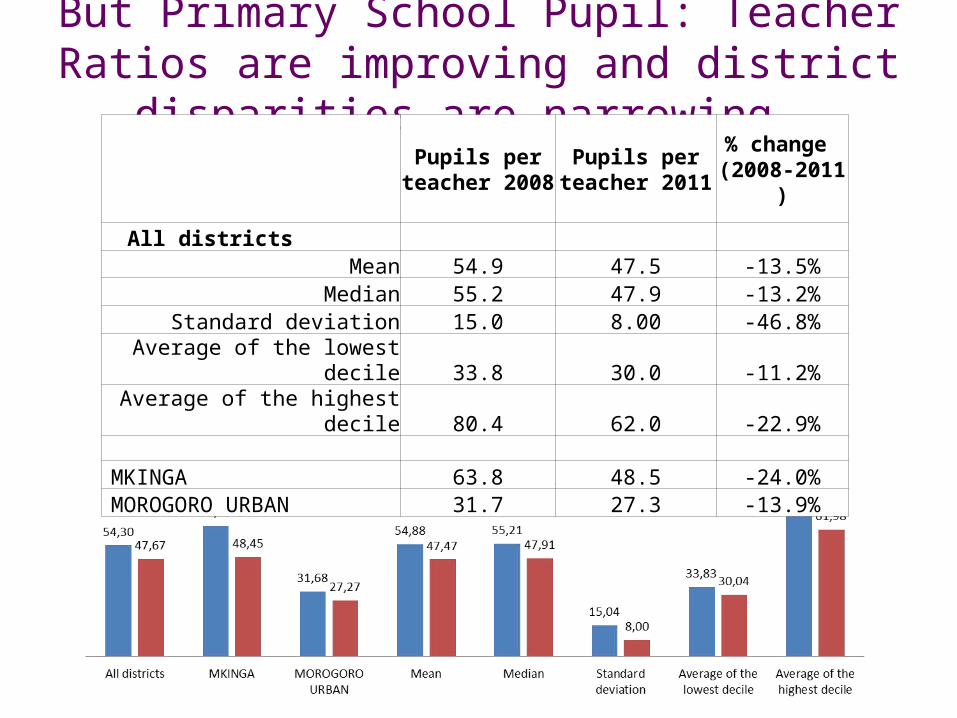
But Primary School Pupil: Teacher Ratios are improving and district disparities are narrowing..
Pupils per teacher
2008
Pupils per teacher 2011
% change (2008-2011 )
All districts Mean 54.9 47.5 -13.5%
Median 55.2 47.9 -13.2% Standard deviation 15.0 8.00 -46.8%
Average of the lowest decile 33.8 30.0 -11.2%
Average of the highest decile 80.4 62.0 -22.9%
MKINGA 63.8 48.5 -24.0%MOROGORO URBAN 31.7 27.3 -13.9%
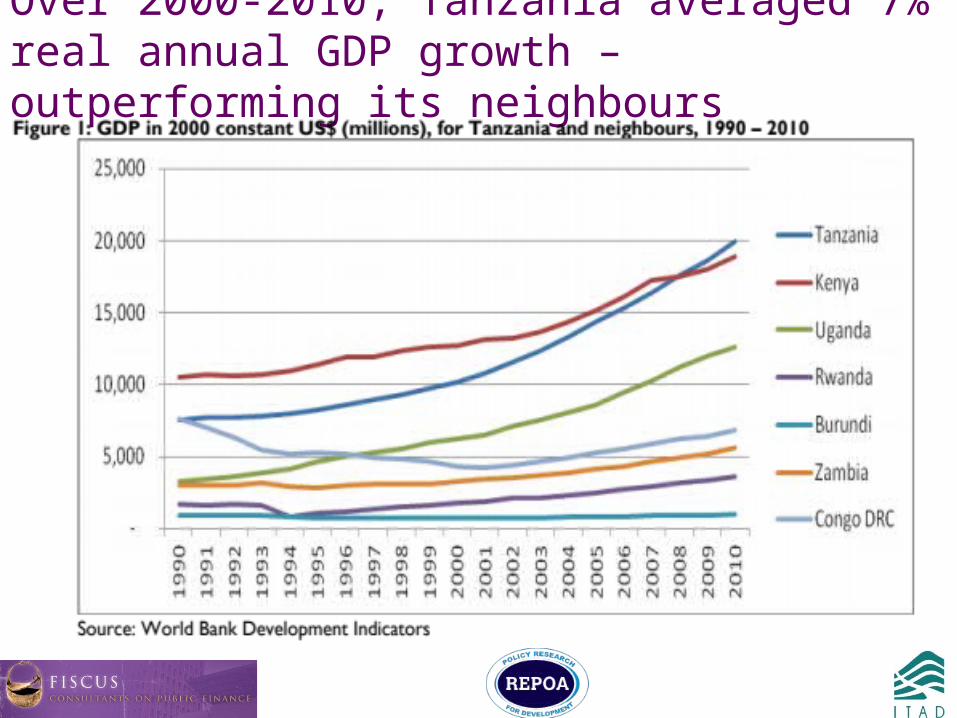
Over 2000-2010, Tanzania averaged 7% real annual GDP growth – outperforming its neighbours
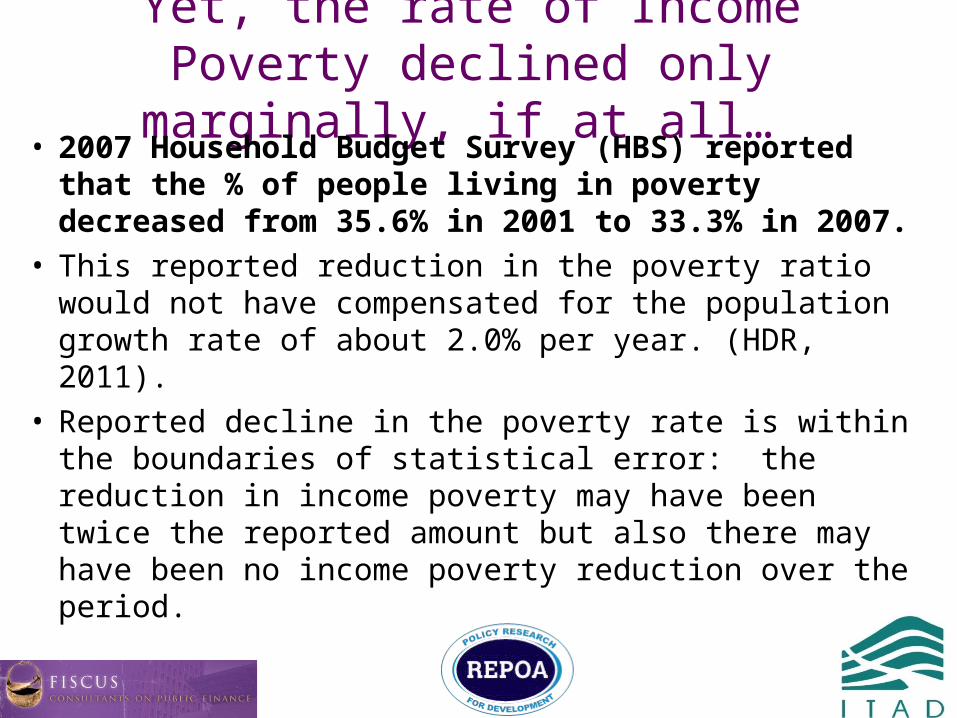
Yet, the rate of Income Poverty declined only marginally, if at all…
• 2007 Household Budget Survey (HBS) reported that the % of people living in poverty decreased from 35.6% in 2001 to 33.3% in 2007.
• This reported reduction in the poverty ratio would not have compensated for the population growth rate of about 2.0% per year. (HDR, 2011).
• Reported decline in the poverty rate is within the boundaries of statistical error: the reduction in income poverty may have been twice the reported amount but also there may have been no income poverty reduction over the period.

On the other hand, there was improvement in indicators of Non-Income Poverty …
From 2000 to 2011, Tanzania’s Human Development Index increased from 0.364 to 0.466 (HDR, 2011), shifting from significantly below the SSA average to slightly above it.
The 2000/1 and 2007 Household Budget Surveys (HBS) show improvements in some indications of welfare (education and ownership of assets).
Since 2003, HIV prevalence in adults (15-49 years) has declined in both males and females.
There has been progress in the reduction of under five and infant mortality and Tanzania is now on track to meet MDG4.
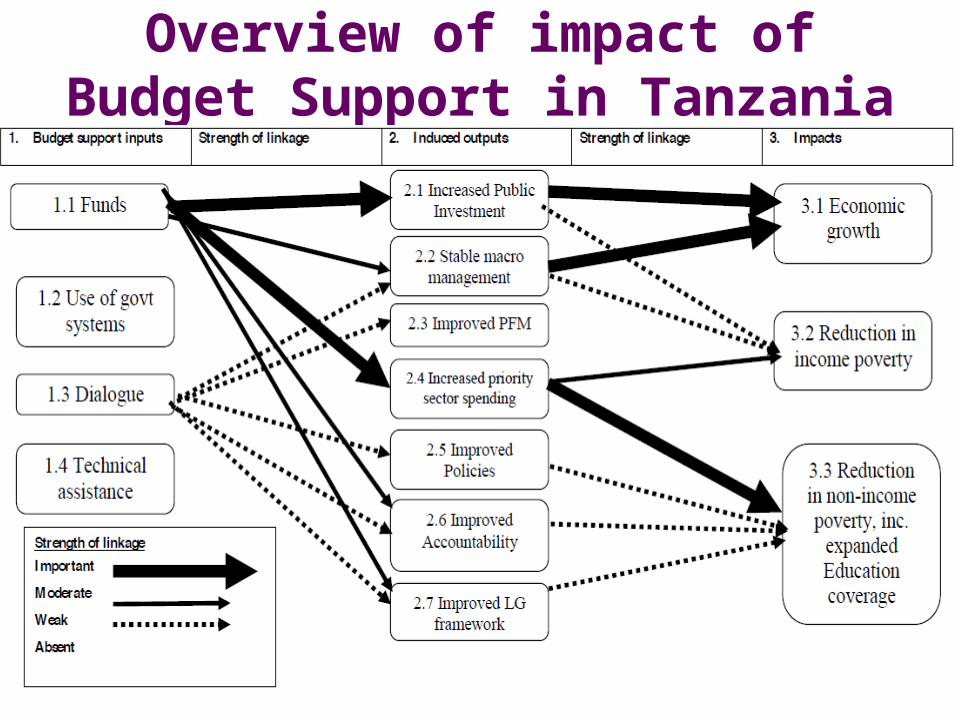
Overview of impact of Budget Support in Tanzania
2. How successful have GBS and SBS been in facilitating improvements in the design and implementation of Government policies and strategies?
Budget Support as a mechanism for better policy dialogue (& implementation)
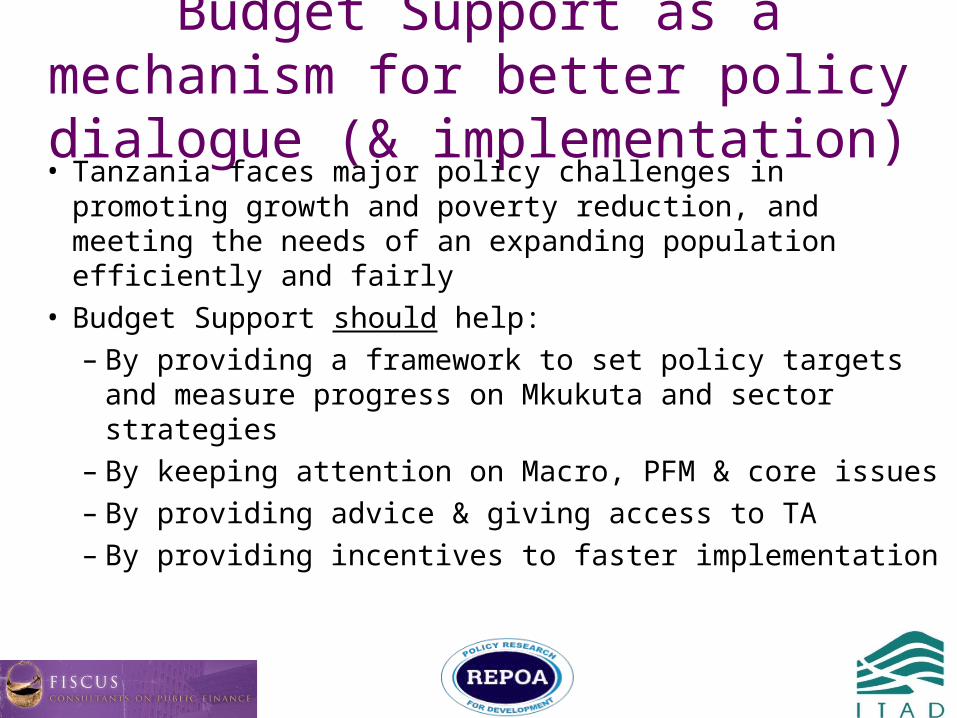
• Tanzania faces major policy challenges in promoting growth and poverty reduction, and meeting the needs of an expanding population efficiently and fairly
• Budget Support should help: – By providing a framework to set policy targets and
measure progress on Mkukuta and sector strategies – By keeping attention on Macro, PFM & core issues– By providing advice & giving access to TA– By providing incentives to faster implementation
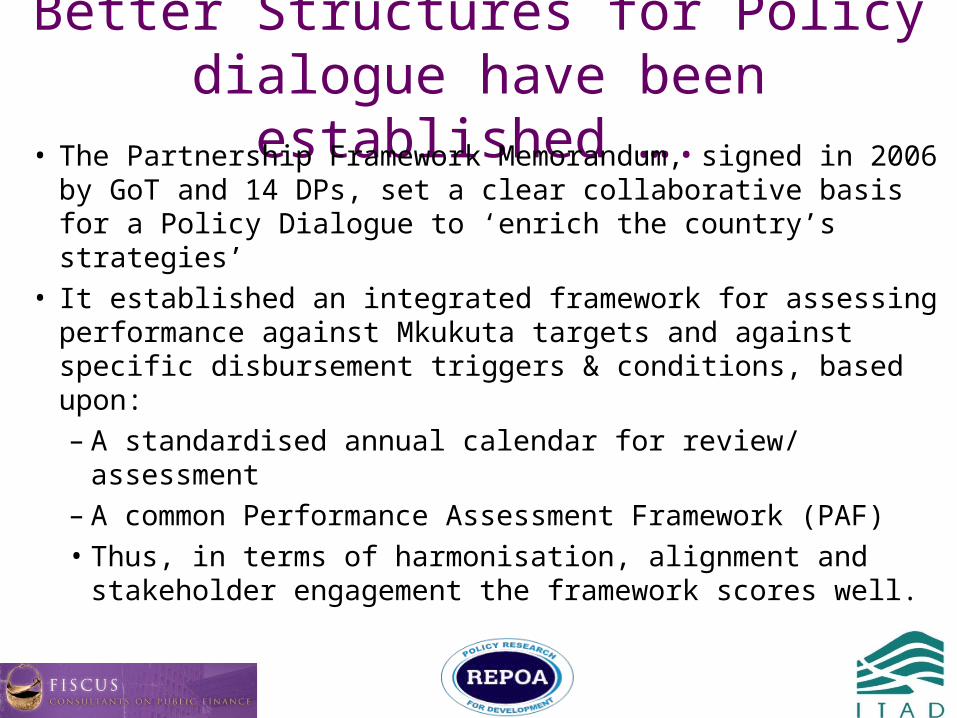
Better Structures for Policy dialogue have been established ….
• The Partnership Framework Memorandum, signed in 2006 by GoT and 14 DPs, set a clear collaborative basis for a Policy Dialogue to ‘enrich the country’s strategies’
• It established an integrated framework for assessing performance against Mkukuta targets and against specific disbursement triggers & conditions, based upon: – A standardised annual calendar for review/ assessment– A common Performance Assessment Framework (PAF)• Thus, in terms of harmonisation, alignment and
stakeholder engagement the framework scores well.

And Budget Support has been influential in certain policy results ….
• Budget Support has contributed to:– Consistent political and administrative commitment to
the PFM reform programme – Consistent support for the Road Fund and related
road maintenance arrangements– The introduction of Capitation Grants for secondary
schools– The introduction of Budget Transparency targets– The establishment of the high-level dialogue on
Corruption
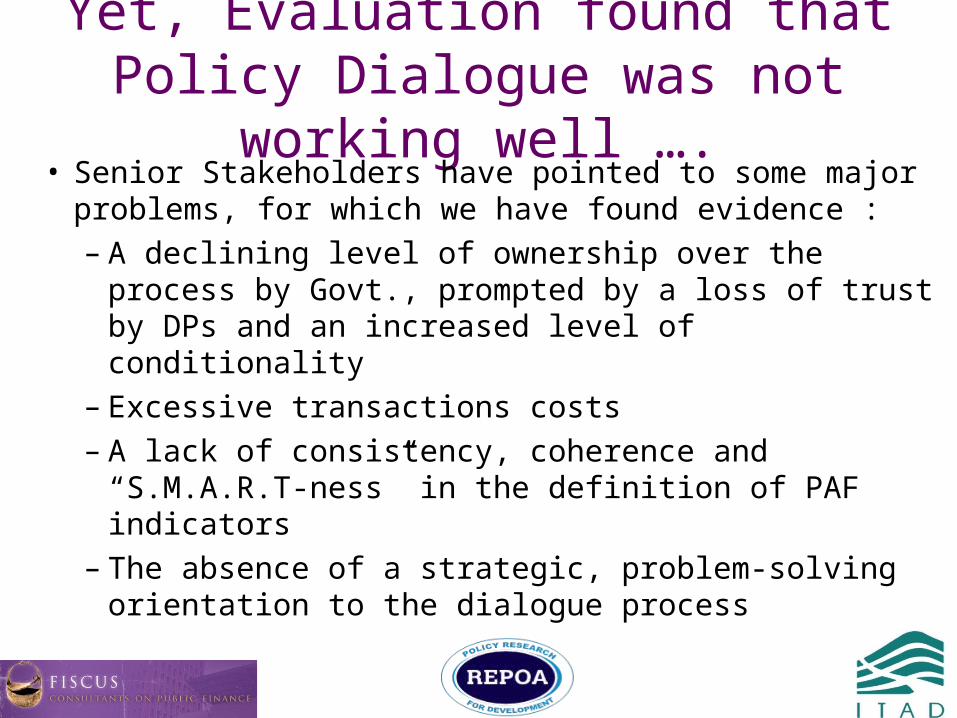
Yet, Evaluation found that Policy Dialogue was not working well ….
• Senior Stakeholders have pointed to some major problems, for which we have found evidence :– A declining level of ownership over the process by
Govt., prompted by a loss of trust by DPs and an increased level of conditionality
– Excessive transactions costs – A lack of consistency, coherence and “S.M.A.R.T-ness”
in the definition of PAF indicators – The absence of a strategic, problem-solving
orientation to the dialogue process
Government’s ownership and leadership of Policy Dialogue has declined ….
• In 2005/06, the spirit of partnership was strong :– Targets in the PAF related closely to Mkukuta and the
principles in the Partnership Framework Memorandum– MoF officials participated actively in defining targets. • By 2011, far from a Govt-led framework, PAF had
developed into ‘the sum total of all DPs’ individual preferences and requirements’ (Claussen & Martinsen, 2011)
• After EPA scandal in 2007, trust was lost and PAF changed from a joint monitoring mechanism to a DP-led instrument to exert ‘policy leverage’.

Transaction Costs of Annual Assessment & related Policy Dialogue have increased• Assessment process has become more burdensome with
more indicators, more meetings, larger reports being written, and assessments finalised later in the year due to time taken to bring necessary information together.
• PAF indicators grew from 55 in 2004/05 to 89 in 2007/08 PAF Indicators by type and year
FY 05 / 06 FY 06 / 07 FY 07 / 08 FY 08 / 09 FY 09 / 10 FY 10 / 11 FY 11/12
Outcome indicator 20 26 34 34 37 34 36
Temporary process 20 20 32 25 25 12 12
Underlying process 24 22 23 14 20 14 8Total 64 68 89 73 82 60 56

Poor coherence, consistency and quality of PAF indicators undermine their value..
• Over 12% of PAF indicators have proven unmeasureable• Of 64 TPAs ‘partially completed’, ‘not completed’ or
‘delayed’, only 16 (25%) were followed up in the next year• In 4 out of 6 years, over 35% of indicators were new.
Total of new indicators each year FY 06 / 07 FY 07 / 08 FY 08 / 09 FY 09 / 10 FY 10 / 11 FY 11/12
Outcome indicator 3 7 12 9 13 23
Temporary process 13 29 24 0 10 12
Underlying process 0 2 3 6 0 1Total New Indicators 16 38 39 15 23 36As % of total indicators 24% 43% 53% 18% 38% 64%
Tentative conclusions & some implications• Budget Support facilitated expanded spending on priority
sectors and brought benefits in service delivery.• There has been steady progress in PFM reform, in
transparency & in strengthening of anti-corruption work.• Non-income poverty has fallen. • These are important results which should be celebrated.But…• The Policy dialogue process is not working effectively.• As a result, important policy problems remain unresolved.• Put simply, Budget Support scores 6.5 out of 10, where
there is a potential for 8 or 9, out of 10.