Embed Size (px)
Citation preview
IBO New York CityIndependent Budget OfficeRonnie Lowenstein, Director
110 William St., 14th floorNew York, NY 10038Tel. (212) 442-0632
Fax (212) [email protected] www.ibo.nyc.ny.us
Fiscal Brief New York City Independent Budget Office
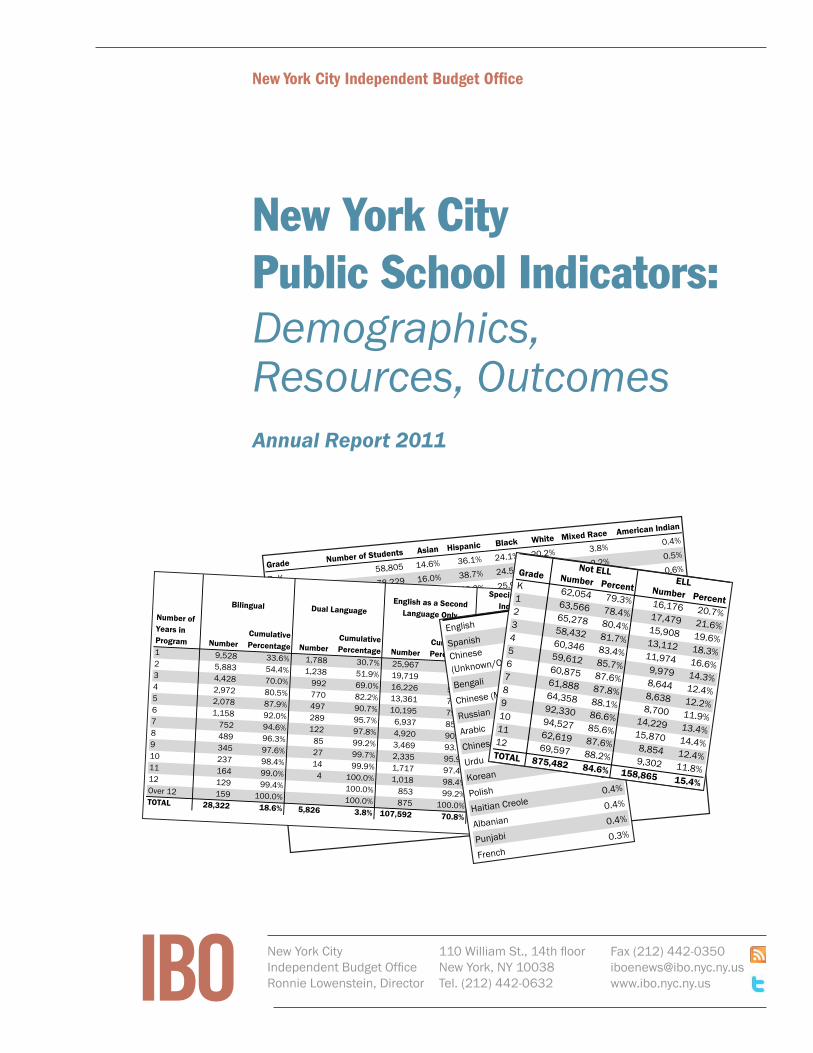
New York CityPublic School Indicators:Demographics, Resources, OutcomesAnnual Report 2011
Grade Number of Students Asian Hispanic Black White Mixed Race American Indian
Pr-K 58,805 14.6% 36.1% 24.1% 20.2% 3.8% 0.4%
K 78,229 16.0% 38.7% 24.5% 17.5% 2.2% 0.5%
1 81,045 15.0% 40.2% 25.9% 16.7% 1.0% 0.6%
2 81,186 14.8% 40.8% 27.7% 15.5% 0.4% 0.5%
3 71,544 14.8% 40.4% 28.4% 15.4% 0.5% 0.4%
4 72,320 15.8% 39.4% 28.8% 15.1% 0.5% 0.3%
5 69,591 15.2% 40.1% 29.3% 14.6% 0.4% 0.3%
6 69,519 15.0% 40.1% 30.3% 13.8% 0.3% 0.4%
7 70,526 15.4% 39.9% 30.7% 13.4% 0.3% 0.3%
8 73,058 15.3% 39.6% 30.9% 13.6% 0.2% 0.3%
9 106,559 13.2% 40.0% 32.7% 11.5% 0.3% 0.4%
10 110,397 13.7% 39.7% 34.5% 11.0% 0.3% 0.4%
11 71,473 16.0% 37.4% 32.6% 13.2% 0.2% 0.4%
12 78,899 14.8% 37.1% 34.7% 12.6% 0.2% 0.4%
TOTAL1,093,151
14.9% 39.3% 29.9% 14.3% 0.7%
0.4%
Table 2.3
Student Ethnicity by Grade, 2009-2010
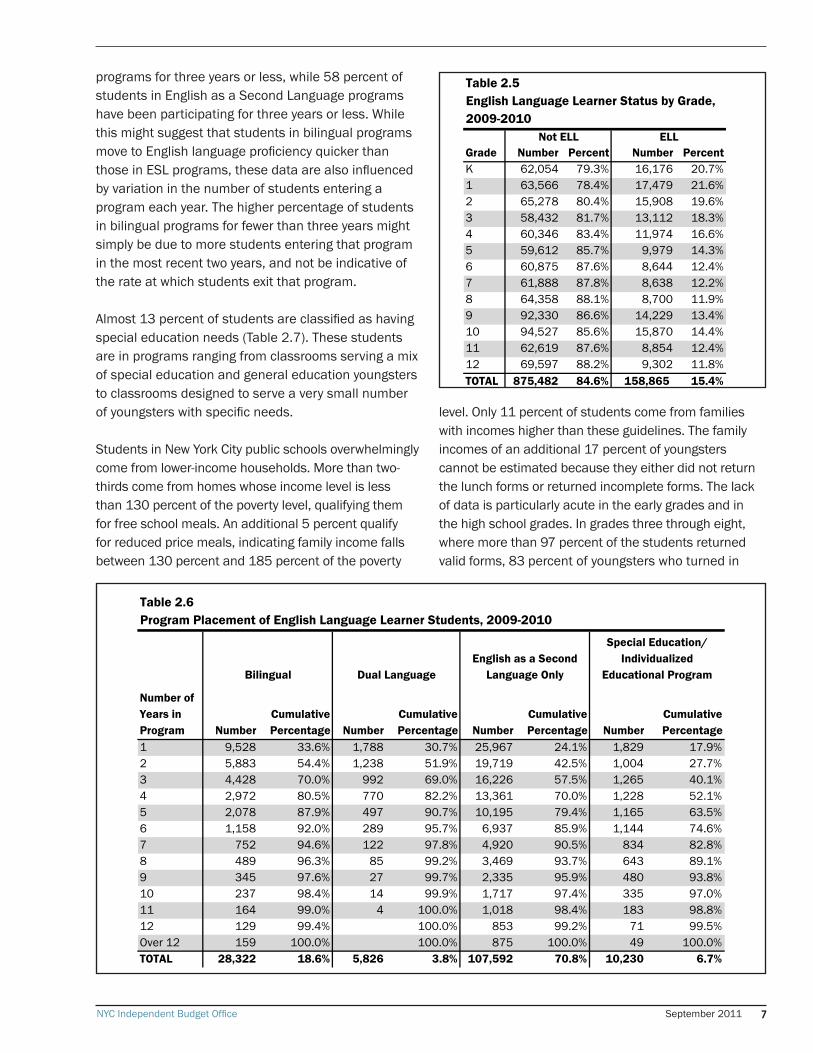
Number of Years in Program Number
Cumulative Percentage Number
Cumulative Percentage Number
Cumulative Percentage Number
Cumulative Percentage
1 9,528 33.6% 1,788 30.7% 25,967 24.1% 1,829 17.9%2 5,883 54.4% 1,238 51.9% 19,719 42.5% 1,004 27.7%3 4,428 70.0% 992 69.0% 16,226 57.5% 1,265 40.1%4 2,972 80.5% 770 82.2% 13,361 70.0% 1,228 52.1%5 2,078 87.9% 497 90.7% 10,195 79.4% 1,165 63.5%6 1,158 92.0% 289 95.7% 6,937 85.9% 1,144 74.6%7 752 94.6% 122 97.8% 4,920 90.5% 834 82.8%8 489 96.3% 85 99.2% 3,469 93.7% 643 89.1%9 345 97.6% 27 99.7% 2,335 95.9% 480 93.8%10 237 98.4% 14 99.9% 1,717 97.4% 335 97.0%11 164 99.0% 4 100.0% 1,018 98.4% 183 98.8%12 129 99.4% 100.0% 853 99.2% 71 99.5%Over 12 159 100.0% 100.0% 875 100.0% 49 100.0%TOTAL 28,322 18.6% 5,826 3.8% 107,592 70.8% 10,230 6.7%
Bilingual Dual LanguageEnglish as a Second
Language Only
Special Education/Individualized
Educational Program
Table 2.6Program Placement of English Language Learner Students, 2009-2010
English60.6%
Spanish23.1%
Chinese
(Unknown/Other)2.5%
Bengali1.9%
Chinese (Mandarin)1.7%
Russian1.5%
Arabic1.2%
Chinese (Cantonese)1.1%
Urdu
1.0%
Korean0.6%
Polish
0.4%
Haitian Creole0.4%
Albanian0.4%
Punjabi0.4%
French0.3%
Table 2.4
Fifteen Languages Most
Commonly Spoken at Home,
Grades K-2, 2009-2010
Grade Number Percent Number PercentK 62,054 79.3% 16,176 20.7%1 63,566 78.4% 17,479 21.6%2 65,278 80.4% 15,908 19.6%3 58,432 81.7% 13,112 18.3%4 60,346 83.4% 11,974 16.6%5 59,612 85.7% 9,979 14.3%6 60,875 87.6% 8,644 12.4%7 61,888 87.8% 8,638 12.2%8 64,358 88.1% 8,700 11.9%9 92,330 86.6% 14,229 13.4%10 94,527 85.6% 15,870 14.4%11 62,619 87.6% 8,854 12.4%12 69,597 88.2% 9,302 11.8%TOTAL 875,482 84.6% 158,865
15.4%
Table 2.5English Language Learner Status by Grade, 2009-2010
Not ELLELL
NYC Independent Budget Office September 2011 c
Contents
1
2
3
4
Background and Introduction . . . . . . . . . 1
Who Are New York City’s Public School Students? . . . . . . . . . . 5
What Resources Are Made Available To Our Public Schools? . . . . . . . . . . 13
What Do Some Indicators of School Performance Show? . . . . . . 29
Appendix: List of Schools Opened And Closed Each Year Since 2005-2006 . . .39
NYC Independent Budget Office September 2011 1
In 2009, the state law granting the Mayor control of the New York City public school system was renewed. That renewal included a requirement that the New York City Independent Budget Office “enhance official and public understanding” of educational matters of the school system. The law also requires the Chancellor of the school system to provide IBO with the data that we deem necessary to conduct our analyses. That data began to flow to IBO at the beginning of the 2010-2011 school year.
This report is our first annual summary of that data. Over the course of the last year, we have issued a number of detailed analyses of specific topics, and we will continue to produce those types of reports. This current report is designed as a descriptive overview of the school system rather than as an in-depth look at particular issues. It is organized into three main sections. The first presents demographic information on the students who attend New York City’s public schools. The next section describes the resources—budgets, school staff, and buildings—that the school system utilizes. The final section describes the measurable outcomes of the school system’s efforts for particular subgroups of students.
While this report presents a great deal of information, it is not exhaustive. Some important questions cannot be answered in this type of purely descriptive format. IBO will address those issues in more detailed and analytically sophisticated reports. Moreover, we expect that future editions of this report will include more indicators as we further develop and expand the data. With the exception of the citywide budget information presented in section three, all data in this report refers to students and staff of the New York City public school system. This data does not include students or staff in public charter schools or in publicly financed private special education programs.
With very few exceptions, the data presented herein represents IBO’s analysis of individual student or staff data obtained from the Department of Education (DOE).
This report presents citywide summaries of our data. For some of our indicators, school-level data is available and can be viewed for individual schools at our Web site: http://www.iboeducation.us.
A Few Notes on Data Sources
Student Demographics and Outcomes are derived from individual student records maintained by the Department of Education and provided to IBO for each of the last 10 years. These records include basic biographical information, achievement test scores, attendance records and information on students’ entry to, exit from, and movement within the school system.
The independent budget office of the city of New York shall be authorized to provide analysis and issue public reports regarding financial and educational matters of the city district, to enhance official and public understanding of such matters…
New York State Education Law § 2590-u.
Background andIntroduction1
NYC Independent Budget Office September 20112
Separate files contain information on the high school admissions process, allowing us to describe the choices made by students and their eventual placement in high school.
Students move in and out of the school system throughout the school year. The files provided to us by the DOE include information on all students who were “active” on a school’s register at any point in a particular school year. For this reason, we are often reporting on a larger number of students than are reported on the school system’s official count of enrollment. That figure, called the audited register, is drawn by the school system on October 31st of each year, and represents the number of students enrolled on that day. The numbers of students reported in our tables will also vary depending upon missing data for a particular indicator. If, for example, we are reporting data on the ethnicity of students, we drop any students whose ethnicity was not identified in our data.
Because we report data on all students for whom we have data, our achievement numbers differ from the official numbers maintained by the New York State Education Department. These differences are very small, often amounting to no more than a tenth of a percentage point. Official achievement statistics are readily available on both the DOE and New York State Education Department Web sites.
Unless otherwise noted, the student data presented in this report is for the 2009-2010 school year, the most recent year for which full data was available.
Budget data is derived from two sources. The Mayor’s Office of Management and Budget (OMB) provides information on the funding of the school system and on the broad allocations made to the system through the annual budget as proposed by the Mayor, and as amended and adopted by the City Council. Much of this data is available to the public in summarized form in periodic budget reports at OMB’s Web site. We have access to the same information in greater detail and in real time through the city’s Financial Management System. The second source of budget data—being reported to the public for the first time on a citywide basis in this report—is the use of budgetary resources as determined by individual school principals. The source of that data is an internal report provided by the DOE to IBO on a monthly basis over the last year called the School Leadership Team (SLT) View. It provides a detailed accounting of the source and use of every dollar controlled by the principal of each public school in the city. We used the report from June 2011 to produce the summaries presented herein.
Principal and Teacher data is derived from individual personnel records maintained by the DOE and provided to IBO for each of the last 10 years. In addition to demographic and assignment data, these files indicate the use of alternative pathways (Teach for America, Teaching Fellows, the Leadership Academy, etc.) by individual staff. Much of this data is being reported to the public for the first time in this report.
NYC Independent Budget Office September 2011 3
Building and Class Size data has been taken from DOE reports that are available to the general public on the DOE’s Web site, particularly the “Blue Book” and the Class Size Report.
School Level data was taken from the DOE’s Web site to classify schools as either new or existing schools, and to categorize schools based upon the poverty level of their students. Student poverty level is derived from students’ eligibility for free or reduced-price meals, which is determined by their family income level. We have classified schools into three categories. High poverty includes schools in the top third of schools in a particular level (elementary, middle school, and high school) in terms of the percent of students eligible for free or reduced meals. Medium-poverty indicates that a school is in the middle third of schools in their level and low poverty indicates that a school is in the lowest third. Given the demographics of the city’s public schools, schools in the lowest third of poverty levels may still have as many as 70 percent of their students classified as low income.
NYC Independent Budget Office September 2011 5
Who Are New York City’s Public School Students?2
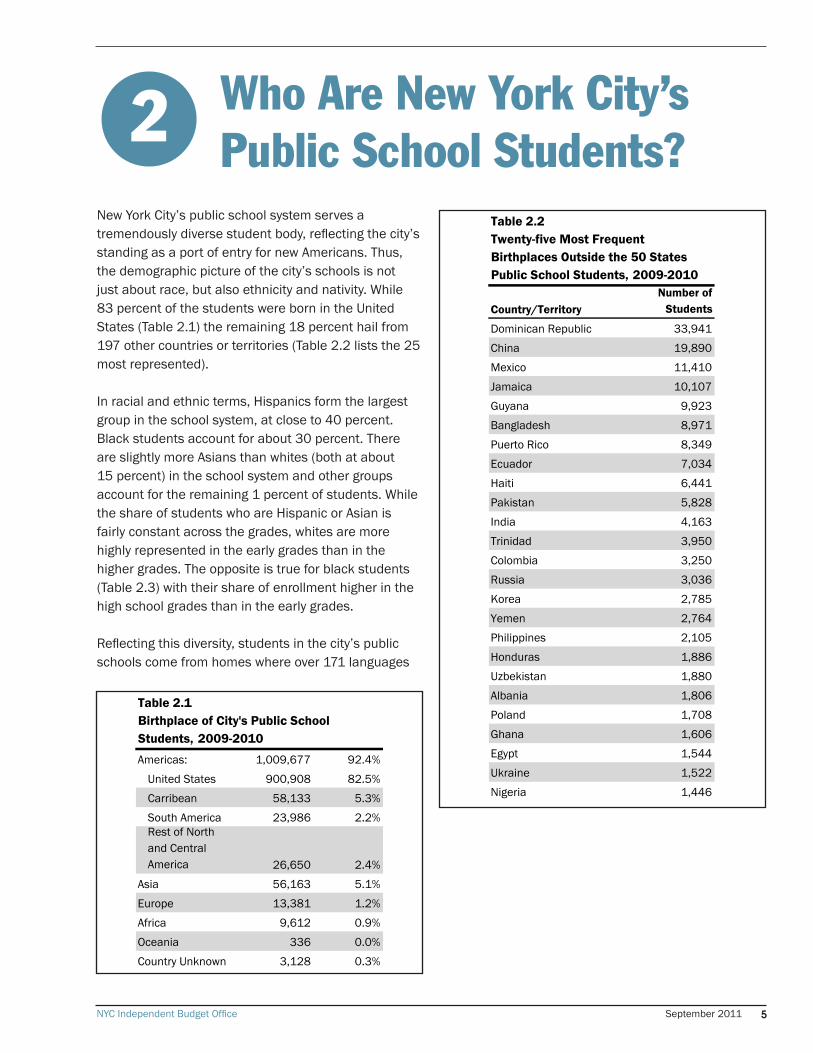
New York City’s public school system serves a tremendously diverse student body, reflecting the city’s standing as a port of entry for new Americans. Thus, the demographic picture of the city’s schools is not just about race, but also ethnicity and nativity. While 83 percent of the students were born in the United States (Table 2.1) the remaining 18 percent hail from 197 other countries or territories (Table 2.2 lists the 25 most represented).
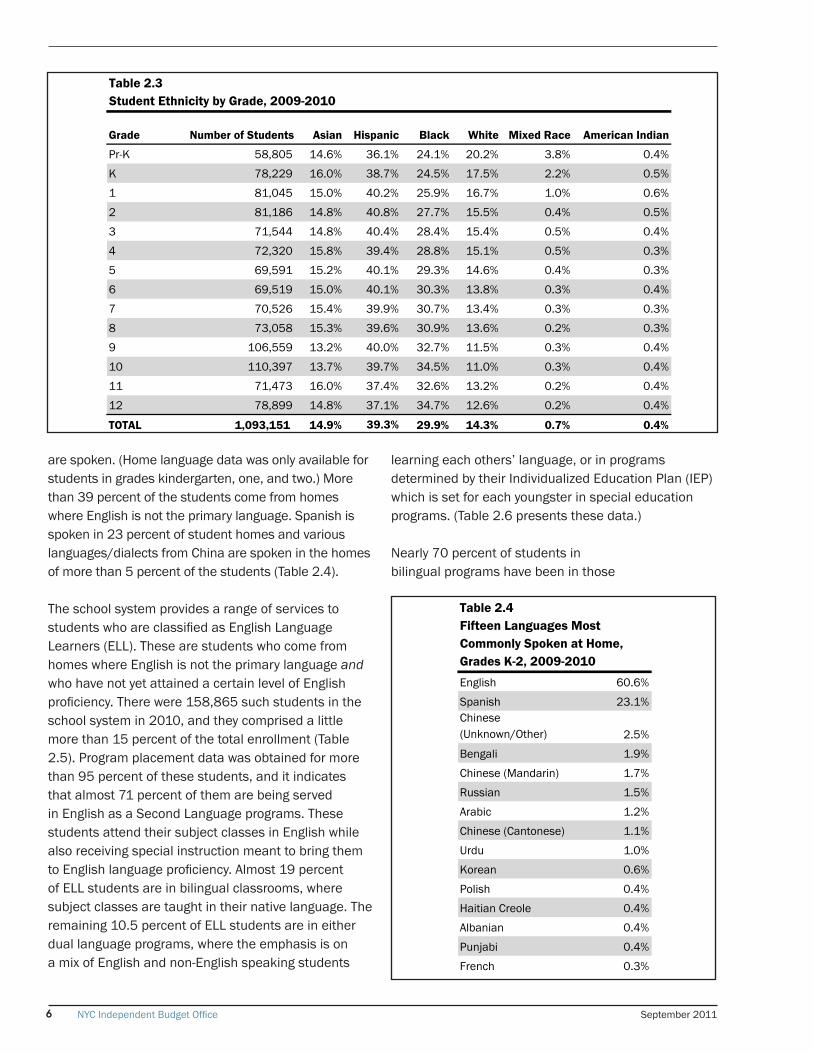
In racial and ethnic terms, Hispanics form the largest group in the school system, at close to 40 percent. Black students account for about 30 percent. There are slightly more Asians than whites (both at about 15 percent) in the school system and other groups account for the remaining 1 percent of students. While the share of students who are Hispanic or Asian is fairly constant across the grades, whites are more highly represented in the early grades than in the higher grades. The opposite is true for black students (Table 2.3) with their share of enrollment higher in the high school grades than in the early grades.
Reflecting this diversity, students in the city’s public schools come from homes where over 171 languages
Americas: 1,009,677 92.4%
United States 900,908 82.5%
Carribean 58,133 5.3%
South America 23,986 2.2%Rest of North and Central America 26,650 2.4%
Asia 56,163 5.1%
Europe 13,381 1.2%
Africa 9,612 0.9%
Oceania 336 0.0%
Country Unknown 3,128 0.3%
Table 2.1 Birthplace of City's Public School Students, 2009-2010
Country/TerritoryNumber of
Students
Dominican Republic 33,941
China 19,890
Mexico 11,410
Jamaica 10,107
Guyana 9,923
Bangladesh 8,971
Puerto Rico 8,349
Ecuador 7,034
Haiti 6,441
Pakistan 5,828
India 4,163
Trinidad 3,950
Colombia 3,250
Russia 3,036
Korea 2,785
Yemen 2,764
Philippines 2,105
Honduras 1,886
Uzbekistan 1,880
Albania 1,806
Poland 1,708
Ghana 1,606
Egypt 1,544
Ukraine 1,522
Nigeria 1,446
Table 2.2Twenty-five Most Frequent Birthplaces Outside the 50 StatesPublic School Students, 2009-2010
NYC Independent Budget Office September 20116
are spoken. (Home language data was only available for students in grades kindergarten, one, and two.) More than 39 percent of the students come from homes where English is not the primary language. Spanish is spoken in 23 percent of student homes and various languages/dialects from China are spoken in the homes of more than 5 percent of the students (Table 2.4).
The school system provides a range of services to students who are classified as English Language Learners (ELL). These are students who come from homes where English is not the primary language and who have not yet attained a certain level of English proficiency. There were 158,865 such students in the school system in 2010, and they comprised a little more than 15 percent of the total enrollment (Table 2.5). Program placement data was obtained for more than 95 percent of these students, and it indicates that almost 71 percent of them are being served in English as a Second Language programs. These students attend their subject classes in English while also receiving special instruction meant to bring them to English language proficiency. Almost 19 percent of ELL students are in bilingual classrooms, where subject classes are taught in their native language. The remaining 10.5 percent of ELL students are in either dual language programs, where the emphasis is on a mix of English and non-English speaking students
learning each others’ language, or in programs determined by their Individualized Education Plan (IEP) which is set for each youngster in special education programs. (Table 2.6 presents these data.)
Nearly 70 percent of students in bilingual programs have been in those
Grade Number of Students Asian Hispanic Black White Mixed Race American Indian
Pr-K 58,805 14.6% 36.1% 24.1% 20.2% 3.8% 0.4%
K 78,229 16.0% 38.7% 24.5% 17.5% 2.2% 0.5%
1 81,045 15.0% 40.2% 25.9% 16.7% 1.0% 0.6%
2 81,186 14.8% 40.8% 27.7% 15.5% 0.4% 0.5%
3 71,544 14.8% 40.4% 28.4% 15.4% 0.5% 0.4%
4 72,320 15.8% 39.4% 28.8% 15.1% 0.5% 0.3%
5 69,591 15.2% 40.1% 29.3% 14.6% 0.4% 0.3%
6 69,519 15.0% 40.1% 30.3% 13.8% 0.3% 0.4%
7 70,526 15.4% 39.9% 30.7% 13.4% 0.3% 0.3%
8 73,058 15.3% 39.6% 30.9% 13.6% 0.2% 0.3%
9 106,559 13.2% 40.0% 32.7% 11.5% 0.3% 0.4%
10 110,397 13.7% 39.7% 34.5% 11.0% 0.3% 0.4%
11 71,473 16.0% 37.4% 32.6% 13.2% 0.2% 0.4%
12 78,899 14.8% 37.1% 34.7% 12.6% 0.2% 0.4%
TOTAL 1,093,151 14.9% 39.3% 29.9% 14.3% 0.7% 0.4%
Table 2.3 Student Ethnicity by Grade, 2009-2010
English 60.6%
Spanish 23.1%Chinese(Unknown/Other) 2.5%
Bengali 1.9%
Chinese (Mandarin) 1.7%
Russian 1.5%
Arabic 1.2%
Chinese (Cantonese) 1.1%
Urdu 1.0%
Korean 0.6%
Polish 0.4%
Haitian Creole 0.4%
Albanian 0.4%
Punjabi 0.4%
French 0.3%
Table 2.4Fifteen Languages Most Commonly Spoken at Home,Grades K-2, 2009-2010
NYC Independent Budget Office September 2011 7
Number of Years in Program Number
Cumulative Percentage Number
Cumulative Percentage Number
Cumulative Percentage Number
Cumulative Percentage
1 9,528 33.6% 1,788 30.7% 25,967 24.1% 1,829 17.9%2 5,883 54.4% 1,238 51.9% 19,719 42.5% 1,004 27.7%3 4,428 70.0% 992 69.0% 16,226 57.5% 1,265 40.1%4 2,972 80.5% 770 82.2% 13,361 70.0% 1,228 52.1%5 2,078 87.9% 497 90.7% 10,195 79.4% 1,165 63.5%6 1,158 92.0% 289 95.7% 6,937 85.9% 1,144 74.6%7 752 94.6% 122 97.8% 4,920 90.5% 834 82.8%8 489 96.3% 85 99.2% 3,469 93.7% 643 89.1%9 345 97.6% 27 99.7% 2,335 95.9% 480 93.8%10 237 98.4% 14 99.9% 1,717 97.4% 335 97.0%11 164 99.0% 4 100.0% 1,018 98.4% 183 98.8%12 129 99.4% 100.0% 853 99.2% 71 99.5%Over 12 159 100.0% 100.0% 875 100.0% 49 100.0%TOTAL 28,322 18.6% 5,826 3.8% 107,592 70.8% 10,230 6.7%
Bilingual Dual LanguageEnglish as a Second
Language Only
Special Education/Individualized
Educational Program
Table 2.6Program Placement of English Language Learner Students, 2009-2010
programs for three years or less, while 58 percent of students in English as a Second Language programs have been participating for three years or less. While this might suggest that students in bilingual programs move to English language proficiency quicker than those in ESL programs, these data are also influenced by variation in the number of students entering a program each year. The higher percentage of students in bilingual programs for fewer than three years might simply be due to more students entering that program in the most recent two years, and not be indicative of the rate at which students exit that program.
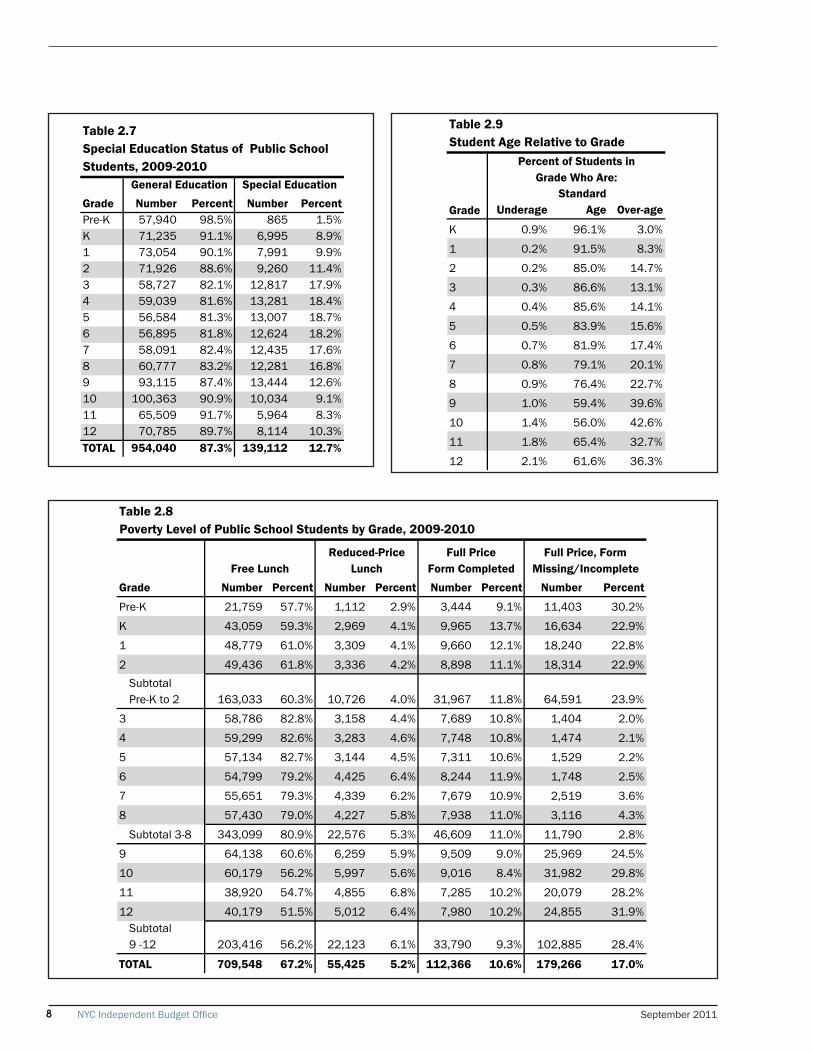
Almost 13 percent of students are classified as having special education needs (Table 2.7). These students are in programs ranging from classrooms serving a mix of special education and general education youngsters to classrooms designed to serve a very small number of youngsters with specific needs.
Students in New York City public schools overwhelmingly come from lower-income households. More than two-thirds come from homes whose income level is less than 130 percent of the poverty level, qualifying them for free school meals. An additional 5 percent qualify for reduced price meals, indicating family income falls between 130 percent and 185 percent of the poverty
level. Only 11 percent of students come from families with incomes higher than these guidelines. The family incomes of an additional 17 percent of youngsters cannot be estimated because they either did not return the lunch forms or returned incomplete forms. The lack of data is particularly acute in the early grades and in the high school grades. In grades three through eight, where more than 97 percent of the students returned valid forms, 83 percent of youngsters who turned in
Grade Number Percent Number PercentK 62,054 79.3% 16,176 20.7%1 63,566 78.4% 17,479 21.6%2 65,278 80.4% 15,908 19.6%3 58,432 81.7% 13,112 18.3%4 60,346 83.4% 11,974 16.6%5 59,612 85.7% 9,979 14.3%6 60,875 87.6% 8,644 12.4%7 61,888 87.8% 8,638 12.2%8 64,358 88.1% 8,700 11.9%9 92,330 86.6% 14,229 13.4%10 94,527 85.6% 15,870 14.4%11 62,619 87.6% 8,854 12.4%12 69,597 88.2% 9,302 11.8%TOTAL 875,482 84.6% 158,865 15.4%
Table 2.5English Language Learner Status by Grade, 2009-2010
Not ELL ELL
NYC Independent Budget Office September 20118
Grade Number Percent Number PercentPre-K 57,940 98.5% 865 1.5%K 71,235 91.1% 6,995 8.9%1 73,054 90.1% 7,991 9.9%2 71,926 88.6% 9,260 11.4%3 58,727 82.1% 12,817 17.9%4 59,039 81.6% 13,281 18.4%5 56,584 81.3% 13,007 18.7%6 56,895 81.8% 12,624 18.2%7 58,091 82.4% 12,435 17.6%8 60,777 83.2% 12,281 16.8%9 93,115 87.4% 13,444 12.6%10 100,363 90.9% 10,034 9.1%11 65,509 91.7% 5,964 8.3%12 70,785 89.7% 8,114 10.3%TOTAL 954,040 87.3% 139,112 12.7%
Table 2.7 Special Education Status of Public School Students, 2009-2010
General Education Special Education
Grade Number Percent Number Percent Number Percent Number Percent
Pre-K 21,759 57.7% 1,112 2.9% 3,444 9.1% 11,403 30.2%
K 43,059 59.3% 2,969 4.1% 9,965 13.7% 16,634 22.9%
1 48,779 61.0% 3,309 4.1% 9,660 12.1% 18,240 22.8%
2 49,436 61.8% 3,336 4.2% 8,898 11.1% 18,314 22.9%Subtotal Pre-K to 2 163,033 60.3% 10,726 4.0% 31,967 11.8% 64,591 23.9%
3 58,786 82.8% 3,158 4.4% 7,689 10.8% 1,404 2.0%
4 59,299 82.6% 3,283 4.6% 7,748 10.8% 1,474 2.1%
5 57,134 82.7% 3,144 4.5% 7,311 10.6% 1,529 2.2%
6 54,799 79.2% 4,425 6.4% 8,244 11.9% 1,748 2.5%
7 55,651 79.3% 4,339 6.2% 7,679 10.9% 2,519 3.6%
8 57,430 79.0% 4,227 5.8% 7,938 11.0% 3,116 4.3%
Subtotal 3-8 343,099 80.9% 22,576 5.3% 46,609 11.0% 11,790 2.8%
9 64,138 60.6% 6,259 5.9% 9,509 9.0% 25,969 24.5%
10 60,179 56.2% 5,997 5.6% 9,016 8.4% 31,982 29.8%
11 38,920 54.7% 4,855 6.8% 7,285 10.2% 20,079 28.2%
12 40,179 51.5% 5,012 6.4% 7,980 10.2% 24,855 31.9%Subtotal9 -12 203,416 56.2% 22,123 6.1% 33,790 9.3% 102,885 28.4%
TOTAL 709,548 67.2% 55,425 5.2% 112,366 10.6% 179,266 17.0%
Table 2.8 Poverty Level of Public School Students by Grade, 2009-2010
Free LunchReduced-Price
LunchFull Price
Form CompletedFull Price, Form
Missing/Incomplete
Grade UnderageStandard
Age Over-age
K 0.9% 96.1% 3.0%
1 0.2% 91.5% 8.3%
2 0.2% 85.0% 14.7%
3 0.3% 86.6% 13.1%
4 0.4% 85.6% 14.1%
5 0.5% 83.9% 15.6%
6 0.7% 81.9% 17.4%
7 0.8% 79.1% 20.1%
8 0.9% 76.4% 22.7%
9 1.0% 59.4% 39.6%
10 1.4% 56.0% 42.6%
11 1.8% 65.4% 32.7%
12 2.1% 61.6% 36.3%
Table 2.9 Student Age Relative to Grade
Percent of Students inGrade Who Are:
NYC Independent Budget Office September 2011 9
complete forms meet the federal guidelines for either free or reduced-price lunch. (Table 2.8 displays these data.)
Students generally enter kindergarten at the age of 5 and complete high school at age 17 or 18, if they proceed through the grades at the expected pace and if their education is not interrupted. This pattern is far from universal in the city’s public schools. Some students transfer into city schools from other schools, districts, or countries, already behind their age–peers. Others are required to repeat a grade within the school system. Due to these and other factors, almost a quarter of eighth graders in the system are over the standard age for that grade, and that proportion grows to 43 percent in 10th grade, before students begin to drop out in larger numbers, resulting in fewer over-age students in the 11th and 12th grades. Much smaller numbers of students, roughly 2 percent, accelerate their progress and reach 12th grade younger than the standard age. (Table 2.9 displays these data.)
Enrollment in the city school system is dynamic, with varying birth rates and residential patterns affecting important issues such as building utilization and class sizes. In recent years, some neighborhoods
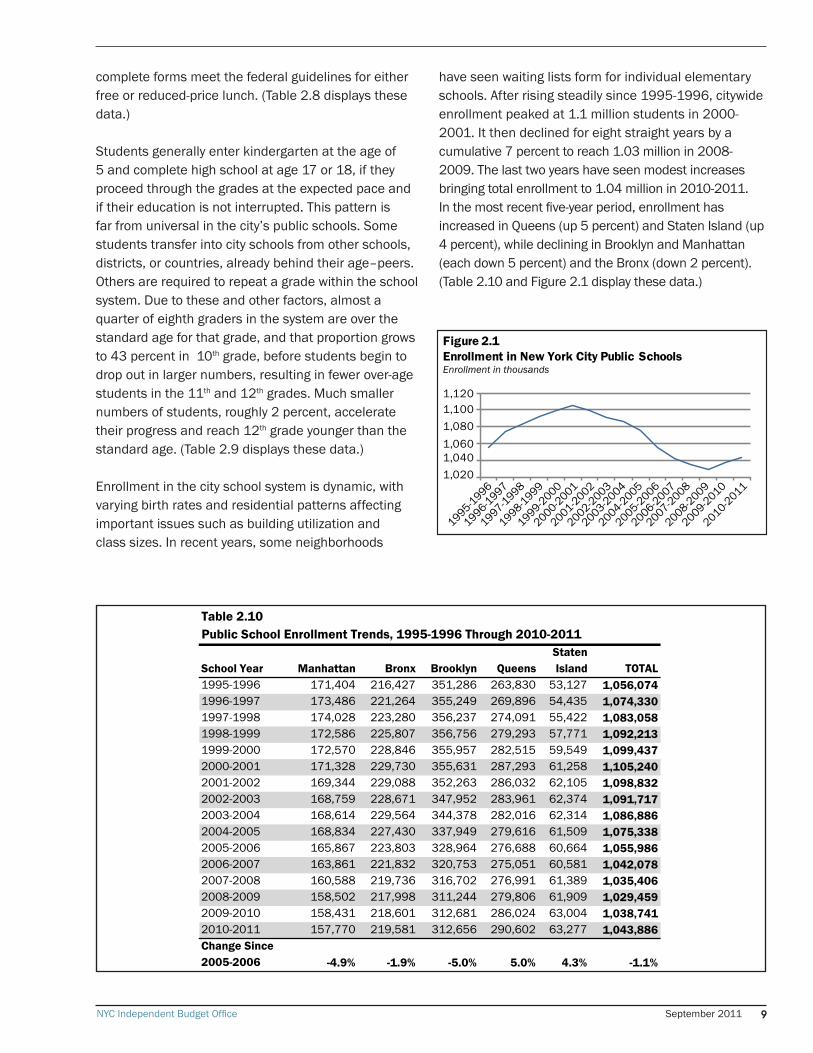
have seen waiting lists form for individual elementary schools. After rising steadily since 1995-1996, citywide enrollment peaked at 1.1 million students in 2000-2001. It then declined for eight straight years by a cumulative 7 percent to reach 1.03 million in 2008-2009. The last two years have seen modest increases bringing total enrollment to 1.04 million in 2010-2011. In the most recent five-year period, enrollment has increased in Queens (up 5 percent) and Staten Island (up 4 percent), while declining in Brooklyn and Manhattan (each down 5 percent) and the Bronx (down 2 percent). (Table 2.10 and Figure 2.1 display these data.)
1,0201,0401,0601,0801,1001,120
Figure 2.1Enrollment in New York City Public SchoolsEnrollment in thousands
1995-1996
1996-1997
1997-1998
1998-1999
1999-2000
2000-2001
2001-2002
2005-2006
2002-2003
2003-2004
2004-2005
2006-2007
2007-2008
2008-2009
2009-2010
2010-2011
School Year Manhattan Bronx Brooklyn QueensStaten Island TOTAL
1995-1996 171,404 216,427 351,286 263,830 53,127 1,056,0741996-1997 173,486 221,264 355,249 269,896 54,435 1,074,3301997-1998 174,028 223,280 356,237 274,091 55,422 1,083,0581998-1999 172,586 225,807 356,756 279,293 57,771 1,092,2131999-2000 172,570 228,846 355,957 282,515 59,549 1,099,4372000-2001 171,328 229,730 355,631 287,293 61,258 1,105,2402001-2002 169,344 229,088 352,263 286,032 62,105 1,098,8322002-2003 168,759 228,671 347,952 283,961 62,374 1,091,7172003-2004 168,614 229,564 344,378 282,016 62,314 1,086,8862004-2005 168,834 227,430 337,949 279,616 61,509 1,075,3382005-2006 165,867 223,803 328,964 276,688 60,664 1,055,9862006-2007 163,861 221,832 320,753 275,051 60,581 1,042,0782007-2008 160,588 219,736 316,702 276,991 61,389 1,035,4062008-2009 158,502 217,998 311,244 279,806 61,909 1,029,4592009-2010 158,431 218,601 312,681 286,024 63,004 1,038,7412010-2011 157,770 219,581 312,656 290,602 63,277 1,043,886Change Since2005-2006 -4.9% -1.9% -5.0% 5.0% 4.3% -1.1%
Table 2.10Public School Enrollment Trends, 1995-1996 Through 2010-2011
NYC Independent Budget Office September 2011 11
What Resources Are Made Available to Our Public Schools?
3
Budgetary Resources
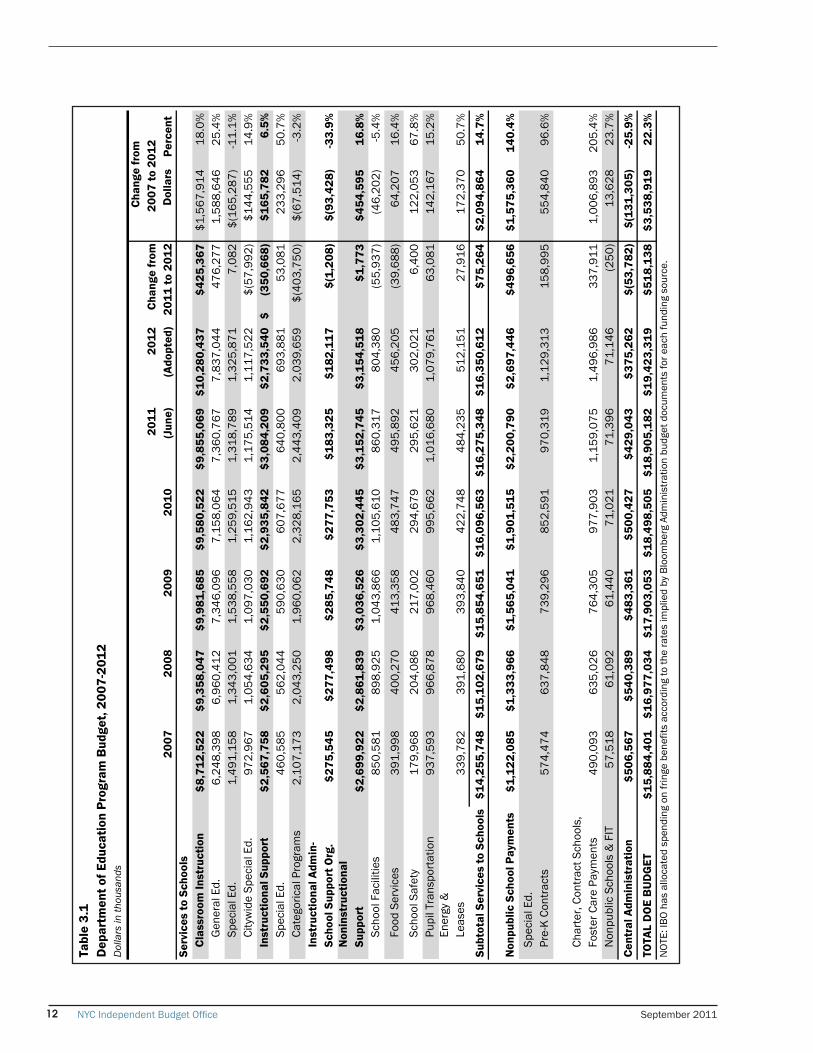
The Department of Education’s expense budget—$19.4 billion in the 2011-2012 school year that is just starting—has grown by 22 percent since 2007-2008. In absolute terms, the biggest increase had been in services to public schools, which have increased by $2.1 billion, or 15 percent. However, the biggest percentage increase, 140 percent, has been in the category nonpublic school payments (Table 3.1).
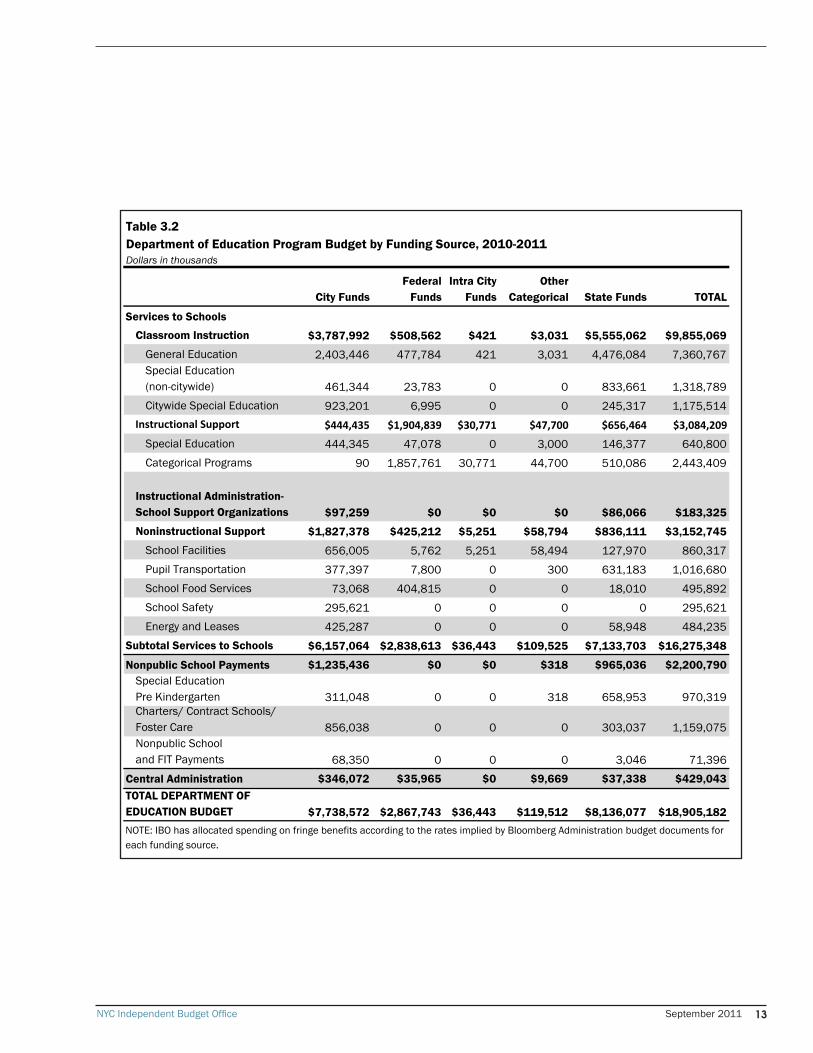
In the school year that just ended, 2010-2011, state funding accounted for 43 percent of the DOE’s expense budget; city funds, 41 percent; and federal, 15 percent. The remaining 1 percent included intra-city transfers and categorical funds from other than state or federal sources (Table 3.2). Federal funding included the last installment of stimulus funding, and the city’s adopted budget for fiscal year 2012 reflects a drop of close to $1 billion in federal funding for the DOE.
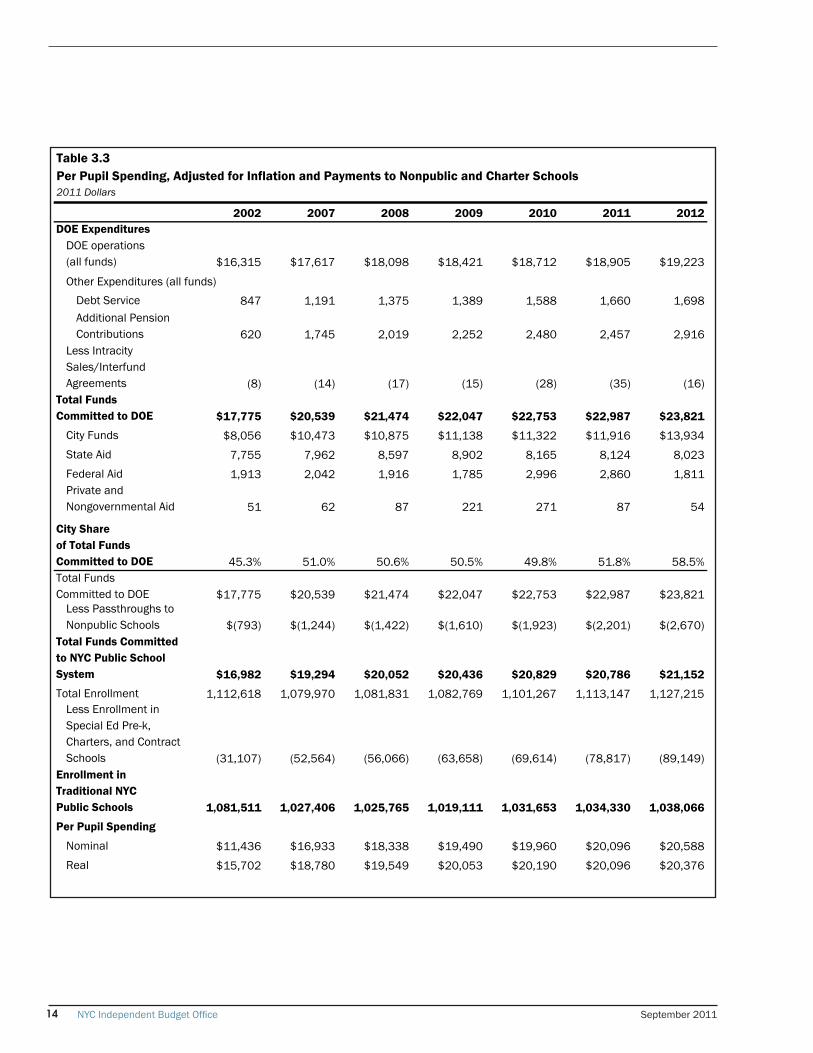
Two important spending categories, pension contributions for DOE employees and debt service for education capital projects, are accounted for elsewhere in the city’s budget and do not show up in the DOE’s expense budget. Table 3.3 adds these categories to the DOE’s budget for city fiscal years 2002 and 2007 through 2012. In order to allow for meaningful comparisons across years, it also adjusts for inflation (all figures are presented in 2011 dollars). These additional costs are substantial. Annual debt service for education purposes doubled from 2002 through 2012, and is now almost $1.7 billion. Pension costs for DOE employees increased by 181 percent from 2002-2007, and continued to rise through 2012. Pension costs are now almost $2.9 billion a year, an increase of $2.3 billion, or 370 percent since 2002.
Some of the money allocated to the DOE actually flows out to private, special education schools and to public
charter schools. Table 3.3 also removes those amounts from the total and computes per-pupil spending at DOE schools, defined as the amount that remains within the traditional public school system divided by the enrollment in the system’s traditional public schools. In real, inflation-adjusted terms, per-pupil spending rose by 28 percent from 2002 through 2009 but has grown by only 2 percent since then. That modest growth is entirely attributable to the increase in pension costs. If those costs were removed, real spending per pupil would have declined in each of the last three years.
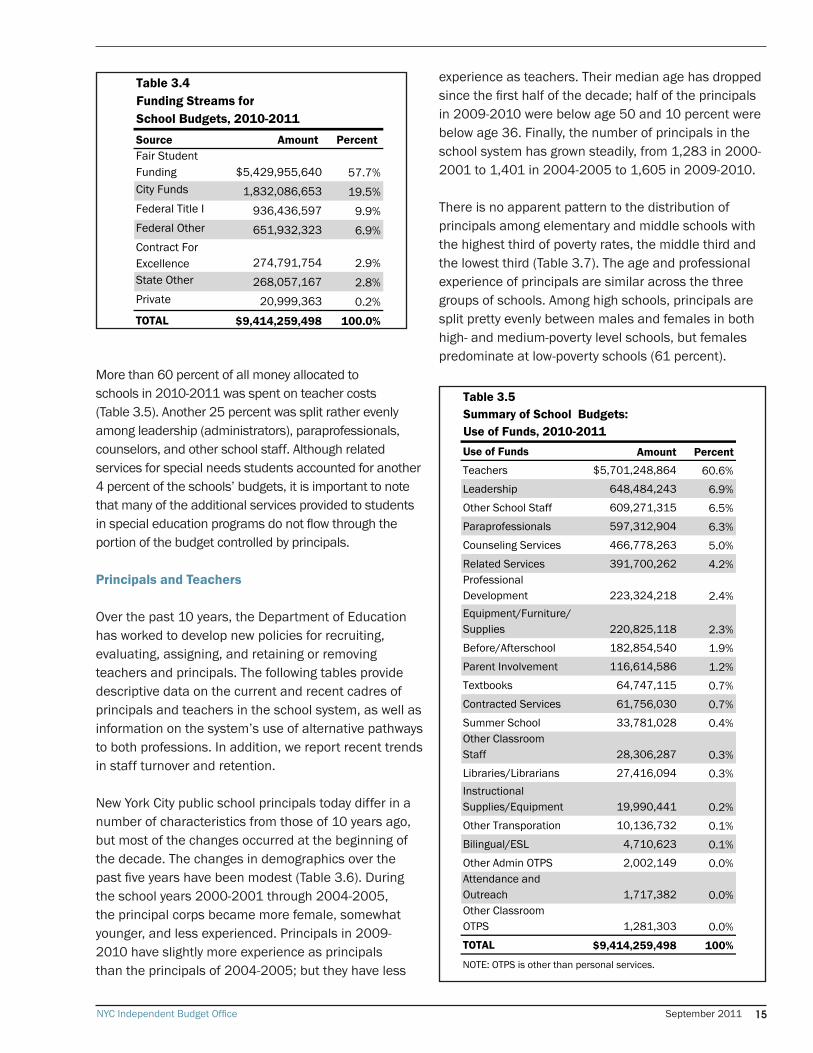
In recent years, the DOE has followed budget policies directed toward school autonomy and principal empowerment. Funds are directed to schools and—to the extent that funding sources allow—principals are granted discretion over the use of funds within their school. For the 2010-2011 school year, $9.4 billion was allocated to traditional public schools to be budgeted by principals. (Our figures include an allocation of fringe benefit costs for all personnel spending even though those costs are paid centrally.) The largest portion of this money, 58 percent, was distributed under the fair student funding formula, which attempts to account for the relative needs of different types of students at each school (Table 3.4). The formula’s funding stream mixes funds from the city and state budgets. This is also true of the much smaller Contract for Excellence funding stream, which is related to the settlement of the successful Campaign for Fiscal Equity lawsuit in which the courts found that city schools had historically been underfunded and directed that state and city support for city schools should be increased.
NYC Independent Budget Office September 201112
Dol
lars
Pe
rcen
tSe
rvic
es to
Sch
ools
Clas
sroo
m In
stru
ctio
n$8
,712
,522
$9,3
58,0
47$9
,981
,685
$9,5
80,5
22$9
,855
,069
$10,
280,
437
$425
,367
$1,5
67,9
1418
.0%
Gen
eral
Ed.
6,24
8,39
86,
960,
412
7,34
6,09
67,
158,
064
7,36
0,76
77,
837,
044
476,
277
1,58
8,64
625
.4%
Spec
ial E
d.1,
491,
158
1,34
3,00
11,
538,
558
1,25
9,51
51,
318,
789
1,32
5,87
17,
082
$(16
5,28
7)-1
1.1%
City
wid
e Sp
ecia
l Ed.
972,
967
1,05
4,63
41,
097,
030
1,16
2,94
31,
175,
514
1,11
7,52
2$(
57,9
92)
$144
,555
14.9
%In
stru
ctio
nal S
uppo
r t$2
,567
,758
$2,6
05,2
95$2
,550
,692
$2,9
35,8
42$3
,084
,209
$2,7
33,5
40(3
50,6
68)
$
$1
65,7
826.
5%Sp
ecia
l Ed.
460,
585
562,
044
590,
630
607,
677
640,
800
693,
881
53,0
8123
3,29
650
.7%
Cate
goric
al P
rogr
ams
2,10
7,17
32,
043,
250
1,96
0,06
22,
328,
165
2,44
3,40
92,
039,
659
$(40
3,75
0)$(
67,5
14)
-3.2
%In
stru
ctio
nal A
dmin
- Sc
hool
Sup
port
Org
.$2
75,5
45$2
77,4
98$2
85,7
48$2
77,7
53$1
83,3
25$1
82,1
17$(
1,20
8)$(
93,4
28)
-33.
9%N
onin
stru
ctio
nal
Supp
ort
$2,6
99,9
22$2
,861
,839
$3,0
36,5
26$3
,302
,445
$3,1
52,7
45$3
,154
,518
$1,7
73$4
54,5
9516
.8%
Scho
ol F
acili
ties
850,
581
898,
925
1,04
3,86
61,
105,
610
860,
317
804,
380
(55,
937)
(46,
202)
-5.4
%Fo
od S
ervi
ces
391,
998
400,
270
413,
358
483,
747
495,
892
456,
205
(39,
688)
64,2
0716
.4%
Scho
ol S
afet
y17
9,96
820
4,08
621
7,00
229
4,67
929
5,62
130
2,02
16,
400
122,
053
67.8
%Pu
pil T
rans
porta
tion
937,
593
966,
878
968,
460
995,
662
1,01
6,68
01,
079,
761
63,0
8114
2,16
715
.2%
Ener
gy &
Leas
es33
9,78
239
1,68
039
3,84
042
2,74
848
4,23
551
2,15
127
,916
172,
370
50.7
%
Subt
otal
Ser
vice
s to
Sch
ools
$14,
255,
748
$15,
102,
679
$15,
854,
651
$16,
096,
563
$16,
275,
348
$16,
350,
612
$75,
264
$2,0
94,8
6414
.7%
Non
publ
ic S
choo
l Pay
men
ts$1
,122
,085
$1,3
33,9
66$1
,565
,041
$1,9
01,5
15$2
,200
,790
$2,6
97,4
46$4
96,6
56$1
,575
,360
140.
4%Sp
ecia
l Ed.
Pr
e-K
Cont
ract
s57
4,47
463
7,84
873
9,29
685
2,59
197
0,31
91,
129,
313
158,
995
554,
840
96.6
%
Char
ter,
Cont
ract
Sch
ools
, Fo
ster
Car
e Pa
ymen
ts49
0,09
363
5,02
676
4,30
597
7,90
31,
159,
075
1,49
6,98
633
7,91
11,
006,
893
205.
4%N
onpu
blic
Sch
ools
& F
IT57
,518
61,0
9261
,440
71,0
2171
,396
71,1
46(2
50)
13,6
2823
.7%
Cent
ral A
dmin
istr
atio
n$5
06,5
67$5
40,3
89$4
83,3
61$5
00,4
27$4
29,0
43$3
75,2
62$(
53,7
82)
$(13
1,30
5)-2
5.9%
TOTA
L D
OE
BU
DG
ET$1
5,88
4,40
1$1
6,97
7,03
4$1
7,90
3,05
3$1
8,49
8,50
5$1
8,90
5,18
2$1
9,42
3,31
9$5
18,1
38$3
,538
,919
22.3
%
Tabl
e 3.
1 D
epar
tmen
t of E
duca
tion
Prog
ram
Bud
get,
2007
-201
2D
olla
rs in
thou
sand
s
2007
2008
2009
2010
201
1(J
une)
2
012
(Ado
pted
) C
hang
e fr
om
2011
to 2
012
Cha
nge
from
20
07 to
201
2
NOT
E: IB
O ha
s al
loca
ted
spen
ding
on
fring
e be
nefit
s ac
cord
ing
to th
e ra
tes
impl
ied
by B
loom
berg
Adm
inis
tratio
n bu
dget
doc
umen
ts fo
r eac
h fu
ndin
g so
urce
.
NYC Independent Budget Office September 2011 13
City Funds Federal
Funds Intra City
Funds Other
Categorical State Funds TOTAL
Services to Schools
Classroom Instruction $3,787,992 $508,562 $421 $3,031 $5,555,062 $9,855,069
General Education 2,403,446 477,784 421 3,031 4,476,084 7,360,767Special Education (non-citywide) 461,344 23,783 0 0 833,661 1,318,789Citywide Special Education 923,201 6,995 0 0 245,317 1,175,514
Instructional Support $444,435 $1,904,839 $30,771 $47,700 $656,464 $3,084,209
Special Education 444,345 47,078 0 3,000 146,377 640,800Categorical Programs 90 1,857,761 30,771 44,700 510,086 2,443,409
Instructional Administration-School Support Organizations $97,259 $0 $0 $0 $86,066 $183,325
Noninstructional Support $1,827,378 $425,212 $5,251 $58,794 $836,111 $3,152,745
School Facilities 656,005 5,762 5,251 58,494 127,970 860,317Pupil Transportation 377,397 7,800 0 300 631,183 1,016,680School Food Services 73,068 404,815 0 0 18,010 495,892School Safety 295,621 0 0 0 0 295,621Energy and Leases 425,287 0 0 0 58,948 484,235
Subtotal Services to Schools $6,157,064 $2,838,613 $36,443 $109,525 $7,133,703 $16,275,348
Nonpublic School Payments $1,235,436 $0 $0 $318 $965,036 $2,200,790Special EducationPre Kindergarten 311,048 0 0 318 658,953 970,319Charters/ Contract Schools/Foster Care 856,038 0 0 0 303,037 1,159,075Nonpublic Schooland FIT Payments 68,350 0 0 0 3,046 71,396
Central Administration $346,072 $35,965 $0 $9,669 $37,338 $429,043TOTAL DEPARTMENT OF EDUCATION BUDGET $7,738,572 $2,867,743 $36,443 $119,512 $8,136,077 $18,905,182
Table 3.2 Department of Education Program Budget by Funding Source, 2010-2011Dollars in thousands
NOTE: IBO has allocated spending on fringe benefits according to the rates implied by Bloomberg Administration budget documents for each funding source.
NYC Independent Budget Office September 201114
2002 2007 2008 2009 2010 2011 2012DOE Expenditures
DOE operations(all funds) $16,315 $17,617 $18,098 $18,421 $18,712 $18,905 $19,223
Debt Service 847 1,191 1,375 1,389 1,588 1,660 1,698Additional Pension Contributions 620 1,745 2,019 2,252 2,480 2,457 2,916
Less Intracity Sales/Interfund Agreements (8) (14) (17) (15) (28) (35) (16)
Total FundsCommitted to DOE $17,775 $20,539 $21,474 $22,047 $22,753 $22,987 $23,821
City Funds $8,056 $10,473 $10,875 $11,138 $11,322 $11,916 $13,934State Aid 7,755 7,962 8,597 8,902 8,165 8,124 8,023Federal Aid 1,913 2,042 1,916 1,785 2,996 2,860 1,811Private and Nongovernmental Aid 51 62 87 221 271 87 54
City Share of Total Funds Committed to DOE 45.3% 51.0% 50.6% 50.5% 49.8% 51.8% 58.5%Total FundsCommitted to DOE $17,775 $20,539 $21,474 $22,047 $22,753 $22,987 $23,821
Less Passthroughs to Nonpublic Schools $(793) $(1,244) $(1,422) $(1,610) $(1,923) $(2,201) $(2,670)
Total Funds Committed to NYC Public School System $16,982 $19,294 $20,052 $20,436 $20,829 $20,786 $21,152
Total Enrollment 1,112,618 1,079,970 1,081,831 1,082,769 1,101,267 1,113,147 1,127,215Less Enrollment in Special Ed Pre-k, Charters, and Contract Schools (31,107) (52,564) (56,066) (63,658) (69,614) (78,817) (89,149)
Enrollment inTraditional NYCPublic Schools 1,081,511 1,027,406 1,025,765 1,019,111 1,031,653 1,034,330 1,038,066
Per Pupil Spending
Nominal $11,436 $16,933 $18,338 $19,490 $19,960 $20,096 $20,588Real $15,702 $18,780 $19,549 $20,053 $20,190 $20,096 $20,376
Table 3.3Per Pupil Spending, Adjusted for Inflation and Payments to Nonpublic and Charter Schools2011 Dollars
Other Expenditures (all funds)
NYC Independent Budget Office September 2011 15
More than 60 percent of all money allocated to schools in 2010-2011 was spent on teacher costs (Table 3.5). Another 25 percent was split rather evenly among leadership (administrators), paraprofessionals, counselors, and other school staff. Although related services for special needs students accounted for another 4 percent of the schools’ budgets, it is important to note that many of the additional services provided to students in special education programs do not flow through the portion of the budget controlled by principals.
Principals and Teachers
Over the past 10 years, the Department of Education has worked to develop new policies for recruiting, evaluating, assigning, and retaining or removing teachers and principals. The following tables provide descriptive data on the current and recent cadres of principals and teachers in the school system, as well as information on the system’s use of alternative pathways to both professions. In addition, we report recent trends in staff turnover and retention.
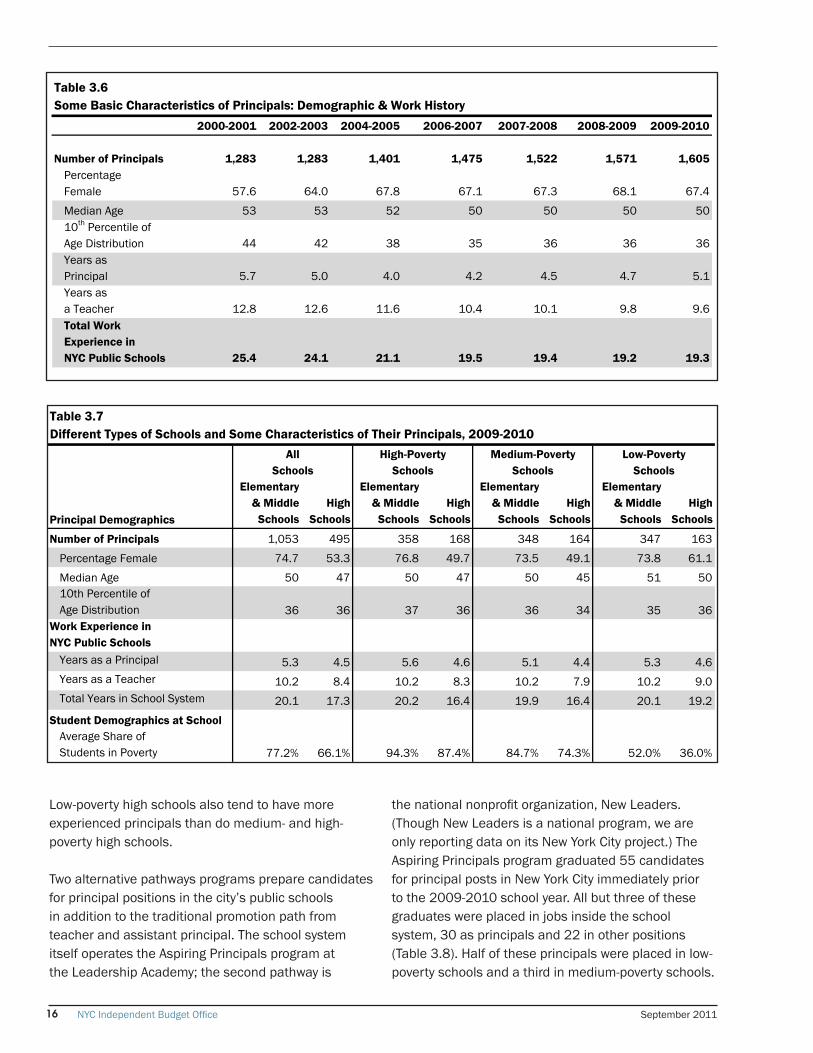
New York City public school principals today differ in a number of characteristics from those of 10 years ago, but most of the changes occurred at the beginning of the decade. The changes in demographics over the past five years have been modest (Table 3.6). During the school years 2000-2001 through 2004-2005, the principal corps became more female, somewhat younger, and less experienced. Principals in 2009-2010 have slightly more experience as principals than the principals of 2004-2005; but they have less
experience as teachers. Their median age has dropped since the first half of the decade; half of the principals in 2009-2010 were below age 50 and 10 percent were below age 36. Finally, the number of principals in the school system has grown steadily, from 1,283 in 2000-2001 to 1,401 in 2004-2005 to 1,605 in 2009-2010.
There is no apparent pattern to the distribution of principals among elementary and middle schools with the highest third of poverty rates, the middle third and the lowest third (Table 3.7). The age and professional experience of principals are similar across the three groups of schools. Among high schools, principals are split pretty evenly between males and females in both high- and medium-poverty level schools, but females predominate at low-poverty schools (61 percent).
Source Amount PercentFair Student Funding $5,429,955,640 57.7%City Funds 1,832,086,653 19.5%Federal Title I 936,436,597 9.9%Federal Other 651,932,323 6.9%Contract For Excellence 274,791,754 2.9%State Other 268,057,167 2.8%Private 20,999,363 0.2%TOTAL $9,414,259,498 100.0%
Table 3.4Funding Streams for School Budgets, 2010-2011
Use of Funds Amount Percent
Teachers $5,701,248,864 60.6%Leadership 648,484,243 6.9%Other School Staff 609,271,315 6.5%Paraprofessionals 597,312,904 6.3%Counseling Services 466,778,263 5.0%Related Services 391,700,262 4.2%ProfessionalDevelopment 223,324,218 2.4%Equipment/Furniture/Supplies 220,825,118 2.3%Before/Afterschool 182,854,540 1.9%Parent Involvement 116,614,586 1.2%Textbooks 64,747,115 0.7%Contracted Services 61,756,030 0.7%Summer School 33,781,028 0.4%Other ClassroomStaff 28,306,287 0.3%Libraries/Librarians 27,416,094 0.3%InstructionalSupplies/Equipment 19,990,441 0.2%Other Transporation 10,136,732 0.1%Bilingual/ESL 4,710,623 0.1%Other Admin OTPS 2,002,149 0.0%Attendance and Outreach 1,717,382 0.0%Other ClassroomOTPS 1,281,303 0.0%TOTAL $9,414,259,498 100%
Table 3.5 Summary of School Budgets: Use of Funds, 2010-2011
NOTE: OTPS is other than personal services.
NYC Independent Budget Office September 201116
Low-poverty high schools also tend to have more experienced principals than do medium- and high- poverty high schools.
Two alternative pathways programs prepare candidates for principal positions in the city’s public schools in addition to the traditional promotion path from teacher and assistant principal. The school system itself operates the Aspiring Principals program at the Leadership Academy; the second pathway is
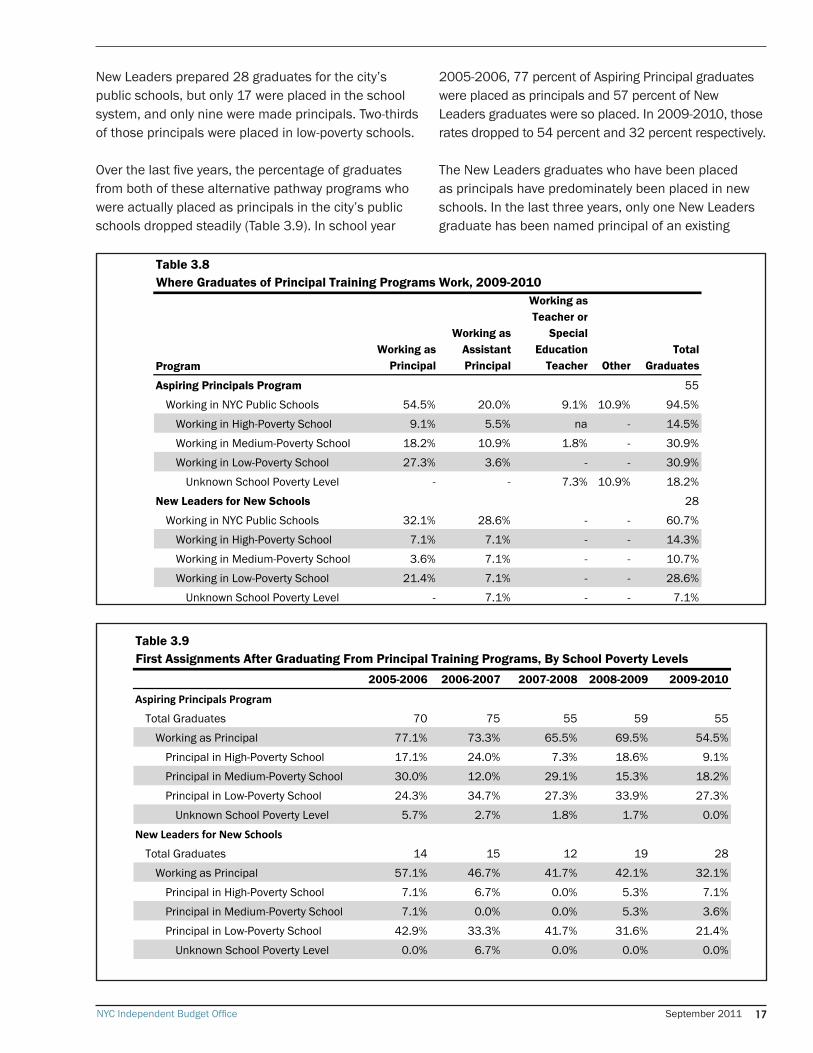
the national nonprofit organization, New Leaders. (Though New Leaders is a national program, we are only reporting data on its New York City project.) The Aspiring Principals program graduated 55 candidates for principal posts in New York City immediately prior to the 2009-2010 school year. All but three of these graduates were placed in jobs inside the school system, 30 as principals and 22 in other positions (Table 3.8). Half of these principals were placed in low-poverty schools and a third in medium-poverty schools.
2000-2001 2002-2003 2004-2005 2006-2007 2007-2008 2008-2009 2009-2010
Number of Principals 1,283 1,283 1,401 1,475 1,522 1,571 1,605PercentageFemale 57.6 64.0 67.8 67.1 67.3 68.1 67.4
Median Age 53 53 52 50 50 50 5010th Percentile ofAge Distribution 44 42 38 35 36 36 36Years asPrincipal 5.7 5.0 4.0 4.2 4.5 4.7 5.1Years asa Teacher 12.8 12.6 11.6 10.4 10.1 9.8 9.6Total WorkExperience inNYC Public Schools 25.4 24.1 21.1 19.5 19.4 19.2 19.3
Table 3.6Some Basic Characteristics of Principals: Demographic & Work History
Principal Demographics
Elementary & Middle
SchoolsHigh
Schools
Elementary & Middle
SchoolsHigh
Schools
Elementary & Middle
SchoolsHigh
Schools
Elementary & Middle
SchoolsHigh
Schools
Number of Principals 1,053 495 358 168 348 164 347 163
Percentage Female 74.7 53.3 76.8 49.7 73.5 49.1 73.8 61.1
Median Age 50 47 50 47 50 45 51 5010th Percentile ofAge Distribution 36 36 37 36 36 34 35 36
Work Experience in NYC Public Schools
Years as a Principal 5.3 4.5 5.6 4.6 5.1 4.4 5.3 4.6Years as a Teacher 10.2 8.4 10.2 8.3 10.2 7.9 10.2 9.0Total Years in School System 20.1 17.3 20.2 16.4 19.9 16.4 20.1 19.2
Student Demographics at SchoolAverage Share ofStudents in Poverty 77.2% 66.1% 94.3% 87.4% 84.7% 74.3% 52.0% 36.0%
Table 3.7Different Types of Schools and Some Characteristics of Their Principals, 2009-2010
AllSchools
High-PovertySchools
Medium-PovertySchools
Low-PovertySchools
NYC Independent Budget Office September 2011 17
ProgramWorking as
Principal
Working as Assistant Principal
Working as Teacher or
Special Education
Teacher OtherTotal
Graduates
Aspiring Principals Program 55
Working in NYC Public Schools 54.5% 20.0% 9.1% 10.9% 94.5%
Working in High-Poverty School 9.1% 5.5% na - 14.5%
Working in Medium-Poverty School 18.2% 10.9% 1.8% - 30.9%
Working in Low-Poverty School 27.3% 3.6% - - 30.9%
Unknown School Poverty Level - - 7.3% 10.9% 18.2%
New Leaders for New Schools 28
Working in NYC Public Schools 32.1% 28.6% - - 60.7%
Working in High-Poverty School 7.1% 7.1% - - 14.3%
Working in Medium-Poverty School 3.6% 7.1% - - 10.7%
Working in Low-Poverty School 21.4% 7.1% - - 28.6%
Unknown School Poverty Level - 7.1% - - 7.1%
Table 3.8Where Graduates of Principal Training Programs Work, 2009-2010
2005-2006 2006-2007 2007-2008 2008-2009 2009-2010
Aspiring Principals Program
Total Graduates 70 75 55 59 55
Working as Principal 77.1% 73.3% 65.5% 69.5% 54.5%
Principal in High-Poverty School 17.1% 24.0% 7.3% 18.6% 9.1%
Principal in Medium-Poverty School 30.0% 12.0% 29.1% 15.3% 18.2%
Principal in Low-Poverty School 24.3% 34.7% 27.3% 33.9% 27.3%
Unknown School Poverty Level 5.7% 2.7% 1.8% 1.7% 0.0%
New Leaders for New Schools
Total Graduates 14 15 12 19 28
Working as Principal 57.1% 46.7% 41.7% 42.1% 32.1%
Principal in High-Poverty School 7.1% 6.7% 0.0% 5.3% 7.1%
Principal in Medium-Poverty School 7.1% 0.0% 0.0% 5.3% 3.6%
Principal in Low-Poverty School 42.9% 33.3% 41.7% 31.6% 21.4%
Unknown School Poverty Level 0.0% 6.7% 0.0% 0.0% 0.0%
Table 3.9First Assignments After Graduating From Principal Training Programs, By School Poverty Levels
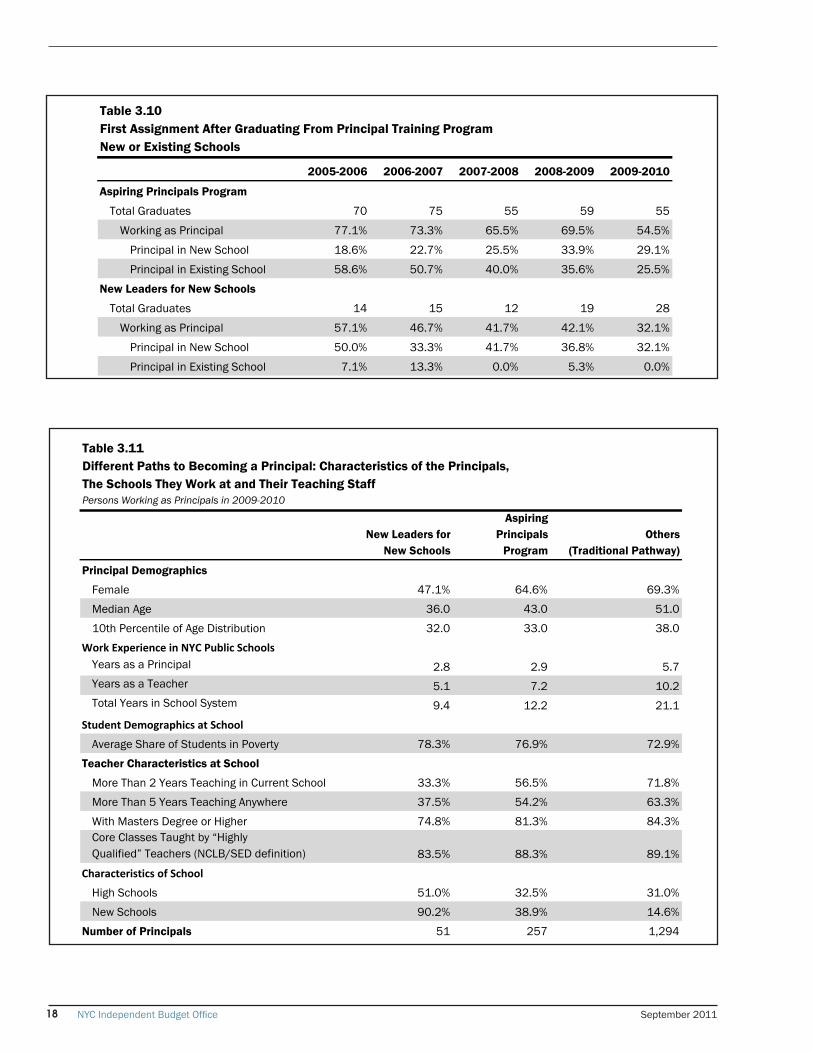
New Leaders prepared 28 graduates for the city’s public schools, but only 17 were placed in the school system, and only nine were made principals. Two-thirds of those principals were placed in low-poverty schools. Over the last five years, the percentage of graduates from both of these alternative pathway programs who were actually placed as principals in the city’s public schools dropped steadily (Table 3.9). In school year
2005-2006, 77 percent of Aspiring Principal graduates were placed as principals and 57 percent of New Leaders graduates were so placed. In 2009-2010, those rates dropped to 54 percent and 32 percent respectively.
The New Leaders graduates who have been placed as principals have predominately been placed in new schools. In the last three years, only one New Leaders graduate has been named principal of an existing
NYC Independent Budget Office September 201118
New Leaders for New Schools
Aspiring Principals
ProgramOthers
(Traditional Pathway)
Principal Demographics
Female 47.1% 64.6% 69.3%
Median Age 36.0 43.0 51.0
10th Percentile of Age Distribution 32.0 33.0 38.0
Work Experience in NYC Public SchoolsYears as a Principal 2.8 2.9 5.7Years as a Teacher 5.1 7.2 10.2Total Years in School System 9.4 12.2 21.1
Student Demographics at School
Average Share of Students in Poverty 78.3% 76.9% 72.9%
Teacher Characteristics at School
More Than 2 Years Teaching in Current School 33.3% 56.5% 71.8%
More Than 5 Years Teaching Anywhere 37.5% 54.2% 63.3%
With Masters Degree or Higher 74.8% 81.3% 84.3%Core Classes Taught by “Highly Qualified” Teachers (NCLB/SED definition) 83.5% 88.3% 89.1%
Characteristics of School
High Schools 51.0% 32.5% 31.0%
New Schools 90.2% 38.9% 14.6%
Number of Principals 51 257 1,294
Table 3.11Different Paths to Becoming a Principal: Characteristics of the Principals, The Schools They Work at and Their Teaching StaffPersons Working as Principals in 2009-2010
2005-2006 2006-2007 2007-2008 2008-2009 2009-2010
Aspiring Principals Program
Total Graduates 70 75 55 59 55
Working as Principal 77.1% 73.3% 65.5% 69.5% 54.5%
Principal in New School 18.6% 22.7% 25.5% 33.9% 29.1%
Principal in Existing School 58.6% 50.7% 40.0% 35.6% 25.5%
New Leaders for New Schools
Total Graduates 14 15 12 19 28
Working as Principal 57.1% 46.7% 41.7% 42.1% 32.1%
Principal in New School 50.0% 33.3% 41.7% 36.8% 32.1%
Principal in Existing School 7.1% 13.3% 0.0% 5.3% 0.0%
Table 3.10First Assignment After Graduating From Principal Training ProgramNew or Existing Schools
NYC Independent Budget Office September 2011 19
school (Table 3.10). The Aspiring Principal program has followed a different trajectory. In 2005-2006, many more of its graduates were placed in existing schools than new schools, but that relationship changed in 2008-2009. Now, graduates are evenly split between new and existing schools.
In 2009-2010, slightly fewer than 20 percent of all principals had come through these alternative pathways. In demographic terms, they differed from their peers who had followed the traditional pathway (Table 3.11). More than half of the principals from the New Leaders program were male while 69 percent of the traditionally trained principals were female. Principals from both New Leaders and the Aspiring Principal programs were significantly younger and less experienced than traditionally trained principals, reflecting the newness of these pathways. There is also evidence that traditionally trained principals tend to lead schools with more experienced and more highly educated teachers than do principals from the alternative pathways.
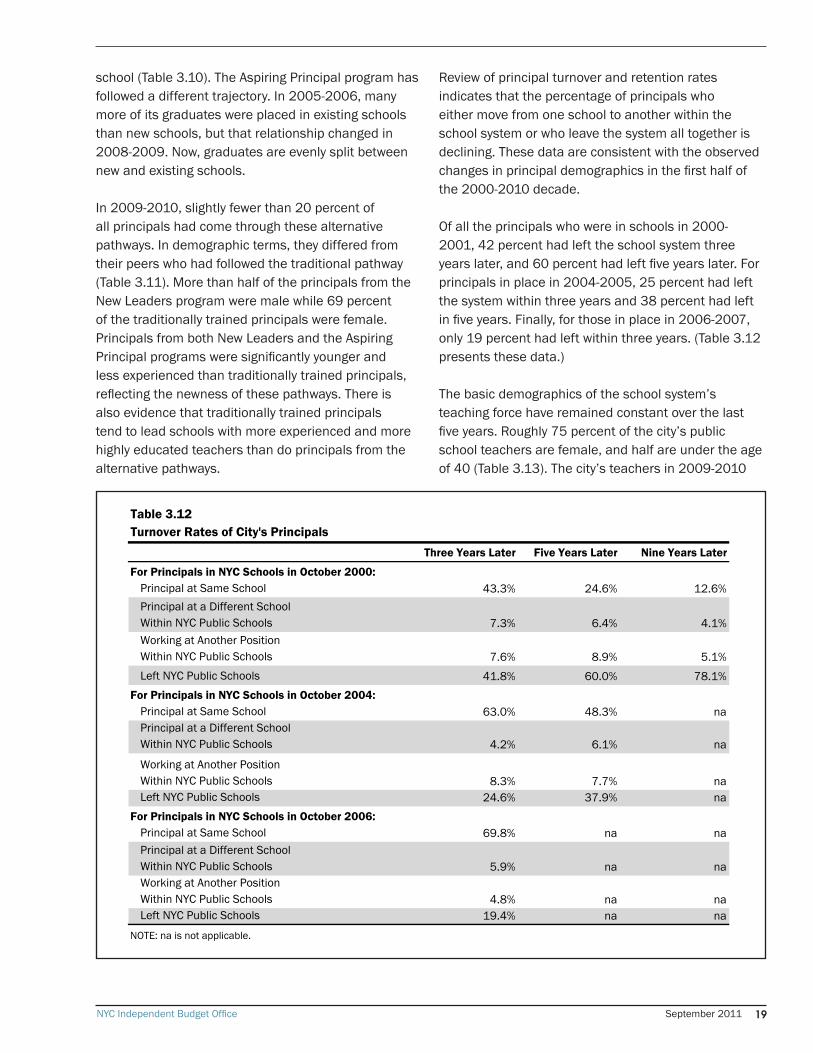
Review of principal turnover and retention rates indicates that the percentage of principals who either move from one school to another within the school system or who leave the system all together is declining. These data are consistent with the observed changes in principal demographics in the first half of the 2000-2010 decade.
Of all the principals who were in schools in 2000-2001, 42 percent had left the school system three years later, and 60 percent had left five years later. For principals in place in 2004-2005, 25 percent had left the system within three years and 38 percent had left in five years. Finally, for those in place in 2006-2007, only 19 percent had left within three years. (Table 3.12 presents these data.)
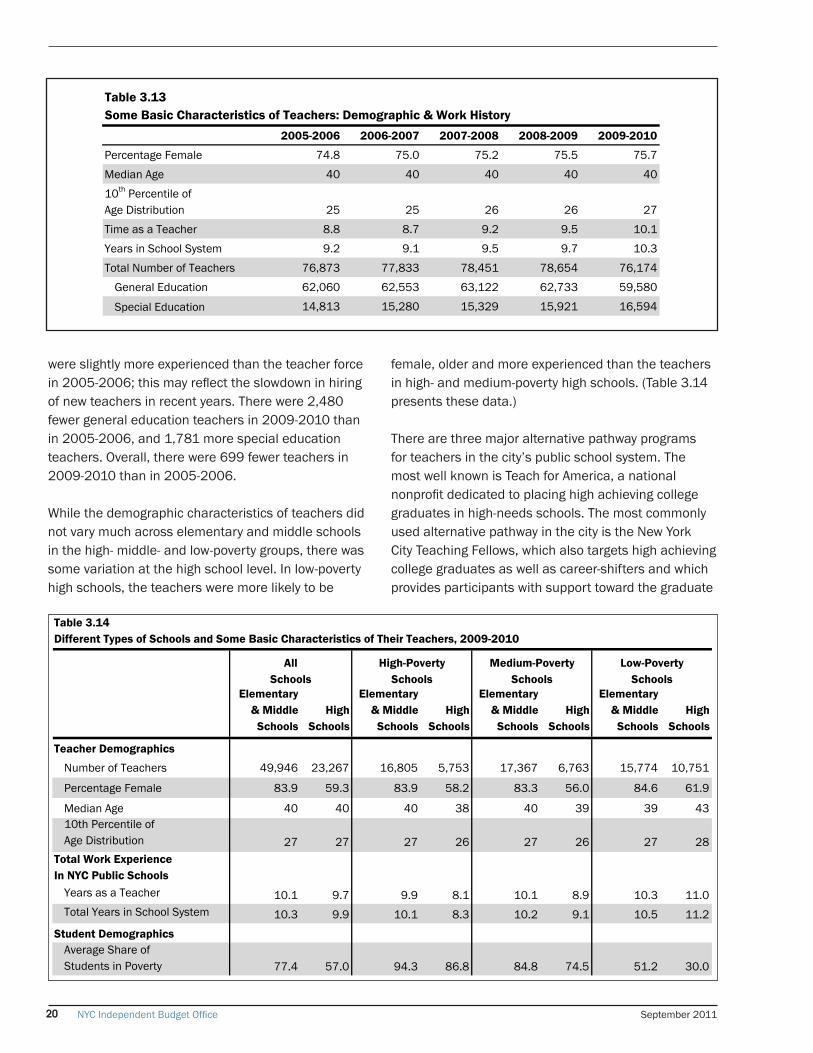
The basic demographics of the school system’s teaching force have remained constant over the last five years. Roughly 75 percent of the city’s public school teachers are female, and half are under the age of 40 (Table 3.13). The city’s teachers in 2009-2010
Three Years Later Five Years Later Nine Years Later
For Principals in NYC Schools in October 2000:Principal at Same School 43.3% 24.6% 12.6%Principal at a Different SchoolWithin NYC Public Schools 7.3% 6.4% 4.1%Working at Another PositionWithin NYC Public Schools 7.6% 8.9% 5.1%Left NYC Public Schools 41.8% 60.0% 78.1%
For Principals in NYC Schools in October 2004:Principal at Same School 63.0% 48.3% naPrincipal at a Different SchoolWithin NYC Public Schools 4.2% 6.1% na
Working at Another PositionWithin NYC Public Schools 8.3% 7.7% naLeft NYC Public Schools 24.6% 37.9% na
For Principals in NYC Schools in October 2006:Principal at Same School 69.8% na naPrincipal at a Different SchoolWithin NYC Public Schools 5.9% na naWorking at Another PositionWithin NYC Public Schools 4.8% na naLeft NYC Public Schools 19.4% na na
Table 3.12Turnover Rates of City's Principals
NOTE: na is not applicable.
NYC Independent Budget Office September 201120
were slightly more experienced than the teacher force in 2005-2006; this may reflect the slowdown in hiring of new teachers in recent years. There were 2,480 fewer general education teachers in 2009-2010 than in 2005-2006, and 1,781 more special education teachers. Overall, there were 699 fewer teachers in 2009-2010 than in 2005-2006.
While the demographic characteristics of teachers did not vary much across elementary and middle schools in the high- middle- and low-poverty groups, there was some variation at the high school level. In low-poverty high schools, the teachers were more likely to be
female, older and more experienced than the teachers in high- and medium-poverty high schools. (Table 3.14 presents these data.)
There are three major alternative pathway programs for teachers in the city’s public school system. The most well known is Teach for America, a national nonprofit dedicated to placing high achieving college graduates in high-needs schools. The most commonly used alternative pathway in the city is the New York City Teaching Fellows, which also targets high achieving college graduates as well as career-shifters and which provides participants with support toward the graduate
2005-2006 2006-2007 2007-2008 2008-2009 2009-2010
Percentage Female 74.8 75.0 75.2 75.5 75.7
Median Age 40 40 40 40 40
10th Percentile ofAge Distribution 25 25 26 26 27
Time as a Teacher 8.8 8.7 9.2 9.5 10.1
Years in School System 9.2 9.1 9.5 9.7 10.3
Total Number of Teachers 76,873 77,833 78,451 78,654 76,174
General Education 62,060 62,553 63,122 62,733 59,580
Special Education 14,813 15,280 15,329 15,921 16,594
Table 3.13Some Basic Characteristics of Teachers: Demographic & Work History
Elementary & Middle
SchoolsHigh
Schools
Elementary & Middle
SchoolsHigh
Schools
Elementary & Middle
SchoolsHigh
Schools
Elementary & Middle
SchoolsHigh
Schools
Teacher Demographics
Number of Teachers 49,946 23,267 16,805 5,753 17,367 6,763 15,774 10,751
Percentage Female 83.9 59.3 83.9 58.2 83.3 56.0 84.6 61.9
Median Age 40 40 40 38 40 39 39 4310th Percentile ofAge Distribution 27 27 27 26 27 26 27 28
Total Work ExperienceIn NYC Public Schools
Years as a Teacher 10.1 9.7 9.9 8.1 10.1 8.9 10.3 11.0Total Years in School System 10.3 9.9 10.1 8.3 10.2 9.1 10.5 11.2
Student DemographicsAverage Share ofStudents in Poverty 77.4 57.0 94.3 86.8 84.8 74.5 51.2 30.0
Table 3.14Different Types of Schools and Some Basic Characteristics of Their Teachers, 2009-2010
AllSchools
High-PovertySchools
Medium-PovertySchools
Low-PovertySchools
NYC Independent Budget Office September 2011 21
ProgramWorking
As TeacherWorking As SpecialEducation Teacher
Total FallNew Hires
NYC Teaching Fellows 646
Working in NYC Public Schools 30.8% 69.2% 100.0%
Working in High-Poverty School 11.9% 22.6% 34.5%
Working in Medium-Poverty School 10.8% 22.3% 33.1%
Working in Low-Poverty School 7.7% 24.1% 31.9%
Unknown School Poverty Level 0.3% 0.2% 0.5%
TeachNYC Select Recruits 142
Working in NYC Public Schools 72.5% 27.5% 100.0%
Working in High-Poverty School 15.5% 6.3% 21.8%
Working in Medium-Poverty School 23.2% 7.7% 31.0%
Working in Low-Poverty School 32.4% 12.7% 45.1%
Unknown School Poverty Level 1.4% 0.7% 2.1%
Teach for America 184
Working in NYC Public Schools 57.6% 42.4% 100.0%
Working in High-Poverty School 21.7% 28.3% 50.0%
Working in Medium-Poverty School 24.5% 10.3% 34.8%
Working in Low-Poverty School 10.9% 3.8% 14.7%
Unknown School Poverty Level 0.5% 0.0% 0.5%
Traditional Pathway 1,320
Working in NYC Public Schools 45.8% 54.2% 100.0%
Working in High-Poverty School 9.9% 14.2% 24.2%
W ki g i M di P t S h l 15 5% 12 7% 28 3%
Table 3.15Newly Hired Teachers: Programs They Came From, Schools That They Go To, 2009-2010
Working in Medium-Poverty School 15.5% 12.7% 28.3%
Working in Low-Poverty School 19.7% 26.4% 46.1%
Unknown School Poverty Level 0.7% 0.8% 1.4%
NOTE: TeachNYC Select Recruits was formerly known as TRQ Select.
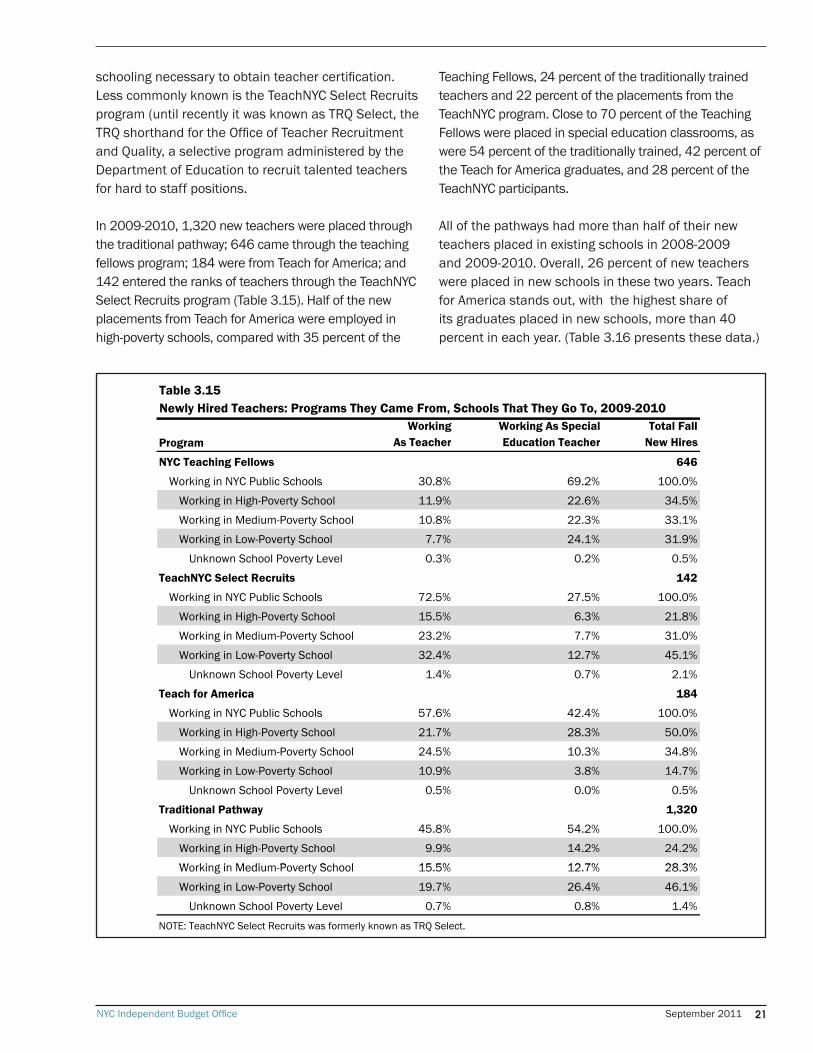
schooling necessary to obtain teacher certification. Less commonly known is the TeachNYC Select Recruits program (until recently it was known as TRQ Select, the TRQ shorthand for the Office of Teacher Recruitment and Quality, a selective program administered by the Department of Education to recruit talented teachers for hard to staff positions.
In 2009-2010, 1,320 new teachers were placed through the traditional pathway; 646 came through the teaching fellows program; 184 were from Teach for America; and 142 entered the ranks of teachers through the TeachNYC Select Recruits program (Table 3.15). Half of the new placements from Teach for America were employed in high-poverty schools, compared with 35 percent of the
Teaching Fellows, 24 percent of the traditionally trained teachers and 22 percent of the placements from the TeachNYC program. Close to 70 percent of the Teaching Fellows were placed in special education classrooms, as were 54 percent of the traditionally trained, 42 percent of the Teach for America graduates, and 28 percent of the TeachNYC participants.
All of the pathways had more than half of their new teachers placed in existing schools in 2008-2009 and 2009-2010. Overall, 26 percent of new teachers were placed in new schools in these two years. Teach for America stands out, with the highest share of its graduates placed in new schools, more than 40 percent in each year. (Table 3.16 presents these data.)
NYC Independent Budget Office September 201122
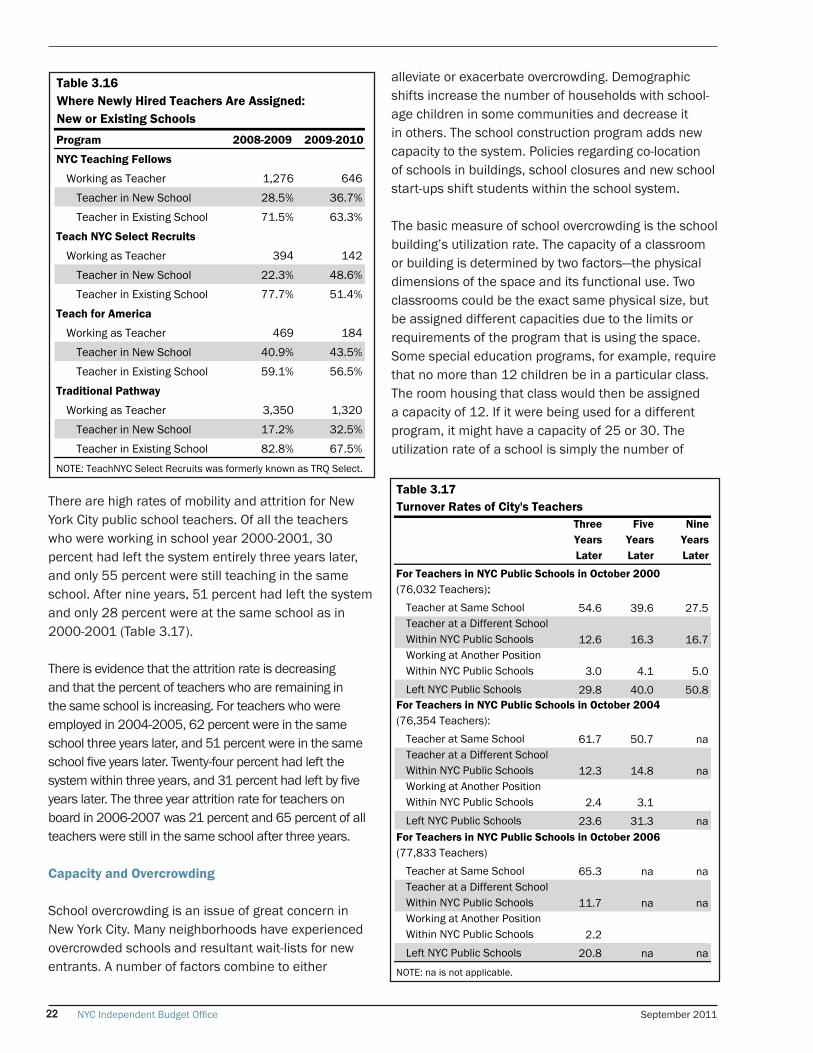
There are high rates of mobility and attrition for New York City public school teachers. Of all the teachers who were working in school year 2000-2001, 30 percent had left the system entirely three years later, and only 55 percent were still teaching in the same school. After nine years, 51 percent had left the system and only 28 percent were at the same school as in 2000-2001 (Table 3.17).
There is evidence that the attrition rate is decreasing and that the percent of teachers who are remaining in the same school is increasing. For teachers who were employed in 2004-2005, 62 percent were in the same school three years later, and 51 percent were in the same school five years later. Twenty-four percent had left the system within three years, and 31 percent had left by five years later. The three year attrition rate for teachers on board in 2006-2007 was 21 percent and 65 percent of all teachers were still in the same school after three years.
Capacity and Overcrowding
School overcrowding is an issue of great concern in New York City. Many neighborhoods have experienced overcrowded schools and resultant wait-lists for new entrants. A number of factors combine to either
alleviate or exacerbate overcrowding. Demographic shifts increase the number of households with school-age children in some communities and decrease it in others. The school construction program adds new capacity to the system. Policies regarding co-location of schools in buildings, school closures and new school start-ups shift students within the school system.
The basic measure of school overcrowding is the school building’s utilization rate. The capacity of a classroom or building is determined by two factors—the physical dimensions of the space and its functional use. Two classrooms could be the exact same physical size, but be assigned different capacities due to the limits or requirements of the program that is using the space. Some special education programs, for example, require that no more than 12 children be in a particular class. The room housing that class would then be assigned a capacity of 12. If it were being used for a different program, it might have a capacity of 25 or 30. The utilization rate of a school is simply the number of
Program 2008-2009 2009-2010
NYC Teaching Fellows
Working as Teacher 1,276 646
Teacher in New School 28.5% 36.7%
Teacher in Existing School 71.5% 63.3%
Teach NYC Select Recruits
Working as Teacher 394 142
Teacher in New School 22.3% 48.6%
Teacher in Existing School 77.7% 51.4%
Teach for America
Working as Teacher 469 184
Teacher in New School 40.9% 43.5%
Teacher in Existing School 59.1% 56.5%
Traditional Pathway
Working as Teacher 3,350 1,320
Teacher in New School 17.2% 32.5%
Teacher in Existing School 82.8% 67.5%
Table 3.16Where Newly Hired Teachers Are Assigned:New or Existing Schools
NOTE: TeachNYC Select Recruits was formerly known as TRQ Select.
Three Years Later
Five Years Later
Nine Years Later
Teacher at Same School 54.6 39.6 27.5Teacher at a Different SchoolWithin NYC Public Schools 12.6 16.3 16.7Working at Another Position Within NYC Public Schools 3.0 4.1 5.0Left NYC Public Schools 29.8 40.0 50.8
Teacher at Same School 61.7 50.7 naTeacher at a Different SchoolWithin NYC Public Schools 12.3 14.8 naWorking at Another PositionWithin NYC Public Schools 2.4 3.1Left NYC Public Schools 23.6 31.3 na
Teacher at Same School 65.3 na naTeacher at a Different SchoolWithin NYC Public Schools 11.7 na naWorking at Another PositionWithin NYC Public Schools 2.2Left NYC Public Schools 20.8 na na
Table 3.17Turnover Rates of City's Teachers
For Teachers in NYC Public Schools in October 2000(76,032 Teachers):
For Teachers in NYC Public Schools in October 2004(76,354 Teachers):
For Teachers in NYC Public Schools in October 2006(77,833 Teachers)
NOTE: na is not applicable.
NYC Independent Budget Office September 2011 23
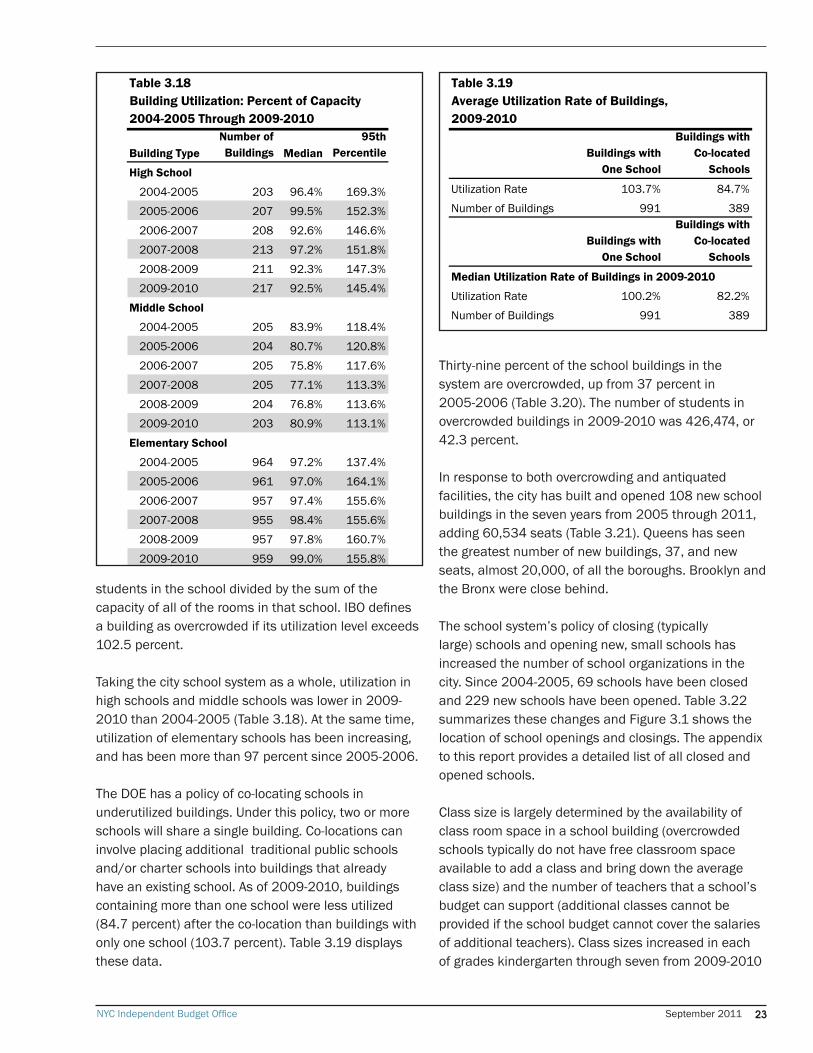
students in the school divided by the sum of the capacity of all of the rooms in that school. IBO defines a building as overcrowded if its utilization level exceeds 102.5 percent.
Taking the city school system as a whole, utilization in high schools and middle schools was lower in 2009-2010 than 2004-2005 (Table 3.18). At the same time, utilization of elementary schools has been increasing, and has been more than 97 percent since 2005-2006.
The DOE has a policy of co-locating schools in underutilized buildings. Under this policy, two or more schools will share a single building. Co-locations can involve placing additional traditional public schools and/or charter schools into buildings that already have an existing school. As of 2009-2010, buildings containing more than one school were less utilized (84.7 percent) after the co-location than buildings with only one school (103.7 percent). Table 3.19 displays these data.
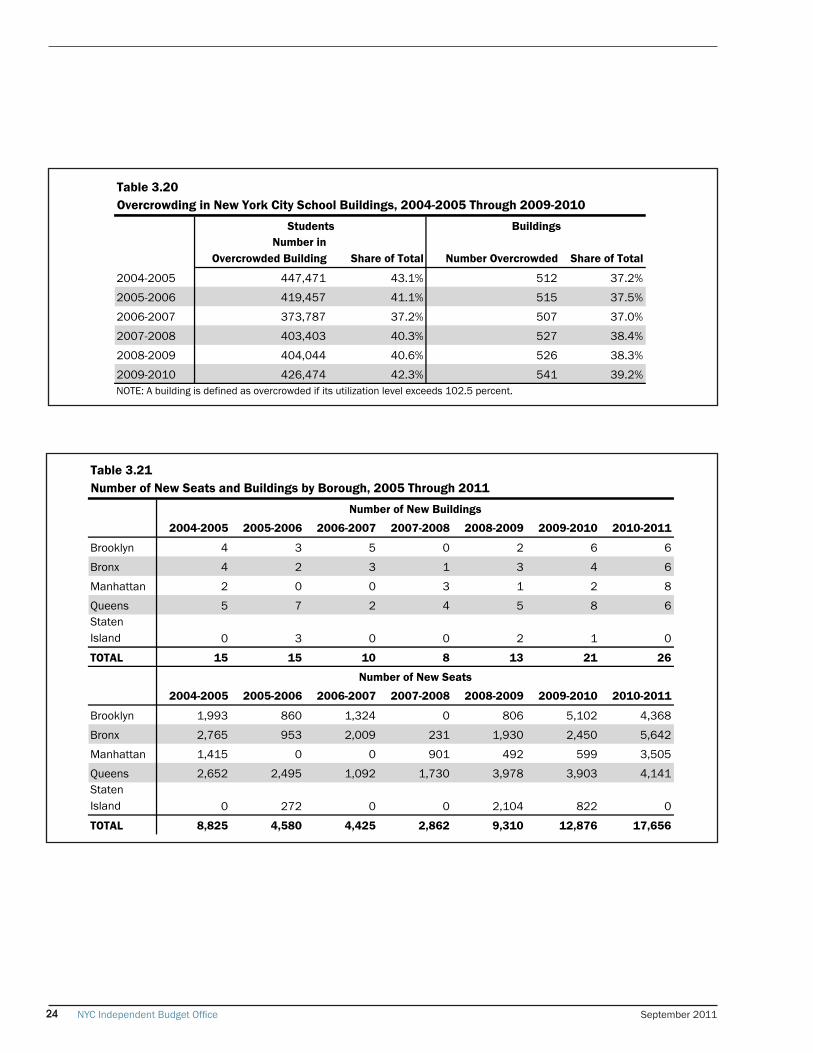
Thirty-nine percent of the school buildings in the system are overcrowded, up from 37 percent in 2005-2006 (Table 3.20). The number of students in overcrowded buildings in 2009-2010 was 426,474, or 42.3 percent.
In response to both overcrowding and antiquated facilities, the city has built and opened 108 new school buildings in the seven years from 2005 through 2011, adding 60,534 seats (Table 3.21). Queens has seen the greatest number of new buildings, 37, and new seats, almost 20,000, of all the boroughs. Brooklyn and the Bronx were close behind.
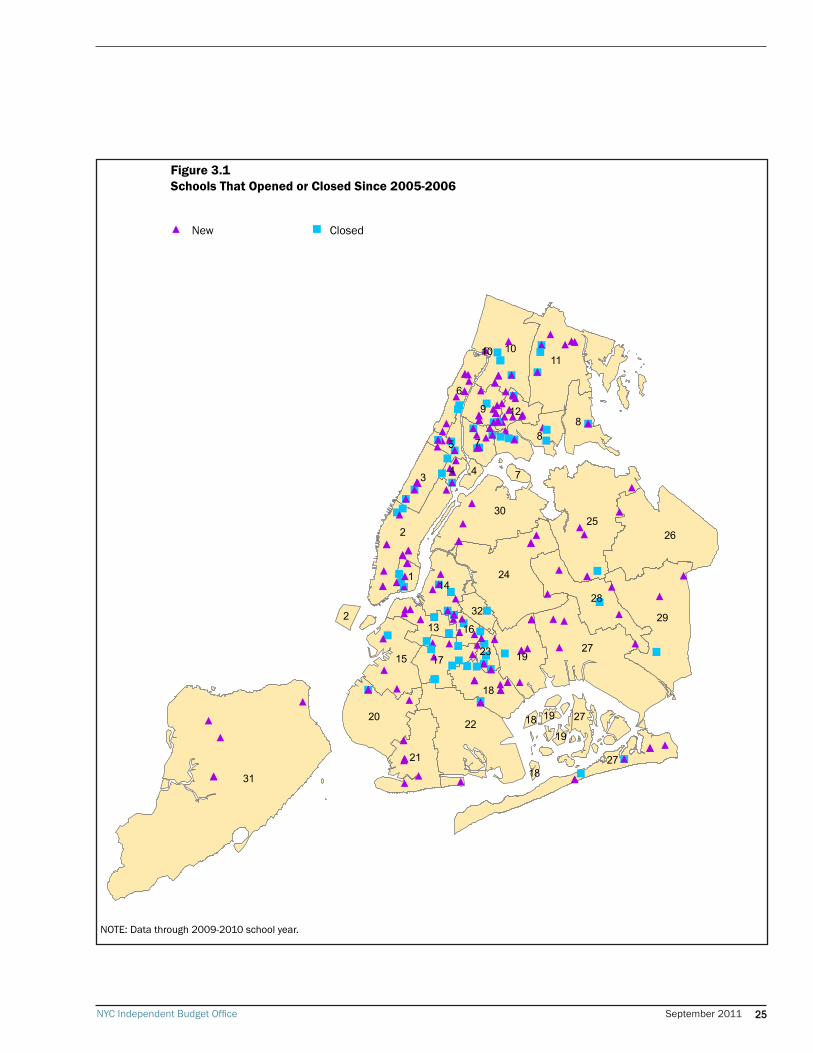
The school system’s policy of closing (typically large) schools and opening new, small schools has increased the number of school organizations in the city. Since 2004-2005, 69 schools have been closed and 229 new schools have been opened. Table 3.22 summarizes these changes and Figure 3.1 shows the location of school openings and closings. The appendix to this report provides a detailed list of all closed and opened schools.
Class size is largely determined by the availability of class room space in a school building (overcrowded schools typically do not have free classroom space available to add a class and bring down the average class size) and the number of teachers that a school’s budget can support (additional classes cannot be provided if the school budget cannot cover the salaries of additional teachers). Class sizes increased in each of grades kindergarten through seven from 2009-2010
Building TypeNumber of Buildings Median
95thPercentile
2004-2005 203 96.4% 169.3%
2005-2006 207 99.5% 152.3%
2006-2007 208 92.6% 146.6%
2007-2008 213 97.2% 151.8%
2008-2009 211 92.3% 147.3%
2009-2010 217 92.5% 145.4%
2004-2005 205 83.9% 118.4%
2005-2006 204 80.7% 120.8%
2006-2007 205 75.8% 117.6%
2007-2008 205 77.1% 113.3%
2008-2009 204 76.8% 113.6%
2009-2010 203 80.9% 113.1%
2004-2005 964 97.2% 137.4%
2005-2006 961 97.0% 164.1%
2006-2007 957 97.4% 155.6%
2007-2008 955 98.4% 155.6%
2008-2009 957 97.8% 160.7%
2009-2010 959 99.0% 155.8%
Table 3.18Building Utilization: Percent of Capacity2004-2005 Through 2009-2010
High School
Middle School
Elementary School
Buildings with One School
Buildings with Co-located
Schools
Utilization Rate 103.7% 84.7%
Number of Buildings 991 389
Buildings with One School
Buildings with Co-located
Schools
Utilization Rate 100.2% 82.2%
Number of Buildings 991 389
Median Utilization Rate of Buildings in 2009-2010
Table 3.19Average Utilization Rate of Buildings,2009-2010
NYC Independent Budget Office September 201124
Number inOvercrowded Building Share of Total Number Overcrowded Share of Total
2004-2005 447,471 43.1% 512 37.2%
2005-2006 419,457 41.1% 515 37.5%
2006-2007 373,787 37.2% 507 37.0%
2007-2008 403,403 40.3% 527 38.4%
2008-2009 404,044 40.6% 526 38.3%
2009-2010 426,474 42.3% 541 39.2%
Table 3.20Overcrowding in New York City School Buildings, 2004-2005 Through 2009-2010
Students Buildings
NOTE: A building is defined as overcrowded if its utilization level exceeds 102.5 percent.
2004-2005 2005-2006 2006-2007 2007-2008 2008-2009 2009-2010 2010-2011
Brooklyn 4 3 5 0 2 6 6
Bronx 4 2 3 1 3 4 6
Manhattan 2 0 0 3 1 2 8
Queens 5 7 2 4 5 8 6StatenIsland 0 3 0 0 2 1 0
TOTAL 15 15 10 8 13 21 26
2004-2005 2005-2006 2006-2007 2007-2008 2008-2009 2009-2010 2010-2011
Brooklyn 1,993 860 1,324 0 806 5,102 4,368
Bronx 2,765 953 2,009 231 1,930 2,450 5,642
Manhattan 1,415 0 0 901 492 599 3,505
Queens 2,652 2,495 1,092 1,730 3,978 3,903 4,141StatenIsland 0 272 0 0 2,104 822 0
TOTAL 8,825 4,580 4,425 2,862 9,310 12,876 17,656
Table 3.21Number of New Seats and Buildings by Borough, 2005 Through 2011
Number of New Buildings
Number of New Seats
NYC Independent Budget Office September 2011 25
▲
▲
▲
▲
▲
▲▲
▲▲
▲▲
▲
▲
▲
▲
▲
▲▲
▲
▲
▲
■
▲
▲
▲
▲▲
▲
▲▲
▲▲
■
▲
▲▲
▲ ▲▲▲
▲▲▲▲
▲▲▲
▲▲▲
■▲▲ ▲
▲
■
▲
▲ ▲
■▲
▲▲ ▲
▲
■
▲▲
▲
▲
▲
▲
▲
▲
▲
■
■▲■
■■ ■
■▲
■■▲▲
■▲
▲
■▲
■
■ ▲▲
▲▲
▲
▲▲▲
▲
▲
■▲
■
■■
▲
▲■▲▲
▲
▲
■■ ▲▲
▲
▲▲
▲
▲■
■▲
■▲▲▲
▲
■▲▲
▲▲
▲▲▲
▲▲
■▲
■
▲■▲■
▲■
■■ ▲
▲▲
▲
▲▲
▲▲▲▲■
▲
▲▲
▲
▲
■
▲
▲
■■
■
■
■
■
■
▲
▲▲
▲▲▲▲
■■▲▲
■▲
▲▲
▲ ■■■
▲▲
▲
▲
▲▲
■■▲▲▲
▲▲
▲▲▲
▲
▲▲▲
■■
■
▲▲▲
▲▲
▲
▲▲▲
▲
▲
▲
▲
▲▲
▲
▲
▲
▲
▲▲
▲▲
▲▲▲▲
▲
■▲
▲
■■▲■ ▲
■▲▲▲▲
▲▲■
▲
▲
▲▲
■■
▲
■
▲
▲
■■▲▲
▲▲▲
▲▲
▲
▲
▲
▲
▲
▲▲
▲▲▲
▲
▲▲▲
▲ ▲
▲
▲
▲
▲
▲
▲31
2
27
2526
29
11
22
24
30
10
8
28
20
8
3
2721
15
6
19
9
18
14
7
17
5
13
1
12
4
322
27
23
4
16
7
19
1918
18
10
Figure 3.1Schools That Opened or Closed Since 2005-2006
▲ New ■ Closed
NOTE: Data through 2009-2010 school year.
NYC Independent Budget Office September 201126
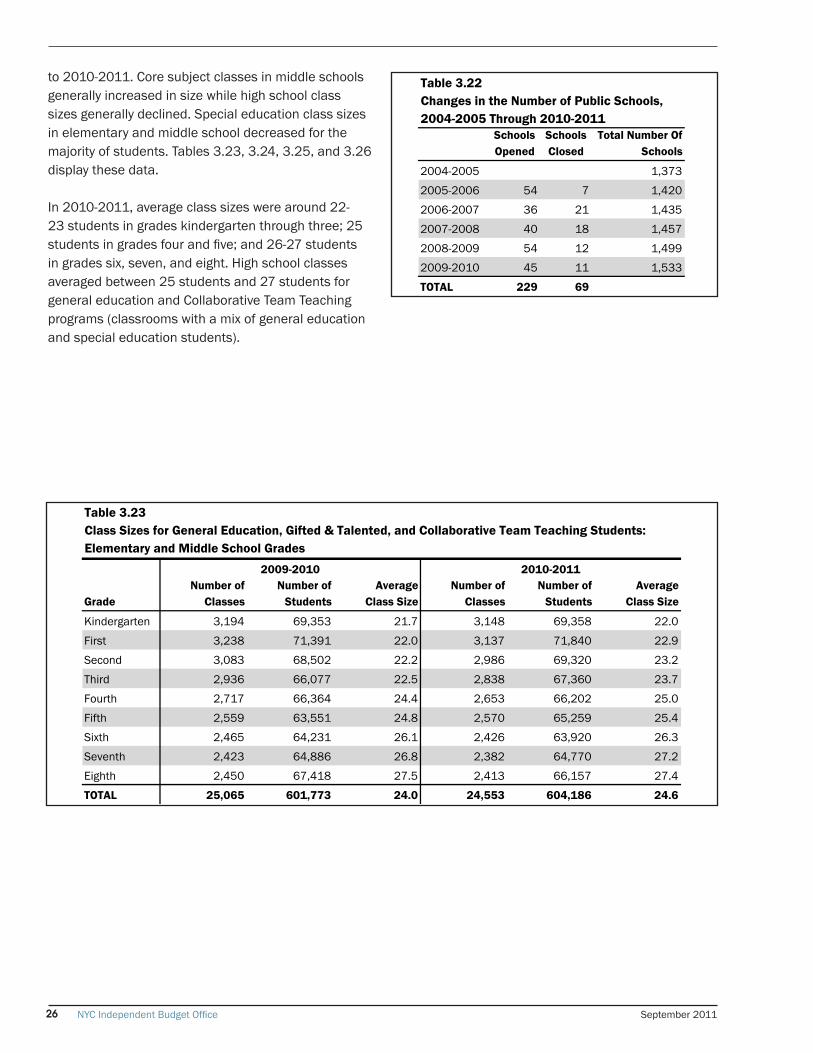
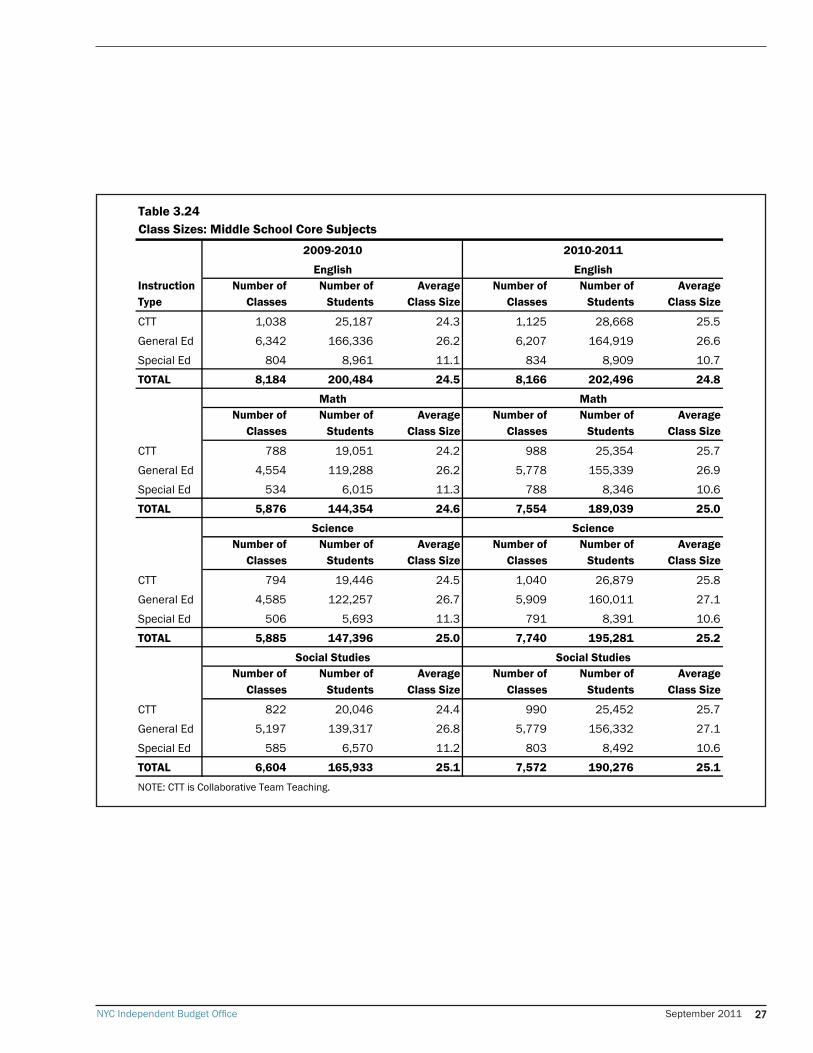
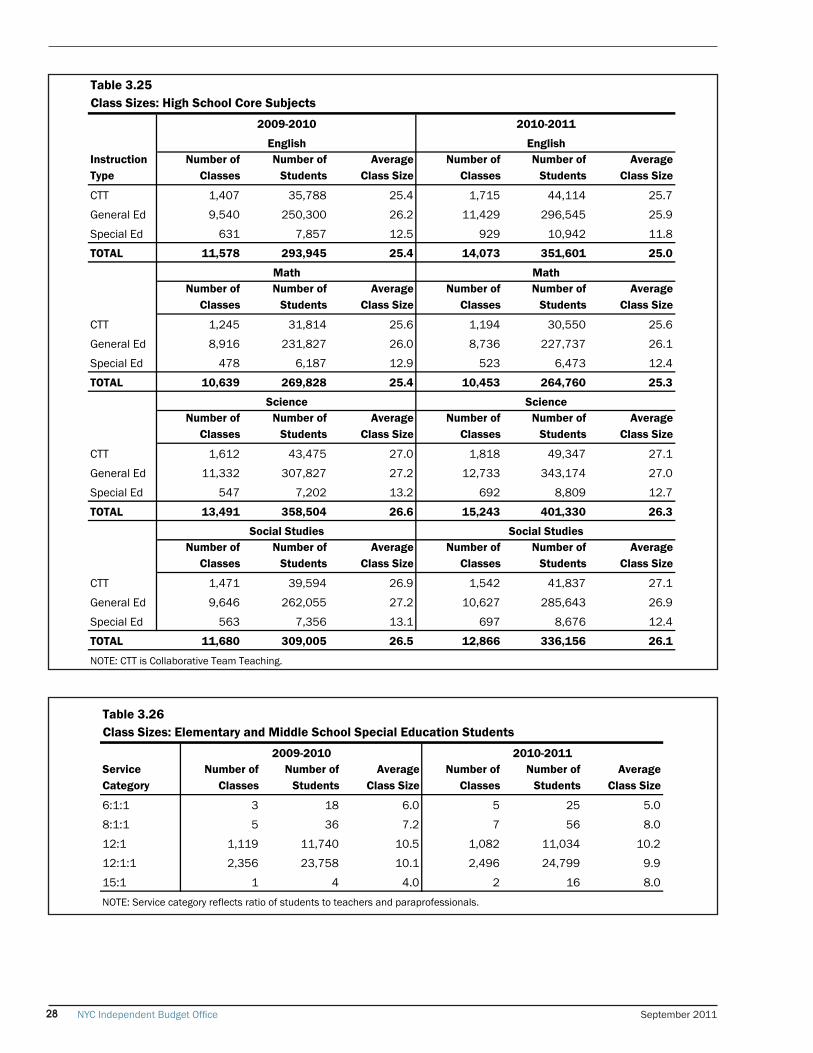
to 2010-2011. Core subject classes in middle schools generally increased in size while high school class sizes generally declined. Special education class sizes in elementary and middle school decreased for the majority of students. Tables 3.23, 3.24, 3.25, and 3.26 display these data.
In 2010-2011, average class sizes were around 22-23 students in grades kindergarten through three; 25 students in grades four and five; and 26-27 students in grades six, seven, and eight. High school classes averaged between 25 students and 27 students for general education and Collaborative Team Teaching programs (classrooms with a mix of general education and special education students).
GradeNumber of
ClassesNumber of
StudentsAverage
Class SizeNumber of
ClassesNumber of
StudentsAverage
Class Size
Kindergarten 3,194 69,353 21.7 3,148 69,358 22.0
First 3,238 71,391 22.0 3,137 71,840 22.9
Second 3,083 68,502 22.2 2,986 69,320 23.2
Third 2,936 66,077 22.5 2,838 67,360 23.7
Fourth 2,717 66,364 24.4 2,653 66,202 25.0
Fifth 2,559 63,551 24.8 2,570 65,259 25.4
Sixth 2,465 64,231 26.1 2,426 63,920 26.3
Seventh 2,423 64,886 26.8 2,382 64,770 27.2
Eighth 2,450 67,418 27.5 2,413 66,157 27.4
TOTAL 25,065 601,773 24.0 24,553 604,186 24.6
Table 3.23Class Sizes for General Education, Gifted & Talented, and Collaborative Team Teaching Students: Elementary and Middle School Grades
2009-2010 2010-2011
Schools Opened
Schools Closed
Total Number Of Schools
2004-2005 1,373
2005-2006 54 7 1,420
2006-2007 36 21 1,435
2007-2008 40 18 1,457
2008-2009 54 12 1,499
2009-2010 45 11 1,533
TOTAL 229 69
Table 3.22Changes in the Number of Public Schools,2004-2005 Through 2010-2011
NYC Independent Budget Office September 2011 27
InstructionType
Number ofClasses
Number of Students
AverageClass Size
Number ofClasses
Number of Students
AverageClass Size
CTT 1,038 25,187 24.3 1,125 28,668 25.5
General Ed 6,342 166,336 26.2 6,207 164,919 26.6
Special Ed 804 8,961 11.1 834 8,909 10.7
TOTAL 8,184 200,484 24.5 8,166 202,496 24.8
Number ofClasses
Number of Students
AverageClass Size
Number ofClasses
Number of Students
AverageClass Size
CTT 788 19,051 24.2 988 25,354 25.7
General Ed 4,554 119,288 26.2 5,778 155,339 26.9
Special Ed 534 6,015 11.3 788 8,346 10.6
TOTAL 5,876 144,354 24.6 7,554 189,039 25.0
Number ofClasses
Number of Students
AverageClass Size
Number ofClasses
Number of Students
AverageClass Size
CTT 794 19,446 24.5 1,040 26,879 25.8
General Ed 4,585 122,257 26.7 5,909 160,011 27.1
Special Ed 506 5,693 11.3 791 8,391 10.6
TOTAL 5,885 147,396 25.0 7,740 195,281 25.2
Number ofClasses
Number of Students
AverageClass Size
Number ofClasses
Number of Students
Average Class Size
CTT 822 20,046 24.4 990 25,452 25.7
General Ed 5,197 139,317 26.8 5,779 156,332 27.1
Special Ed 585 6,570 11.2 803 8,492 10.6
TOTAL 6,604 165,933 25.1 7,572 190,276 25.1
Science
Social Studies
NOTE: CTT is Collaborative Team Teaching.
Science
Social Studies
Table 3.24Class Sizes: Middle School Core Subjects
2010-2011
English
Math
2009-2010
English
Math
NYC Independent Budget Office September 201128
InstructionType
Number ofClasses
Number of Students
AverageClass Size
Number ofClasses
Number of Students
AverageClass Size
CTT 1,407 35,788 25.4 1,715 44,114 25.7
General Ed 9,540 250,300 26.2 11,429 296,545 25.9
Special Ed 631 7,857 12.5 929 10,942 11.8
TOTAL 11,578 293,945 25.4 14,073 351,601 25.0
Number ofClasses
Number of Students
AverageClass Size
Number ofClasses
Number of Students
AverageClass Size
CTT 1,245 31,814 25.6 1,194 30,550 25.6
General Ed 8,916 231,827 26.0 8,736 227,737 26.1
Special Ed 478 6,187 12.9 523 6,473 12.4
TOTAL 10,639 269,828 25.4 10,453 264,760 25.3
Number ofClasses
Number of Students
AverageClass Size
Number ofClasses
Number of Students
AverageClass Size
CTT 1,612 43,475 27.0 1,818 49,347 27.1
General Ed 11,332 307,827 27.2 12,733 343,174 27.0
Special Ed 547 7,202 13.2 692 8,809 12.7
TOTAL 13,491 358,504 26.6 15,243 401,330 26.3
Number ofClasses
Number of Students
AverageClass Size
Number ofClasses
Number of Students
AverageClass Size
CTT 1,471 39,594 26.9 1,542 41,837 27.1
General Ed 9,646 262,055 27.2 10,627 285,643 26.9
Special Ed 563 7,356 13.1 697 8,676 12.4
TOTAL 11,680 309,005 26.5 12,866 336,156 26.1
NOTE: CTT is Collaborative Team Teaching.
Social Studies
2009-2010
English
Math
Science
Social Studies
Table 3.25Class Sizes: High School Core Subjects
2010-2011
English
Math
Science
Service Category
Number of Classes
Number of Students
AverageClass Size
Number of Classes
Number of Students
AverageClass Size
6:1:1 3 18 6.0 5 25 5.0
8:1:1 5 36 7.2 7 56 8.0
12:1 1,119 11,740 10.5 1,082 11,034 10.2
12:1:1 2,356 23,758 10.1 2,496 24,799 9.9
15:1 1 4 4.0 2 16 8.0
Table 3.26Class Sizes: Elementary and Middle School Special Education Students
2010-20112009-2010
NOTE: Service category reflects ratio of students to teachers and paraprofessionals.
NYC Independent Budget Office September 2011 29
What Do Some Indicators of School Performance Show?4
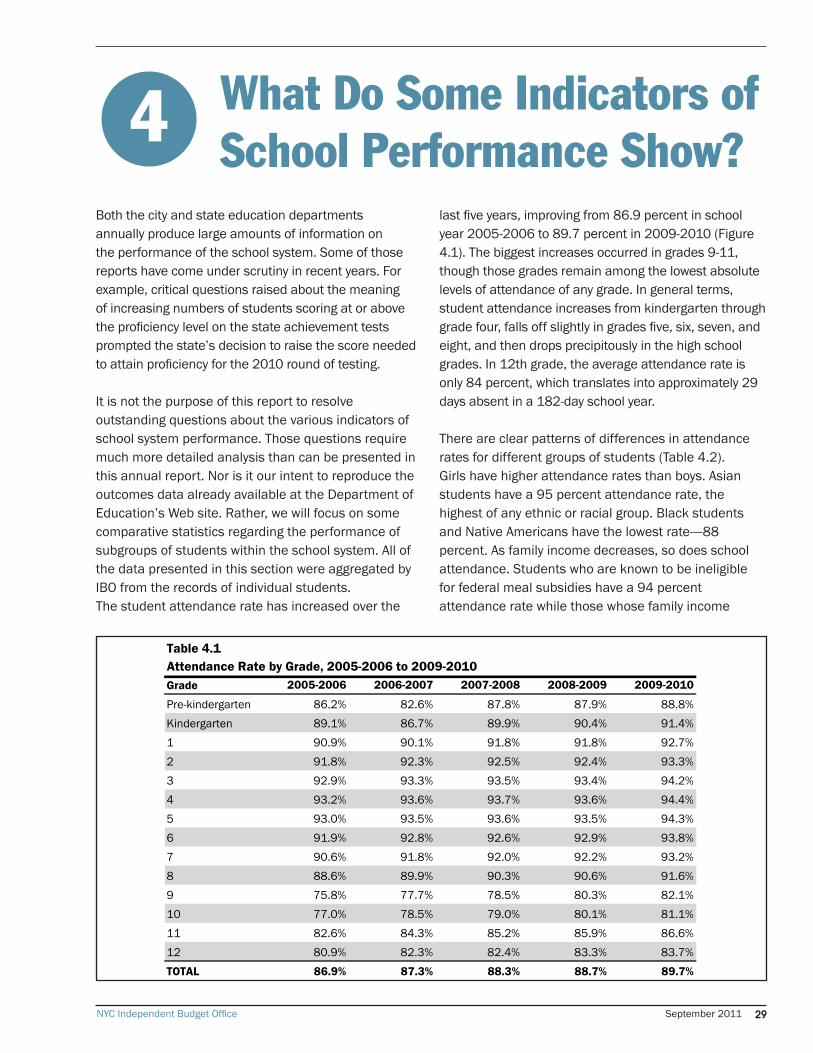
Both the city and state education departments annually produce large amounts of information on the performance of the school system. Some of those reports have come under scrutiny in recent years. For example, critical questions raised about the meaning of increasing numbers of students scoring at or above the proficiency level on the state achievement tests prompted the state’s decision to raise the score needed to attain proficiency for the 2010 round of testing.
It is not the purpose of this report to resolve outstanding questions about the various indicators of school system performance. Those questions require much more detailed analysis than can be presented in this annual report. Nor is it our intent to reproduce the outcomes data already available at the Department of Education’s Web site. Rather, we will focus on some comparative statistics regarding the performance of subgroups of students within the school system. All of the data presented in this section were aggregated by IBO from the records of individual students. The student attendance rate has increased over the
last five years, improving from 86.9 percent in school year 2005-2006 to 89.7 percent in 2009-2010 (Figure 4.1). The biggest increases occurred in grades 9-11, though those grades remain among the lowest absolute levels of attendance of any grade. In general terms, student attendance increases from kindergarten through grade four, falls off slightly in grades five, six, seven, and eight, and then drops precipitously in the high school grades. In 12th grade, the average attendance rate is only 84 percent, which translates into approximately 29 days absent in a 182-day school year.
There are clear patterns of differences in attendance rates for different groups of students (Table 4.2). Girls have higher attendance rates than boys. Asian students have a 95 percent attendance rate, the highest of any ethnic or racial group. Black students and Native Americans have the lowest rate-—88 percent. As family income decreases, so does school attendance. Students who are known to be ineligible for federal meal subsidies have a 94 percent attendance rate while those whose family income
Grade 2005-2006 2006-2007 2007-2008 2008-2009 2009-2010
Pre-kindergarten 86.2% 82.6% 87.8% 87.9% 88.8%Kindergarten 89.1% 86.7% 89.9% 90.4% 91.4%1 90.9% 90.1% 91.8% 91.8% 92.7%2 91.8% 92.3% 92.5% 92.4% 93.3%3 92.9% 93.3% 93.5% 93.4% 94.2%4 93.2% 93.6% 93.7% 93.6% 94.4%5 93.0% 93.5% 93.6% 93.5% 94.3%6 91.9% 92.8% 92.6% 92.9% 93.8%7 90.6% 91.8% 92.0% 92.2% 93.2%8 88.6% 89.9% 90.3% 90.6% 91.6%9 75.8% 77.7% 78.5% 80.3% 82.1%10 77.0% 78.5% 79.0% 80.1% 81.1%11 82.6% 84.3% 85.2% 85.9% 86.6%12 80.9% 82.3% 82.4% 83.3% 83.7%TOTAL 86.9% 87.3% 88.3% 88.7% 89.7%
Table 4.1Attendance Rate by Grade, 2005-2006 to 2009-2010
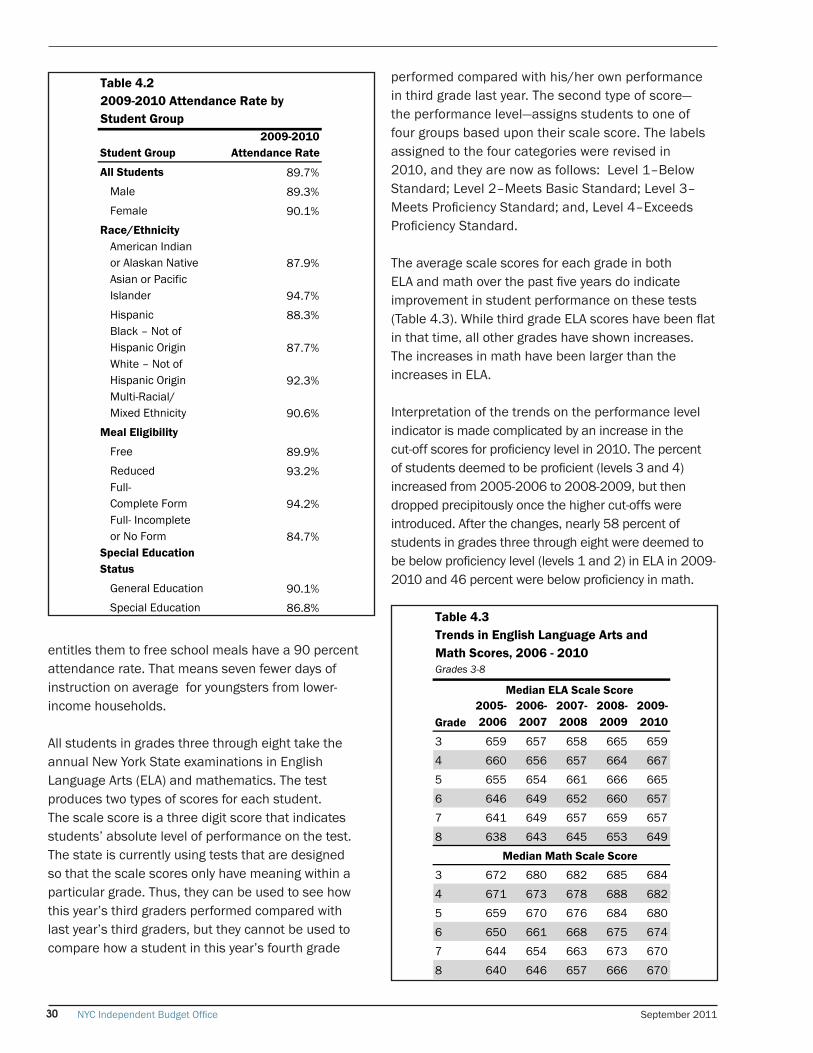
NYC Independent Budget Office September 201130
entitles them to free school meals have a 90 percent attendance rate. That means seven fewer days of instruction on average for youngsters from lower-income households.
All students in grades three through eight take the annual New York State examinations in English Language Arts (ELA) and mathematics. The test produces two types of scores for each student. The scale score is a three digit score that indicates students’ absolute level of performance on the test. The state is currently using tests that are designed so that the scale scores only have meaning within a particular grade. Thus, they can be used to see how this year’s third graders performed compared with last year’s third graders, but they cannot be used to compare how a student in this year’s fourth grade
performed compared with his/her own performance in third grade last year. The second type of score—the performance level—assigns students to one of four groups based upon their scale score. The labels assigned to the four categories were revised in 2010, and they are now as follows: Level 1–Below Standard; Level 2–Meets Basic Standard; Level 3–Meets Proficiency Standard; and, Level 4–Exceeds Proficiency Standard.
The average scale scores for each grade in both ELA and math over the past five years do indicate improvement in student performance on these tests (Table 4.3). While third grade ELA scores have been flat in that time, all other grades have shown increases. The increases in math have been larger than the increases in ELA.
Interpretation of the trends on the performance level indicator is made complicated by an increase in the cut-off scores for proficiency level in 2010. The percent of students deemed to be proficient (levels 3 and 4) increased from 2005-2006 to 2008-2009, but then dropped precipitously once the higher cut-offs were introduced. After the changes, nearly 58 percent of students in grades three through eight were deemed to be below proficiency level (levels 1 and 2) in ELA in 2009-2010 and 46 percent were below proficiency in math.
Student Group2009-2010
Attendance Rate
All Students 89.7%Male 89.3%Female 90.1%
Race/EthnicityAmerican Indianor Alaskan Native 87.9%Asian or Pacific Islander 94.7%Hispanic 88.3%Black – Not of Hispanic Origin 87.7%White – Not of Hispanic Origin 92.3%Multi-Racial/Mixed Ethnicity 90.6%
Meal Eligibility
Free 89.9%Reduced 93.2%Full-Complete Form 94.2%Full- Incompleteor No Form 84.7%
Special Education Status
General Education 90.1%Special Education 86.8%
Table 4.22009-2010 Attendance Rate by Student Group
Grade2005-2006
2006-2007
2007-2008
2008-2009
2009-2010
3 659 657 658 665 6594 660 656 657 664 6675 655 654 661 666 6656 646 649 652 660 6577 641 649 657 659 6578 638 643 645 653 649
3 672 680 682 685 6844 671 673 678 688 6825 659 670 676 684 6806 650 661 668 675 6747 644 654 663 673 6708 640 646 657 666 670
Median ELA Scale Score
Median Math Scale Score
Table 4.3Trends in English Language Arts andMath Scores, 2006 - 2010Grades 3-8
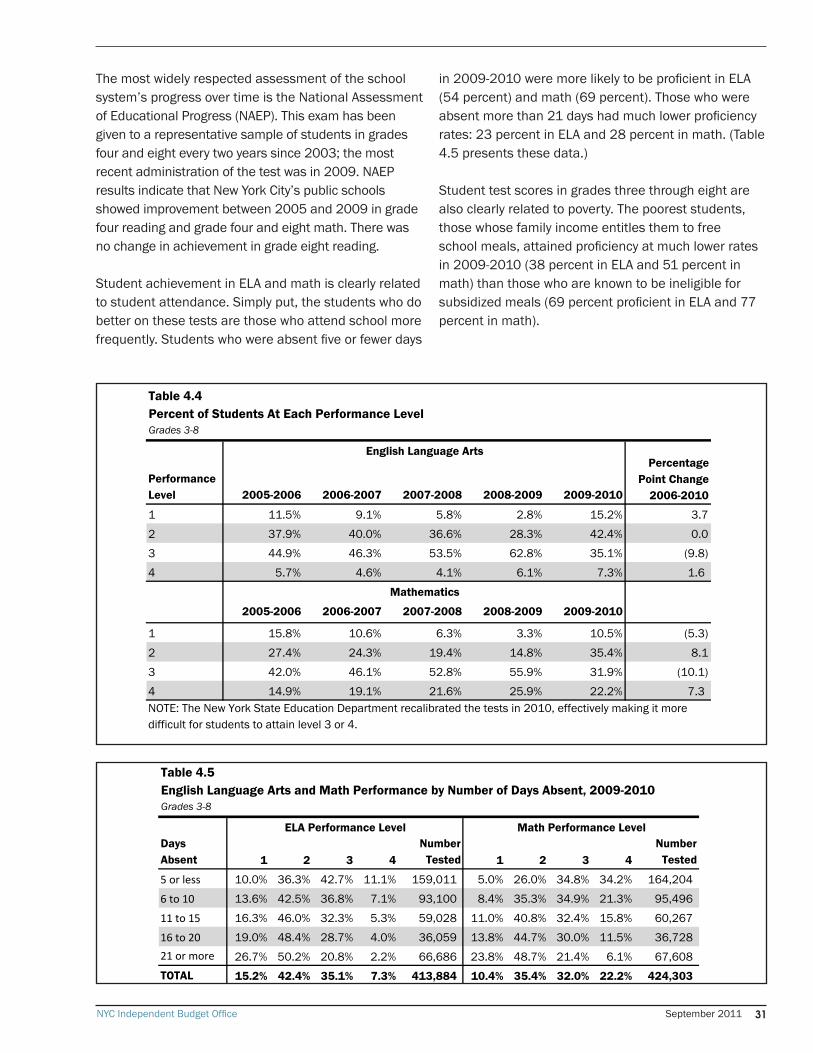
NYC Independent Budget Office September 2011 31
The most widely respected assessment of the school system’s progress over time is the National Assessment of Educational Progress (NAEP). This exam has been given to a representative sample of students in grades four and eight every two years since 2003; the most recent administration of the test was in 2009. NAEP results indicate that New York City’s public schools showed improvement between 2005 and 2009 in grade four reading and grade four and eight math. There was no change in achievement in grade eight reading.
Student achievement in ELA and math is clearly related to student attendance. Simply put, the students who do better on these tests are those who attend school more frequently. Students who were absent five or fewer days
in 2009-2010 were more likely to be proficient in ELA (54 percent) and math (69 percent). Those who were absent more than 21 days had much lower proficiency rates: 23 percent in ELA and 28 percent in math. (Table 4.5 presents these data.)
Student test scores in grades three through eight are also clearly related to poverty. The poorest students, those whose family income entitles them to free school meals, attained proficiency at much lower rates in 2009-2010 (38 percent in ELA and 51 percent in math) than those who are known to be ineligible for subsidized meals (69 percent proficient in ELA and 77 percent in math).
PerformanceLevel 2005-2006 2006-2007 2007-2008 2008-2009 2009-2010
1 11.5% 9.1% 5.8% 2.8% 15.2% 3.7
2 37.9% 40.0% 36.6% 28.3% 42.4% 0.0
3 44.9% 46.3% 53.5% 62.8% 35.1% (9.8)
4 5.7% 4.6% 4.1% 6.1% 7.3% 1.6
2005-2006 2006-2007 2007-2008 2008-2009 2009-2010
1 15.8% 10.6% 6.3% 3.3% 10.5% (5.3)
2 27.4% 24.3% 19.4% 14.8% 35.4% 8.1
3 42.0% 46.1% 52.8% 55.9% 31.9% (10.1)
4 14.9% 19.1% 21.6% 25.9% 22.2% 7.3
Table 4.4Percent of Students At Each Performance LevelGrades 3-8
English Language Arts
Mathematics
NOTE: The New York State Education Department recalibrated the tests in 2010, effectively making it more difficult for students to attain level 3 or 4.
Percentage Point Change
2006-2010
Days Absent 1 2 3 4
Number Tested 1 2 3 4
Number Tested
5 or less 10.0% 36.3% 42.7% 11.1% 159,011 5.0% 26.0% 34.8% 34.2% 164,204
6 to 10 13.6% 42.5% 36.8% 7.1% 93,100 8.4% 35.3% 34.9% 21.3% 95,496
11 to 15 16.3% 46.0% 32.3% 5.3% 59,028 11.0% 40.8% 32.4% 15.8% 60,267
16 to 20 19.0% 48.4% 28.7% 4.0% 36,059 13.8% 44.7% 30.0% 11.5% 36,728 21 or more 26.7% 50.2% 20.8% 2.2% 66,686 23.8% 48.7% 21.4% 6.1% 67,608 TOTAL 15.2% 42.4% 35.1% 7.3% 413,884 10.4% 35.4% 32.0% 22.2% 424,303
Table 4.5English Language Arts and Math Performance by Number of Days Absent, 2009-2010Grades 3-8
ELA Performance Level Math Performance Level
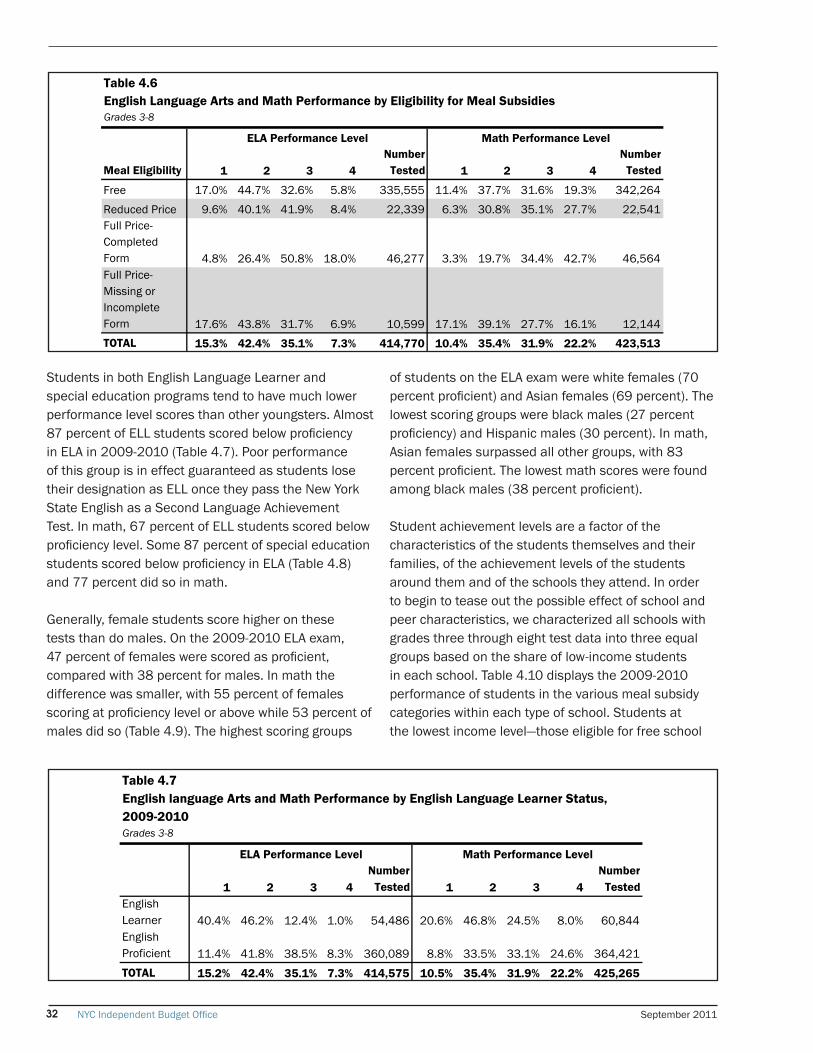
NYC Independent Budget Office September 201132
Students in both English Language Learner and special education programs tend to have much lower performance level scores than other youngsters. Almost 87 percent of ELL students scored below proficiency in ELA in 2009-2010 (Table 4.7). Poor performance of this group is in effect guaranteed as students lose their designation as ELL once they pass the New York State English as a Second Language Achievement Test. In math, 67 percent of ELL students scored below proficiency level. Some 87 percent of special education students scored below proficiency in ELA (Table 4.8) and 77 percent did so in math.
Generally, female students score higher on these tests than do males. On the 2009-2010 ELA exam, 47 percent of females were scored as proficient, compared with 38 percent for males. In math the difference was smaller, with 55 percent of females scoring at proficiency level or above while 53 percent of males did so (Table 4.9). The highest scoring groups
of students on the ELA exam were white females (70 percent proficient) and Asian females (69 percent). The lowest scoring groups were black males (27 percent proficiency) and Hispanic males (30 percent). In math, Asian females surpassed all other groups, with 83 percent proficient. The lowest math scores were found among black males (38 percent proficient).
Student achievement levels are a factor of the characteristics of the students themselves and their families, of the achievement levels of the students around them and of the schools they attend. In order to begin to tease out the possible effect of school and peer characteristics, we characterized all schools with grades three through eight test data into three equal groups based on the share of low-income students in each school. Table 4.10 displays the 2009-2010 performance of students in the various meal subsidy categories within each type of school. Students at the lowest income level—those eligible for free school
Meal Eligibility 1 2 3 4 Number
Tested 1 2 3 4 Number
Tested
Free 17.0% 44.7% 32.6% 5.8% 335,555 11.4% 37.7% 31.6% 19.3% 342,264
Reduced Price 9.6% 40.1% 41.9% 8.4% 22,339 6.3% 30.8% 35.1% 27.7% 22,541Full Price-Completed Form 4.8% 26.4% 50.8% 18.0% 46,277 3.3% 19.7% 34.4% 42.7% 46,564Full Price- Missing or IncompleteForm 17.6% 43.8% 31.7% 6.9% 10,599 17.1% 39.1% 27.7% 16.1% 12,144TOTAL 15.3% 42.4% 35.1% 7.3% 414,770 10.4% 35.4% 31.9% 22.2% 423,513
Table 4.6English Language Arts and Math Performance by Eligibility for Meal SubsidiesGrades 3-8
ELA Performance Level Math Performance Level
1 2 3 4 Number
Tested 1 2 3 4 Number
Tested English Learner 40.4% 46.2% 12.4% 1.0% 54,486 20.6% 46.8% 24.5% 8.0% 60,844English Proficient 11.4% 41.8% 38.5% 8.3% 360,089 8.8% 33.5% 33.1% 24.6% 364,421TOTAL 15.2% 42.4% 35.1% 7.3% 414,575 10.5% 35.4% 31.9% 22.2% 425,265
Table 4.7English language Arts and Math Performance by English Language Learner Status, 2009-2010Grades 3-8
ELA Performance Level Math Performance Level
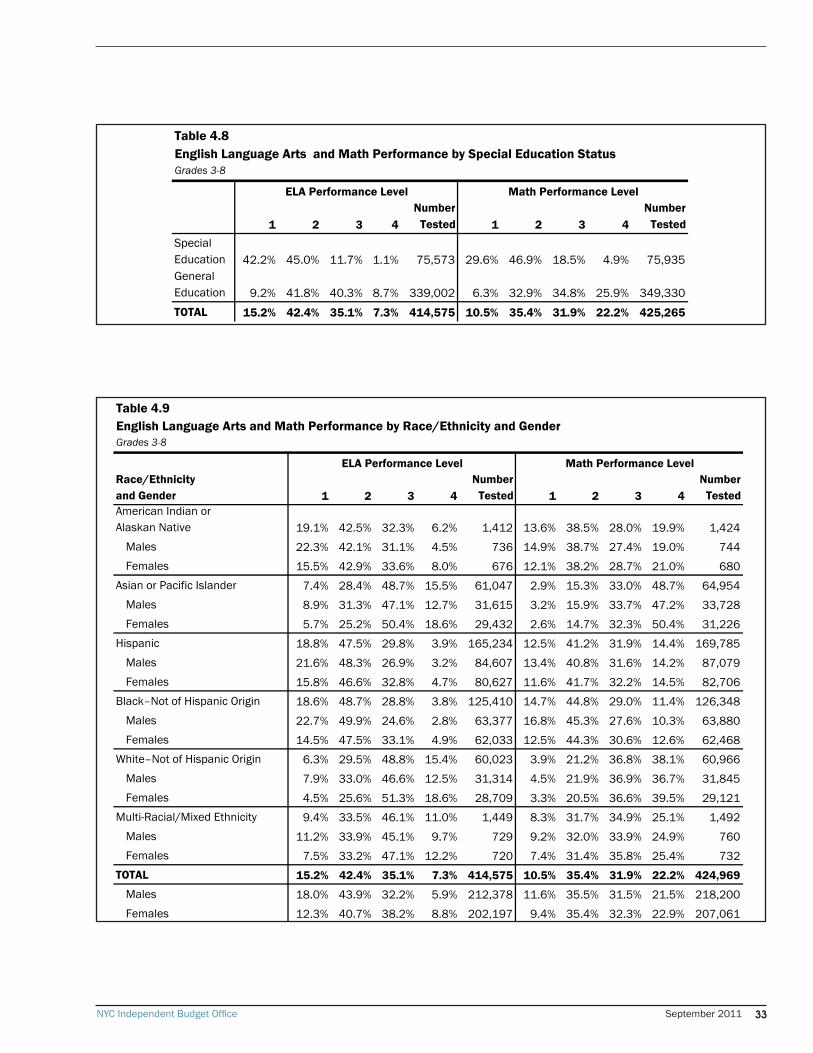
NYC Independent Budget Office September 2011 33
1 2 3 4 Number
Tested 1 2 3 4 Number
Tested Special Education 42.2% 45.0% 11.7% 1.1% 75,573 29.6% 46.9% 18.5% 4.9% 75,935General Education 9.2% 41.8% 40.3% 8.7% 339,002 6.3% 32.9% 34.8% 25.9% 349,330TOTAL 15.2% 42.4% 35.1% 7.3% 414,575 10.5% 35.4% 31.9% 22.2% 425,265
Table 4.8English Language Arts and Math Performance by Special Education StatusGrades 3-8
ELA Performance Level Math Performance Level
Race/Ethnicityand Gender 1 2 3 4
Number Tested 1 2 3 4
Number Tested
American Indian orAlaskan Native 19.1% 42.5% 32.3% 6.2% 1,412 13.6% 38.5% 28.0% 19.9% 1,424
Males 22.3% 42.1% 31.1% 4.5% 736 14.9% 38.7% 27.4% 19.0% 744Females 15.5% 42.9% 33.6% 8.0% 676 12.1% 38.2% 28.7% 21.0% 680
Asian or Pacific Islander 7.4% 28.4% 48.7% 15.5% 61,047 2.9% 15.3% 33.0% 48.7% 64,954Males 8.9% 31.3% 47.1% 12.7% 31,615 3.2% 15.9% 33.7% 47.2% 33,728Females 5.7% 25.2% 50.4% 18.6% 29,432 2.6% 14.7% 32.3% 50.4% 31,226
Hispanic 18.8% 47.5% 29.8% 3.9% 165,234 12.5% 41.2% 31.9% 14.4% 169,785Males 21.6% 48.3% 26.9% 3.2% 84,607 13.4% 40.8% 31.6% 14.2% 87,079Females 15.8% 46.6% 32.8% 4.7% 80,627 11.6% 41.7% 32.2% 14.5% 82,706
Black–Not of Hispanic Origin 18.6% 48.7% 28.8% 3.8% 125,410 14.7% 44.8% 29.0% 11.4% 126,348Males 22.7% 49.9% 24.6% 2.8% 63,377 16.8% 45.3% 27.6% 10.3% 63,880Females 14.5% 47.5% 33.1% 4.9% 62,033 12.5% 44.3% 30.6% 12.6% 62,468
White–Not of Hispanic Origin 6.3% 29.5% 48.8% 15.4% 60,023 3.9% 21.2% 36.8% 38.1% 60,966Males 7.9% 33.0% 46.6% 12.5% 31,314 4.5% 21.9% 36.9% 36.7% 31,845Females 4.5% 25.6% 51.3% 18.6% 28,709 3.3% 20.5% 36.6% 39.5% 29,121
Multi-Racial/Mixed Ethnicity 9.4% 33.5% 46.1% 11.0% 1,449 8.3% 31.7% 34.9% 25.1% 1,492Males 11.2% 33.9% 45.1% 9.7% 729 9.2% 32.0% 33.9% 24.9% 760Females 7.5% 33.2% 47.1% 12.2% 720 7.4% 31.4% 35.8% 25.4% 732
TOTAL 15.2% 42.4% 35.1% 7.3% 414,575 10.5% 35.4% 31.9% 22.2% 424,969
Males 18.0% 43.9% 32.2% 5.9% 212,378 11.6% 35.5% 31.5% 21.5% 218,200Females 12.3% 40.7% 38.2% 8.8% 202,197 9.4% 35.4% 32.3% 22.9% 207,061
Table 4.9English Language Arts and Math Performance by Race/Ethnicity and GenderGrades 3-8
ELA Performance Level Math Performance Level
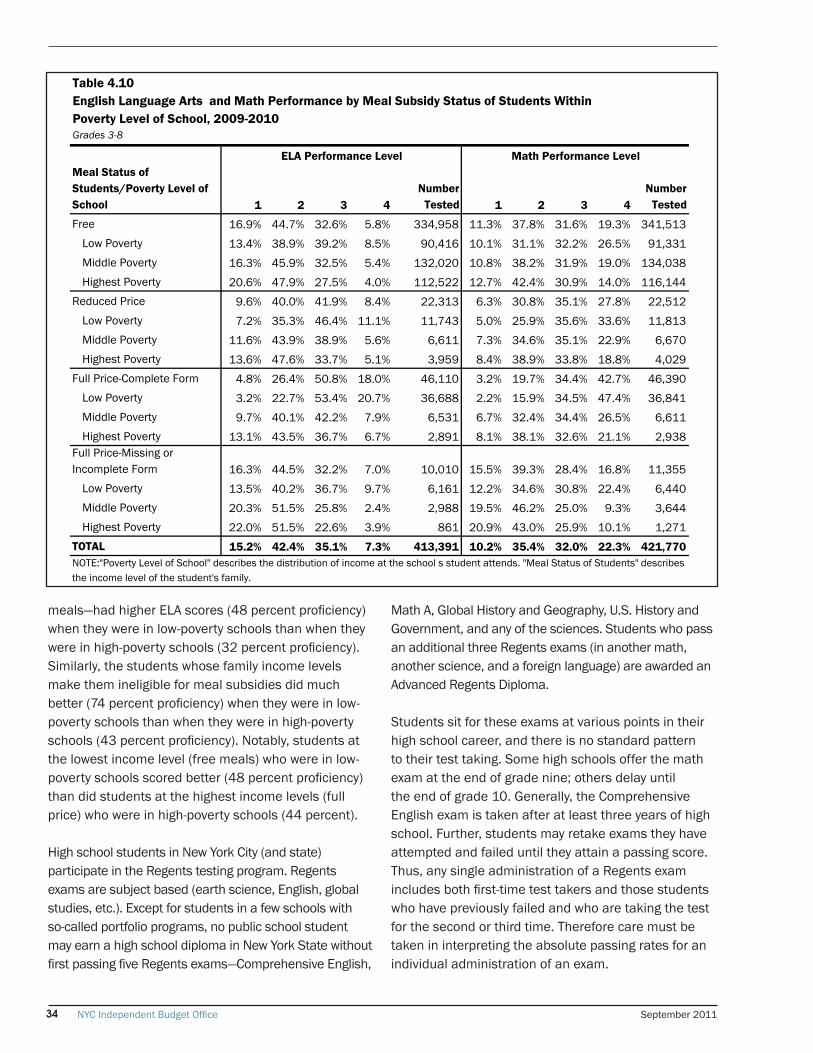
NYC Independent Budget Office September 201134
meals—had higher ELA scores (48 percent proficiency) when they were in low-poverty schools than when they were in high-poverty schools (32 percent proficiency). Similarly, the students whose family income levels make them ineligible for meal subsidies did much better (74 percent proficiency) when they were in low-poverty schools than when they were in high-poverty schools (43 percent proficiency). Notably, students at the lowest income level (free meals) who were in low-poverty schools scored better (48 percent proficiency) than did students at the highest income levels (full price) who were in high-poverty schools (44 percent).
High school students in New York City (and state) participate in the Regents testing program. Regents exams are subject based (earth science, English, global studies, etc.). Except for students in a few schools with so-called portfolio programs, no public school student may earn a high school diploma in New York State without first passing five Regents exams—Comprehensive English,
Math A, Global History and Geography, U.S. History and Government, and any of the sciences. Students who pass an additional three Regents exams (in another math, another science, and a foreign language) are awarded an Advanced Regents Diploma.
Students sit for these exams at various points in their high school career, and there is no standard pattern to their test taking. Some high schools offer the math exam at the end of grade nine; others delay until the end of grade 10. Generally, the Comprehensive English exam is taken after at least three years of high school. Further, students may retake exams they have attempted and failed until they attain a passing score. Thus, any single administration of a Regents exam includes both first-time test takers and those students who have previously failed and who are taking the test for the second or third time. Therefore care must be taken in interpreting the absolute passing rates for an individual administration of an exam.
Meal Status of Students/Poverty Level of School 1 2 3 4
Number Tested 1 2 3 4
Number Tested
Free 16.9% 44.7% 32.6% 5.8% 334,958 11.3% 37.8% 31.6% 19.3% 341,513Low Poverty 13.4% 38.9% 39.2% 8.5% 90,416 10.1% 31.1% 32.2% 26.5% 91,331Middle Poverty 16.3% 45.9% 32.5% 5.4% 132,020 10.8% 38.2% 31.9% 19.0% 134,038Highest Poverty 20.6% 47.9% 27.5% 4.0% 112,522 12.7% 42.4% 30.9% 14.0% 116,144
Reduced Price 9.6% 40.0% 41.9% 8.4% 22,313 6.3% 30.8% 35.1% 27.8% 22,512Low Poverty 7.2% 35.3% 46.4% 11.1% 11,743 5.0% 25.9% 35.6% 33.6% 11,813Middle Poverty 11.6% 43.9% 38.9% 5.6% 6,611 7.3% 34.6% 35.1% 22.9% 6,670Highest Poverty 13.6% 47.6% 33.7% 5.1% 3,959 8.4% 38.9% 33.8% 18.8% 4,029
Full Price-Complete Form 4.8% 26.4% 50.8% 18.0% 46,110 3.2% 19.7% 34.4% 42.7% 46,390Low Poverty 3.2% 22.7% 53.4% 20.7% 36,688 2.2% 15.9% 34.5% 47.4% 36,841Middle Poverty 9.7% 40.1% 42.2% 7.9% 6,531 6.7% 32.4% 34.4% 26.5% 6,611Highest Poverty 13.1% 43.5% 36.7% 6.7% 2,891 8.1% 38.1% 32.6% 21.1% 2,938
Full Price-Missing or Incomplete Form 16.3% 44.5% 32.2% 7.0% 10,010 15.5% 39.3% 28.4% 16.8% 11,355
Low Poverty 13.5% 40.2% 36.7% 9.7% 6,161 12.2% 34.6% 30.8% 22.4% 6,440Middle Poverty 20.3% 51.5% 25.8% 2.4% 2,988 19.5% 46.2% 25.0% 9.3% 3,644Highest Poverty 22.0% 51.5% 22.6% 3.9% 861 20.9% 43.0% 25.9% 10.1% 1,271
TOTAL 15.2% 42.4% 35.1% 7.3% 413,391 10.2% 35.4% 32.0% 22.3% 421,770
Table 4.10English Language Arts and Math Performance by Meal Subsidy Status of Students WithinPoverty Level of School, 2009-2010Grades 3-8
ELA Performance Level Math Performance Level
NOTE:"Poverty Level of School" describes the distribution of income at the school s student attends. "Meal Status of Students" describes the income level of the student's family.
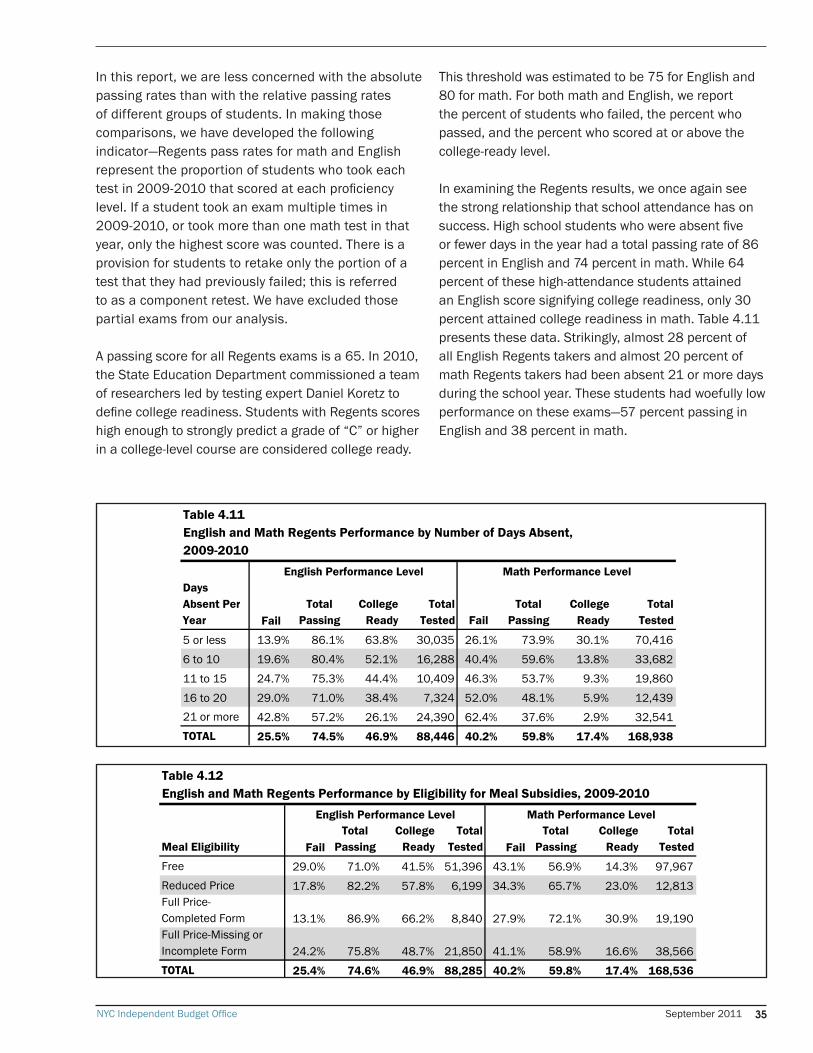
NYC Independent Budget Office September 2011 35
In this report, we are less concerned with the absolute passing rates than with the relative passing rates of different groups of students. In making those comparisons, we have developed the following indicator—Regents pass rates for math and English represent the proportion of students who took each test in 2009-2010 that scored at each proficiency level. If a student took an exam multiple times in 2009-2010, or took more than one math test in that year, only the highest score was counted. There is a provision for students to retake only the portion of a test that they had previously failed; this is referred to as a component retest. We have excluded those partial exams from our analysis.
A passing score for all Regents exams is a 65. In 2010, the State Education Department commissioned a team of researchers led by testing expert Daniel Koretz to define college readiness. Students with Regents scores high enough to strongly predict a grade of “C” or higher in a college-level course are considered college ready.
This threshold was estimated to be 75 for English and 80 for math. For both math and English, we report the percent of students who failed, the percent who passed, and the percent who scored at or above the college-ready level.
In examining the Regents results, we once again see the strong relationship that school attendance has on success. High school students who were absent five or fewer days in the year had a total passing rate of 86 percent in English and 74 percent in math. While 64 percent of these high-attendance students attained an English score signifying college readiness, only 30 percent attained college readiness in math. Table 4.11 presents these data. Strikingly, almost 28 percent of all English Regents takers and almost 20 percent of math Regents takers had been absent 21 or more days during the school year. These students had woefully low performance on these exams—57 percent passing in English and 38 percent in math.
Days Absent Per Year Fail
Total Passing
College Ready
Total Tested Fail
Total Passing
College Ready
Total Tested
5 or less 13.9% 86.1% 63.8% 30,035 26.1% 73.9% 30.1% 70,416
6 to 10 19.6% 80.4% 52.1% 16,288 40.4% 59.6% 13.8% 33,682
11 to 15 24.7% 75.3% 44.4% 10,409 46.3% 53.7% 9.3% 19,860
16 to 20 29.0% 71.0% 38.4% 7,324 52.0% 48.1% 5.9% 12,43921 or more 42.8% 57.2% 26.1% 24,390 62.4% 37.6% 2.9% 32,541TOTAL 25.5% 74.5% 46.9% 88,446 40.2% 59.8% 17.4% 168,938
Table 4.11English and Math Regents Performance by Number of Days Absent,2009-2010
English Performance Level Math Performance Level
Meal Eligibility FailTotal
PassingCollege
Ready Total
Tested FailTotal
PassingCollege
Ready Total
Tested
Free 29.0% 71.0% 41.5% 51,396 43.1% 56.9% 14.3% 97,967Reduced Price 17.8% 82.2% 57.8% 6,199 34.3% 65.7% 23.0% 12,813Full Price-Completed Form 13.1% 86.9% 66.2% 8,840 27.9% 72.1% 30.9% 19,190Full Price-Missing or Incomplete Form 24.2% 75.8% 48.7% 21,850 41.1% 58.9% 16.6% 38,566TOTAL 25.4% 74.6% 46.9% 88,285 40.2% 59.8% 17.4% 168,536
Table 4.12English and Math Regents Performance by Eligibility for Meal Subsidies, 2009-2010
English Performance Level Math Performance Level
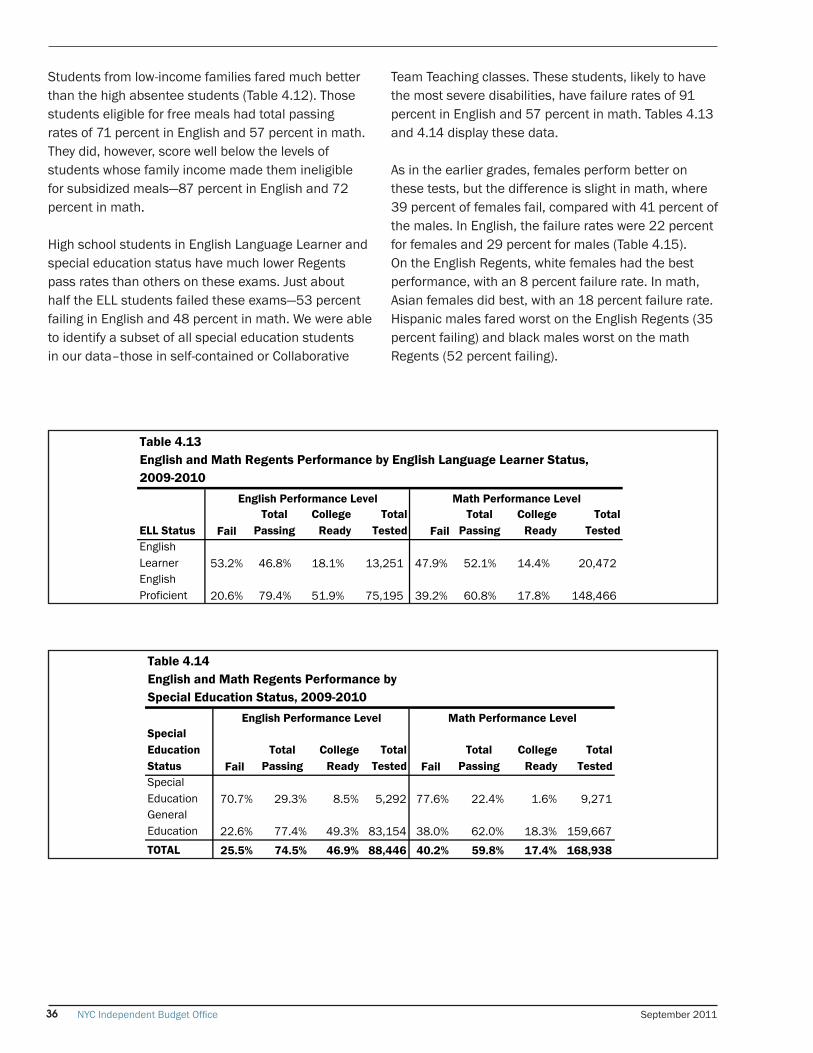
NYC Independent Budget Office September 201136
Students from low-income families fared much better than the high absentee students (Table 4.12). Those students eligible for free meals had total passing rates of 71 percent in English and 57 percent in math. They did, however, score well below the levels of students whose family income made them ineligible for subsidized meals—87 percent in English and 72 percent in math.
High school students in English Language Learner and special education status have much lower Regents pass rates than others on these exams. Just about half the ELL students failed these exams—53 percent failing in English and 48 percent in math. We were able to identify a subset of all special education students in our data–those in self-contained or Collaborative
Team Teaching classes. These students, likely to have the most severe disabilities, have failure rates of 91 percent in English and 57 percent in math. Tables 4.13 and 4.14 display these data.
As in the earlier grades, females perform better on these tests, but the difference is slight in math, where 39 percent of females fail, compared with 41 percent of the males. In English, the failure rates were 22 percent for females and 29 percent for males (Table 4.15). On the English Regents, white females had the best performance, with an 8 percent failure rate. In math, Asian females did best, with an 18 percent failure rate. Hispanic males fared worst on the English Regents (35 percent failing) and black males worst on the math Regents (52 percent failing).
ELL Status FailTotal
PassingCollege
Ready Total
Tested FailTotal
PassingCollege
Ready Total
Tested English Learner 53.2% 46.8% 18.1% 13,251 47.9% 52.1% 14.4% 20,472 English Proficient 20.6% 79.4% 51.9% 75,195 39.2% 60.8% 17.8% 148,466
Table 4.13English and Math Regents Performance by English Language Learner Status, 2009-2010
English Performance Level Math Performance Level
Special Education Status Fail
Total Passing
College Ready
Total Tested Fail
Total Passing
College Ready
Total Tested
Special Education 70.7% 29.3% 8.5% 5,292 77.6% 22.4% 1.6% 9,271General Education 22.6% 77.4% 49.3% 83,154 38.0% 62.0% 18.3% 159,667TOTAL 25.5% 74.5% 46.9% 88,446 40.2% 59.8% 17.4% 168,938
Table 4.14English and Math Regents Performance bySpecial Education Status, 2009-2010
English Performance Level Math Performance Level
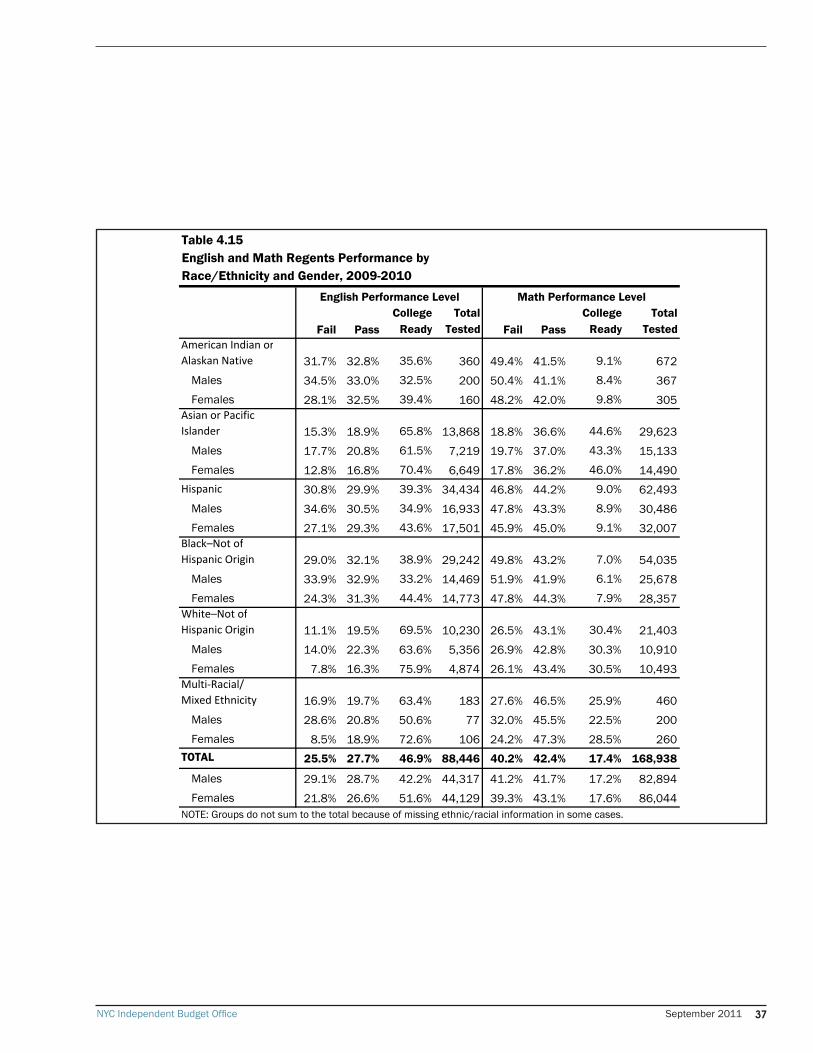
NYC Independent Budget Office September 2011 37
Fail PassCollege
Ready Total
Tested Fail PassCollege
Ready Total
Tested American Indian orAlaskan Native 31.7% 32.8% 35.6% 360 49.4% 41.5% 9.1% 672
Males 34.5% 33.0% 32.5% 200 50.4% 41.1% 8.4% 367Females 28.1% 32.5% 39.4% 160 48.2% 42.0% 9.8% 305
Asian or Pacific Islander 15.3% 18.9% 65.8% 13,868 18.8% 36.6% 44.6% 29,623
Males 17.7% 20.8% 61.5% 7,219 19.7% 37.0% 43.3% 15,133Females 12.8% 16.8% 70.4% 6,649 17.8% 36.2% 46.0% 14,490
Hispanic 30.8% 29.9% 39.3% 34,434 46.8% 44.2% 9.0% 62,493Males 34.6% 30.5% 34.9% 16,933 47.8% 43.3% 8.9% 30,486Females 27.1% 29.3% 43.6% 17,501 45.9% 45.0% 9.1% 32,007
Black–Not ofHispanic Origin 29.0% 32.1% 38.9% 29,242 49.8% 43.2% 7.0% 54,035
Males 33.9% 32.9% 33.2% 14,469 51.9% 41.9% 6.1% 25,678Females 24.3% 31.3% 44.4% 14,773 47.8% 44.3% 7.9% 28,357
White–Not ofHispanic Origin 11.1% 19.5% 69.5% 10,230 26.5% 43.1% 30.4% 21,403
Males 14.0% 22.3% 63.6% 5,356 26.9% 42.8% 30.3% 10,910Females 7.8% 16.3% 75.9% 4,874 26.1% 43.4% 30.5% 10,493
Multi‐Racial/Mixed Ethnicity 16.9% 19.7% 63.4% 183 27.6% 46.5% 25.9% 460
Males 28.6% 20.8% 50.6% 77 32.0% 45.5% 22.5% 200Females 8.5% 18.9% 72.6% 106 24.2% 47.3% 28.5% 260
TOTAL 25.5% 27.7% 46.9% 88,446 40.2% 42.4% 17.4% 168,938
Males 29.1% 28.7% 42.2% 44,317 41.2% 41.7% 17.2% 82,894Females 21.8% 26.6% 51.6% 44,129 39.3% 43.1% 17.6% 86,044
Table 4.15English and Math Regents Performance byRace/Ethnicity and Gender, 2009-2010
English Performance Level Math Performance Level
NOTE: Groups do not sum to the total because of missing ethnic/racial information in some cases.
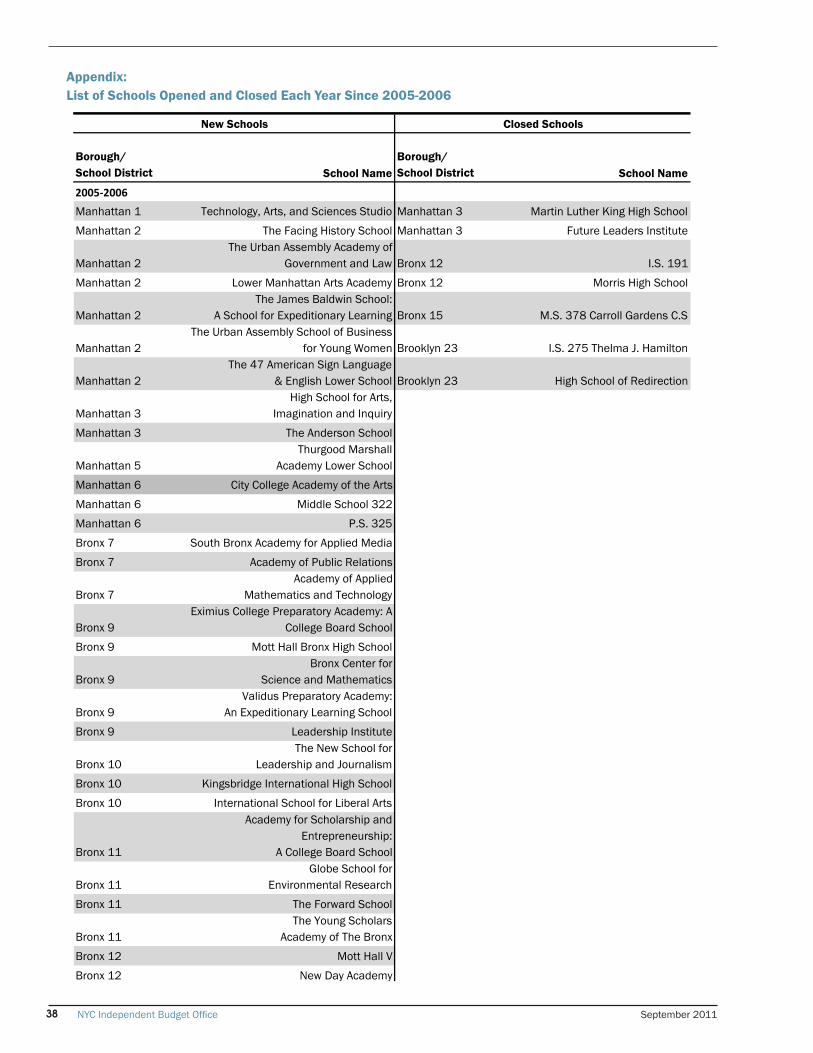
NYC Independent Budget Office September 201138
Borough/School District School Name
Borough/School District School Name
2005‐2006
Manhattan 1 Technology, Arts, and Sciences Studio Manhattan 3 Martin Luther King High School
Manhattan 2 The Facing History School Manhattan 3 Future Leaders Institute
Manhattan 2The Urban Assembly Academy of
Government and Law Bronx 12 I.S. 191
Manhattan 2 Lower Manhattan Arts Academy Bronx 12 Morris High School
Manhattan 2The James Baldwin School:
A School for Expeditionary Learning Bronx 15 M.S. 378 Carroll Gardens C.S
Manhattan 2The Urban Assembly School of Business
for Young Women Brooklyn 23 I.S. 275 Thelma J. Hamilton
Manhattan 2The 47 American Sign Language
& English Lower School Brooklyn 23 High School of Redirection
Manhattan 3High School for Arts,
Imagination and Inquiry
Manhattan 3 The Anderson School
Manhattan 5Thurgood Marshall
Academy Lower School
Manhattan 6 City College Academy of the Arts
Manhattan 6 Middle School 322
Manhattan 6 P.S. 325
Bronx 7 South Bronx Academy for Applied Media
Bronx 7 Academy of Public Relations
Bronx 7Academy of Applied
Mathematics and Technology
Bronx 9Eximius College Preparatory Academy: A
College Board School
Bronx 9 Mott Hall Bronx High School
Bronx 9Bronx Center for
Science and Mathematics
Bronx 9Validus Preparatory Academy:
An Expeditionary Learning School
Bronx 9 Leadership Institute
Bronx 10The New School for
Leadership and Journalism
Bronx 10 Kingsbridge International High School
Bronx 10 International School for Liberal Arts
Bronx 11
Academy for Scholarship and Entrepreneurship:
A College Board School
Bronx 11Globe School for
Environmental Research
Bronx 11 The Forward School
Bronx 11The Young Scholars
Academy of The Bronx
Bronx 12 Mott Hall V
Bronx 12 New Day Academy
Appendix:List of Schools Opened and Closed Each Year
New Schools Closed Schools
Appendix: List of Schools Opened and Closed Each Year Since 2005-2006
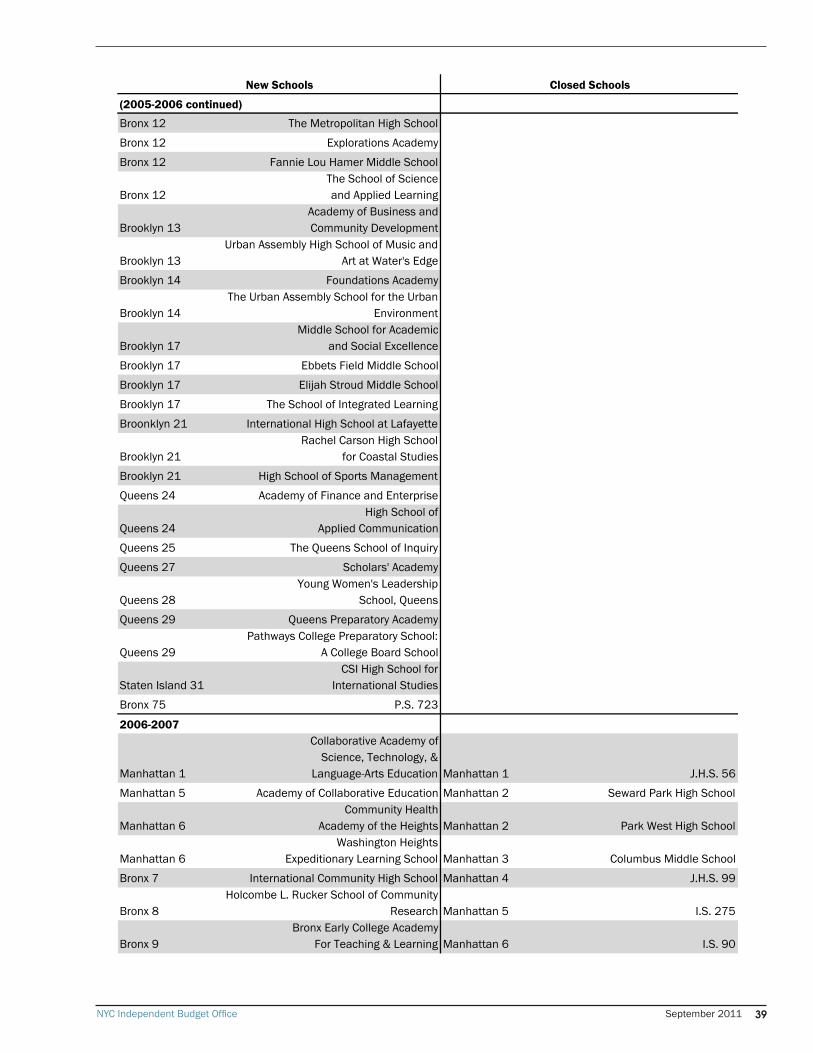
NYC Independent Budget Office September 2011 39
(2005-2006 continued)
Bronx 12 The Metropolitan High School
Bronx 12 Explorations Academy
Bronx 12 Fannie Lou Hamer Middle School
Bronx 12The School of Scienceand Applied Learning
Brooklyn 13Academy of Business and Community Development
Brooklyn 13Urban Assembly High School of Music and
Art at Water's Edge
Brooklyn 14 Foundations Academy
Brooklyn 14The Urban Assembly School for the Urban
Environment
Brooklyn 17Middle School for Academic
and Social Excellence
Brooklyn 17 Ebbets Field Middle School
Brooklyn 17 Elijah Stroud Middle School
Brooklyn 17 The School of Integrated Learning
Broonklyn 21 International High School at Lafayette
Brooklyn 21Rachel Carson High School
for Coastal Studies
Brooklyn 21 High School of Sports Management
Queens 24 Academy of Finance and Enterprise
Queens 24High School of
Applied Communication
Queens 25 The Queens School of Inquiry
Queens 27 Scholars' Academy
Queens 28Young Women's Leadership
School, Queens
Queens 29 Queens Preparatory Academy
Queens 29Pathways College Preparatory School:
A College Board School
Staten Island 31CSI High School for
International Studies
Bronx 75 P.S. 723
2006-2007
Manhattan 1
Collaborative Academy of Science, Technology, &
Language-Arts Education Manhattan 1 J.H.S. 56
Manhattan 5 Academy of Collaborative Education Manhattan 2 Seward Park High School
Manhattan 6Community Health
Academy of the Heights Manhattan 2 Park West High School
Manhattan 6Washington Heights
Expeditionary Learning School Manhattan 3 Columbus Middle School
Bronx 7 International Community High School Manhattan 4 J.H.S. 99
Bronx 8Holcombe L. Rucker School of Community
Research Manhattan 5 I.S. 275
Bronx 9Bronx Early College Academy
For Teaching & Learning Manhattan 6 I.S. 90
New Schools Closed Schools
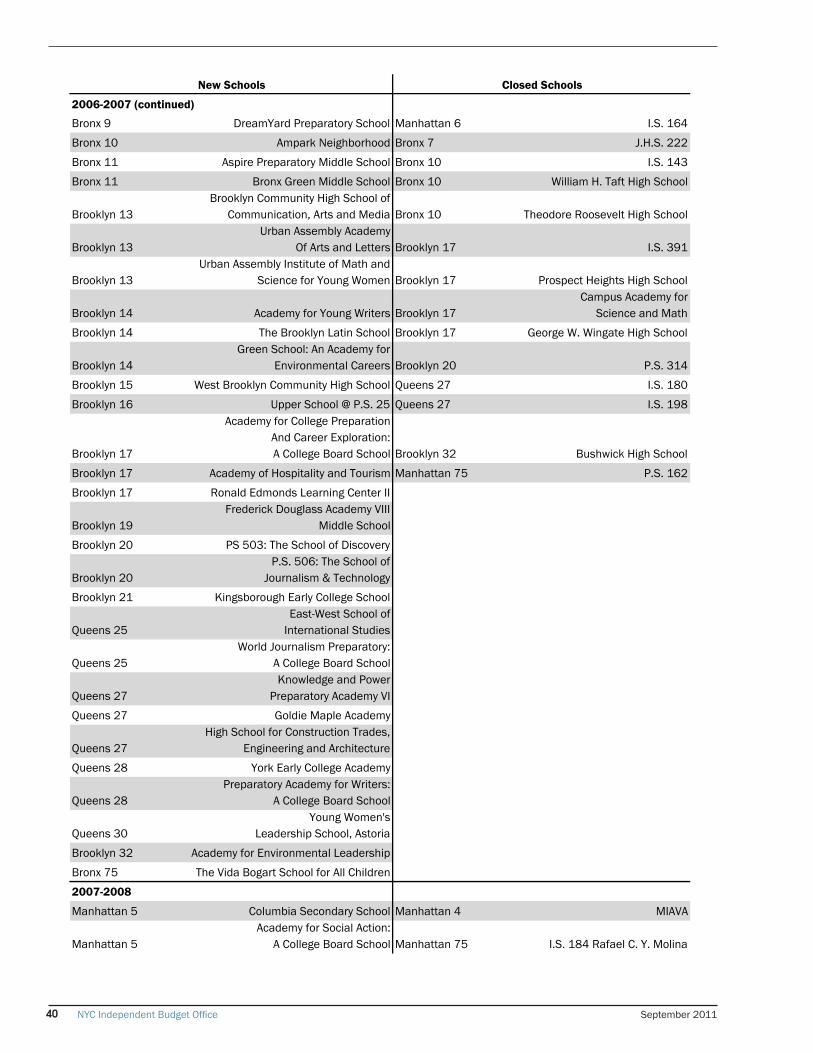
NYC Independent Budget Office September 201140
2006-2007 (continued)
Bronx 9 DreamYard Preparatory School Manhattan 6 I.S. 164
Bronx 10 Ampark Neighborhood Bronx 7 J.H.S. 222
Bronx 11 Aspire Preparatory Middle School Bronx 10 I.S. 143
Bronx 11 Bronx Green Middle School Bronx 10 William H. Taft High School
Brooklyn 13Brooklyn Community High School of
Communication, Arts and Media Bronx 10 Theodore Roosevelt High School
Brooklyn 13Urban Assembly Academy
Of Arts and Letters Brooklyn 17 I.S. 391
Brooklyn 13Urban Assembly Institute of Math and
Science for Young Women Brooklyn 17 Prospect Heights High School
Brooklyn 14 Academy for Young Writers Brooklyn 17Campus Academy for
Science and Math
Brooklyn 14 The Brooklyn Latin School Brooklyn 17 George W. Wingate High School
Brooklyn 14Green School: An Academy for
Environmental Careers Brooklyn 20 P.S. 314
Brooklyn 15 West Brooklyn Community High School Queens 27 I.S. 180
Brooklyn 16 Upper School @ P.S. 25 Queens 27 I.S. 198
Brooklyn 17
Academy for College PreparationAnd Career Exploration:A College Board School Brooklyn 32 Bushwick High School
Brooklyn 17 Academy of Hospitality and Tourism Manhattan 75 P.S. 162
Brooklyn 17 Ronald Edmonds Learning Center II
Brooklyn 19Frederick Douglass Academy VIII
Middle School
Brooklyn 20 PS 503: The School of Discovery
Brooklyn 20P.S. 506: The School of
Journalism & Technology
Brooklyn 21 Kingsborough Early College School
Queens 25East-West School of
International Studies
Queens 25World Journalism Preparatory:
A College Board School
Queens 27Knowledge and Power
Preparatory Academy VI
Queens 27 Goldie Maple Academy
Queens 27High School for Construction Trades,
Engineering and Architecture
Queens 28 York Early College Academy
Queens 28Preparatory Academy for Writers:
A College Board School
Queens 30Young Women's
Leadership School, Astoria
Brooklyn 32 Academy for Environmental Leadership
Bronx 75 The Vida Bogart School for All Children
2007-2008
Manhattan 5 Columbia Secondary School Manhattan 4 MIAVA
Manhattan 5Academy for Social Action:
A College Board School Manhattan 75 I.S. 184 Rafael C. Y. Molina
New Schools Closed Schools
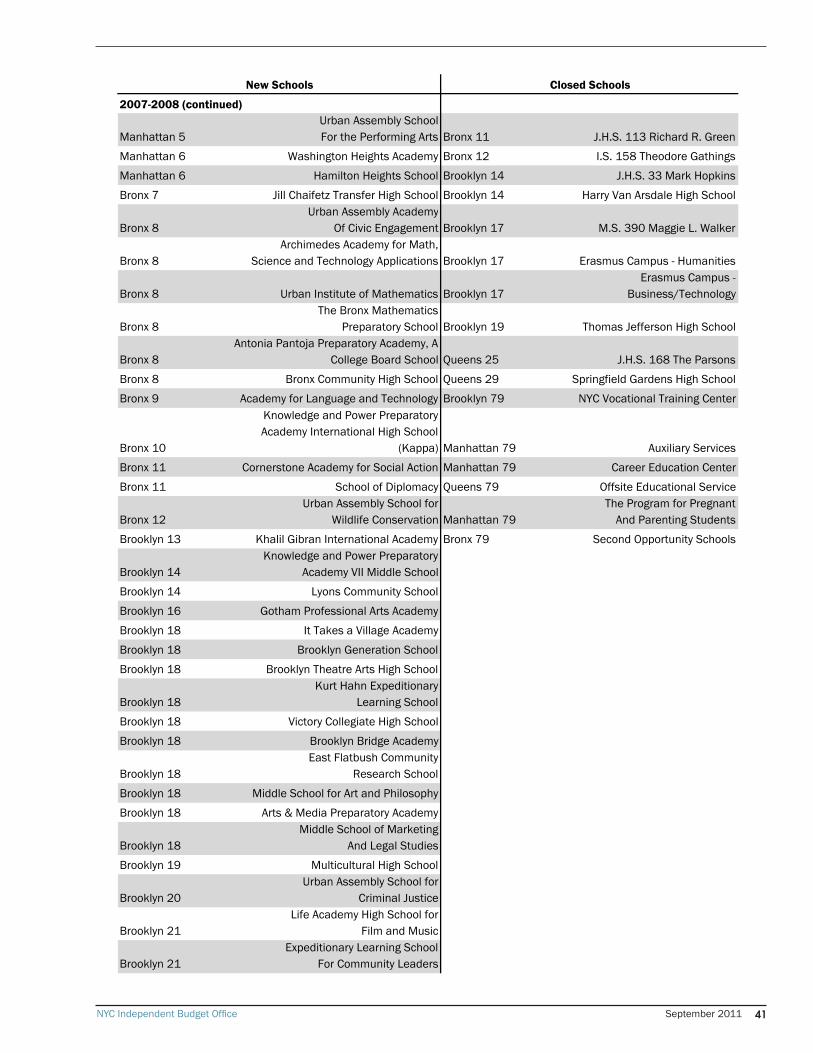
NYC Independent Budget Office September 2011 41
2007-2008 (continued)
Manhattan 5Urban Assembly SchoolFor the Performing Arts Bronx 11 J.H.S. 113 Richard R. Green
Manhattan 6 Washington Heights Academy Bronx 12 I.S. 158 Theodore Gathings
Manhattan 6 Hamilton Heights School Brooklyn 14 J.H.S. 33 Mark Hopkins
Bronx 7 Jill Chaifetz Transfer High School Brooklyn 14 Harry Van Arsdale High School
Bronx 8Urban Assembly Academy
Of Civic Engagement Brooklyn 17 M.S. 390 Maggie L. Walker
Bronx 8Archimedes Academy for Math,
Science and Technology Applications Brooklyn 17 Erasmus Campus - Humanities
Bronx 8 Urban Institute of Mathematics Brooklyn 17Erasmus Campus -
Business/Technology
Bronx 8The Bronx Mathematics
Preparatory School Brooklyn 19 Thomas Jefferson High School
Bronx 8Antonia Pantoja Preparatory Academy, A
College Board School Queens 25 J.H.S. 168 The Parsons
Bronx 8 Bronx Community High School Queens 29 Springfield Gardens High School
Bronx 9 Academy for Language and Technology Brooklyn 79 NYC Vocational Training Center
Bronx 10
Knowledge and Power Preparatory Academy International High School
(Kappa) Manhattan 79 Auxiliary Services
Bronx 11 Cornerstone Academy for Social Action Manhattan 79 Career Education Center
Bronx 11 School of Diplomacy Queens 79 Offsite Educational Service
Bronx 12Urban Assembly School for
Wildlife Conservation Manhattan 79The Program for Pregnant
And Parenting Students
Brooklyn 13 Khalil Gibran International Academy Bronx 79 Second Opportunity Schools
Brooklyn 14Knowledge and Power Preparatory
Academy VII Middle School
Brooklyn 14 Lyons Community School
Brooklyn 16 Gotham Professional Arts Academy
Brooklyn 18 It Takes a Village Academy
Brooklyn 18 Brooklyn Generation School
Brooklyn 18 Brooklyn Theatre Arts High School
Brooklyn 18Kurt Hahn Expeditionary
Learning School
Brooklyn 18 Victory Collegiate High School
Brooklyn 18 Brooklyn Bridge Academy
Brooklyn 18East Flatbush Community
Research School
Brooklyn 18 Middle School for Art and Philosophy
Brooklyn 18 Arts & Media Preparatory Academy
Brooklyn 18Middle School of Marketing
And Legal Studies
Brooklyn 19 Multicultural High School
Brooklyn 20Urban Assembly School for
Criminal Justice
Brooklyn 21Life Academy High School for
Film and Music
Brooklyn 21Expeditionary Learning School
For Community Leaders
New Schools Closed Schools
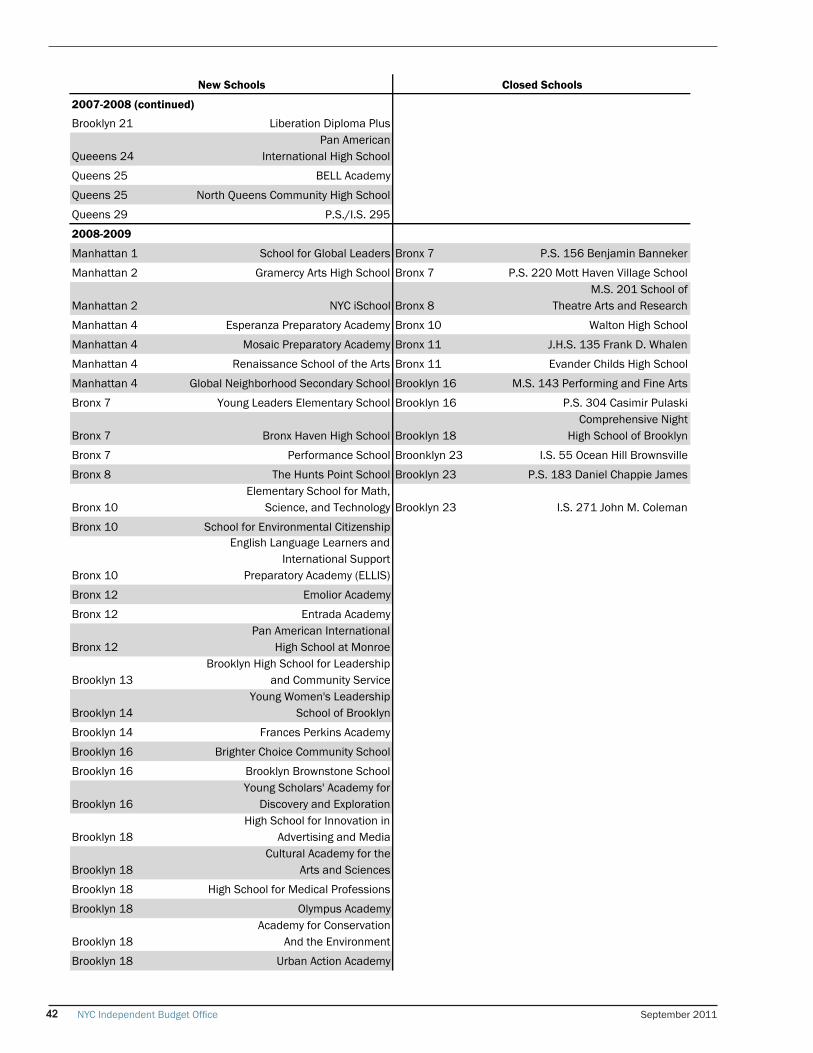
NYC Independent Budget Office September 201142
2007-2008 (continued)
Brooklyn 21 Liberation Diploma Plus
Queeens 24Pan American
International High School
Queens 25 BELL Academy
Queens 25 North Queens Community High School
Queens 29 P.S./I.S. 295
2008-2009
Manhattan 1 School for Global Leaders Bronx 7 P.S. 156 Benjamin Banneker
Manhattan 2 Gramercy Arts High School Bronx 7 P.S. 220 Mott Haven Village School
Manhattan 2 NYC iSchool Bronx 8M.S. 201 School of
Theatre Arts and Research
Manhattan 4 Esperanza Preparatory Academy Bronx 10 Walton High School
Manhattan 4 Mosaic Preparatory Academy Bronx 11 J.H.S. 135 Frank D. Whalen
Manhattan 4 Renaissance School of the Arts Bronx 11 Evander Childs High School
Manhattan 4 Global Neighborhood Secondary School Brooklyn 16 M.S. 143 Performing and Fine Arts
Bronx 7 Young Leaders Elementary School Brooklyn 16 P.S. 304 Casimir Pulaski
Bronx 7 Bronx Haven High School Brooklyn 18Comprehensive Night
High School of Brooklyn
Bronx 7 Performance School Broonklyn 23 I.S. 55 Ocean Hill Brownsville
Bronx 8 The Hunts Point School Brooklyn 23 P.S. 183 Daniel Chappie James
Bronx 10Elementary School for Math,
Science, and Technology Brooklyn 23 I.S. 271 John M. Coleman
Bronx 10 School for Environmental Citizenship
Bronx 10
English Language Learners andInternational Support
Preparatory Academy (ELLIS)
Bronx 12 Emolior Academy
Bronx 12 Entrada Academy
Bronx 12Pan American International
High School at Monroe
Brooklyn 13Brooklyn High School for Leadership
and Community Service
Brooklyn 14Young Women's Leadership
School of Brooklyn
Brooklyn 14 Frances Perkins Academy
Brooklyn 16 Brighter Choice Community School
Brooklyn 16 Brooklyn Brownstone School
Brooklyn 16Young Scholars' Academy for
Discovery and Exploration
Brooklyn 18High School for Innovation in
Advertising and Media
Brooklyn 18Cultural Academy for the
Arts and Sciences
Brooklyn 18 High School for Medical Professions
Brooklyn 18 Olympus Academy
Brooklyn 18Academy for Conservation
And the Environment
Brooklyn 18 Urban Action Academy
New Schools Closed Schools
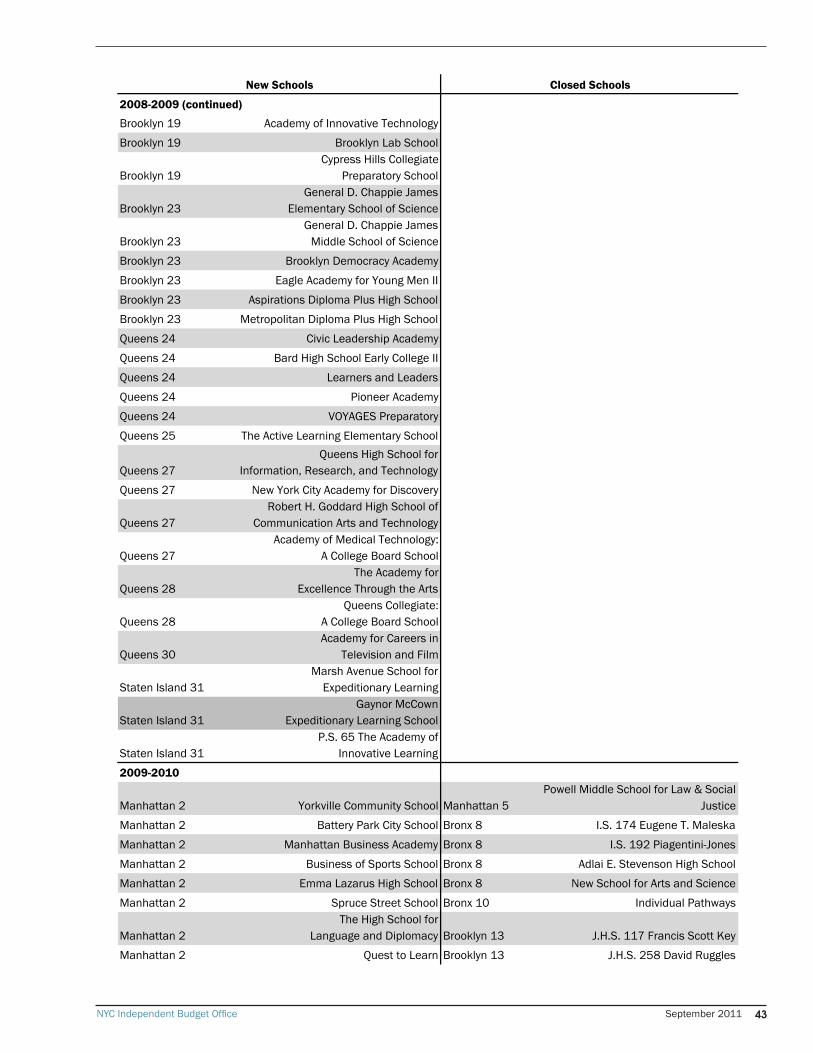
NYC Independent Budget Office September 2011 43
2008-2009 (continued)
Brooklyn 19 Academy of Innovative Technology
Brooklyn 19 Brooklyn Lab School
Brooklyn 19Cypress Hills Collegiate
Preparatory School
Brooklyn 23General D. Chappie James
Elementary School of Science
Brooklyn 23General D. Chappie James
Middle School of Science
Brooklyn 23 Brooklyn Democracy Academy
Brooklyn 23 Eagle Academy for Young Men II
Brooklyn 23 Aspirations Diploma Plus High School
Brooklyn 23 Metropolitan Diploma Plus High School
Queens 24 Civic Leadership Academy
Queens 24 Bard High School Early College II
Queens 24 Learners and Leaders
Queens 24 Pioneer Academy
Queens 24 VOYAGES Preparatory
Queens 25 The Active Learning Elementary School
Queens 27Queens High School for
Information, Research, and Technology
Queens 27 New York City Academy for Discovery
Queens 27Robert H. Goddard High School of
Communication Arts and Technology
Queens 27Academy of Medical Technology:
A College Board School
Queens 28The Academy for
Excellence Through the Arts
Queens 28Queens Collegiate:
A College Board School
Queens 30Academy for Careers in
Television and Film
Staten Island 31Marsh Avenue School for
Expeditionary Learning
Staten Island 31Gaynor McCown
Expeditionary Learning School
Staten Island 31P.S. 65 The Academy of
Innovative Learning
2009-2010
Manhattan 2 Yorkville Community School Manhattan 5Powell Middle School for Law & Social
Justice
Manhattan 2 Battery Park City School Bronx 8 I.S. 174 Eugene T. Maleska
Manhattan 2 Manhattan Business Academy Bronx 8 I.S. 192 Piagentini-Jones
Manhattan 2 Business of Sports School Bronx 8 Adlai E. Stevenson High School
Manhattan 2 Emma Lazarus High School Bronx 8 New School for Arts and Science
Manhattan 2 Spruce Street School Bronx 10 Individual Pathways
Manhattan 2The High School for
Language and Diplomacy Brooklyn 13 J.H.S. 117 Francis Scott Key
Manhattan 2 Quest to Learn Brooklyn 13 J.H.S. 258 David Ruggles
New Schools Closed Schools
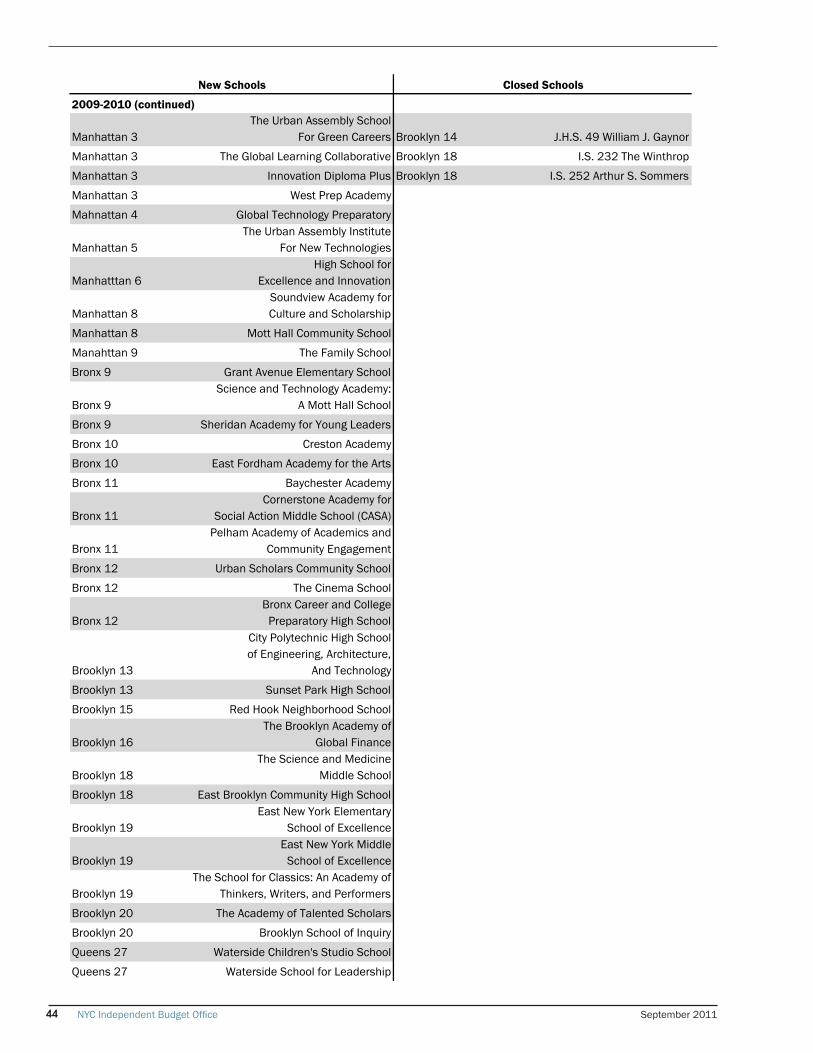
NYC Independent Budget Office September 201144
2009-2010 (continued)
Manhattan 3The Urban Assembly School
For Green Careers Brooklyn 14 J.H.S. 49 William J. Gaynor
Manhattan 3 The Global Learning Collaborative Brooklyn 18 I.S. 232 The Winthrop
Manhattan 3 Innovation Diploma Plus Brooklyn 18 I.S. 252 Arthur S. Sommers
Manhattan 3 West Prep Academy
Mahnattan 4 Global Technology Preparatory
Manhattan 5The Urban Assembly Institute
For New Technologies
Manhatttan 6High School for
Excellence and Innovation
Manhattan 8Soundview Academy forCulture and Scholarship
Manhattan 8 Mott Hall Community School
Manahttan 9 The Family School
Bronx 9 Grant Avenue Elementary School
Bronx 9Science and Technology Academy:
A Mott Hall School
Bronx 9 Sheridan Academy for Young Leaders
Bronx 10 Creston Academy
Bronx 10 East Fordham Academy for the Arts
Bronx 11 Baychester Academy
Bronx 11Cornerstone Academy for
Social Action Middle School (CASA)
Bronx 11Pelham Academy of Academics and
Community Engagement
Bronx 12 Urban Scholars Community School
Bronx 12 The Cinema School
Bronx 12Bronx Career and College
Preparatory High School
Brooklyn 13
City Polytechnic High Schoolof Engineering, Architecture,
And Technology
Brooklyn 13 Sunset Park High School
Brooklyn 15 Red Hook Neighborhood School
Brooklyn 16The Brooklyn Academy of
Global Finance
Brooklyn 18The Science and Medicine
Middle School
Brooklyn 18 East Brooklyn Community High School
Brooklyn 19East New York Elementary
School of Excellence
Brooklyn 19East New York Middle
School of Excellence
Brooklyn 19The School for Classics: An Academy of
Thinkers, Writers, and Performers
Brooklyn 20 The Academy of Talented Scholars
Brooklyn 20 Brooklyn School of Inquiry
Queens 27 Waterside Children's Studio School
Queens 27 Waterside School for Leadership
New Schools Closed Schools
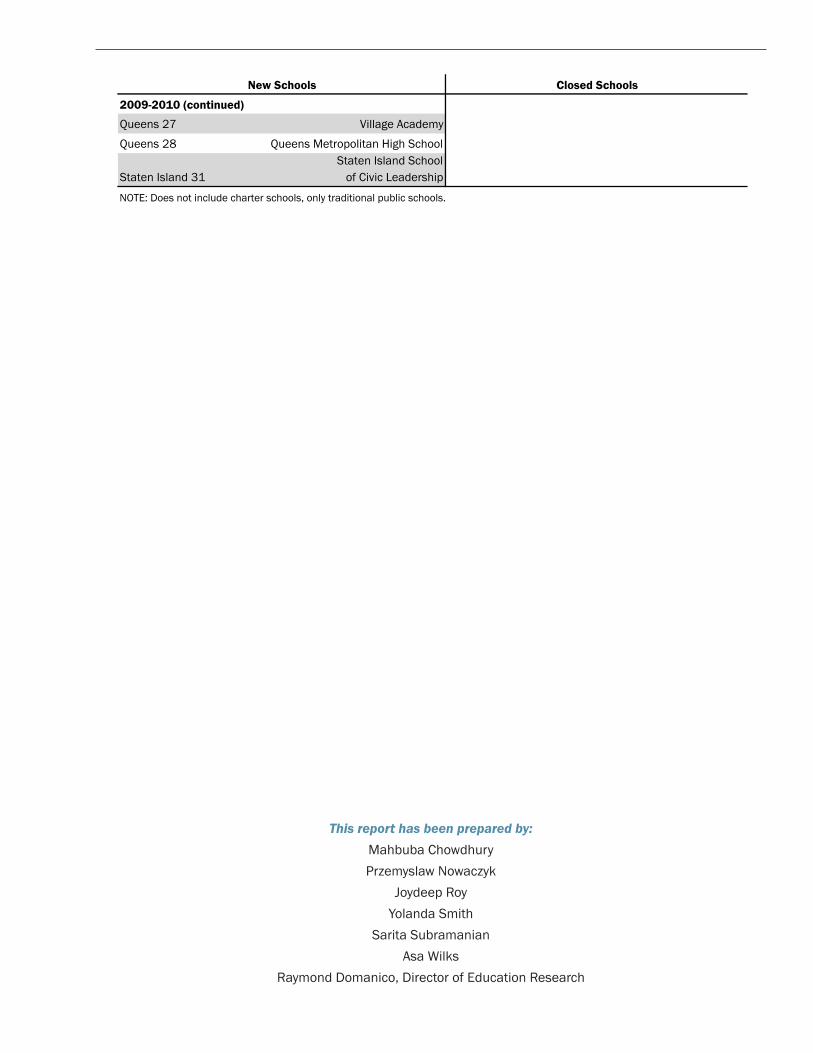
This report has been prepared by:Mahbuba ChowdhuryPrzemyslaw Nowaczyk
Joydeep RoyYolanda Smith
Sarita SubramanianAsa Wilks
Raymond Domanico, Director of Education Research
2009-2010 (continued)
Queens 27 Village Academy
Queens 28 Queens Metropolitan High School
Staten Island 31Staten Island School
of Civic Leadership
NOTE: Does not include charter schools, only traditional public schools.
New Schools Closed Schools

IBONew York City
Independent Budget Office
Ronnie Lowenstein, Director110 William St., 14th Floor • New York, NY 10038Tel. (212) 442-0632 • Fax (212) [email protected] • www.ibo.nyc.ny.usTwitter RSS