Embed Size (px)
Citation preview
1
Advisors:
Professor Isa Bar-On
Professor Susan Vernon-Gerstenfeld
Increasing Recycling
Participation at
Parque de Diversiones
Brenna Colleary
Shawn Wilhelm December 11, 2008
i
December 11, 2008
Cinthia Navarro
Jefe Salud Ocupacional y Seguridad Humana
Parque de Diversiones
La Uruca, San Jose, Costa Rica
Dear Ms. Navarro:
Enclosed is our report entitled Increasing Recycling Participation at Parque de Diversiones.
Preliminary work was completed in Worcester, Massachusetts prior to our arrival in Costa Rica.
Interviews were conducted, data was collected, and recommendations were written at Parque de
Diversiones during the period of October 20 through December 11, 2008. Copies of this report are
simultaneously being submitted to Professor Susan Vernon-Gerstenfeld and Professor Isa Bar-On
for evaluation. Upon faculty review, the original copy of this report will be catalogued in the
Gordon Library at Worcester Polytechnic Institute. We greatly appreciate the time and dedication
that you have devoted to us.
Sincerely,
Brenna Colleary
Shawn Wilhelm
ii
TITLE PAGE
Report Submitted to:
Professor Susan Vernon-Gernstenfeld
Professor Isa Bar-On
Costa Rica, Project Center
By
(signatures)
Brenna Colleary _________________________ __________________________ Shawn Wilhelm _________________________ __________________________
In Cooperation With
Cinthia Navarro, Jefe Salud Ocupacional y Seguridad Humana ____________________________________________________________________
Parque de Diversiones
____________________________________________________________________
INCREASING RECYCLING PARICIPATION AT PARQUE DE DIVERSIONES
December 11, 2008
This project report is submitted in partial fulfillment of the degree requirements of Worcester Polytechnic Institute. The views and opinions expressed herein are those of the authors and do not necessarily reflect the positions or opinions of (Agency Name) or Worcester Polytechnic Institute. This report is the product of an education program, and is intended to serve as partial documentation for the evaluation of academic achievement. The report should not be construed as a working document by the reader.
iii
EXECUTIVE SUMMARY
Costa Rica is a country of natural beauty and wonder with tropical beaches, active
volcanoes, and exuberant national rainforests. These sites have attracted a $1.9 billion tourism
market, which contributes more to the gross national product than all agriculture. Desire to protect
this environment is demonstrated by recent initiatives, such as Oscar Arias’ pledge to make the
country carbon neutral by 2021, and the General Law on Waste. This transfers the responsibility
for waste management from the state to the generator, producer, and consumer. In light of these
initiatives, Parque de Diversiones is working to become more environmentally conscious. It has
attempted to create a recycling program in the past, but it has had insignificant participation. Our
goal, therefore, was to increase participation in the recycling program at Parque de Diversiones. To
accomplish this goal, we completed the following objectives:
To develop methods to increase participation
To determine if these method actually would create an increase in participation.
Recycling is a relatively new issue in Costa Rica and has created problems due to a lack of
general knowledge on the subject. In order to develop methods to increase participation, we
focused on five main issues recycling programs have:
1. Support from management to enforce initiatives and provide monetary assistance.
2. Education of the patrons and employees to provoke the understanding of the procedures
and the importance of recycling.
3. Encouragement for participants and employees to recycle through prompts and reminders.
4. Ease and accessibility to provide effortless opportunities to recycle.
5. Progress of performance to supply the patrons and employees with goals and enticement to
continue recycling.
iv
Focusing on these issues, we analyzed different areas of the Parque and its current
recycling program to determine areas of improvement. The first step we took was observing the
patrons during lunch hours on how they dispose of their waste and the Parque’s current program.
To complete this task, we interviewed the heads of the waste management, purchasing,
psychology, design, and the restaurant departments. These interviews informed us of the processes
used, capabilities of the Parque, problems incurred, and the cultural issues related to recycling. We
also received suggestions from these individuals.
We found that, while the management was interested in recycling initiatives, there was a
lack of monetary support to run a well designed project. Workers and patrons were unaware of
how to properly recycle. The Parque’s system was too basic to be effective. In the park itself, the
program was almost inaccessible with simple stickers on bins in only one area, thus providing only
a small opportunity for participation by patrons. In the offices and some restaurants, there was a
recycling program to collect cardboard, paper, bottles, cans, and glass, but the system was
unorganized making recycling difficult. We also did not find any form of progress presentation in
any areas of the Parque.
Before we made recommendations, we tested a small scale recycling program to address
encouragement, education, and ease and accessibility. To do this, we used signage explaining how
and why to recycle. These signs were informative, encouraging, and were placed next to bins
labeled for recyclables and non-recyclables. We compared the amount of materials that were
placed in the proper bin when signs were present to when they were not present. In this
experiment, when signs were used, people recycled 35 percent more and properly disposed of
their waste 30 percent more. During observations, we witnessed patrons viewing signs, reading the
labels of the bins, and then placing their waste in the proper receptacle.
v
Although we were unable to test all of the recycling issues, we have found information
regarding each issue from interviews and literature that will allow us to address it accordingly.
Based on our research and results, we make the following recommendations for Parque de
Diversiones to increase participation.
There should be support from the management for monetary assistance and an enforcement of
the recycling initiatives.
Employees and patrons should be educated about how, why, and what to recycle. This can be
done through an education program and signage.
For the visitors of the Parque, signs and announcements should be made to encourage them to
recycle.
There should be many opportunities to recycle, with abundant bins available in the Parque.
They should have similar themes, so that they can easily be associated with their purpose.
Patrons and employees should be informed of the progress the Parque has made. This can be
done with inter-office competitions. The Parque can also set a goal and use a progress bar to
present the Parque's performance.
Further Research should be done for organic waste management since organic waste comprises
the majority of the Parque’s recyclable waste. Specifically, research should be conducted for a
biodigester and worm farms.
These recommendations will encourage the Parque to have a recycling program with
increased participation. This will allow them to comply with the legislative initiatives and help the
environment by reducing their waste, while generating additional income to be donated to the
National Children’s Hospital.
vi
ABSTRACT
New recycling initiatives in Costa Rica are demanding Parque de Diversiones to increase
participation in its recycling program. This involves properly disposing of cans, bottles, and
glass throughout the Parque, as well as paper and cardboard in the offices. In order to achieve
this goal, effective methods of increasing participation must be determined to overcome the
obstacles of education and implementation. Information to achieve these goals was obtained
through interviews of Parque employees and research of aspiring recycling programs.
Recommendations to organize recycling practices are made to establish a program that prolongs
increased participation.
vii
AUTHORSHIP PAGE
The research and writing of our report was equally completed by Brenna Colleary and
Shawn Wilhelm. Together, we composed, edited, and finalized the introduction, background,
methodology, data and analysis, and conclusions and recommendations.
viii
ACKNOWLEDGEMENTS
We would like to thank the individuals that made this project successful. Professor Susan
Vernon-Gernstenfeld and Professor Isa Bar-On were excellent advisors, providing prompt
feedback. To our liaison, Cinthia Navarro, we are grateful for the opportunity to work with the
Parque. Arnold Murillo, Ismael Ramos, and Emilia Murillo were extremely helpful providing
the necessary information to conduct our experiments. We would also like to thank our
interviewees: Ileana Avendaño, Jesus Prado, Luis Solano, and Don Rodolfo Lee.
ix
TABLE OF CONTENTS
EXECUTIVE SUMMARY………………………………………………………………………iii
ABSTRACT…..………………………………………………………………………….………vi
AUTHORSHIP PAGE………….…………………………………………………………..…...vii
ACKNOWLEDGEMENTS…………………………..……………...……………………….....viii
TABLES………….……...…………………………..………………………………………......xii
FIGURES…………………..………………………..……………………………………….…xiii
CHAPTER ONE: INTRODUCTION……...……………………………………………………...1
CHAPTER TWO: BACKGROUND……………………………………………………………...3
RECYCLING FOR A SUSTAINABLE WORLD .……………………………..………..3
RECYCLING IN COSTA RICA …………………………………………………………4
RECYCLING IN PARQUE DE DIVERSIONES……..………………………….………4
Support from Management……………….…………...…………………………..6
Education of Patrons and Employees...………………..………………………….7
Encouragement of Recycling.……….…………..……….………………………..8
Ease and Accessibility of Recycling…………………..…………………………..9
Progress of Performance…….…………….…………..…………………………10
CHAPTER THREE: METHODOLOGY…….………...…………………………………..……11
DEFINING THE NEEDS OF PARQUE DE DIVERSIONES………………………….11
x
DEVELOPING THE METHODS TO INCREASE PARTICIPATION.....……….…….11
DETERMINING METHODS OF INCREASE PARTICIPATION.…......…..……...…..12
CHAPTER FOUR: DATA AND ANALYSIS………………….…...………………..…………16
EXPERIMENTAL FINDINGS…...……....………………………………………..……16
FURTHER FINDINGS AND DISCUSSION…………………………………………...19
Support from Management……………….………….....………………………..19
Employees………………………..……….………….....………………………..20
Bins……………….………….....………………………………………………..21
Removal……………….………….....……………………………………….…..22
Organic Waste……………….………….....……………………………………..24
Education of Patrons and Employees...…..…………..………………………….27
Encouragement of Recycling.……….………….…….………………………….28
Progress of Performance……………….……...……..…………………………..29
CHAPTER FIVE: CONCLUSIONS AND RECOMMENDATIONS...….…………..…………31
FUNDING……...……………...…………..………………………..……………………31
Bins………………………………………………………………………………31
Restaurants……………………………………………………………………….32
REMOVAL………………………………………………………………………………35
EDUCATION OF PATRONS AND EMPLOYEES...…..…………..…………………..35
xi
ENCOURAGEMENT OF RECYCLING.……….………….……..…………………….35
PROGRESS OF PERFORMANCE…………………...……..…………………………..39
FURTHER RESEARCH……………….….…………..………………………...………39
REFERENCES..…………………………………………............................................................40
APPENDIX A…………………..………………………………………………………..………43
APPENDIX B.…………………………..………………………………………………...……..45
APPENDIX C……..……………………………………………………………………………..48
APPENDIX D…………………..………………………………………………………………..57
APPENDIX E…………………..………………………………………………………………..59
APPENDIX F……………..………………………...…………………………………………...60
APPENDIX G…………………..……………………………………………………………..…64
APPENDIX H…………………..………………………………………………………………..66
APPENDIX I …………………..………………………………………………………………..68
xii
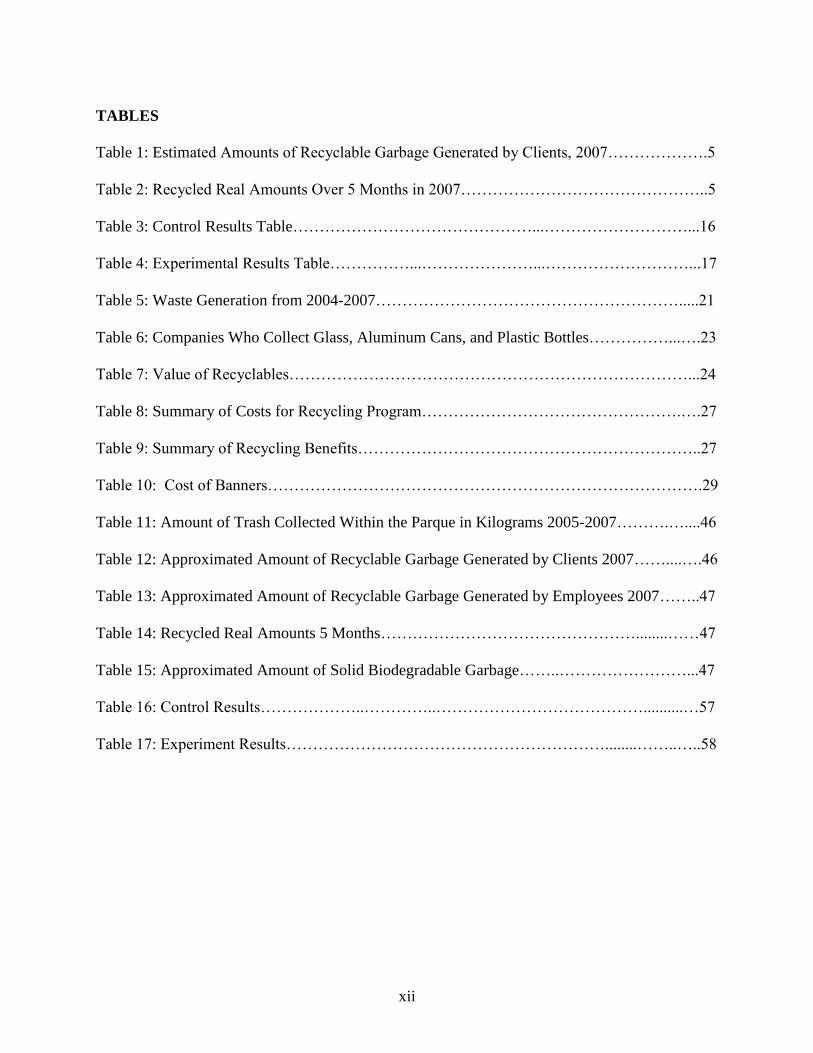
TABLES
Table 1: Estimated Amounts of Recyclable Garbage Generated by Clients, 2007……………….5
Table 2: Recycled Real Amounts Over 5 Months in 2007………………………………………..5
Table 3: Control Results Table………………………………………...………………………...16
Table 4: Experimental Results Table……………...…………………...………………………...17
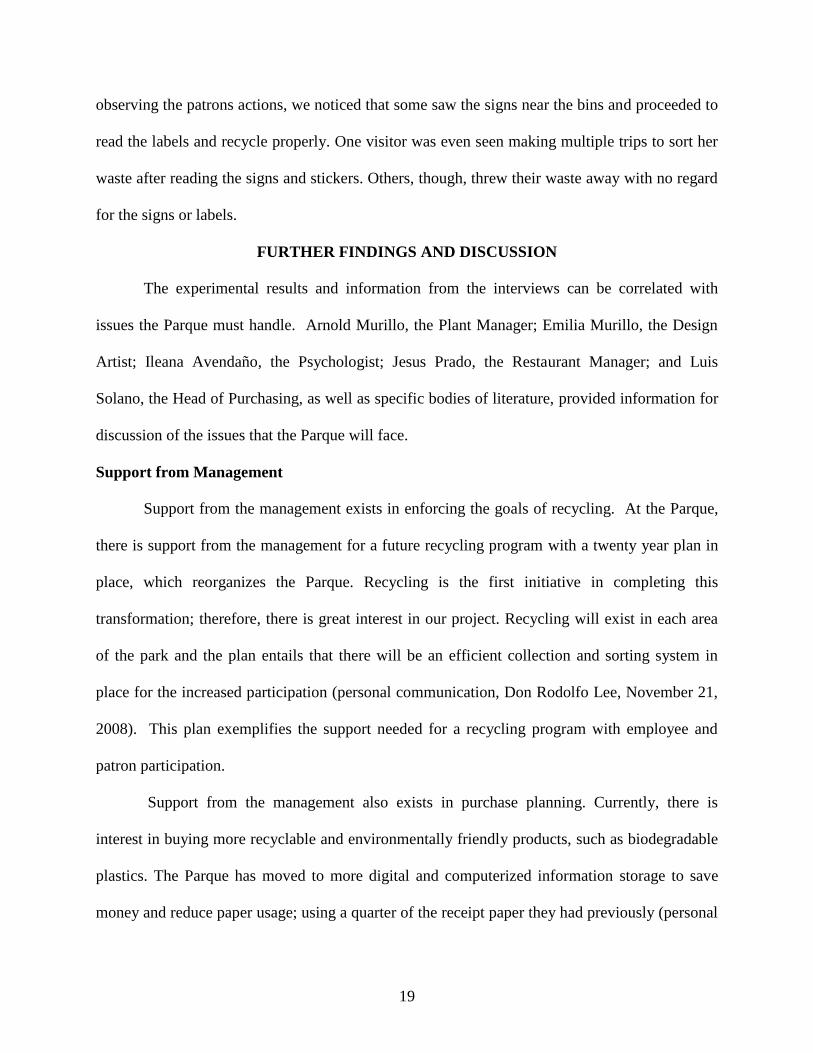
Table 5: Waste Generation from 2004-2007………………………………………………….....21
Table 6: Companies Who Collect Glass, Aluminum Cans, and Plastic Bottles……………...….23
Table 7: Value of Recyclables…………………………………………………………………...24
Table 8: Summary of Costs for Recycling Program………………………………………….….27
Table 9: Summary of Recycling Benefits………………………………………………………..27
Table 10: Cost of Banners……………………………………………………………………….29
Table 11: Amount of Trash Collected Within the Parque in Kilograms 2005-2007……….…....46
Table 12: Approximated Amount of Recyclable Garbage Generated by Clients 2007……....….46
Table 13: Approximated Amount of Recyclable Garbage Generated by Employees 2007……..47
Table 14: Recycled Real Amounts 5 Months…………………………………………........……47
Table 15: Approximated Amount of Solid Biodegradable Garbage……..……………………...47
Table 16: Control Results………………..…………..…………………………………..........…57
Table 17: Experiment Results……………………………………………………........……..…..58
xiii
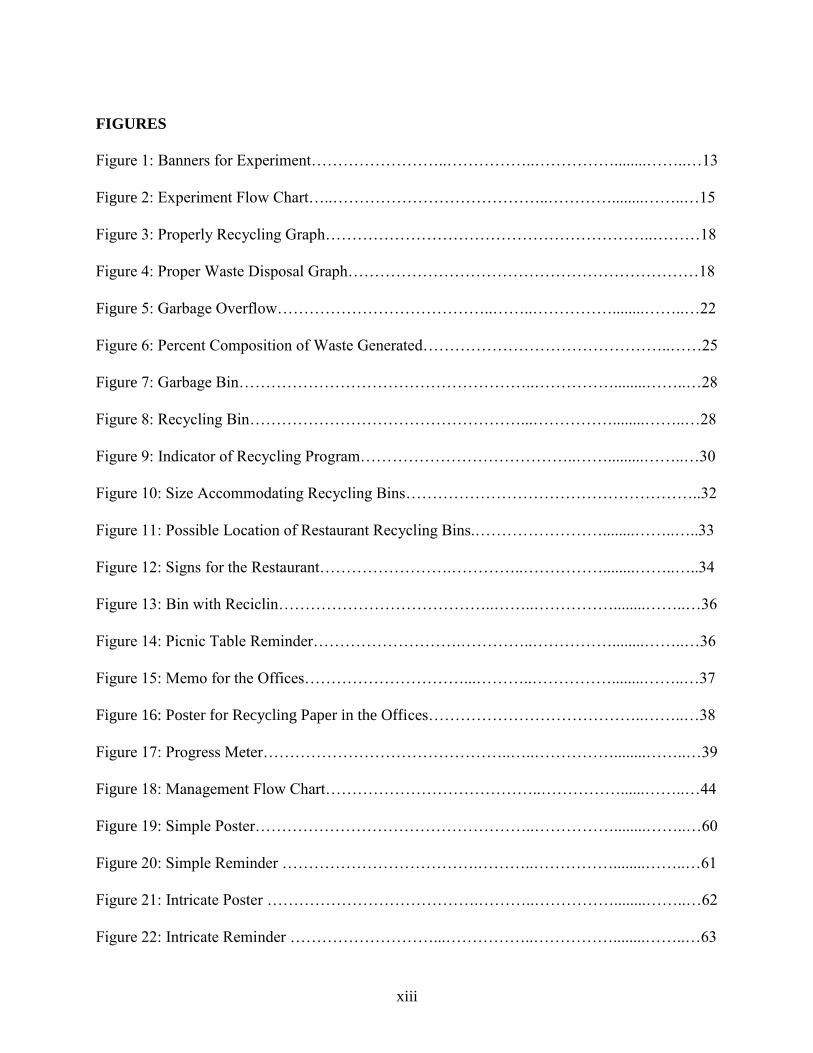
FIGURES
Figure 1: Banners for Experiment……………………..……………..……………........……..…13
Figure 2: Experiment Flow Chart…..…………………………………..…………........……..…15
Figure 3: Properly Recycling Graph……………………………………………………..………18
Figure 4: Proper Waste Disposal Graph…………………………………………………………18
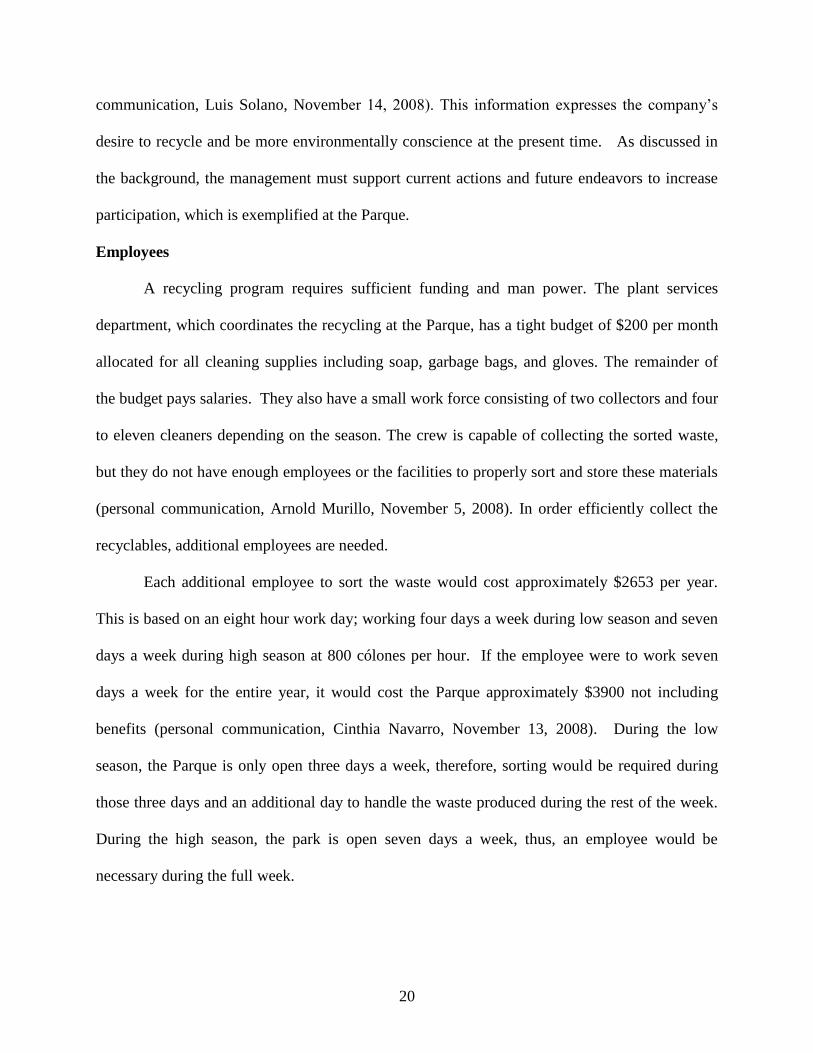
Figure 5: Garbage Overflow…………………………………..……..……………........……..…22
Figure 6: Percent Composition of Waste Generated………………………………………..……25
Figure 7: Garbage Bin………………………………………………..……………........……..…28
Figure 8: Recycling Bin……………………………………………...……………........……..…28
Figure 9: Indicator of Recycling Program…………………………………..…….........……..…30
Figure 10: Size Accommodating Recycling Bins………………………………………………..32
Figure 11: Possible Location of Restaurant Recycling Bins.……………………........……..…..33
Figure 12: Signs for the Restaurant…………………….…………..……………........……..…..34
Figure 13: Bin with Reciclin…………………………………..……..……………........……..…36
Figure 14: Picnic Table Reminder……………………….…………..……………........……..…36
Figure 15: Memo for the Offices…………………………...………..……………........……..…37
Figure 16: Poster for Recycling Paper in the Offices…………………………………..……..…38
Figure 17: Progress Meter………………………………………..…..……………........……..…39
Figure 18: Management Flow Chart…………………………………..……………......……..…44
Figure 19: Simple Poster……………………………………………..……………........……..…60
Figure 20: Simple Reminder ……………………………….………..……………........……..…61
Figure 21: Intricate Poster ………………………………….………..……………........……..…62
Figure 22: Intricate Reminder ………………………...……………..……………........……..…63
xiv
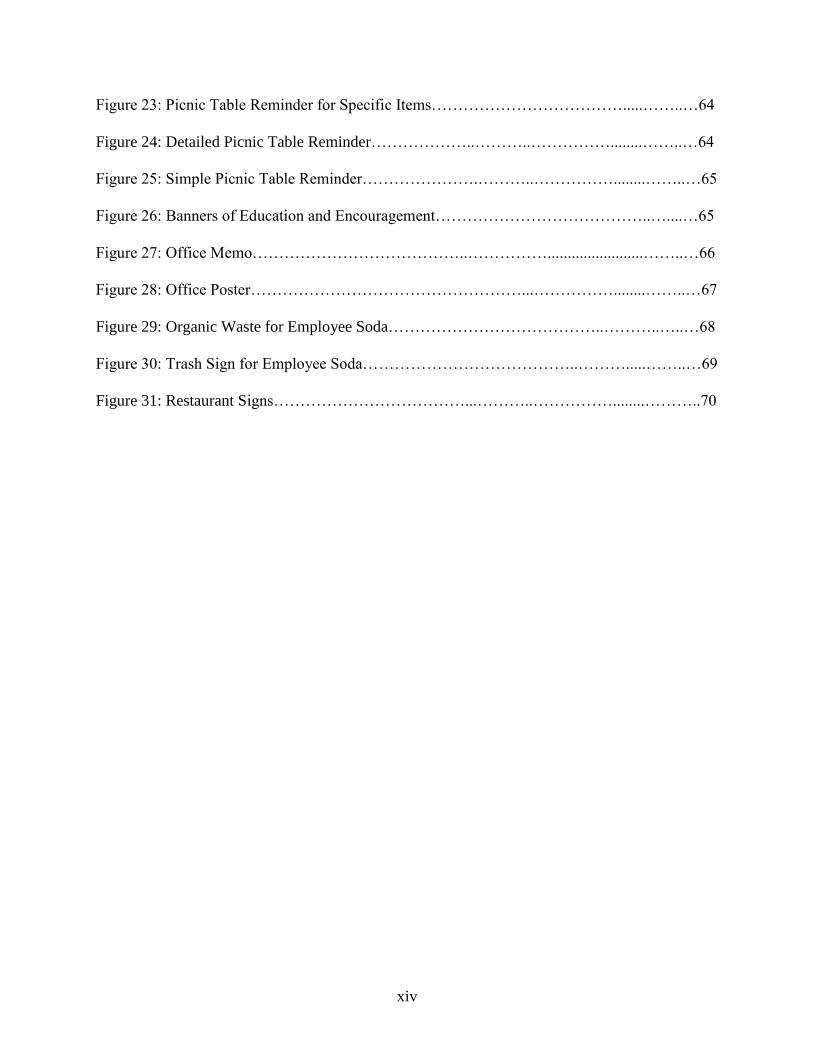
Figure 23: Picnic Table Reminder for Specific Items……………………………….....……..…64
Figure 24: Detailed Picnic Table Reminder………………..………..……………........……..…64
Figure 25: Simple Picnic Table Reminder………………….………..……………........……..…65
Figure 26: Banners of Education and Encouragement…………………………………..…....…65
Figure 27: Office Memo…………………………………..……………........................……..…66
Figure 28: Office Poster……………………………………………...……………........……..…67
Figure 29: Organic Waste for Employee Soda…………………………………..………..…..…68
Figure 30: Trash Sign for Employee Soda…………………………………..……….....……..…69
Figure 31: Restaurant Signs………………………………...………..……………........………..70
1
CHAPTER ONE: INTRODUCTION
In this world of growing populations, modifications in cultural patterns, and concerns for
natural resources, waste management has taken on new importance and applications within
society. This involves the need to develop an understanding of social, economic, and
environmental issues. Recycling incorporates this need by minimizing waste and generating a
concern for the environment (Waste Management, 2008). The environment is the world’s
greatest resource, and developed and developing organizations throughout the world must take
actions to preserve it.
Costa Rica is one of the most environmentally aware countries in Latin America
(Dutschke, 2000). This is demonstrated by the intentions and legislation of the President Oscar
Arias, who has pledged to make the country carbon neutral by 2021. There are also
organizations, such as the Ministry of Energy and Environment and the National System of
Conservation Areas, that are developing legislation that shifts the responsibility of waste
management from the state to the generator, producer, and consumer (MINAE, 2006). These
actions demonstrate the importance and mandate the responsibility of environmental awareness
and concern for commercial and public entities.
In order to respond to the goals of President Arias, organizations throughout Costa Rica
are developing and implementing recycling programs. For example, el Cuerpo de Bomberos and
ICE are organizations that are designing recycling programs (William Hidalgo, personal
communication, November 12, 2008). These programs, as well as Parque de Diversiones, will
face several issues though, according to Eirik O’Neill, President of Corporate Recycling
Services. These issues include support, education, encouragement, ease and accessibility, and
2
progress (Personal communication, September 29, 2008). American corporations and more
developed Costa Rican organizations exemplify how these challenges can be addressed.
Parque de Diversiones is a non-profit organization in Costa Rica whose proceeds benefit
the only children’s hospital in Central America. The Parque intends to improve its recycling
program. In order to do so, and comply with the new Costa Rican initiatives, the Parque will
encounter the previously mentioned issues in implementing a recycling program. Our goal,
therefore, is to increase participation in the recycling program at the Parque by overcoming these
obstacles. In order to increase participation, the Parque must apply the appropriate methods to
promote the benefits and procedures of recycling.
According to a previous report written at the University of Costa Rica, as will be
discussed in the background chapter, there has been a lack of participation by clients in
separating cans, bottles, plastics, and glass from organic waste and trash. There was also not
substantial participation in the cardboard and paper recycling program within the offices
(Zenteno, Mora, 2007). The objectives of this project, therefore, were to develop methods to
increase participation, and to determine if methods resulted in an increase in participation. In
order to design an appropriate recycling program, interviews were conducted with the Parque
employees. Data was collected through experiments of social participation. The interviews and
experiments were a necessary part of data collection because they provided the essential
information for designing a successful recycling program and making appropriate
recommendations.
3
CHAPTER TWO: BACKGROUND
In order to meet the objectives of our project, it is important to understand the
significance of recycling for a sustainable world. These ideas are applicable to Costa Rica and
are driven by Oscar Arias’ intentions for a more environmentally friendly nation. There are
issues that corporations, specifically Parque de Diversiones, will face when implementing a
recycling program in order to comply with new initiatives in Costa Rica. These issues are
presented with a theoretical base and are supported by corporate examples.
RECYCLING FOR A SUSTAINABLE WORLD
More materials are being demanded, produced, and disposed of than ever before, yielding
more waste. To prevent possible negative effects on the environment, the waste must be
managed. Waste management involves generation, characterization, minimization, recycling,
reuse, storage, collection, transport and transfer of waste, treatment, environmental
considerations, finances, marketing, policies and legislation, education, training, planning, and
implementation (International Journal of Integrated Waste Management, 2008). Many of the
products we purchase are developed from processes that cause deforestation. This results in
destruction of habitats and adds to global warming. Recycling can limit the effects of pollution
by decreasing the amount of chemicals and green house gases emitted from landfills (Recycling
Guide, 2008). In just the United States, almost 55 percent of waste goes to landfills
(Environmental Indicators, 2007). Execution of sustainable waste management practices requires
a comprehension of the important legal, social, environmental, and economic issues involved
(International Journal of Integrated Waste Management, 2008).
4
RECYCLING IN COSTA RICA
The environment has become more important to Costa Ricans in recent years requiring
new types of environmental care. The leadership of President Oscar Arias and his dedication to
this cause resulted in the pledge to make the country carbon neutral by 2021. Such an action
implies emitting no excess carbon dioxide into the air (Powell, 2008). Costa Rica’s political
interest in environmental issues is evident in the presence and recent legislation of environmental
organizations, such as MINAE, the Ministry of Energy and Environment, and SINAC, the
National System of Conservation Areas. In 2005, the “General Law on Waste”, written by
MINAE, was passed with encouragement from Oscar Arias. It shifted the responsibility for the
management of waste from the state towards the generator, producer, and consumer (MINAE,
2006). These organizations are currently working to create further legislation to protect the
environment.
According to J. Alfaro (2008), recycling programs are relatively new and are not well
developed. Corporations are taking efforts to become more environmentally friendly and develop
recycling programs in compliance with recent initiatives in Costa Rica, especially the carbon
neutrality demanded by President Arias. These corporations include el Cuerpo de Bomberos and
ICE, who are working to develop recycling programs (William Hidalgo, personal
communication, November 12, 2008). Similarly, Parque de Diversiones intends to modernize its
recycling program.
RECYCLING IN PARQUE DE DIVERSIONES
Parque de Diversiones is responding to the goals of Oscar Arias and the recent recycling
legislation. A previous report done by Zenteno and Mora (2007) at the University of Costa Rica
concluded that there is a lack of information regarding recycling for the patrons and employees;
5
there is a lack of personnel available to collect, sort, and remove waste; and there is insufficient
organization and support from the management to carry out the program. This report also
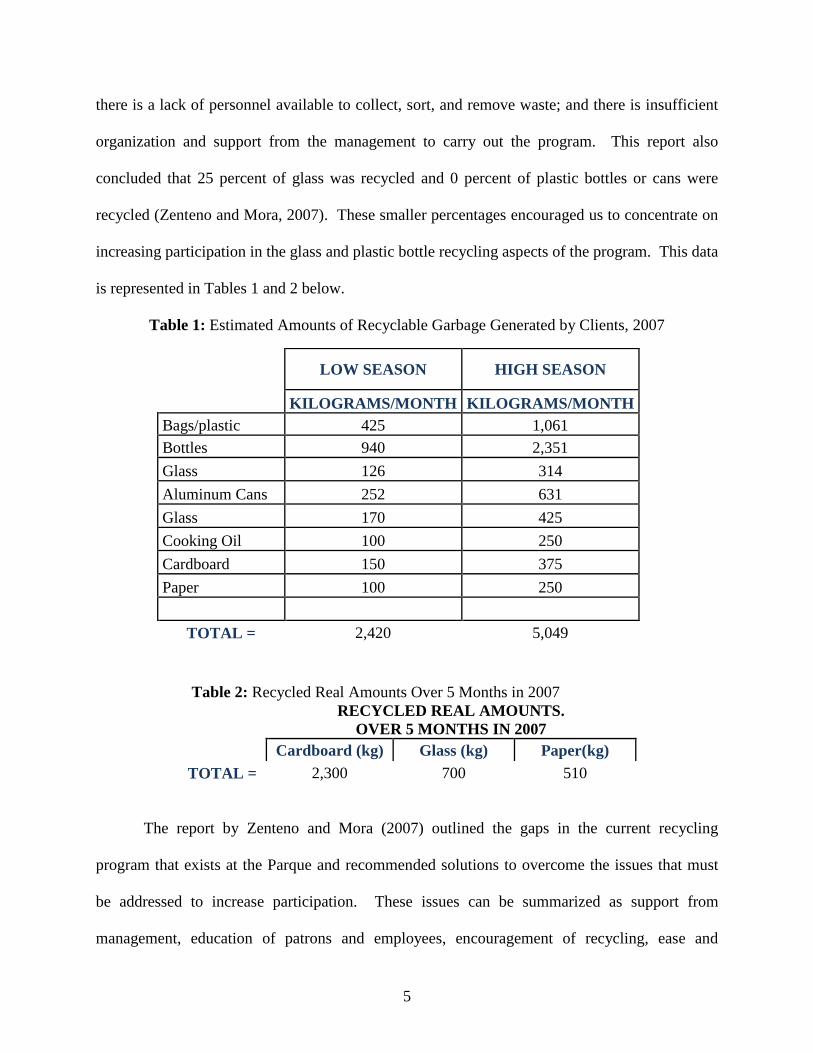
concluded that 25 percent of glass was recycled and 0 percent of plastic bottles or cans were
recycled (Zenteno and Mora, 2007). These smaller percentages encouraged us to concentrate on
increasing participation in the glass and plastic bottle recycling aspects of the program. This data
is represented in Tables 1 and 2 below.
Table 1: Estimated Amounts of Recyclable Garbage Generated by Clients, 2007
Table 2: Recycled Real Amounts Over 5 Months in 2007
RECYCLED REAL AMOUNTS.
OVER 5 MONTHS IN 2007
Cardboard (kg) Glass (kg) Paper(kg)
TOTAL = 2,300 700 510
The report by Zenteno and Mora (2007) outlined the gaps in the current recycling
program that exists at the Parque and recommended solutions to overcome the issues that must
be addressed to increase participation. These issues can be summarized as support from
management, education of patrons and employees, encouragement of recycling, ease and
LOW SEASON HIGH SEASON
KILOGRAMS/MONTH KILOGRAMS/MONTH
Bags/plastic 425 1,061
Bottles 940 2,351
Glass 126 314
Aluminum Cans 252 631
Glass 170 425
Cooking Oil 100 250
Cardboard 150 375
Paper 100 250
TOTAL = 2,420 5,049
6
accessibility of recycling, and progress of performance (Zenteno and Mora, 2007). Eirik
O’Neill, President of Corporate Recycling Services, a consulting company dedicated to
minimizing waste by the educating the clients of recycling, uses a theoretical construct for these
issues (Corporate Recycling Services, 2008). The University of Surrey also comments on these
issues in a Summary Report of the Surrey Scholar Research Project to Guildford Borough
Council, which tested methods to increase recycling through community action. The report
concluded that providing educational information of the recycling benefits, procedures to the
participants, and encouragement to recycling, as well as increasing opportunities to recycle, and
monitoring and informing the clients of their progress resulted in increased rates of participation
in the recycling program (Nigbur, Lyons, Uzzell and Muckle, 2005).
Support from Management
Support from the management requires monetary assistance for the resources necessary
for the program, such as time, space, and man power. According to O’Neill, it is of “upmost”
importance (personal communication, September 29, 2008). Commitment to the goal of properly
recycling waste increases participation (Nigbur et al., 2005). The program has to be supported
from the top to eliminate resistance to make the changes necessary for program implementation.
Indicators of support are seen through effective budgets, regular meetings, progress updates, and
enforcement of goals. If the management does not fully support recycling, then it will not be
willing to pay for the costs, or encourage participation among the employees, which will allow
for the program to fail in the future (O’Neill, 2008).
Johnson and Johnson, the family soap company, has a recycling program. They use only
recycled paper or paper from sustainable tree farms to produce boxes for the packaging of the
Band-Aid brand band aids. This dedication to the environment goes back to Robert Wood
7
Johnson, former Chairmen and member of the Johnson family, who noted in the company’s
credo that “we must maintain in good order… the environment and [our] natural resources”
(Johnson, 1943). William Weldon, the current Chairman, Board of Directors, and Chief
Executive Officer, has said that they understand, as a company, that it is their responsibility to
protect the environment. This support from the heads of the company has allowed Johnson and
Johnson to continue and expand their efforts to protect the environment worldwide.
This idea of support is stressed by the city of San Jose Environmental Services’ Guide to
Starting a Recycling Program at Work. This guide iterated that the first task is to obtain support
from the management, explaining that without managerial support, the program cannot exist
because there is no financial support or enforcement of initiatives (Recycleworks, 2008). This
level of commitment through financial support and endorsement should be maintained by Parque
to be more environmentally aware.
Education of Patrons and Employees
An educational program involves creating an understanding of the benefits of recycling
and the details of the procedures specific to that company. Individuals must gain an
understanding of what to recycle, why to recycle, and how to recycle through a program that
incorporates the different learning styles among individuals, as noted by O’Neill (2008). The
seven types of learning styles are visual, aural, verbal, physical, logical, social, and solitary.
These involve images, words, body, logic, other people, and individualism (Overview of
Learning Styles, 2007). Of the seven, there are three main learning styles. These are visual,
based on images; auditory, based on spoken word; and kinesthetic that involves touch (Learning
Styles, 2004). Yellowstone National Park uses the visual learning style to educate its patrons.
The park provides patrons with informative brochures that outline how to recycle. This includes
8
information on using the bins throughout the park and the advantages of recycling waste to the
environment and society. Yellowstone National Park does not have information regarding
percent increases in recycling due to these brochures at this time, but these brochures are
intended to aid in attaining the goal of recycling 90 percent solid waste generated (Yellow Stone
National Park Recycling Program, 2008).
The State of Recycling in Philadelphia: Analysis and Recommendations for
Philadelphia’s Floundering Recycling Program was a study that investigated implementing an
educational system for the recycling program intended to clean up the city. The researchers used
the auditory learning style in providing information to the citizens of the city through speakers
and presentations to provoke an understanding of what is recycled and why, and to promote the
practices needed for a successful program. As with Yellowstone National Park, there is no
specific data, but this method was used to educate the large population in order to achieve a
cleaner city (Wellington, 2006). The Parque can apply methods of educational visualization and
presentations as a way to inform the patrons of the benefits and procedures of recycling to
increase participation.
Encouragement of Recycling
Encouragement involves prompting and reminding the individuals to properly dispose of
waste through announcements and signage. O’Neill informed us that encouragement is a separate
challenge, as it differs from the educational issue in that it is a reminder to recycle and exhibits
an appreciation for the efforts of the clients (2008). In 2003, the Guildford Borough Council
utilized the Environmental Psychology Research Group at the University of Surrey to investigate
the aspects of society that influence recycling. This research identified that recycling behavior is
influenced by factors that have a psychological impact, including prompting and reminding

9
individuals to recycle. With encouragement, participation rose from 50 percent to 90 percent in
one experiment, while continuing to remain around 80 percent after feedback was discontinued
(Nigbur et al., 2005).
Similarly, at the Arizona State University, a professor of psychology, Dr. Robert Cialdini
(May 2000), tested the importance of encouragement in recycling. Public announcements were
presented in Tucson, Flagstaff, Yuma, and Prescott, which encouraged the participants to recycle
through verbal prompting and reminding of the proper disposal of waste. The data from these
communities was compared to a control setting in Phoenix and Snowflake, where no
advertisements were presented. The results showed a 24 percent increase in recycling in the four
communities with the announcements (Psychological Power of Positive Recycling, 2000). These
results are important in demonstrating the effective strategies needed for recycling and applying
environmentally conscious policies.
Ease and Accessibility of Recycling
In order to increase participation, there must be opportunities to properly dispose of waste
that do not require excess effort. O’Neill agrees and adds that the program must be simple in
order to encourage participation (2008). Yellowstone National Park addressed increased ease and
accessibility for recycling by placing over fifty bins throughout the park (Yellow Stone National
Park Recycling Program, 2008). Ten parks within the state of California have implemented
comparable recycling programs where the bins for recyclables are along side the garbage
receptacles and are of similar size. The circle on top of the bins only fits bottle and similar
shaped objects, prohibiting larger trash from being thrown in with recycling (Ms. Laurane,
personal communication, September 22, 2008). There was also a report conducted by the
University of Pennsylvania which concluded that there need to be plentiful opportunities to
10
recycle with multiple bins throughout the streets. By conducting interviews and performing case
studies of three other locations with once stagnant recycling programs, it was determined that
recycling must be simple and accessible with a single collection system of recyclable items.
There is no data to account for increases in recycling from Yellowstone, the California parks, or
the University of Pennsylvania, but the size, location, and accessibility of recycling bins were
perceived to be important to promote simple and user-friendly practices of recycling.
Progress of Performance
The clients should be informed of how well they are performing in the recycling
program, as people want to feel they are making a difference. According to O’Neill, if there is
no sense of accomplishment, the plan will eventually fail. He goes on to say that goals and
forms of competition are useful measures of progress (2008). In a research experiment by the
University of Surrey (2005), the idea of progress was addressed by leaving status updates at the
homes the day of recycling pick up to tell the participants how they and their neighbors were
doing. The researchers used multiple methods and found that when one street was told that they
were doing worse than another street, they performed better in the short run. When they were
told they performed better than others, they performed better in the long run. This method alone
increased recycling program participation from 50 percent to 90 percent. A follow up survey
found that, of the participants who responded, 88 percent remembered and regularly read the
performance updates noting that it had “a significant effect” on their willingness to recycle
(Nigbur, 2005). This issue needs to be addressed in order for Parque to maximize their recycling
program in the future and make the greatest difference to the environment and in the lives of the
patrons.
11
CHAPTER THREE: METHODOLOGY
Previously in the Parque, there were attempts to collect cans, plastic bottles, and glass
separately from non-recyclables, but there was a lack of participation by the clients. There was
also a small cardboard and paper recycling program within the offices. The goal of this project,
therefore, was to increase participation in the recycling program within Parque de Diversiones
and its offices. The objectives were to develop methods to increase participation and to
determine if these methods resulted in an increase in participation.
In order to meet these objectives, we conducted interviews with experts within the
Parque. These interviews provided information necessary to create the potentially feasible
methods of increasing participation. We conducted pilot programs, with the aid of the plant
manager and design artist, to test some of these proposed measures.
DEFINING THE NEEDS OF PARQUE DE DIVERSIONES
Based on conservations with our liaison, Cinthia Navarro (2008), and observations at the
Parque, we determined that the most important aspect of the project was to encourage the proper
disposal of recyclable materials. She noted that there was a recycling program currently at the
Parque, but the clients were not taking the extra step to deposit their waste in the proper
receptacle. Our priority was to determine if the methods developed from interviews and research
would increase participation in this recycling program.
DEVELOPING THE METHODS TO INCREASE PARTICIPATION
In order to develop increased participation in the recycling program at the Parque, we
researched the psychology of motivation, and its use in methods of recycling programs. We also
had interviews with a Costa Rican psychologist and a design artist to learn about the aspects of
local culture pertaining to motivation and recycling in general. We used information presented in
12
the background regarding the issues of recycling programs and how other organizations
addressed these issues to develop methods that could increase participation. In order to make the
methods more compatible with Costa Rica, we consulted the parks psychologist and graphic
designer to gain their perspectives. These methods included:
-Educational programs intended to inform patrons of the proper actions required for
recycling and its benefits.
-Active participation in which someone stands by bins showing people how to recycle
properly.
-Signage in the form of posters, banners, and pamphlets used to encourage recycling and
inform the patrons of the progress of the Parque.
-Redesigned receptacles with shaped openings limiting the types of waste that can be
deposited in them.
-Increasing the number of receptacles used to collect recyclables as to make recycling
more easily accessible.
DETERMINING METHODS OF INCREASED PARTICIPATION
Signage was decided as the best method to test because it offered the most usable data, fit
in our timeline for planning, and execution was relatively inexpensive. We would be able to test
education and encouragement, as well as ease and accessibility by using bins already located in
the Parque. Although it is not ideal to test three issues simultaneously, there were only two
weeks available to conduct experiments. One week was used to gain baseline data of the level of
participation with multiple bins present. We placed two bins already available in the Parque in
this picnic area, one designated for recyclables and the other for non-recyclables. The second
week was used to determine how encouragement and education, addressed with signage, would
13
affect the level of participation. The results and observations from this test informed us of how
these issues work together.
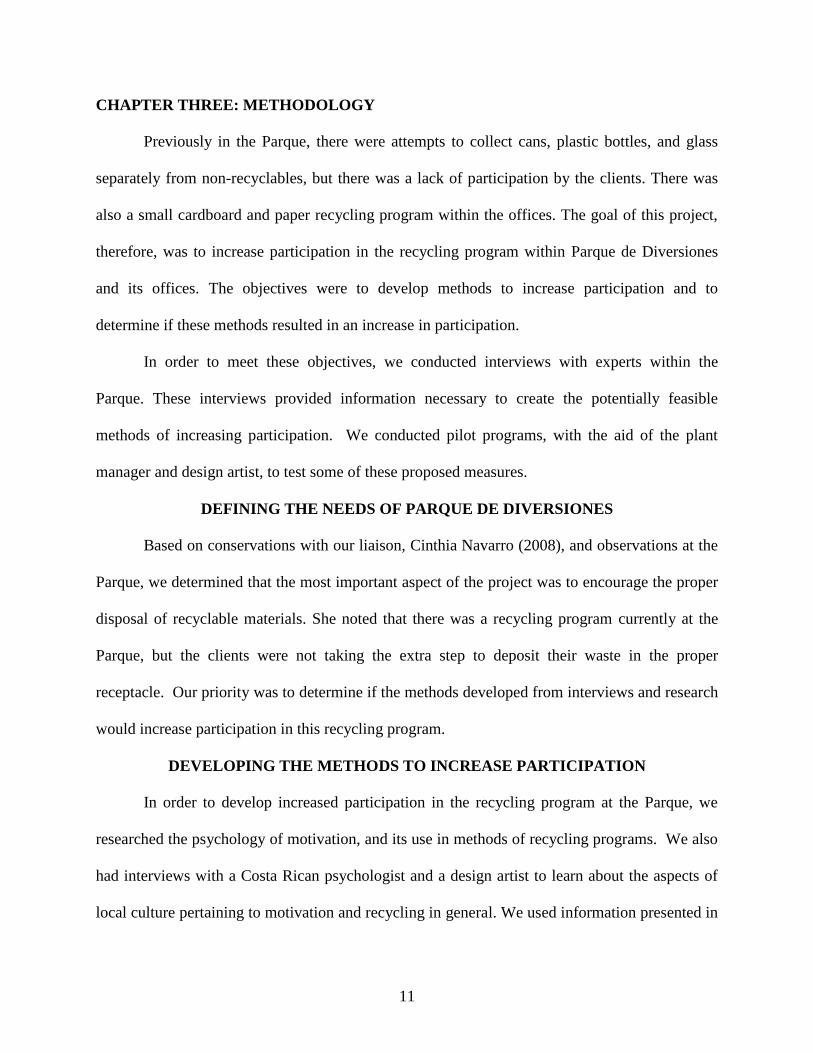
We used bright colors and active graphics that would receive the most attention. We
designed two signs for encouragement and one for education, as seen below. The wording was
chosen because it was simple, direct, and informative.
Figure 1: Banners for Experiment
We conducted an experiment to determine if there was an increase in participation due to
these signs. The location of the test was determined to be a picnic area of moderate usage with
only two entrances and exits allowing for monitoring. We chose this because it would have
enough traffic to see normal participation, but not so much as to create overflow problems. This
information was gathered by observing different picnic areas during our time in the park. We ran
experiments over two weekends because the Parque was only open Friday through Sunday. The
14
first week would be used to be a control for the test and the following week would be for the
experiment. See Figure 2 for a diagram of the experiment.
The experiments took place from 12:00 pm to 2:00 pm. These hours were chosen because
they included the Parque’s main lunch hours, implying more people would be disposing of their
waste after eating. On each of these days, we observed the actions of the patrons to record their
recycling behavior. This allowed for both qualitative and quantitative data to be collected. At the
end of the designated period, the standard garbage bins and the recyclable bins were collected
and separated. The contents were examined to see how much recyclable and non-recyclable
material was in either bin. The materials were weighed, counted, and analyzed after sorting.
This data was then recorded into a table.
We conducted a control experiment the first weekend. The experimental setup took place
the following week. For this setup, we placed the educational poster next to the same receptacles
used the previous week. The posters for encouragement were placed near the entrance and exits
of a picnic area. The encouragement posters were designed to present the idea of recycling to the
patrons. Then, when the patrons would throw away their trash, they would again be reminded
with a sign that explained to them how to recycle.
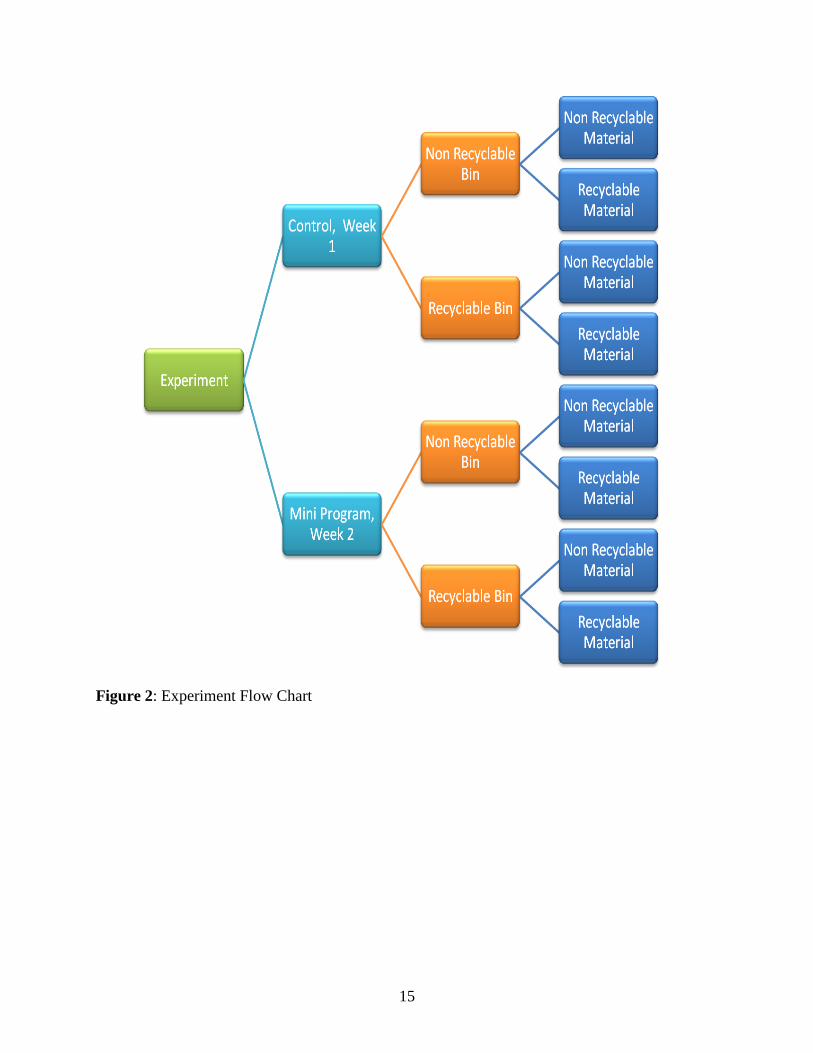
15
Figure 2: Experiment Flow Chart
16
CHAPTER FOUR: FINDINGS AND DISCUSSION
This chapter provides the results from the experiments we performed. It also analyzes
these results with regard to the issues that Parque de Diversiones faces in increasing participation
among patrons and employees.
EXPERIMENTAL FINDINGS
We determined which types of experiments would provide the most information from
testing, given our time and financial restrictions. An educational program, for example, would
require extensive planning, many months to witness the effects, and supplementary funding.
Active participation and the redesigning of receptacles could not be tested because we did not
have sufficient time to train an employee or redesign and construct a new receptacle.
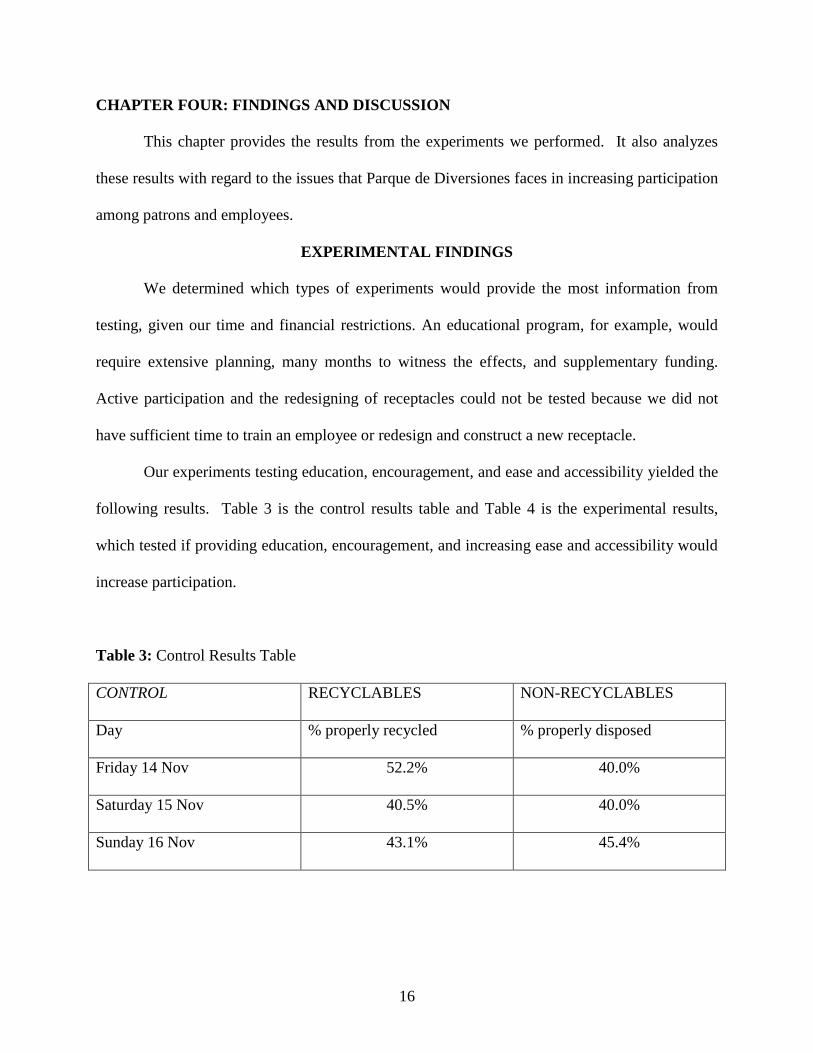
Our experiments testing education, encouragement, and ease and accessibility yielded the
following results. Table 3 is the control results table and Table 4 is the experimental results,
which tested if providing education, encouragement, and increasing ease and accessibility would
increase participation.
Table 3: Control Results Table
CONTROL RECYCLABLES NON-RECYCLABLES
Day % properly recycled % properly disposed
Friday 14 Nov 52.2% 40.0%
Saturday 15 Nov 40.5% 40.0%
Sunday 16 Nov 43.1% 45.4%
17
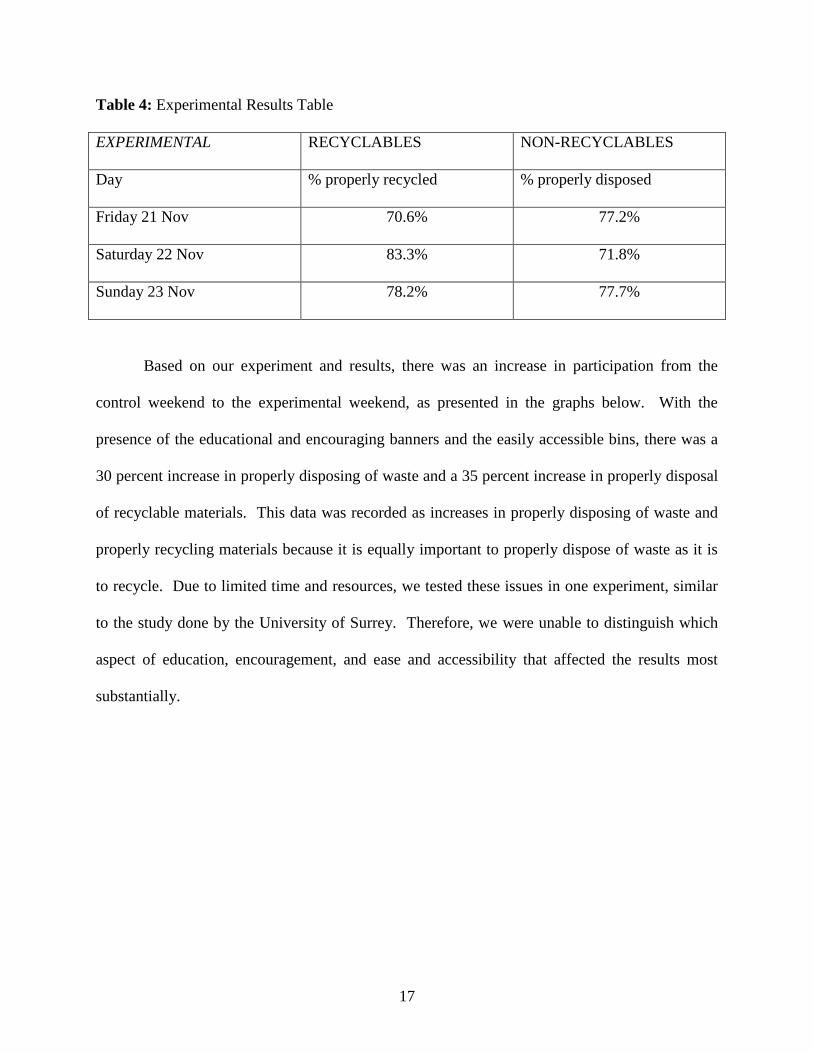
Table 4: Experimental Results Table
EXPERIMENTAL RECYCLABLES NON-RECYCLABLES
Day % properly recycled % properly disposed
Friday 21 Nov 70.6% 77.2%
Saturday 22 Nov 83.3% 71.8%
Sunday 23 Nov 78.2% 77.7%
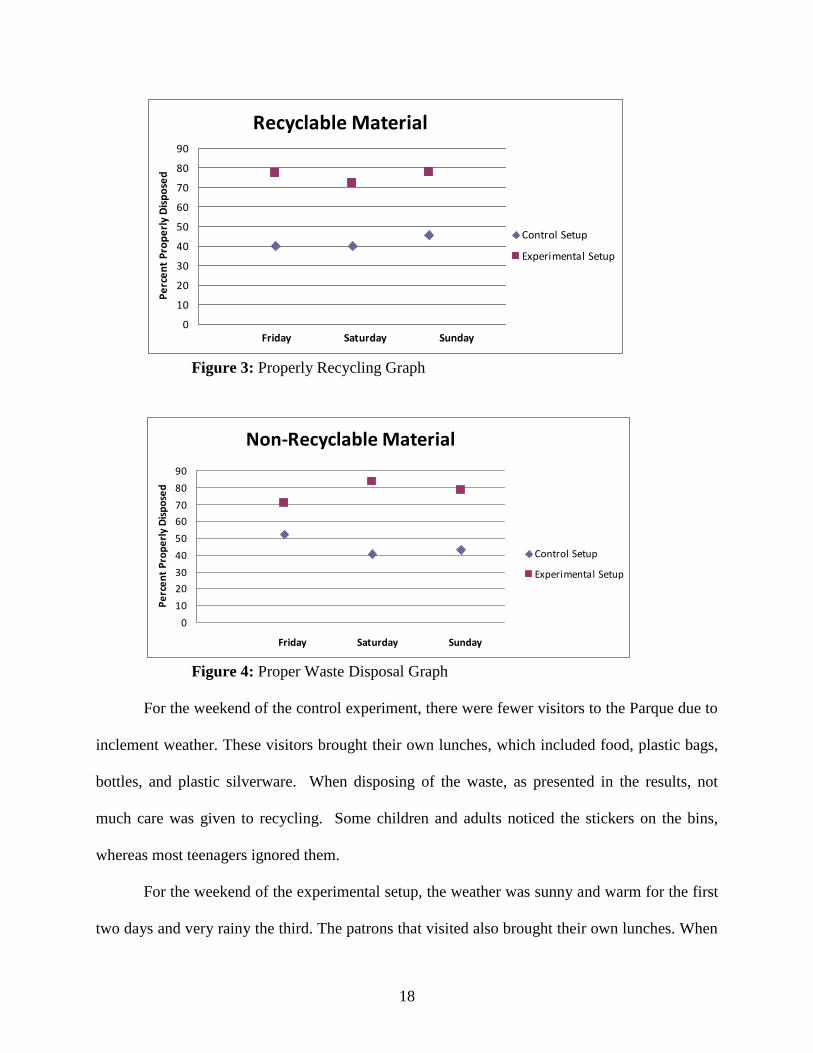
Based on our experiment and results, there was an increase in participation from the
control weekend to the experimental weekend, as presented in the graphs below. With the
presence of the educational and encouraging banners and the easily accessible bins, there was a
30 percent increase in properly disposing of waste and a 35 percent increase in properly disposal
of recyclable materials. This data was recorded as increases in properly disposing of waste and
properly recycling materials because it is equally important to properly dispose of waste as it is
to recycle. Due to limited time and resources, we tested these issues in one experiment, similar
to the study done by the University of Surrey. Therefore, we were unable to distinguish which
aspect of education, encouragement, and ease and accessibility that affected the results most
substantially.
18
Recyclable Material
0
10
20
30
40
50
60
70
80
90
Friday Saturday Sunday
Pe
rce
nt
Pro
pe
rly
Dis
po
sed
Control Setup
Experimental Setup
Figure 3: Properly Recycling Graph
Non-Recyclable Material
0
10
20
30
40
50
60
70
80
90
Friday Saturday Sunday
Pe
rce
nt
Pro
pe
rly
Dis
po
sed
Control Setup
Experimental Setup
Figure 4: Proper Waste Disposal Graph
For the weekend of the control experiment, there were fewer visitors to the Parque due to
inclement weather. These visitors brought their own lunches, which included food, plastic bags,
bottles, and plastic silverware. When disposing of the waste, as presented in the results, not
much care was given to recycling. Some children and adults noticed the stickers on the bins,
whereas most teenagers ignored them.
For the weekend of the experimental setup, the weather was sunny and warm for the first
two days and very rainy the third. The patrons that visited also brought their own lunches. When
19
observing the patrons actions, we noticed that some saw the signs near the bins and proceeded to
read the labels and recycle properly. One visitor was even seen making multiple trips to sort her
waste after reading the signs and stickers. Others, though, threw their waste away with no regard
for the signs or labels.
FURTHER FINDINGS AND DISCUSSION
The experimental results and information from the interviews can be correlated with
issues the Parque must handle. Arnold Murillo, the Plant Manager; Emilia Murillo, the Design
Artist; Ileana Avendaño, the Psychologist; Jesus Prado, the Restaurant Manager; and Luis
Solano, the Head of Purchasing, as well as specific bodies of literature, provided information for
discussion of the issues that the Parque will face.
Support from Management
Support from the management exists in enforcing the goals of recycling. At the Parque,
there is support from the management for a future recycling program with a twenty year plan in
place, which reorganizes the Parque. Recycling is the first initiative in completing this
transformation; therefore, there is great interest in our project. Recycling will exist in each area
of the park and the plan entails that there will be an efficient collection and sorting system in
place for the increased participation (personal communication, Don Rodolfo Lee, November 21,
2008). This plan exemplifies the support needed for a recycling program with employee and
patron participation.
Support from the management also exists in purchase planning. Currently, there is
interest in buying more recyclable and environmentally friendly products, such as biodegradable
plastics. The Parque has moved to more digital and computerized information storage to save
money and reduce paper usage; using a quarter of the receipt paper they had previously (personal
20
communication, Luis Solano, November 14, 2008). This information expresses the company’s
desire to recycle and be more environmentally conscience at the present time. As discussed in
the background, the management must support current actions and future endeavors to increase
participation, which is exemplified at the Parque.
Employees
A recycling program requires sufficient funding and man power. The plant services
department, which coordinates the recycling at the Parque, has a tight budget of $200 per month
allocated for all cleaning supplies including soap, garbage bags, and gloves. The remainder of
the budget pays salaries. They also have a small work force consisting of two collectors and four
to eleven cleaners depending on the season. The crew is capable of collecting the sorted waste,
but they do not have enough employees or the facilities to properly sort and store these materials
(personal communication, Arnold Murillo, November 5, 2008). In order efficiently collect the
recyclables, additional employees are needed.
Each additional employee to sort the waste would cost approximately $2653 per year.
This is based on an eight hour work day; working four days a week during low season and seven
days a week during high season at 800 cólones per hour. If the employee were to work seven
days a week for the entire year, it would cost the Parque approximately $3900 not including
benefits (personal communication, Cinthia Navarro, November 13, 2008). During the low
season, the Parque is only open three days a week, therefore, sorting would be required during
those three days and an additional day to handle the waste produced during the rest of the week.
During the high season, the park is open seven days a week, thus, an employee would be
necessary during the full week.
21
Bins
According to Zenteno and Mora (2007), there has been an average 24 percent increase in
the waste collected in the Parque each year over the past three years, as presented in Table 5
(Zenteno and Mora, 2007). In order to accommodate these increases, the Parque needs to
purchase an average of 30 percent more bins. Currently, there are 127 bins throughout the
property. Next year, with 165 bins, the Parque would avoid overflow and could manage the
waste. It has also been determined that approximately 30 percent of the waste from the Parque is
plastic bottles, cans, and glass. Therefore, 30 percent of the bins should be allocated for
recycling. For next year, this would mean that fifty bins would be for recycling, while the
remainder for garbage. However, this ratio is not ideal. Eventually, there should be an equal
ratio of recycling bins to garbage bins. This will aid in ease and accessibility by providing many
opportunities to properly dispose of waste.
Table 5: Waste Generation from 2004-2007
Year Waste Generated
(kg)
Increase From Previous Year
(%)
2004 175250 -
2005 225929 29
2006 271114 20
2007 329916 22
The need for additional bins is also exemplified in the cleanliness of the Parque. There
are not enough waste bins to handle the number of people who use them. As seen in Figure 4,
these bins become over full. A more organized system for waste management would prevent
over flow and create a cleaner park (personal communication, Jesus Prado, November 14, 2008).
Each additional bin costs approximately $54. For the immediate 30 percent increase, it would
22
cost $2700. The ultimate goal of an equal ratio of recycling bins to garbage bins would require
65 additional bins, or $3510. Total cost for these bins would then be $6210.
Figure 5: Garbage Overflow
Removal
Increased participation involves more than people depositing materials into the proper
bins. The program must be complete. In order for the Parque to handle an increase in
participation, they will need to consider how to handle these recyclables and who removes them.
Without this step, the Parque itself will not be able to participate in its own recycling program.
Currently, the Parque stores the recyclables in barrels next to the trash compactor. This system
will not be sufficient to store larger quantities of recyclable materials. There are at least seven
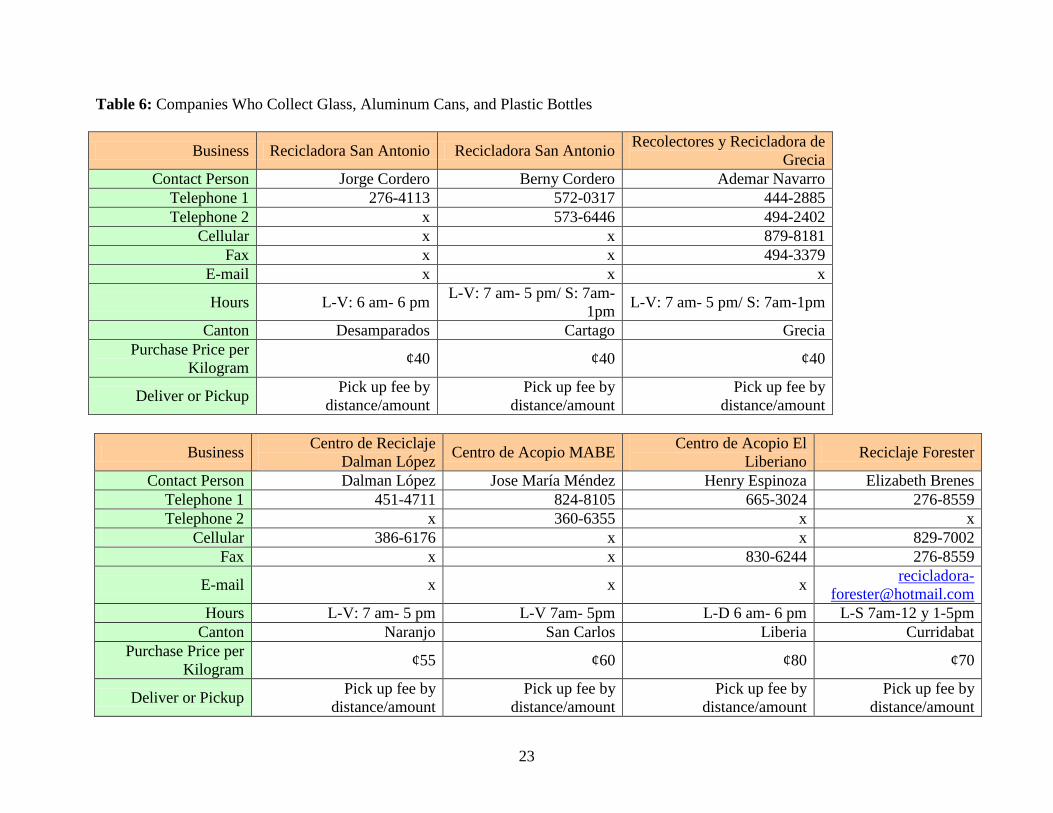
companies, shown in Table 6, who pick up, and pay for glass, aluminum cans, and plastic bottles.
This new information can aid in the collection process by providing other possible solutions.
23
Table 6: Companies Who Collect Glass, Aluminum Cans, and Plastic Bottles
Business Recicladora San Antonio Recicladora San Antonio Recolectores y Recicladora de
Grecia
Contact Person Jorge Cordero Berny Cordero Ademar Navarro
Telephone 1 276-4113 572-0317 444-2885
Telephone 2 x 573-6446 494-2402
Cellular x x 879-8181
Fax x x 494-3379
E-mail x x x
Hours L-V: 6 am- 6 pm L-V: 7 am- 5 pm/ S: 7am-
1pm L-V: 7 am- 5 pm/ S: 7am-1pm
Canton Desamparados Cartago Grecia
Purchase Price per
Kilogram ¢40 ¢40 ¢40
Deliver or Pickup Pick up fee by
distance/amount
Pick up fee by
distance/amount
Pick up fee by
distance/amount
Business Centro de Reciclaje
Dalman López Centro de Acopio MABE
Centro de Acopio El
Liberiano Reciclaje Forester
Contact Person Dalman López Jose María Méndez Henry Espinoza Elizabeth Brenes
Telephone 1 451-4711 824-8105 665-3024 276-8559
Telephone 2 x 360-6355 x x
Cellular 386-6176 x x 829-7002
Fax x x 830-6244 276-8559
E-mail x x x recicladora-
Hours L-V: 7 am- 5 pm L-V 7am- 5pm L-D 6 am- 6 pm L-S 7am-12 y 1-5pm
Canton Naranjo San Carlos Liberia Curridabat
Purchase Price per
Kilogram ¢55 ¢60 ¢80 ¢70
Deliver or Pickup Pick up fee by
distance/amount
Pick up fee by
distance/amount
Pick up fee by
distance/amount
Pick up fee by
distance/amount
24
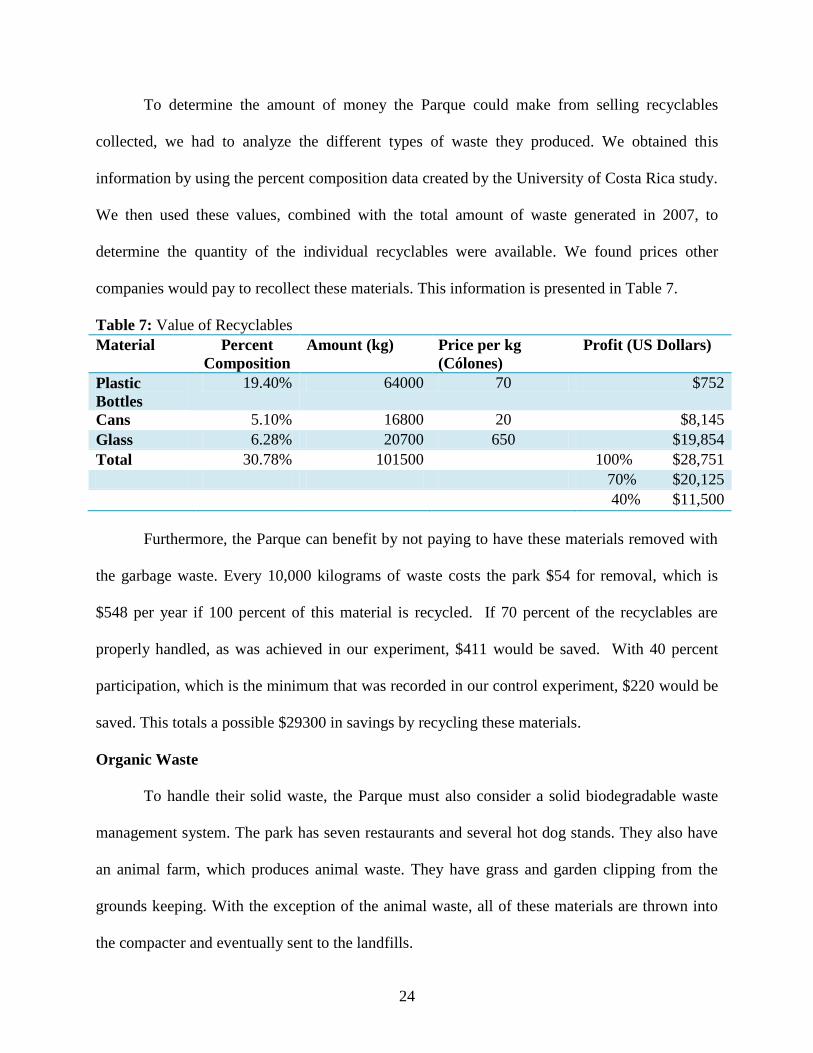
To determine the amount of money the Parque could make from selling recyclables
collected, we had to analyze the different types of waste they produced. We obtained this
information by using the percent composition data created by the University of Costa Rica study.
We then used these values, combined with the total amount of waste generated in 2007, to
determine the quantity of the individual recyclables were available. We found prices other
companies would pay to recollect these materials. This information is presented in Table 7.
Table 7: Value of Recyclables
Material Percent
Composition
Amount (kg) Price per kg
(Cólones)
Profit (US Dollars)
Plastic
Bottles
19.40% 64000 70 $752
Cans 5.10% 16800 20 $8,145
Glass 6.28% 20700 650 $19,854
Total 30.78% 101500 100% $28,751
70% $20,125
40% $11,500
Furthermore, the Parque can benefit by not paying to have these materials removed with
the garbage waste. Every 10,000 kilograms of waste costs the park $54 for removal, which is
$548 per year if 100 percent of this material is recycled. If 70 percent of the recyclables are
properly handled, as was achieved in our experiment, $411 would be saved. With 40 percent
participation, which is the minimum that was recorded in our control experiment, $220 would be
saved. This totals a possible $29300 in savings by recycling these materials.
Organic Waste
To handle their solid waste, the Parque must also consider a solid biodegradable waste
management system. The park has seven restaurants and several hot dog stands. They also have
an animal farm, which produces animal waste. They have grass and garden clipping from the
grounds keeping. With the exception of the animal waste, all of these materials are thrown into
the compacter and eventually sent to the landfills.
25
Approximately 9.5 percent, or 14615 kilograms, of biodegradable waste comes from
restaurants (Zenteno, Mora 2007). With additional training, the cleaners could sort this waste at
the source. Most food is brought in from outside park, and this becomes problem for collecting
that other 91.5 percent of biodegradable waste. This would require additional workers to do this
sorting. The food waste could be used to create fertilizer with composting, or even a biodigester.
Percent Composition Of Waste Generated
19.48.45
6.24
5.13.57 2.93 0.45
31.42
7.68
6.36
6.28
2.13
Food Waste Plastic Bottles Waste Paper
Plastic Other Materials Glass
Aluminum Cans Tetrabrik
Iron Plastic Bags Yard Waste
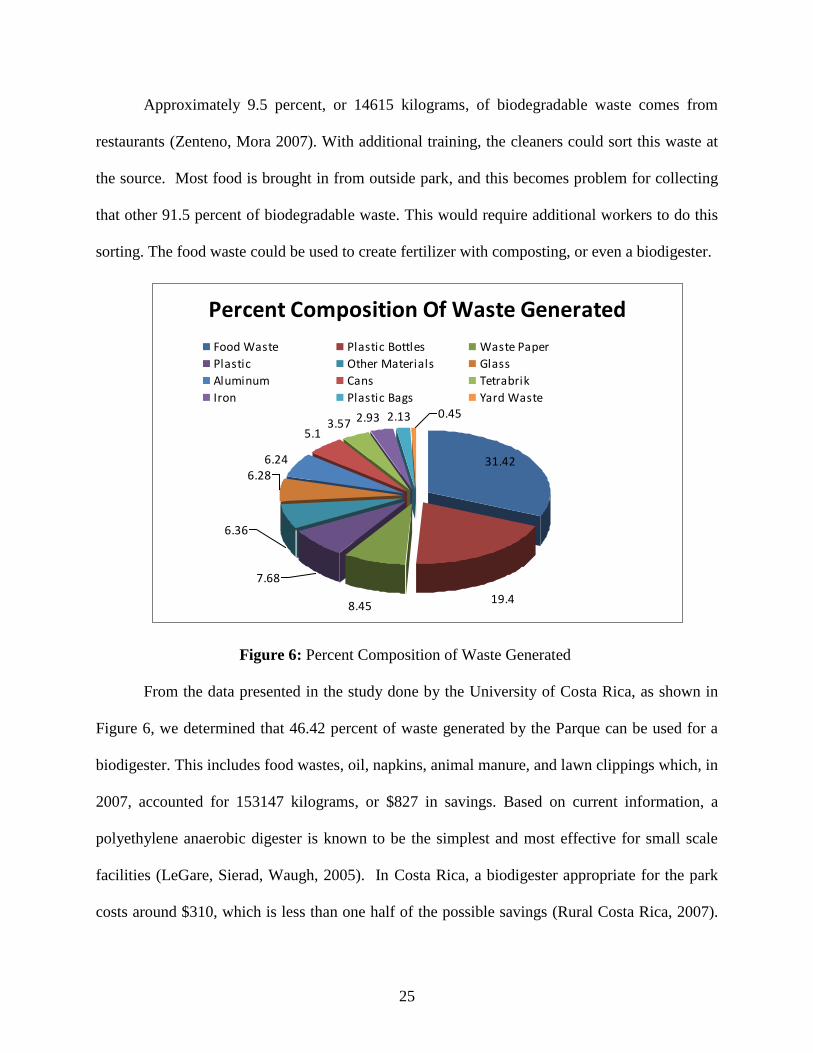
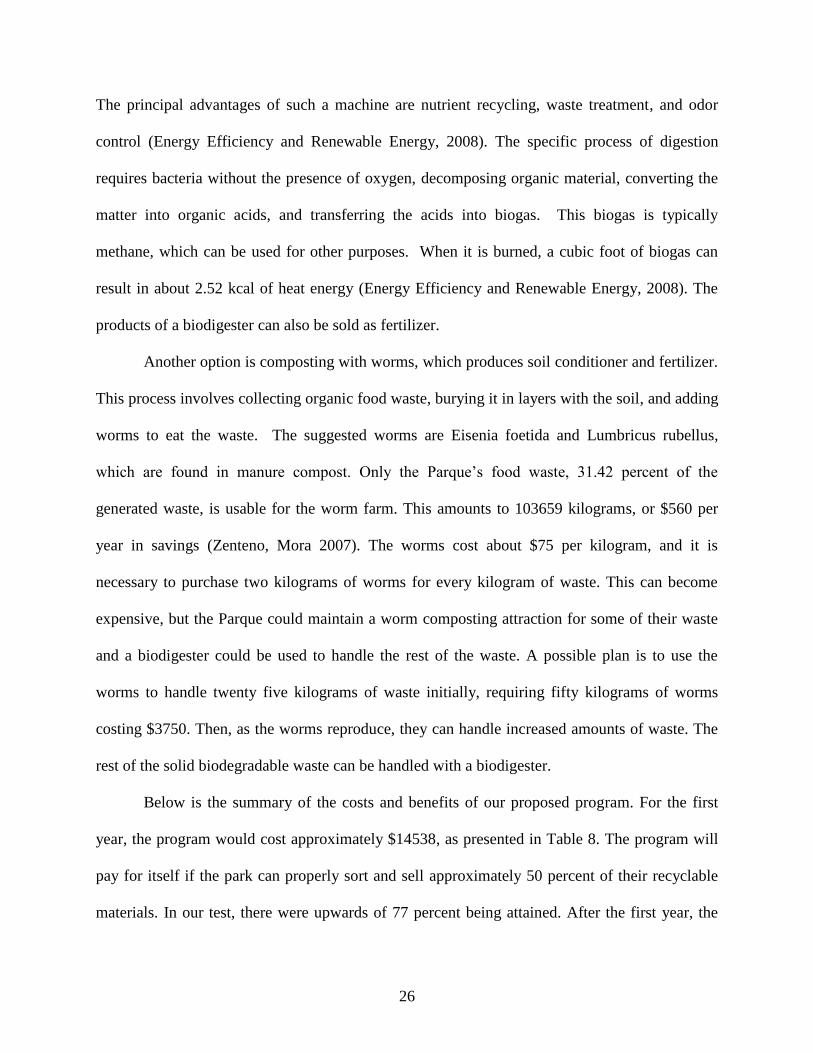
Figure 6: Percent Composition of Waste Generated
From the data presented in the study done by the University of Costa Rica, as shown in
Figure 6, we determined that 46.42 percent of waste generated by the Parque can be used for a
biodigester. This includes food wastes, oil, napkins, animal manure, and lawn clippings which, in
2007, accounted for 153147 kilograms, or $827 in savings. Based on current information, a
polyethylene anaerobic digester is known to be the simplest and most effective for small scale
facilities (LeGare, Sierad, Waugh, 2005). In Costa Rica, a biodigester appropriate for the park
costs around $310, which is less than one half of the possible savings (Rural Costa Rica, 2007).
26
The principal advantages of such a machine are nutrient recycling, waste treatment, and odor
control (Energy Efficiency and Renewable Energy, 2008). The specific process of digestion
requires bacteria without the presence of oxygen, decomposing organic material, converting the
matter into organic acids, and transferring the acids into biogas. This biogas is typically
methane, which can be used for other purposes. When it is burned, a cubic foot of biogas can
result in about 2.52 kcal of heat energy (Energy Efficiency and Renewable Energy, 2008). The
products of a biodigester can also be sold as fertilizer.
Another option is composting with worms, which produces soil conditioner and fertilizer.
This process involves collecting organic food waste, burying it in layers with the soil, and adding
worms to eat the waste. The suggested worms are Eisenia foetida and Lumbricus rubellus,
which are found in manure compost. Only the Parque’s food waste, 31.42 percent of the
generated waste, is usable for the worm farm. This amounts to 103659 kilograms, or $560 per
year in savings (Zenteno, Mora 2007). The worms cost about $75 per kilogram, and it is
necessary to purchase two kilograms of worms for every kilogram of waste. This can become
expensive, but the Parque could maintain a worm composting attraction for some of their waste
and a biodigester could be used to handle the rest of the waste. A possible plan is to use the
worms to handle twenty five kilograms of waste initially, requiring fifty kilograms of worms
costing $3750. Then, as the worms reproduce, they can handle increased amounts of waste. The
rest of the solid biodegradable waste can be handled with a biodigester.
Below is the summary of the costs and benefits of our proposed program. For the first
year, the program would cost approximately $14538, as presented in Table 8. The program will
pay for itself if the park can properly sort and sell approximately 50 percent of their recyclable
materials. In our test, there were upwards of 77 percent being attained. After the first year, the
27
annual costs will be approximately $4378. This program would then produce more profits for the
Parque to donate to the Children’s hospital. If the program maintains only 40 percent material
properly handled, it will still produce $7670 in profit every year. This is presented in Table 9 and
calculated from the costs and benefits of the additional employees, additional bins, removal, and
organic waste. Also, the intangibles values must be accounted for. Less waste will be sent to the
landfills, which will help the environment; the Parque can gain an image of environmental
friendliness; and more money could be donated to the National Children’s Hospital.
Table 8: Summary of Costs for Recycling program
Table 9: Summary of Recycling Benefits
Benefits Yearly Value
Sale of Recyclables $28,751.00
Landfill Cost Savings $1,368.00
Total 100% $30,119.00
70% $21,083.30
40% $12,047.60
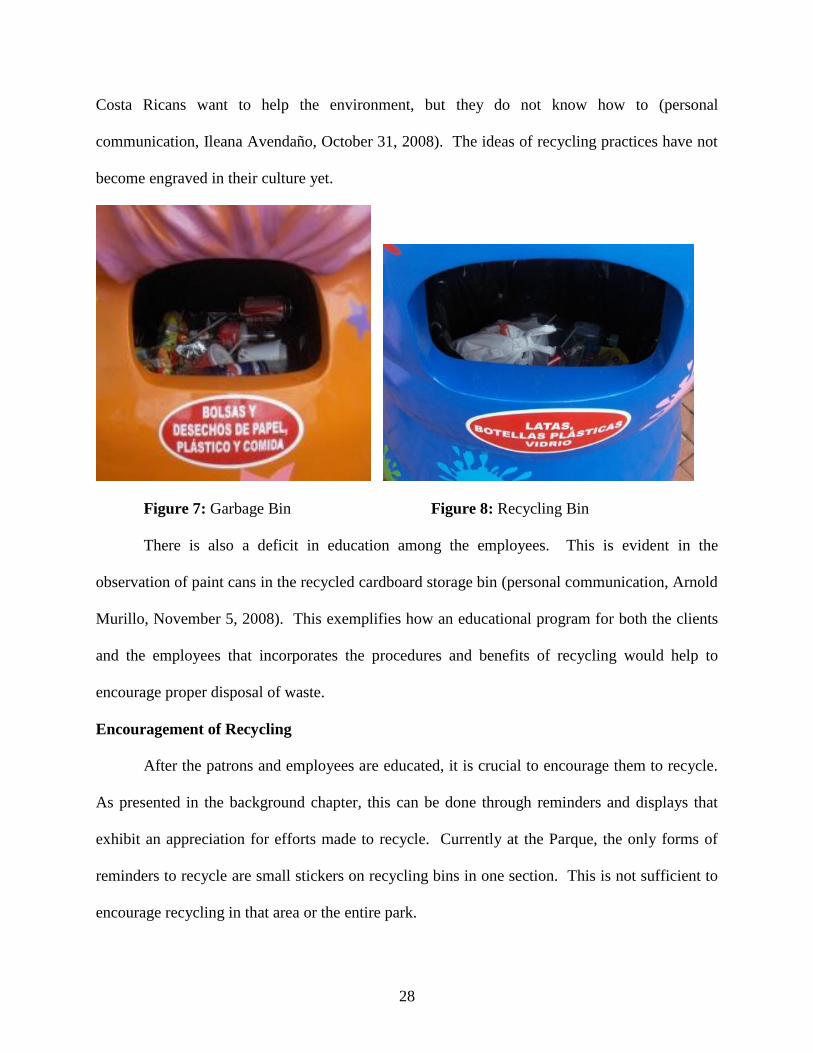
Education of Patrons and Employees
Educating the clients and employees of the benefits of recycling and the procedures
required will provide them with the knowledge necessary to properly dispose of waste, as
discussed in the background chapter. Currently, there is a low level of comprehension among
the clients. Figure 5 demonstrates how recyclables are mixed in with the garbage in a trash bin.
Similarly, Figure 6 presents how garbage is also mixed in with the recyclables with disregard for
the sticker advocating recyclables only. This is due to the newness of recycling initiatives.
Costs Each Quantity Total Annual/Capital Cost
Bins $54.00 115 $6,210.00 Capital
Biodigester $310.00 1 $310.00 Capital
Worms $75.00/kg 50 kg $3,750.00 Capital
Signs $15.00 115 $1,725.00 Annual
Employees $2,653.00 1 $2,653.00 Annual
Total $14,653.00
28
Costa Ricans want to help the environment, but they do not know how to (personal
communication, Ileana Avendaño, October 31, 2008). The ideas of recycling practices have not
become engraved in their culture yet.
Figure 7: Garbage Bin Figure 8: Recycling Bin
There is also a deficit in education among the employees. This is evident in the
observation of paint cans in the recycled cardboard storage bin (personal communication, Arnold
Murillo, November 5, 2008). This exemplifies how an educational program for both the clients
and the employees that incorporates the procedures and benefits of recycling would help to
encourage proper disposal of waste.
Encouragement of Recycling
After the patrons and employees are educated, it is crucial to encourage them to recycle.
As presented in the background chapter, this can be done through reminders and displays that
exhibit an appreciation for efforts made to recycle. Currently at the Parque, the only forms of
reminders to recycle are small stickers on recycling bins in one section. This is not sufficient to
encourage recycling in that area or the entire park.
29
To encourage the patrons and employees to recycle, the use of colors must be considered.
Specifically, yellow is an activator, while blue is a comforting color (Precision InterMedia,
2008). These two colors are seen on signs throughout the Parque to advertise the attractions and
could be used similarly to encourage recycling. Encouragement should also be cordial, as the
intention is not to beg individuals to recycle, but encourage them to properly dispose of their
waste (personal communication, Emilia Murillo, October 30, 2008).
The typical size for posters is 120 by 160 centimeter posters and each costs $15. These
must be varied and circulated evenly throughout the Parque at each recycling bin. For the initial
setup of 50 bins, this would cost $750. This then can be augmented over the years, as with the
bins, to 115 banners or posters or 65 additional ones, which would cost $975. This would be a
total of $1725 necessary to fully encourage participation, presented in Table 10.
Table 10: Cost of Banners
Number of Banners Cost
1 $15
50 $750
115 $975
TOTAL $1725
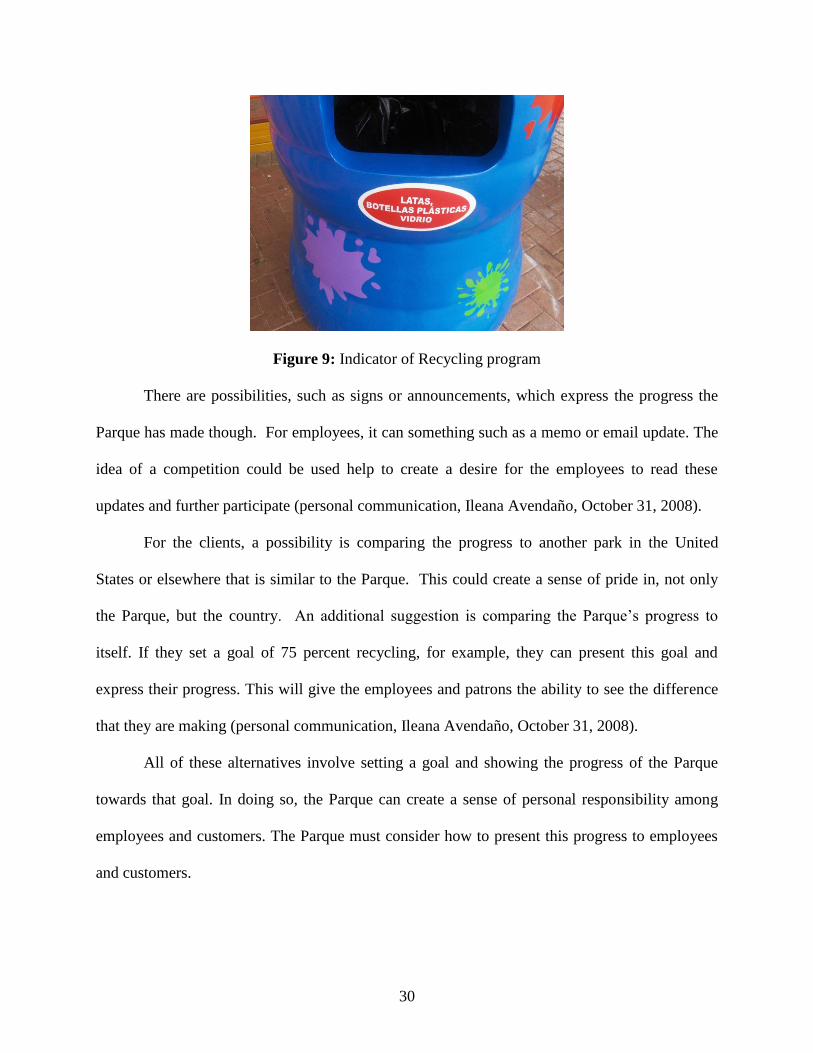
Progress of Performance
After the employees and customers have been educated, encouraged, and then had many
opportunities to recycle, they need to be informed of their progress. Currently, there is no
information available to patrons or employees to express the progress the Parque has made.
There is no indication of a recycling program in the Parque besides the stickers placed on bins in
Plaza Tio Conejo, pictured in Figure 9 below.
30
Figure 9: Indicator of Recycling program
There are possibilities, such as signs or announcements, which express the progress the
Parque has made though. For employees, it can something such as a memo or email update. The
idea of a competition could be used help to create a desire for the employees to read these
updates and further participate (personal communication, Ileana Avendaño, October 31, 2008).
For the clients, a possibility is comparing the progress to another park in the United
States or elsewhere that is similar to the Parque. This could create a sense of pride in, not only
the Parque, but the country. An additional suggestion is comparing the Parque’s progress to
itself. If they set a goal of 75 percent recycling, for example, they can present this goal and
express their progress. This will give the employees and patrons the ability to see the difference
that they are making (personal communication, Ileana Avendaño, October 31, 2008).
All of these alternatives involve setting a goal and showing the progress of the Parque
towards that goal. In doing so, the Parque can create a sense of personal responsibility among
employees and customers. The Parque must consider how to present this progress to employees
and customers.
31
CHAPTER FIVE: CONCLUSIONS AND RECOMMENDATIONS
Our main conclusions are:
There was a 30 percent increase in properly disposing of waste and a 35 percent
increase in recycling when the patrons were educated and encouraged to recycle.
There is uneven support from the management throughout the Parque for a
successful recycling program.
There is an insufficient amount of attention given to recycling within the Parque
infrastructure.
A recycling program can produce profits to be donated to the National Children’s
Hospital.
Therefore we recommend the Parque take specific measures in increasing participation in the
recycling program. These recommendations will raise profits for the Children’s Hospital, but
also create a sense of environmental concern that can not be measured.
FUNDING
We recommend that the Parque support the recycling program through additional funding
of recycling procedures. We recommend more employees to handle the increases in recycling
participation. There must also be additional recycling bins throughout the Parque to increase
ease and accessibility. Funding also incorporates signs and posters to promote proper disposal of
waste.
Bins
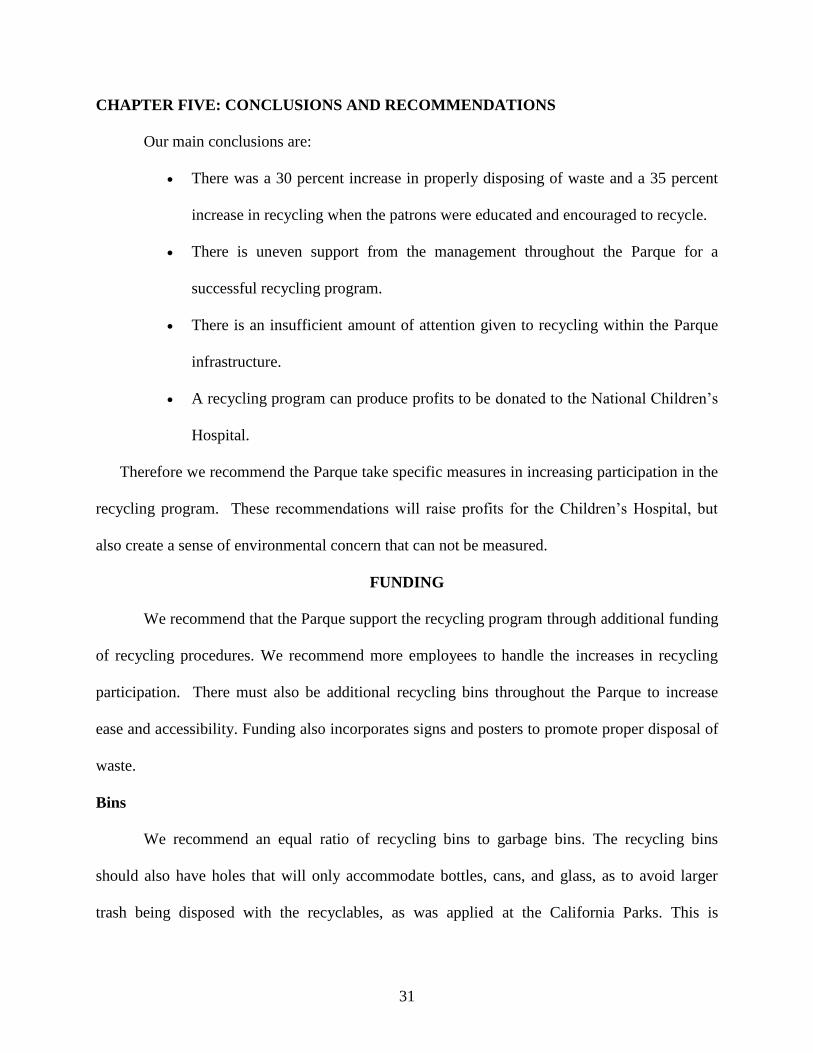
We recommend an equal ratio of recycling bins to garbage bins. The recycling bins
should also have holes that will only accommodate bottles, cans, and glass, as to avoid larger
trash being disposed with the recyclables, as was applied at the California Parks. This is
32
presented below in Figure 10. These ideas would provide more opportunities to properly dispose
of waste. This monetary assistance necessary for this recommendation is $6210.
Figure 10: Size Accommodating Recycling Bins
Restaurants
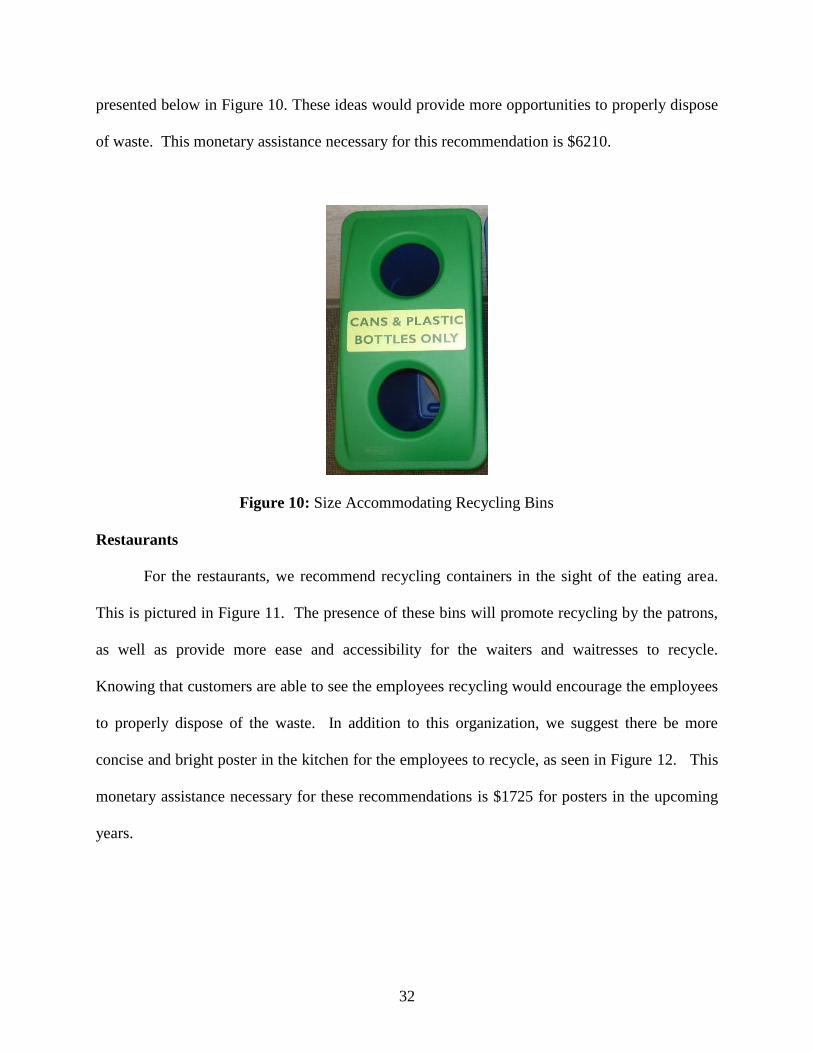
For the restaurants, we recommend recycling containers in the sight of the eating area.
This is pictured in Figure 11. The presence of these bins will promote recycling by the patrons,
as well as provide more ease and accessibility for the waiters and waitresses to recycle.
Knowing that customers are able to see the employees recycling would encourage the employees
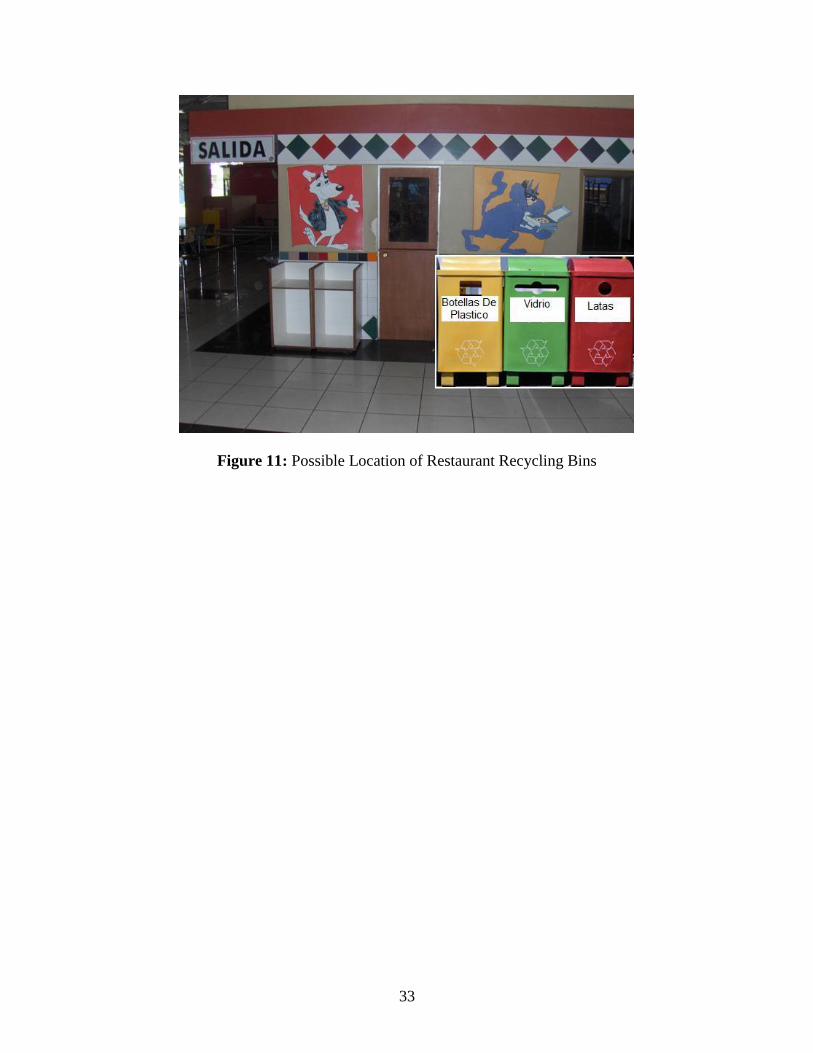
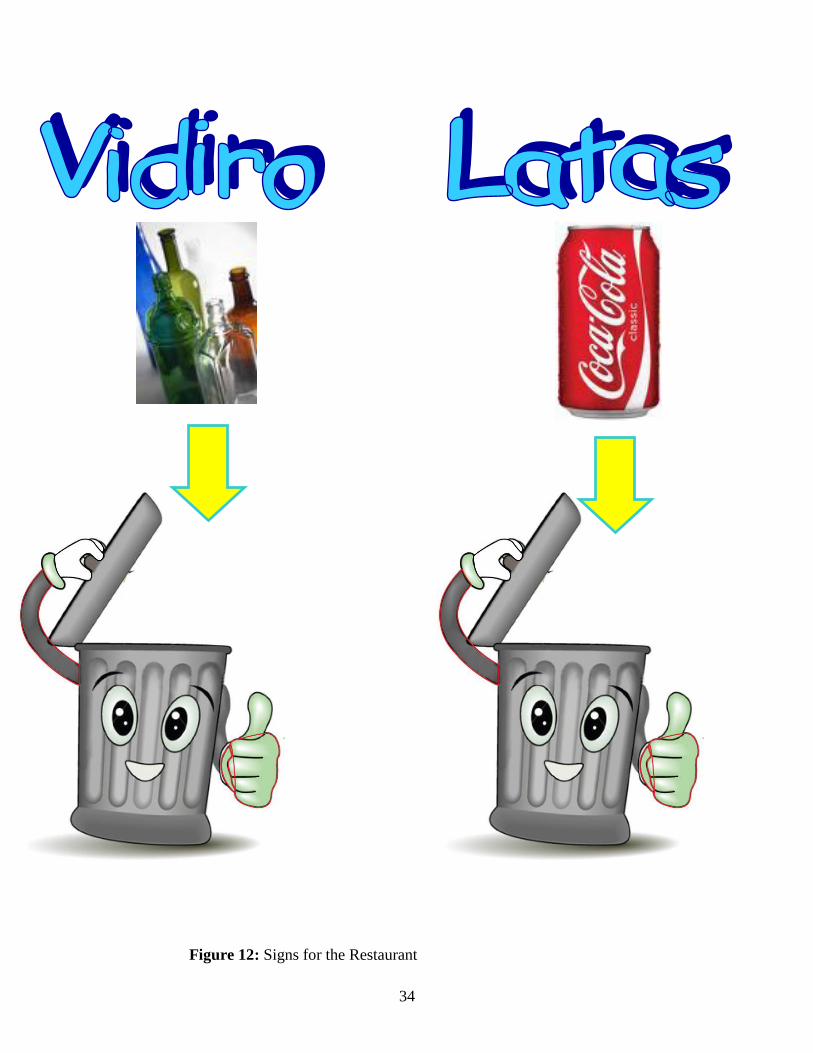
to properly dispose of the waste. In addition to this organization, we suggest there be more
concise and bright poster in the kitchen for the employees to recycle, as seen in Figure 12. This
monetary assistance necessary for these recommendations is $1725 for posters in the upcoming
years.
33
Figure 11: Possible Location of Restaurant Recycling Bins
34
Figure 12: Signs for the Restaurant
35
REMOVAL
Based on the data supplied in the discussion, we recommend that the Parque use the
Reciclaje Forester removal company. They are the closest to the Parque that will pay the most
for the recyclables. This also incorporates the ease of the pick up method, such that the company
will come to the Parque to remove the recyclables. If the goal of 70 percent recyclables is
attained, the Parque can receive upwards of $20000 each year. In addition, a minimum of $400
can be saved each year by recycling this waste rather than disposing of it with the garbage.
EDUCATION OF PATRONS AND EMPLOYEES
We recommend an educational program that uses visual signs, messages over loud
speakers, and the practice of recycling. To inform the patrons of the procedures of recycling,
there should be an educational program in the form of a show. The Parque’s characters could be
used as icon showing the viewers how to recycle while being entertained. Incorporating the
initiatives of recycling, demonstrating what is recyclable, and how to properly recycle would
provide the guests with the information required to participate. The Parque already has an
Education with Amusement program in the local schools. Recycling could be added to that
curriculum to teach students of the benefits and processes necessary.
For the employees, a training presentation on how to properly dispose of waste and the
benefits of recycling is necessary. The employees will know how to recycle and that it is
important to the company and would be encouraged to participate. The employees in the
restaurants could also be trained specifically how to recycle organic waste.
ENCOURAGEMENT OF RECYCLING
To encourage the patrons and employees to recycle, we recommend the Parque use four
main ideas. First, posters that advocate recycling should continually change. This will keep the
36
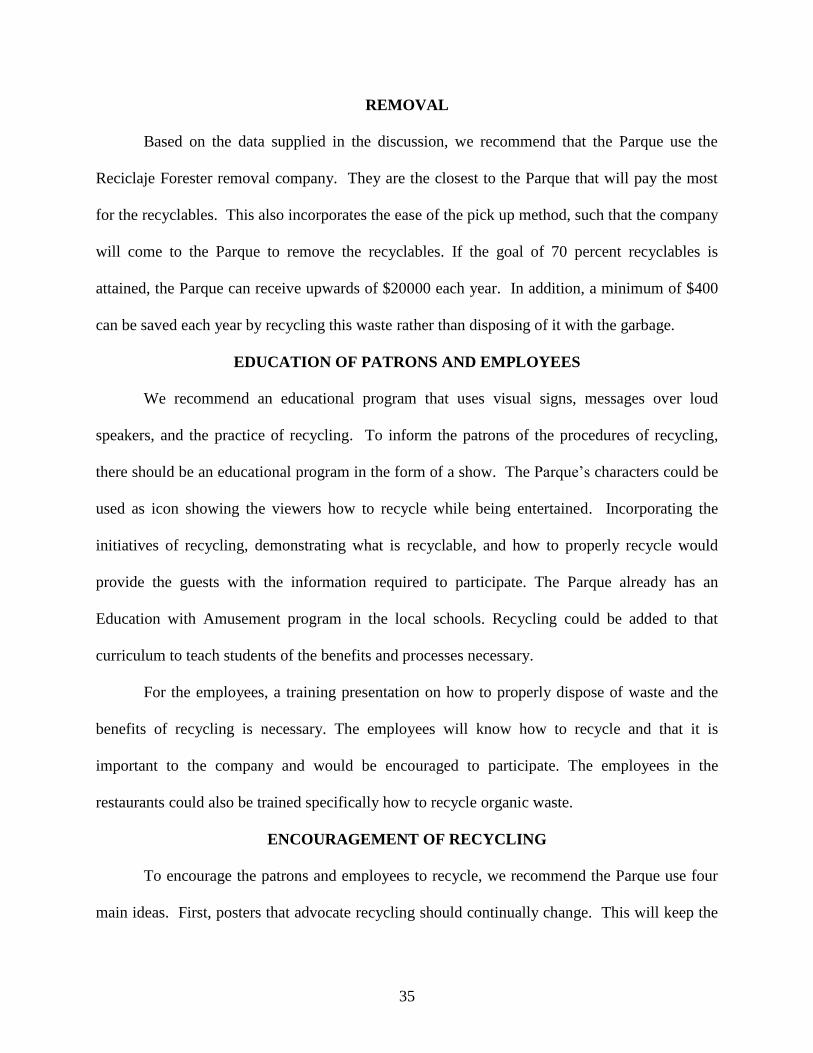
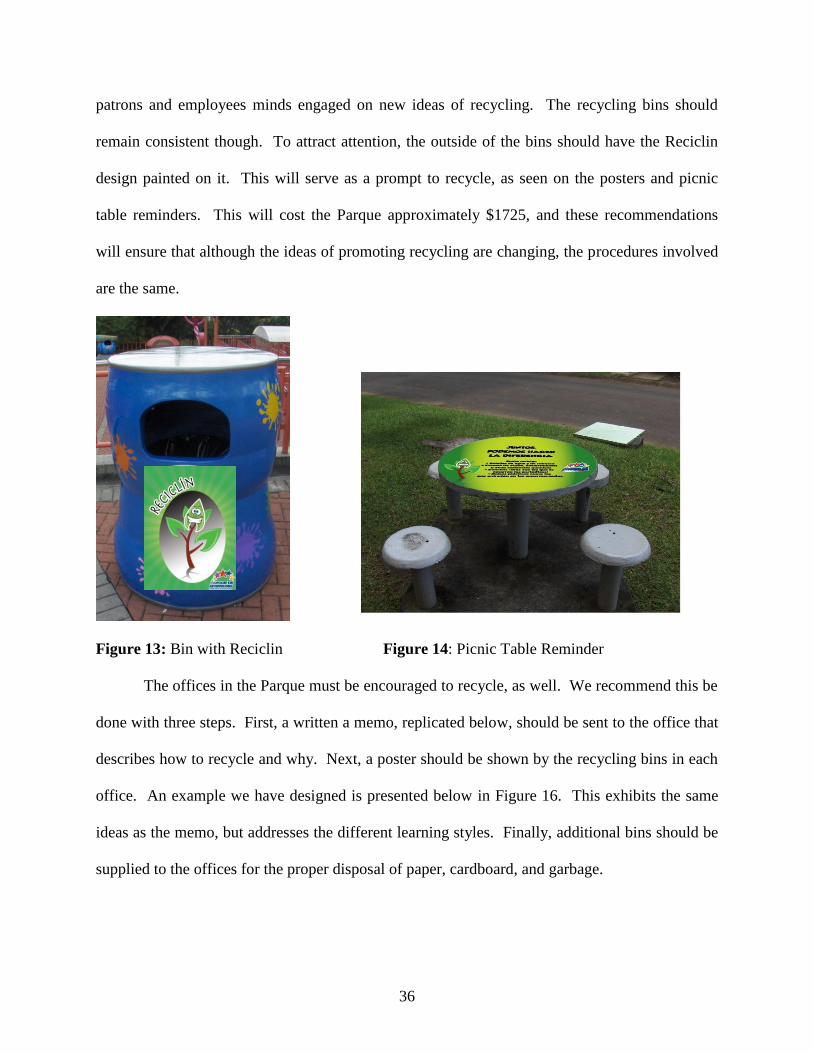
patrons and employees minds engaged on new ideas of recycling. The recycling bins should
remain consistent though. To attract attention, the outside of the bins should have the Reciclin
design painted on it. This will serve as a prompt to recycle, as seen on the posters and picnic
table reminders. This will cost the Parque approximately $1725, and these recommendations
will ensure that although the ideas of promoting recycling are changing, the procedures involved
are the same.
Figure 13: Bin with Reciclin Figure 14: Picnic Table Reminder
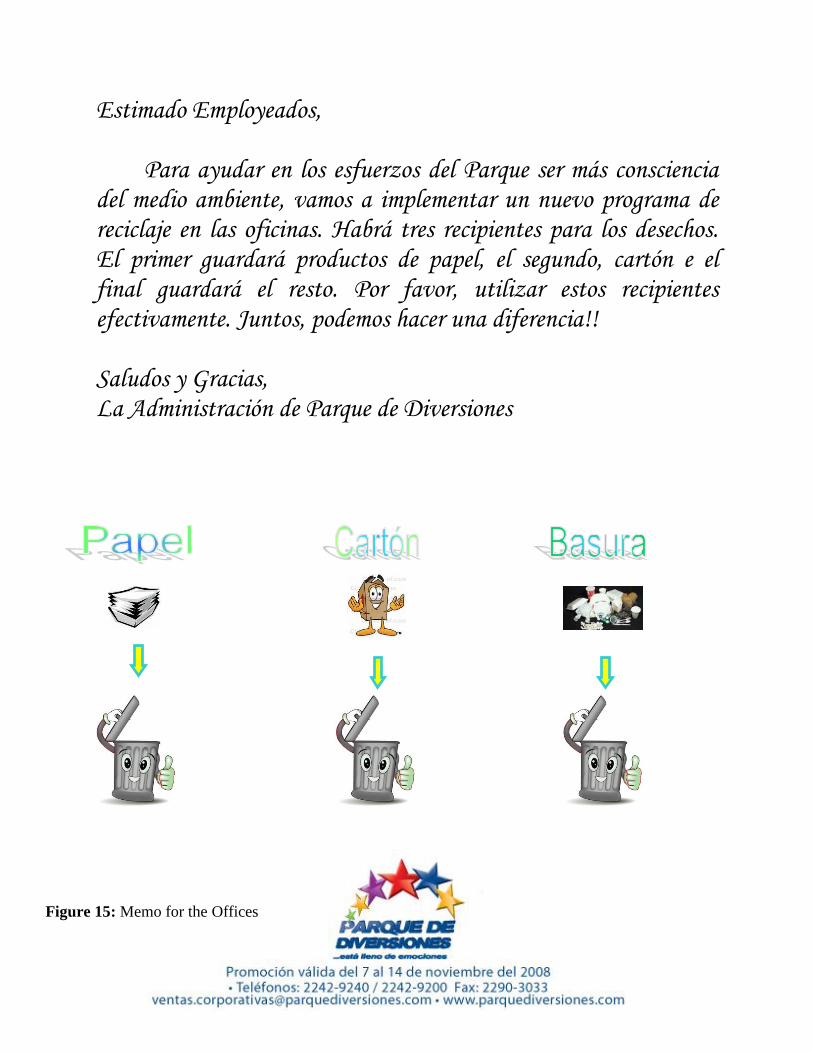
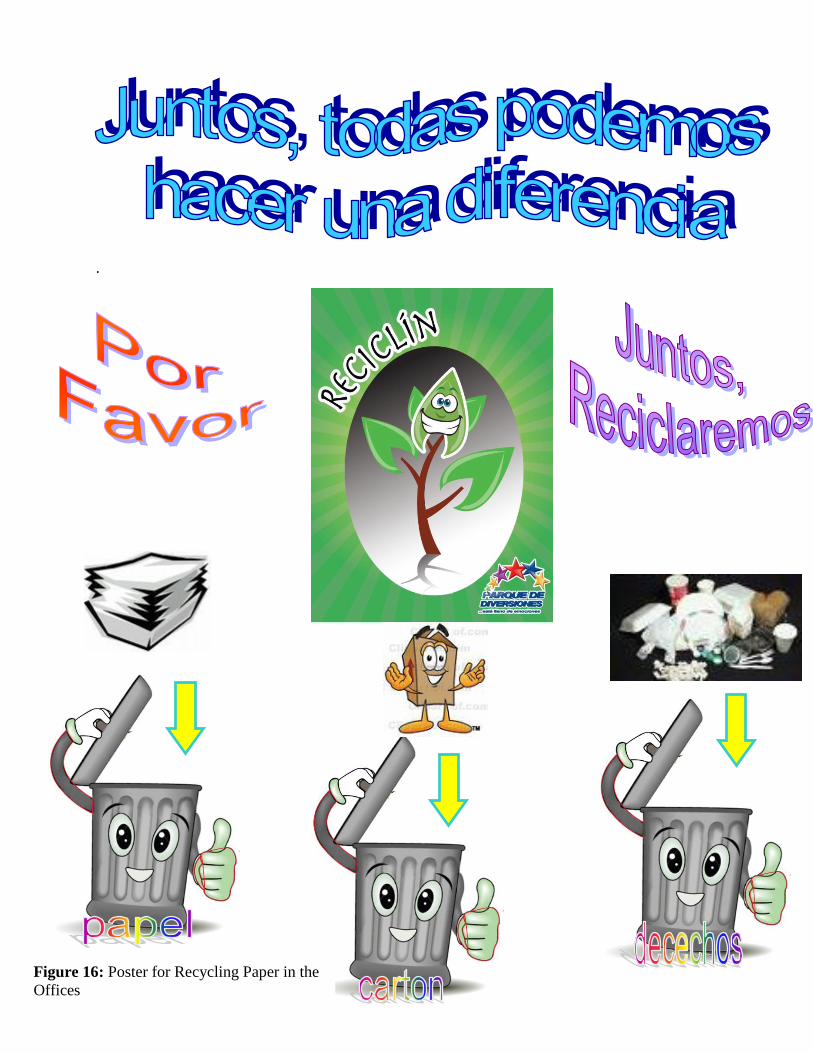
The offices in the Parque must be encouraged to recycle, as well. We recommend this be
done with three steps. First, a written a memo, replicated below, should be sent to the office that
describes how to recycle and why. Next, a poster should be shown by the recycling bins in each
office. An example we have designed is presented below in Figure 16. This exhibits the same
ideas as the memo, but addresses the different learning styles. Finally, additional bins should be
supplied to the offices for the proper disposal of paper, cardboard, and garbage.
37
Estimado Employeados,
Para ayudar en los esfuerzos del Parque ser más consciencia del medio ambiente, vamos a implementar un nuevo programa de reciclaje en las oficinas. Habrá tres recipientes para los desechos. El primer guardará productos de papel, el segundo, cartón e el final guardará el resto. Por favor, utilizar estos recipientes efectivamente. Juntos, podemos hacer una diferencia!! Saludos y Gracias, La Administración de Parque de Diversiones
Figure 15: Memo for the Offices
38
.
Figure 16: Poster for Recycling Paper in the
Offices
39
PROGRESS OF PERFORMANCE
The issue of progress is an essential aspect for increased participation at Parque de
Diversiones. For this, we recommend three phases. The first phase of monitoring progress is to
set a goal for the Parque to work towards. This would be announced as recycling a specific
percent of the recyclable waste generated. To encourage this, the second phase should be inter-
office competitions. The office that recycled the greatest percentage of recyclable waste in a
specific time frame should receive an award, such as a lunch or gift. Finally, to encourage and
inform the patron and employees of progress, the Parque should announce comparisons with
another amusement park or corporation with a similar recycling program. As with the University
of Surrey, the competition would encourage participation and ensure its continuation.
Figure 17: Progress Meter
FURTHER RESEARCH
We recommend further research be conducted to collect and manage organic waste. For
Parque de Diversiones’ twenty year plan, we recommend that a biodigester be used for a
percentage of the food waste, as well as the grass clippings and paper waste. For the remaining
food waste and animal waste, we suggest composting with worms. This could provide an
attraction near the farm for the children to enjoy. Another project, though, is required for the
research and data necessary for this biodegradable waste. This will be an important addition to a
program that is already thorough, as it will reduce waste production to such a minimal scale.
40
REFERENCES
Alfaro, J. (2008). Nuevo Proyecto Obligará A Todos A Reciclar. Teletica.Com, Retrieved
October 27, 2008, from www.teletica.Com
Barry, L. G., Hall, D. R., McLaughlin, E. J., & Tacvorian, E. K. (2007). A Proposal To Improve
Ride Efficiency And Evacuation Planning At Parque De Diversiones. (IQP. 5 July 2007:
Worcester Polytechnic Institute. (Efficiency and evacuation in a park))
Children’s Hospital of Costa Rican Foundation. Retrieved September 18, 2008, from
http://www.chcrf.org/about.htm
City Farmer (2007). Canada’s Office of Urban Agriculture. Retrieved November 21, 2008
from http://www.cityfarmer.org/wormcomp61.html
Composting, Organics Recycling and Renewable Energy. (2008). Retrieved November 11,
2008, from http://www.jgpress.com/wc08/bcwc08.pdf
Corporate Recycling Services. Consultants for Sustainable Waste Reduction. Retrieved
September 5, 2008, from http://www.corprecycling.biz/index.html
Dutschke, M. (2000). Host Country Driven Implementation – The Case of Costa Rica.
Dutschke, & A. Michaelowa (Eds.), Cheltenham, UK; Northampton, MA, USA: Edward
Elgar Publishing.
Elizondo Orozco, K., & Astorga Espeleta, Y. (2007). Diagnóstico Del Cierre Técnico Del
Relleno Sanitario De Río Azul. Universidad De Costa Rica. Retrieved October 27, 2008,
from Http://Www.Una.Ac.Cr/Redibec-Cisda/Ponencias/Retos/Katthya.Pdf
Energy Efficiency and Renewable Energy. (2008). US Department of Energy. Retrieved
November 11, 2008, from
http://apps1.eere.energy.gov/consumer/your_workplace/farms_ranches/index.cfm/mytopi
c=30003
Environmental Indicators. Municipal Waste Treatment. United States Statistics Division.
Retrieved October 1, 2008, from http://unstats.un.org/unsd/environment/wastetreatment.htm
Learning Styles. (2004). Leanna Smith. Retrieved November 10, 2008, from
http://www.spc.cc.tx.us/biology/lsmith/learning_styles.htm
LeGare, Sierad, Waugh. (2005). Preventing Pollution at the Source: Waste Management on
Dairy Farms in Costa Rica. (IQP. 5 July 2005: Worcester Polytechnic Institute.)
Ley General De Residuos, Expediente N. 15.897u.S.C. (2005). Retrieved October 27, 2008, from
Http://Www.Conare.Ac.Cr/Proyectos/15897.Htm
41
Ley Para La Gestión Integral De Residuos, Expediente No. 15897u.S.C. (2006). Retrieved
October 27, 2008, from
Http://Www.Programacyma.Com/Taller_Info/Texto_Final_Ley_Gir_Pres.Diputados_(21-
06-07)_A.Pdf
Navarro Murrilo, C. (2008). In Wilhelm S., Colleary B.(Eds.), Interview With Liaison (S.
Wilhelm Trans.).
Navarro Murrilo, C. (2008). Propuesta De Proyecto Para Worcester Polytechnic Institute
(Informative)
Nigbur, Lyons, Uzzell and Muckle. Increasing Recycling Through Community Action.
University of Surrey. 2005. Retrieved October 28, 2008, from
http://www.surrey.ac.uk/Psychology/EPRG/files/SurreyScholarSummaryreport.pdf
Overview of Learning Styles. (2007). Advanogy. Retrieved November 10, 2008, from
http://www.learning-styles-online.com/overview/
Powell, A. (2008). Costa Rican Minister Outlines Plan to Achieve Carbon Neutrality Through
Reforms. Retrieved September 15, 2008, from
http://www.news.harvard.edu/gazette/2008/05.22/11-costarica.html
Psychological Power of Positive Recycling/ J.G. Press Inc. Provided by ProQuest Information
and Learning Company. 2000. Retrieved October 28, 2008, from
http://findarticles.com/p/articles/mi_qa5378/is_200005/ai_n21457570/pg_1?tag=artBody
;col1
Psychology Used to Promote Waste Recycling. The A to Z of Materials. (2006). Retrieved
October 28, 2008, from http://www.azom.com/News.asp?NewsID=4926
Recycling And Waste Management Campaign. (2005). Retrieved September 15, 2008, from
Http://Www.Conservecostarica.Org/Programs/Recycling.Html
Recycling Guide. Retrieved September 15, 2008, from
http://www.recycling-guide.org.uk/importance.html
Recycling is Working in the United States. Office of Solid Waste and Emergency
Response. Environmental Protection Agency. 2002. Retrieved October 2, 2008, from
http://www.epa.gov/osw/conserve/rrr/rmd/rei-rw/pdf/factsheet_nat.pdf
Recycling Revolution. (2008). Closing the Loop. Retrieved September 15, 2008, from
http://www.recycling-revolution.com/recycling-facts.html
REDCICLA. (2007). Base de Datos de Resuidos Solidos de Costa Rica. Retrieved October 2,
2008, from http://www.redcicla.org/basededatos/empresas/plastico_pet.html
42
Rivera, J. (2001). Does it Pay to be Green in the Developing World? Participation in a Costa
Rican Voluntary Environmental Program and its Impact on Hotels' Competitive Advantage
Academy of Management. Retrieved October 2, 2008, from
http://search.ebscohost.com/login.aspx?direct=true&db=buh&AN=6133796&site=ehost-
live
Rural Costa Rica (n.d). Biogas: Alternative Energy at Work. Biogas in Rural Costa Rica with the
Santa Fe Womens Group. Retrieved December 7, 2008, from
http://www.ruralcostarica.com/biogas.html.
Steinberg, P. F. (2003). Understanding Policy Change in Developing Countries: the Spheres of
Influence Framework . Global Environmental Politics, 3.1(11-32) doi:2003
Waste Management. (2008) Elsevier. Retrieved November 10, 2008, from
http://www.elsevier.com/wps/find/journaldescription.cws_home/404/description#description
Wastes, Resource Conservation, Common Waste and Materials, Organic Materials. (2008).
United States Environmental Protection Agency. Retrieved November 13, 2008, from
http://www.epa.gov/osw/conserve/materials/organics/index.htm
Wellington, Megan. (2006). The Status of Recycling in Philadelphia: Analysis and
Recommendations for Philadelphia’s Floundering Recycling Program. Retrieved
October 28, 2008, from
http://repository.upenn.edu/cgi/viewcontent.cgi?article=1000&context=mes_capstones
Yellow Stone National Park Recycling Program. (2007). Recycle on the Go Success Story.
United States Environmental Protection Agency. Retrieved September 13, 2008, from
http://epa.gov/osw/conserve/rrr/rogo/documents/yellowstone.pdf
Zenteno, S. B., & Mora, E. (2005). Creación de un sistema de gestión para los desechos sólidos
generados en el parque de diversiones. Universidad Nacional: Universidad Nacional.
43
APPENDIX A: Sponsor Description
Our Appendix A is taken largely from “Increasing Ride Efficiency and Evacuation
Planning in Parque de Diversiones,” which was completed by Laura Barry, Derek Hall, Elizabeth
McLaughlin and Edward Tacvorian under Professors Lorraine Higgins and Tahar El-Korchi in
Costa Rica in E-term 2007.
Parque de Diversiones is a non-profit amusement park outside of San José in La Uruca,
Costa Rica. Built to raise funds for the Hospital de Niños, its construction was complete
December 18, 1981. The idea to create an amusement park to generate profits for the hospital
was developed by the Children’s Hospital Costa Rica Foundation, or the CHCRF. Today, the
CHCRF is still responsible for maintaining and improving the park, always with the main goal of
earning more profits to be donated to the hospital (CHCRF, 2007). Also, profits from Parque de
Diversiones pay for all administrative costs of the CHCRF, allowing one-hundred percent of
donations to the organization to go directly to the Hospital de Niños (CHCRF, 2007).
The CHCRF has two methods to generate funds for the Hospital de Niños: acquire
donations from private organizations and corporations, and raise funds via Parque de
Diversiones. However, the park believes that it could increase profits by $200,000 if they could
increase overall ride efficiency. Currently, Parque de Diversiones earns $250,000 - $300,000;
between twenty-five to thirty-five percent goes to the Hospital de Niños, with the remainder
applied to maintenance, improving the park, and paying the 350 employees.
The park expressed a desire to implement a new, fully developed, recycling program,
thereby allowing them to generate a profit increase to contribute to the Hospital de Niños. Also,
the park wanted to have an education program attached to teach the patrons and employees about
proper recycling.
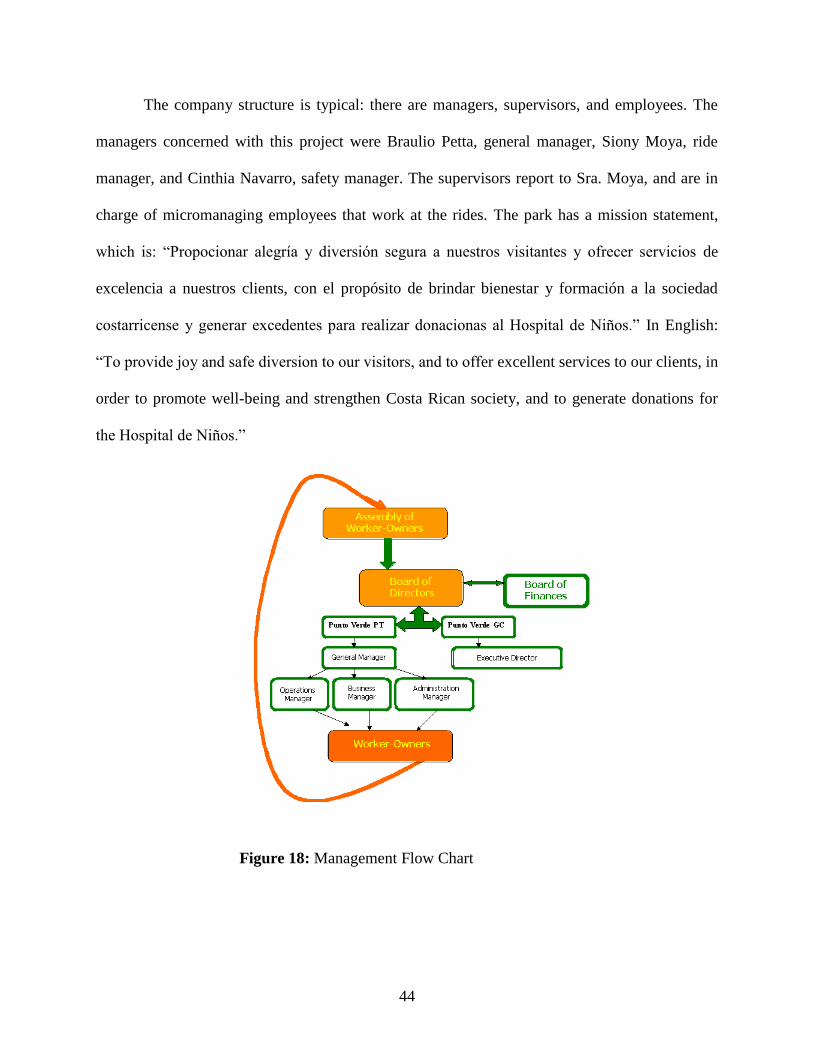
44
The company structure is typical: there are managers, supervisors, and employees. The
managers concerned with this project were Braulio Petta, general manager, Siony Moya, ride
manager, and Cinthia Navarro, safety manager. The supervisors report to Sra. Moya, and are in
charge of micromanaging employees that work at the rides. The park has a mission statement,
which is: “Propocionar alegría y diversión segura a nuestros visitantes y ofrecer servicios de
excelencia a nuestros clients, con el propósito de brindar bienestar y formación a la sociedad
costarricense y generar excedentes para realizar donacionas al Hospital de Niños.” In English:
“To provide joy and safe diversion to our visitors, and to offer excellent services to our clients, in
order to promote well-being and strengthen Costa Rican society, and to generate donations for
the Hospital de Niños.”
Figure 18: Management Flow Chart
45
APPENDIX B: PARQUE WASTE FIGURES
C. Navarro (personal communication, September 16, 2008) informed us that Parque De
Diversiones has shown a huge increase in waste collection, up 46 percent in just two years. Much
of what is collected is recyclable, approximately 13,000 kilograms (kg). While Parque de
Diversiones does have a small recycling program, it is inadequate. Navarro (2008) presents the
facts that in 2007, the park generated between 2,420 to 6,049 kg of recyclable materials per
month, of which, only glass, paper, and cardboard are recycled. Over the course of five months
3,510 kg, approximately 14 percent of waste generated, was recycled. They also generated
between 550 and 1,055 kg of biodegradable waste per month. Because the park does not have a
biodegradable waste management system, all of this waste is sent to landfills and was not
managed in a sustainable way.
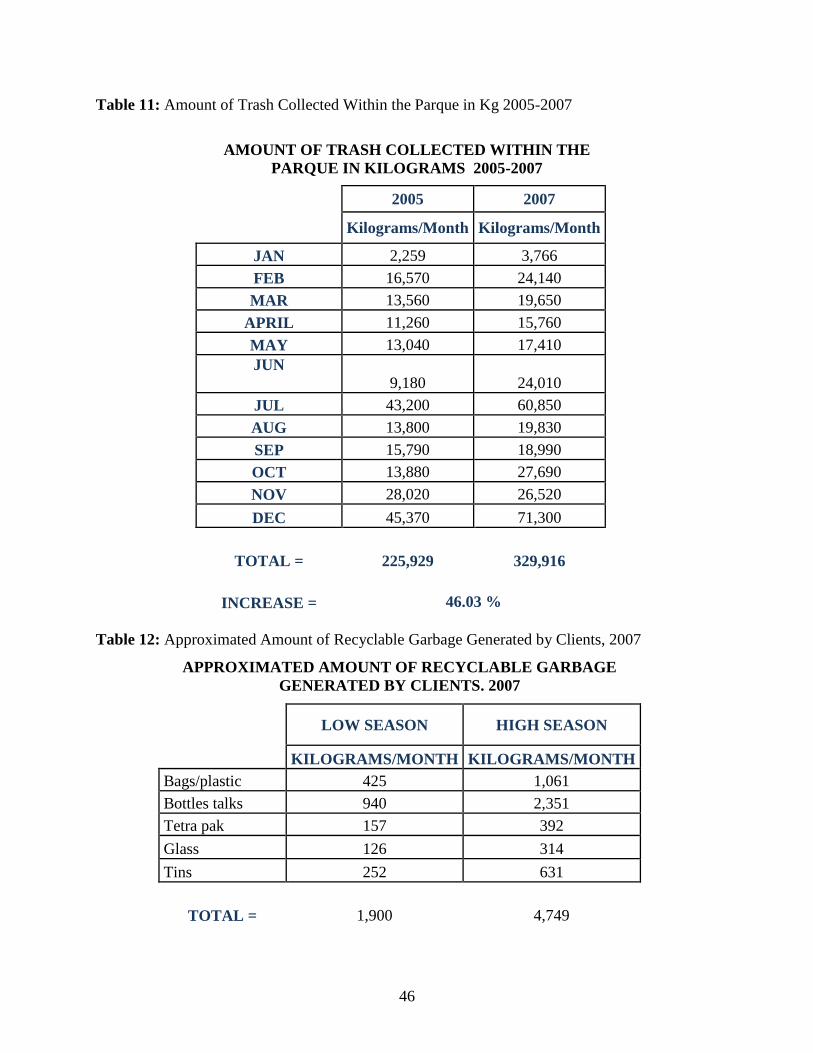
46
Table 11: Amount of Trash Collected Within the Parque in Kg 2005-2007
AMOUNT OF TRASH COLLECTED WITHIN THE
PARQUE IN KILOGRAMS 2005-2007
2005 2007
Kilograms/Month Kilograms/Month
JAN 2,259 3,766
FEB 16,570 24,140
MAR 13,560 19,650
APRIL 11,260 15,760
MAY 13,040 17,410
JUN
9,180 24,010
JUL 43,200 60,850
AUG 13,800 19,830
SEP 15,790 18,990
OCT 13,880 27,690
NOV 28,020 26,520
DEC 45,370 71,300
TOTAL = 225,929 329,916
INCREASE = 46.03 %
Table 12: Approximated Amount of Recyclable Garbage Generated by Clients, 2007
APPROXIMATED AMOUNT OF RECYCLABLE GARBAGE
GENERATED BY CLIENTS. 2007
LOW SEASON HIGH SEASON
KILOGRAMS/MONTH KILOGRAMS/MONTH
Bags/plastic 425 1,061
Bottles talks 940 2,351
Tetra pak 157 392
Glass 126 314
Tins 252 631
TOTAL = 1,900 4,749
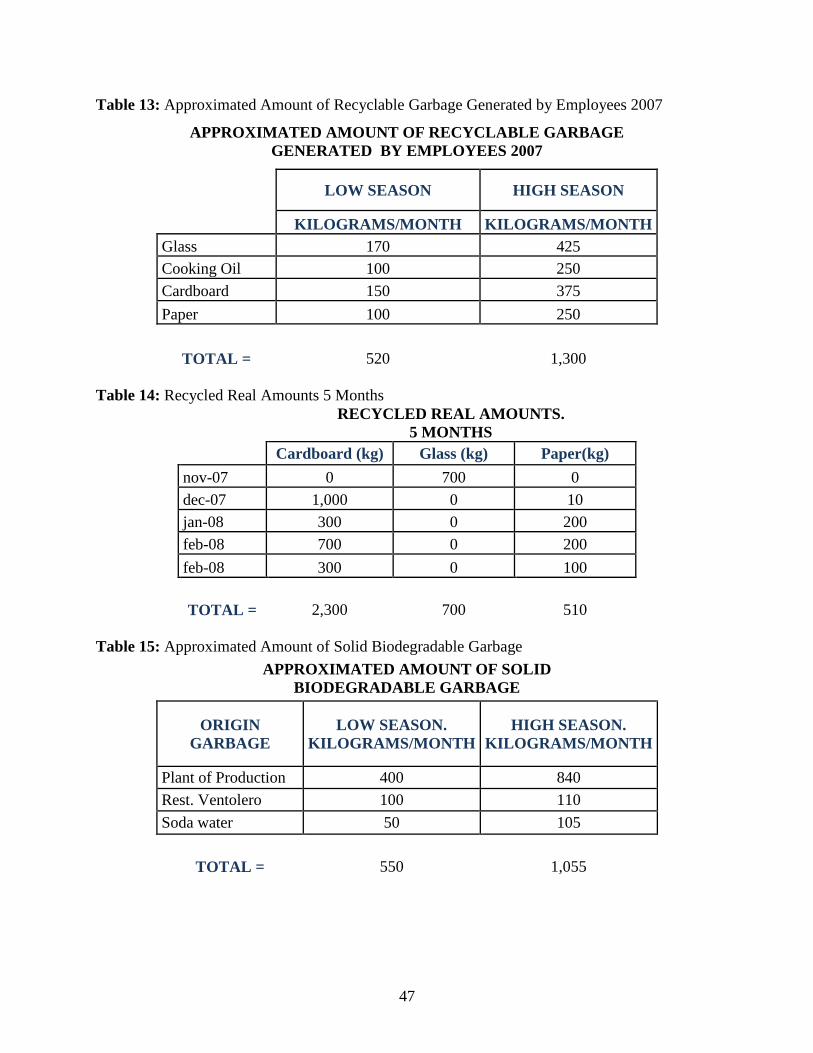
47
Table 13: Approximated Amount of Recyclable Garbage Generated by Employees 2007
APPROXIMATED AMOUNT OF RECYCLABLE GARBAGE
GENERATED BY EMPLOYEES 2007
LOW SEASON HIGH SEASON
KILOGRAMS/MONTH KILOGRAMS/MONTH
Glass 170 425
Cooking Oil 100 250
Cardboard 150 375
Paper 100 250
TOTAL = 520 1,300
Table 14: Recycled Real Amounts 5 Months
RECYCLED REAL AMOUNTS.
5 MONTHS
Cardboard (kg) Glass (kg) Paper(kg)
nov-07 0 700 0
dec-07 1,000 0 10
jan-08 300 0 200
feb-08 700 0 200
feb-08 300 0 100
TOTAL = 2,300 700 510
Table 15: Approximated Amount of Solid Biodegradable Garbage
APPROXIMATED AMOUNT OF SOLID
BIODEGRADABLE GARBAGE
ORIGIN
GARBAGE
LOW SEASON.
KILOGRAMS/MONTH
HIGH SEASON.
KILOGRAMS/MONTH
Plant of Production 400 840
Rest. Ventolero 100 110
Soda water 50 105
TOTAL = 550 1,055
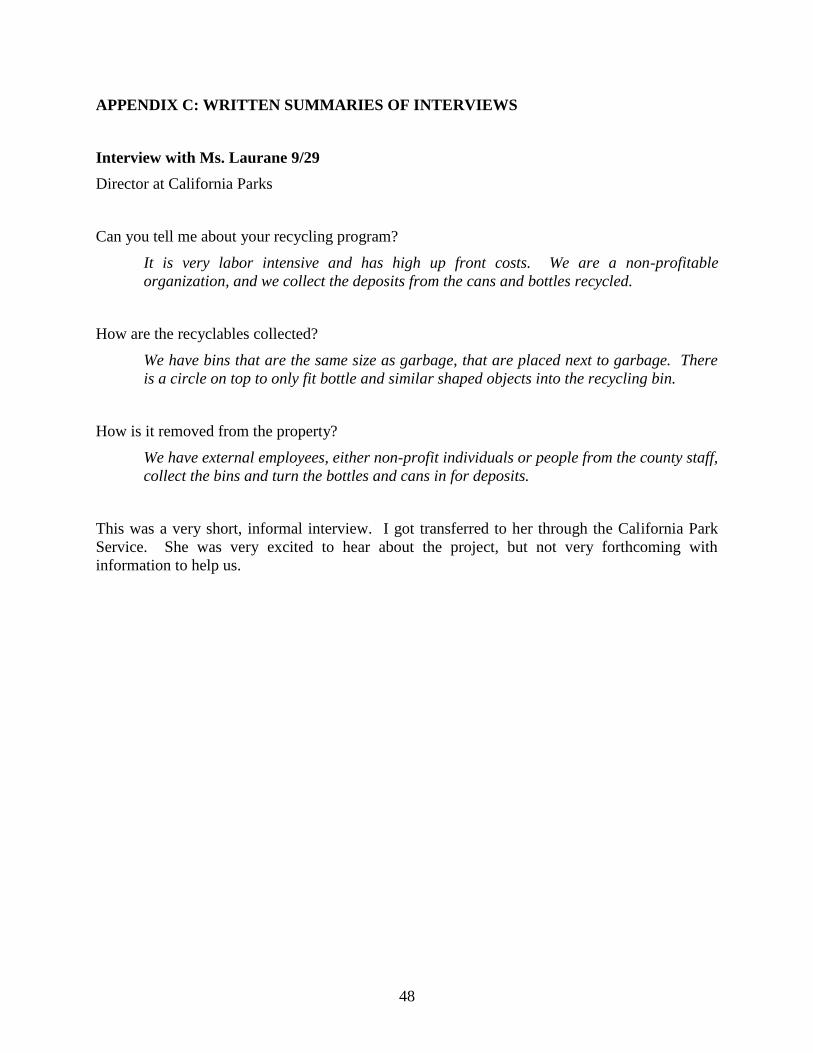
48
APPENDIX C: WRITTEN SUMMARIES OF INTERVIEWS
Interview with Ms. Laurane 9/29
Director at California Parks
Can you tell me about your recycling program?
It is very labor intensive and has high up front costs. We are a non-profitable
organization, and we collect the deposits from the cans and bottles recycled.
How are the recyclables collected?
We have bins that are the same size as garbage, that are placed next to garbage. There
is a circle on top to only fit bottle and similar shaped objects into the recycling bin.
How is it removed from the property?
We have external employees, either non-profit individuals or people from the county staff,
collect the bins and turn the bottles and cans in for deposits.
This was a very short, informal interview. I got transferred to her through the California Park
Service. She was very excited to hear about the project, but not very forthcoming with
information to help us.
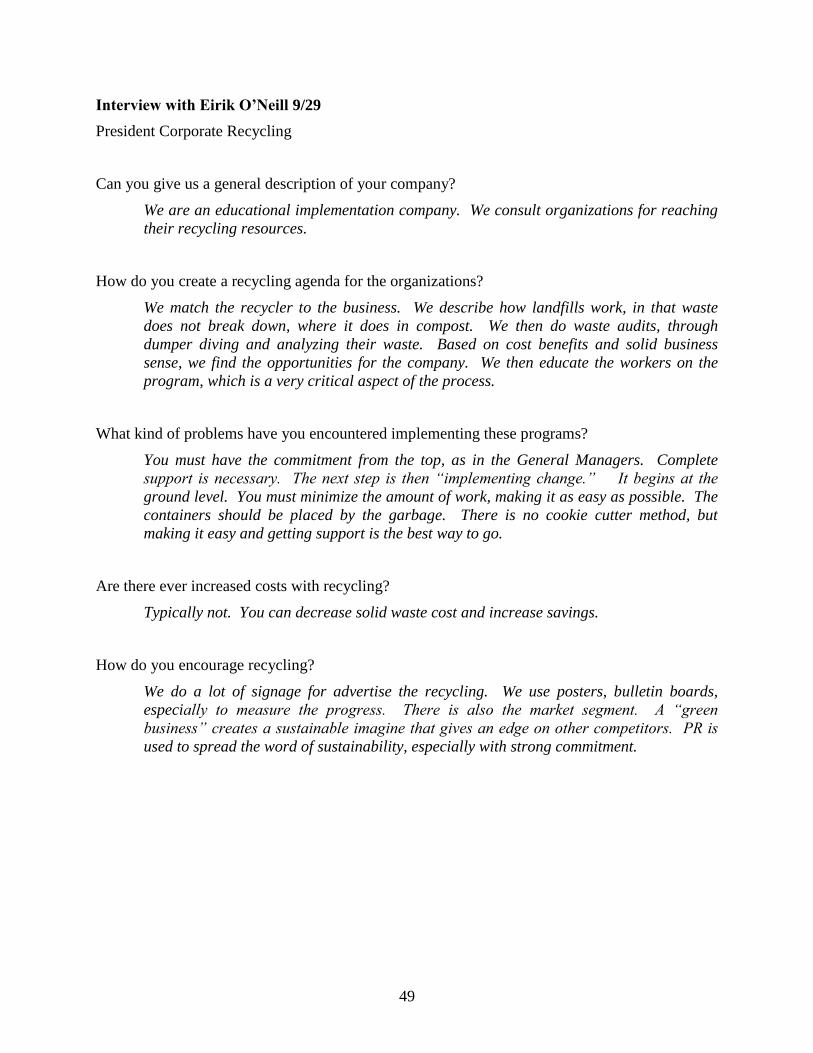
49
Interview with Eirik O’Neill 9/29
President Corporate Recycling
Can you give us a general description of your company?
We are an educational implementation company. We consult organizations for reaching
their recycling resources.
How do you create a recycling agenda for the organizations?
We match the recycler to the business. We describe how landfills work, in that waste
does not break down, where it does in compost. We then do waste audits, through
dumper diving and analyzing their waste. Based on cost benefits and solid business
sense, we find the opportunities for the company. We then educate the workers on the
program, which is a very critical aspect of the process.
What kind of problems have you encountered implementing these programs?
You must have the commitment from the top, as in the General Managers. Complete
support is necessary. The next step is then “implementing change.” It begins at the
ground level. You must minimize the amount of work, making it as easy as possible. The
containers should be placed by the garbage. There is no cookie cutter method, but
making it easy and getting support is the best way to go.
Are there ever increased costs with recycling?
Typically not. You can decrease solid waste cost and increase savings.
How do you encourage recycling?
We do a lot of signage for advertise the recycling. We use posters, bulletin boards,
especially to measure the progress. There is also the market segment. A “green
business” creates a sustainable imagine that gives an edge on other competitors. PR is
used to spread the word of sustainability, especially with strong commitment.
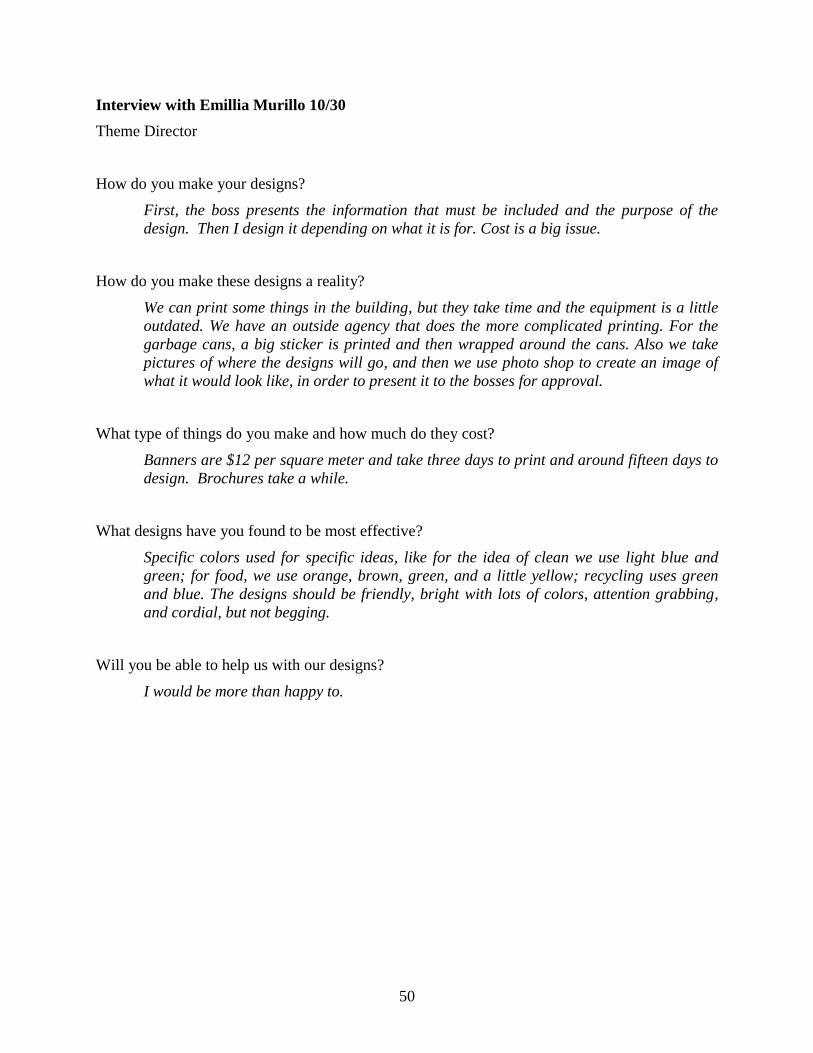
50
Interview with Emillia Murillo 10/30
Theme Director
How do you make your designs?
First, the boss presents the information that must be included and the purpose of the
design. Then I design it depending on what it is for. Cost is a big issue.
How do you make these designs a reality?
We can print some things in the building, but they take time and the equipment is a little
outdated. We have an outside agency that does the more complicated printing. For the
garbage cans, a big sticker is printed and then wrapped around the cans. Also we take
pictures of where the designs will go, and then we use photo shop to create an image of
what it would look like, in order to present it to the bosses for approval.
What type of things do you make and how much do they cost?
Banners are $12 per square meter and take three days to print and around fifteen days to
design. Brochures take a while.
What designs have you found to be most effective?
Specific colors used for specific ideas, like for the idea of clean we use light blue and
green; for food, we use orange, brown, green, and a little yellow; recycling uses green
and blue. The designs should be friendly, bright with lots of colors, attention grabbing,
and cordial, but not begging.
Will you be able to help us with our designs?
I would be more than happy to.
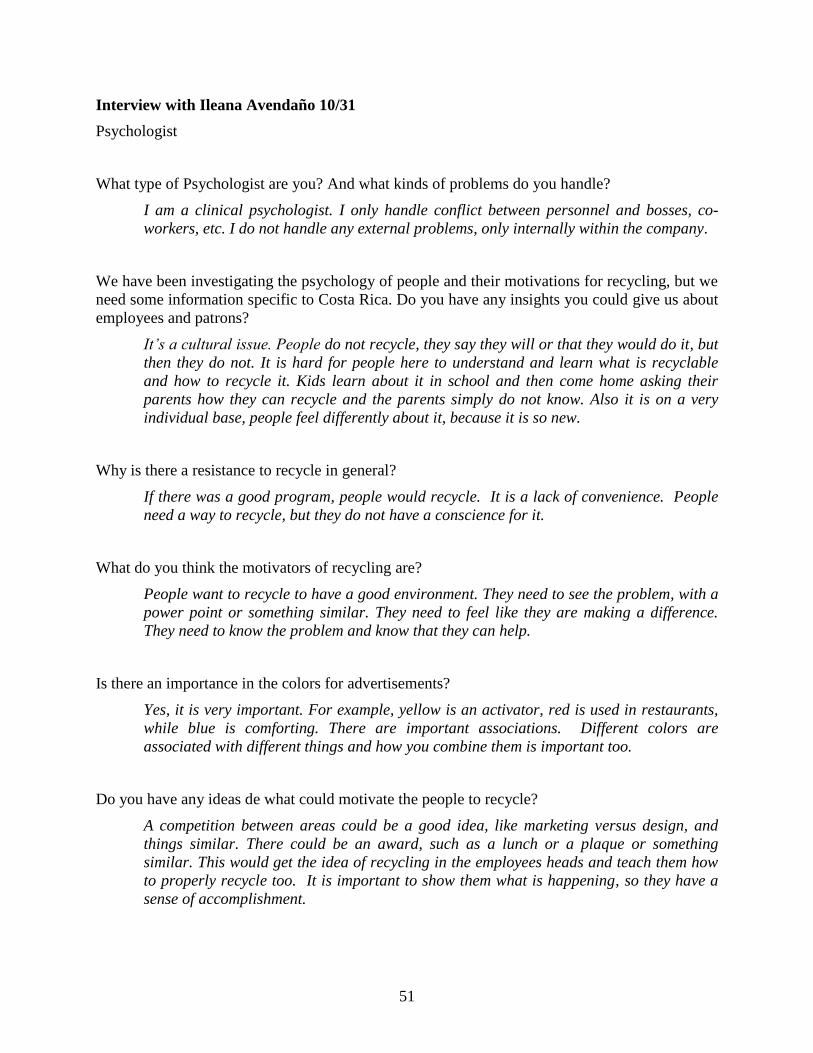
51
Interview with Ileana Avendaño 10/31
Psychologist
What type of Psychologist are you? And what kinds of problems do you handle?
I am a clinical psychologist. I only handle conflict between personnel and bosses, co-
workers, etc. I do not handle any external problems, only internally within the company.
We have been investigating the psychology of people and their motivations for recycling, but we
need some information specific to Costa Rica. Do you have any insights you could give us about
employees and patrons?
It’s a cultural issue. People do not recycle, they say they will or that they would do it, but
then they do not. It is hard for people here to understand and learn what is recyclable
and how to recycle it. Kids learn about it in school and then come home asking their
parents how they can recycle and the parents simply do not know. Also it is on a very
individual base, people feel differently about it, because it is so new.
Why is there a resistance to recycle in general?
If there was a good program, people would recycle. It is a lack of convenience. People
need a way to recycle, but they do not have a conscience for it.
What do you think the motivators of recycling are?
People want to recycle to have a good environment. They need to see the problem, with a
power point or something similar. They need to feel like they are making a difference.
They need to know the problem and know that they can help.
Is there an importance in the colors for advertisements?
Yes, it is very important. For example, yellow is an activator, red is used in restaurants,
while blue is comforting. There are important associations. Different colors are
associated with different things and how you combine them is important too.
Do you have any ideas de what could motivate the people to recycle?
A competition between areas could be a good idea, like marketing versus design, and
things similar. There could be an award, such as a lunch or a plaque or something
similar. This would get the idea of recycling in the employees heads and teach them how
to properly recycle too. It is important to show them what is happening, so they have a
sense of accomplishment.

52
What importance does the age of the people have?
It is extremely important. Children are easier to motivate to do things. Teenagers need to
feel like the problem is important to them. They also need to know that the rest of the
world is doing it and they have to see the problem and how recycling can help them.
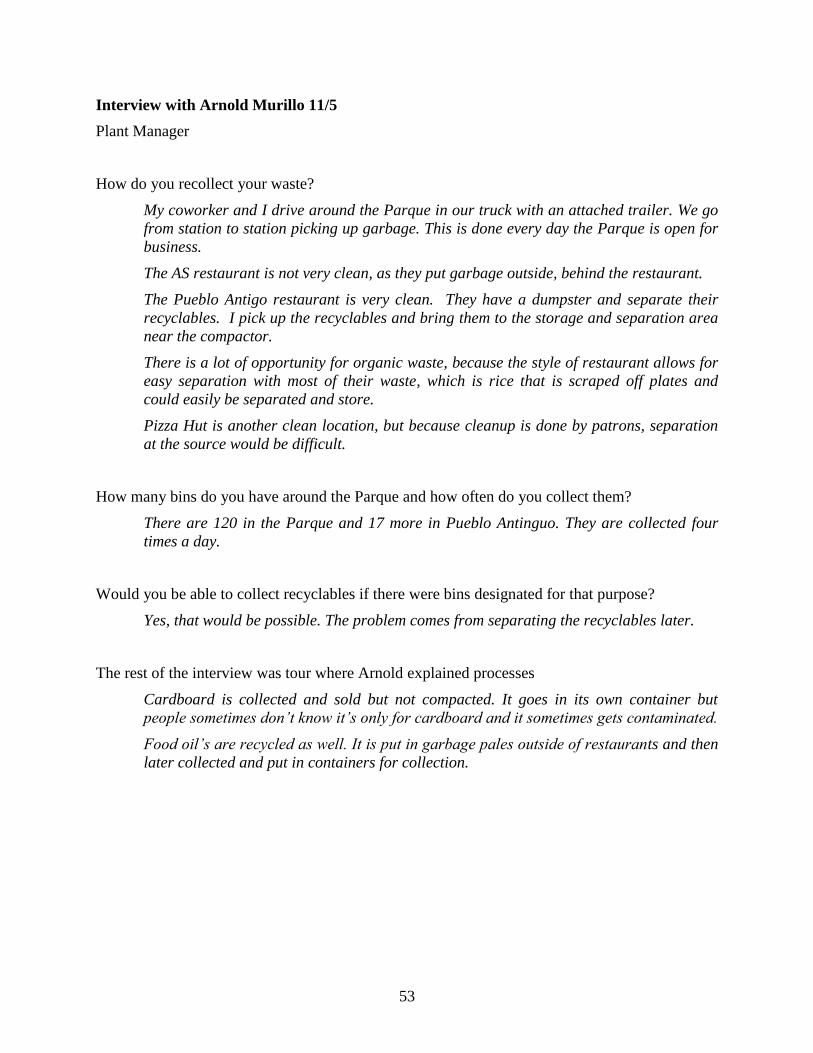
53
Interview with Arnold Murillo 11/5
Plant Manager
How do you recollect your waste?
My coworker and I drive around the Parque in our truck with an attached trailer. We go
from station to station picking up garbage. This is done every day the Parque is open for
business.
The AS restaurant is not very clean, as they put garbage outside, behind the restaurant.
The Pueblo Antigo restaurant is very clean. They have a dumpster and separate their
recyclables. I pick up the recyclables and bring them to the storage and separation area
near the compactor.
There is a lot of opportunity for organic waste, because the style of restaurant allows for
easy separation with most of their waste, which is rice that is scraped off plates and
could easily be separated and store.
Pizza Hut is another clean location, but because cleanup is done by patrons, separation
at the source would be difficult.
How many bins do you have around the Parque and how often do you collect them?
There are 120 in the Parque and 17 more in Pueblo Antinguo. They are collected four
times a day.
Would you be able to collect recyclables if there were bins designated for that purpose?
Yes, that would be possible. The problem comes from separating the recyclables later.
The rest of the interview was tour where Arnold explained processes
Cardboard is collected and sold but not compacted. It goes in its own container but
people sometimes don’t know it’s only for cardboard and it sometimes gets contaminated.
Food oil’s are recycled as well. It is put in garbage pales outside of restaurants and then
later collected and put in containers for collection.
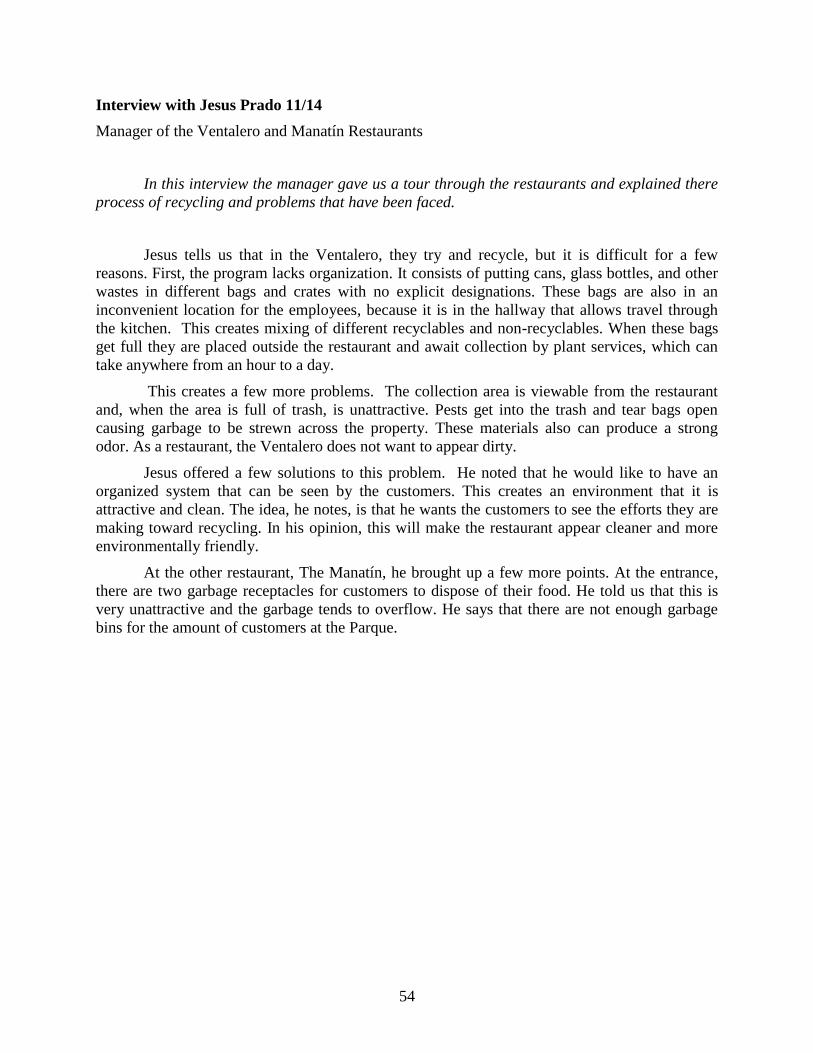
54
Interview with Jesus Prado 11/14
Manager of the Ventalero and Manatín Restaurants
In this interview the manager gave us a tour through the restaurants and explained there
process of recycling and problems that have been faced.
Jesus tells us that in the Ventalero, they try and recycle, but it is difficult for a few
reasons. First, the program lacks organization. It consists of putting cans, glass bottles, and other
wastes in different bags and crates with no explicit designations. These bags are also in an
inconvenient location for the employees, because it is in the hallway that allows travel through
the kitchen. This creates mixing of different recyclables and non-recyclables. When these bags
get full they are placed outside the restaurant and await collection by plant services, which can
take anywhere from an hour to a day.
This creates a few more problems. The collection area is viewable from the restaurant
and, when the area is full of trash, is unattractive. Pests get into the trash and tear bags open
causing garbage to be strewn across the property. These materials also can produce a strong
odor. As a restaurant, the Ventalero does not want to appear dirty.
Jesus offered a few solutions to this problem. He noted that he would like to have an
organized system that can be seen by the customers. This creates an environment that it is
attractive and clean. The idea, he notes, is that he wants the customers to see the efforts they are
making toward recycling. In his opinion, this will make the restaurant appear cleaner and more
environmentally friendly.
At the other restaurant, The Manatín, he brought up a few more points. At the entrance,
there are two garbage receptacles for customers to dispose of their food. He told us that this is
very unattractive and the garbage tends to overflow. He says that there are not enough garbage
bins for the amount of customers at the Parque.
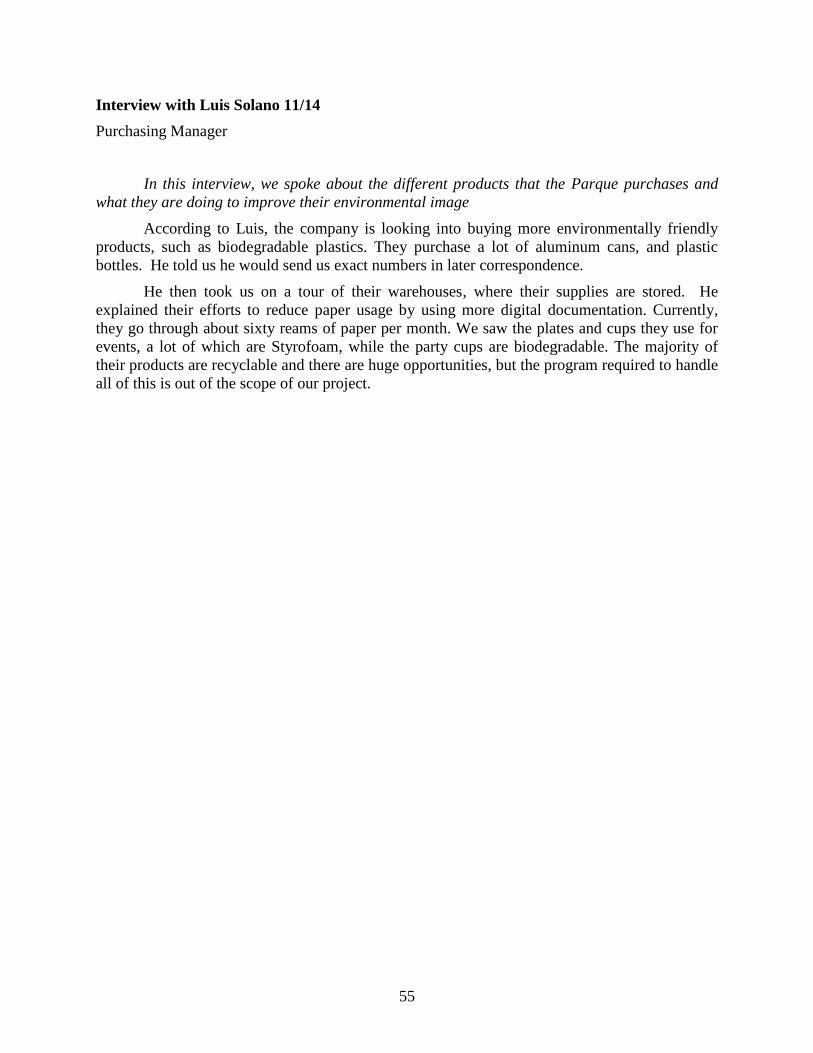
55
Interview with Luis Solano 11/14
Purchasing Manager
In this interview, we spoke about the different products that the Parque purchases and
what they are doing to improve their environmental image
According to Luis, the company is looking into buying more environmentally friendly
products, such as biodegradable plastics. They purchase a lot of aluminum cans, and plastic
bottles. He told us he would send us exact numbers in later correspondence.
He then took us on a tour of their warehouses, where their supplies are stored. He
explained their efforts to reduce paper usage by using more digital documentation. Currently,
they go through about sixty reams of paper per month. We saw the plates and cups they use for
events, a lot of which are Styrofoam, while the party cups are biodegradable. The majority of
their products are recyclable and there are huge opportunities, but the program required to handle
all of this is out of the scope of our project.
56
Interview with Don Rodolfo Lee 11/21
Human Resource Manager
This was an interview meeting with Mr. Lee, Cinthia, Arnold Murillo and ourselves.
In this interview, Mr. Lee informed us that the Parque is undergoing a twenty year
transformation plan. The current plan for recycling stopped this year due to the addition of this
twenty year plan. The goal is to reorganize the Parque’s attractions by age. The first initiative in
this is to ensure proper recycling. This involves having a large enough area to collect and sort
the increased amounts of recyclables and waste. Within one year, they intend to have recycling
and the service areas moved to the new location.
We also discussed the specifics of our project. Cinthia said that 40 percent of the patrons bring
in their own meals. This includes cans, bottles, glass, food, etc. An education plan is very
important, therefore, to ensure that the waste is properly disposed of. The educational aspect
should trigger the children, in particular. This may involve using the schools to encourage
recycling procedures.
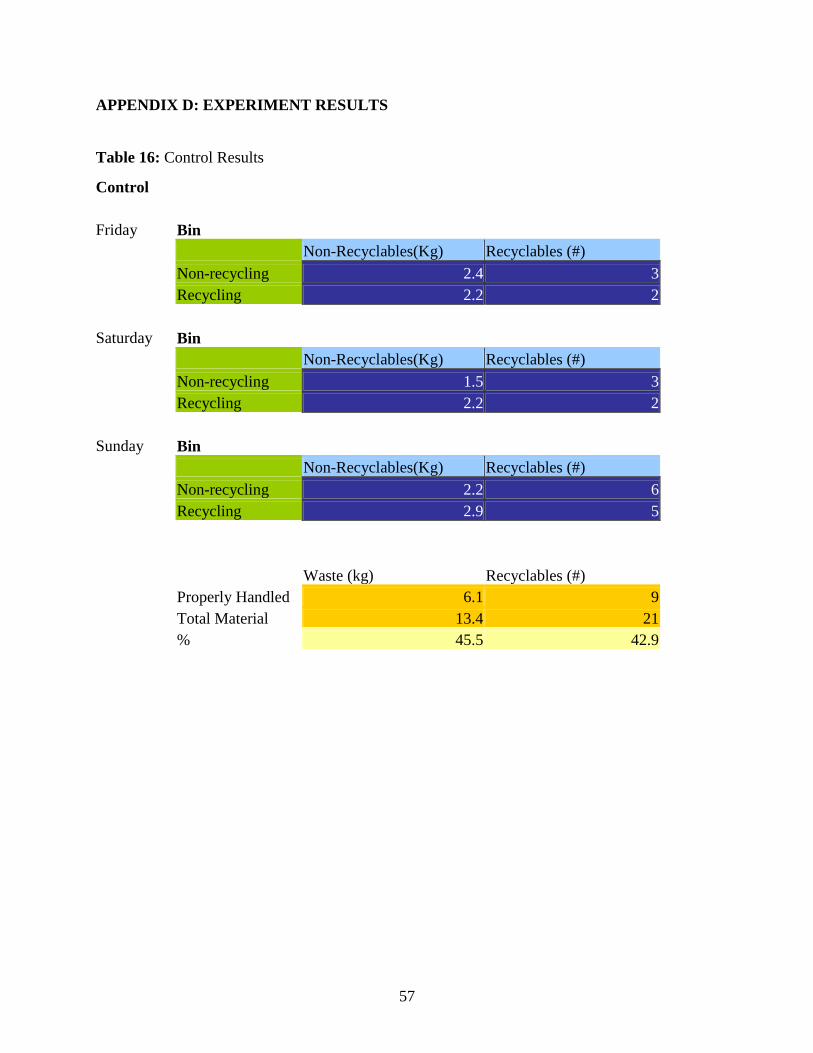
57
APPENDIX D: EXPERIMENT RESULTS
Table 16: Control Results
Control
Friday Bin
Non-Recyclables(Kg) Recyclables (#)
Non-recycling 2.4 3
Recycling 2.2 2
Saturday Bin
Non-Recyclables(Kg) Recyclables (#)
Non-recycling 1.5 3
Recycling 2.2 2
Sunday Bin
Non-Recyclables(Kg) Recyclables (#)
Non-recycling 2.2 6
Recycling 2.9 5
Waste (kg) Recyclables (#)
Properly Handled 6.1 9
Total Material 13.4 21
% 45.5 42.9
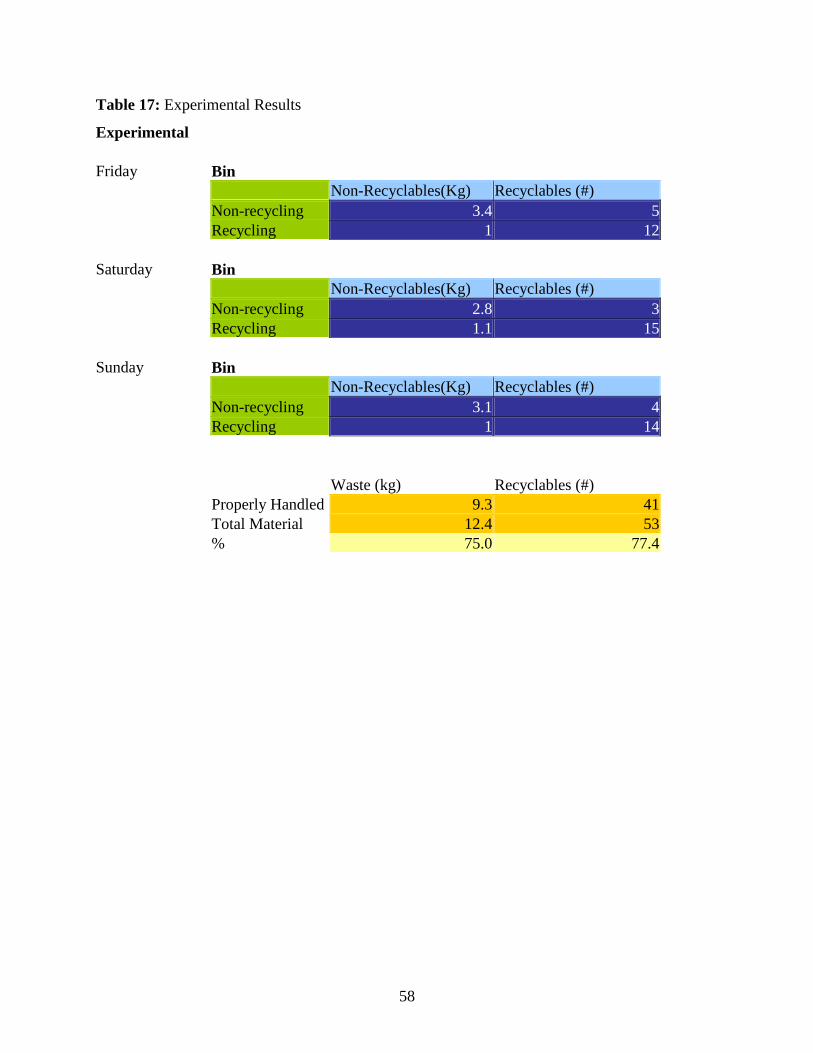
58
Table 17: Experimental Results
Experimental
Friday Bin
Non-Recyclables(Kg) Recyclables (#)
Non-recycling 3.4 5
Recycling 1 12
Saturday Bin
Non-Recyclables(Kg) Recyclables (#)
Non-recycling 2.8 3
Recycling 1.1 15
Sunday Bin
Non-Recyclables(Kg) Recyclables (#)
Non-recycling 3.1 4
Recycling 1 14
Waste (kg) Recyclables (#)
Properly Handled 9.3 41
Total Material 12.4 53
% 75.0 77.4
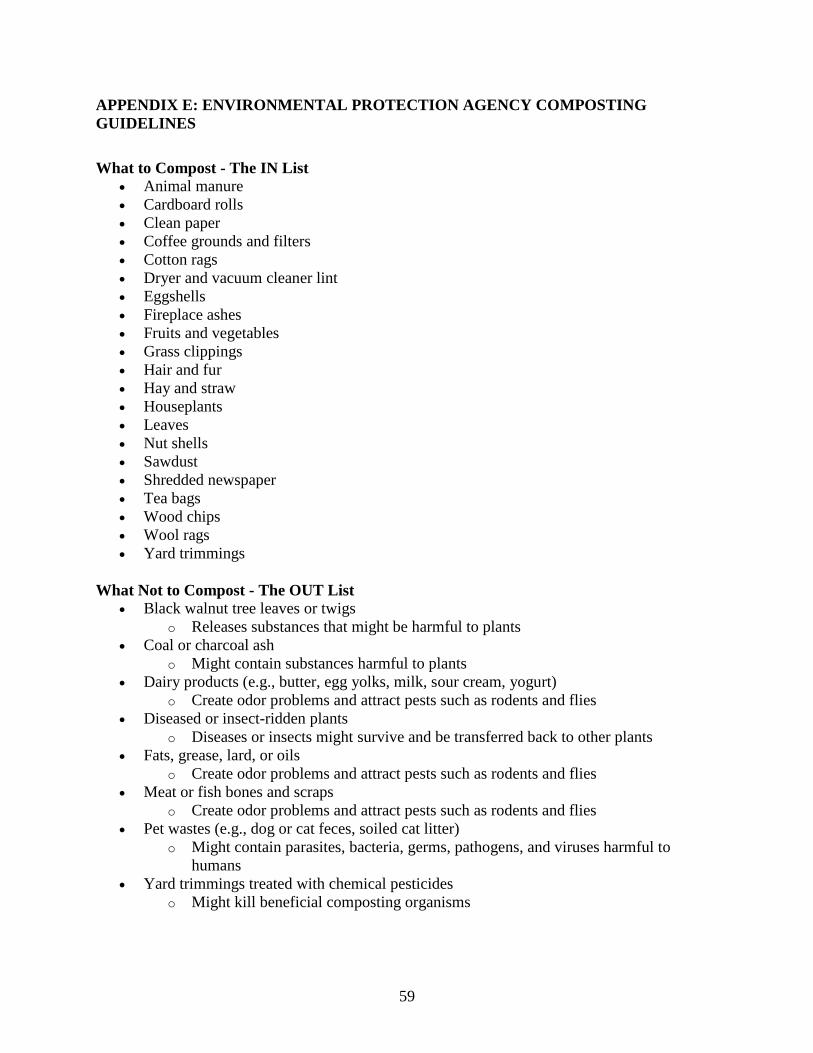
59
APPENDIX E: ENVIRONMENTAL PROTECTION AGENCY COMPOSTING
GUIDELINES
What to Compost - The IN List
Animal manure
Cardboard rolls
Clean paper
Coffee grounds and filters
Cotton rags
Dryer and vacuum cleaner lint
Eggshells
Fireplace ashes
Fruits and vegetables
Grass clippings
Hair and fur
Hay and straw
Houseplants
Leaves
Nut shells
Sawdust
Shredded newspaper
Tea bags
Wood chips
Wool rags
Yard trimmings
What Not to Compost - The OUT List
Black walnut tree leaves or twigs
o Releases substances that might be harmful to plants
Coal or charcoal ash
o Might contain substances harmful to plants
Dairy products (e.g., butter, egg yolks, milk, sour cream, yogurt)
o Create odor problems and attract pests such as rodents and flies
Diseased or insect-ridden plants
o Diseases or insects might survive and be transferred back to other plants
Fats, grease, lard, or oils
o Create odor problems and attract pests such as rodents and flies
Meat or fish bones and scraps
o Create odor problems and attract pests such as rodents and flies
Pet wastes (e.g., dog or cat feces, soiled cat litter)
o Might contain parasites, bacteria, germs, pathogens, and viruses harmful to
humans
Yard trimmings treated with chemical pesticides
o Might kill beneficial composting organisms
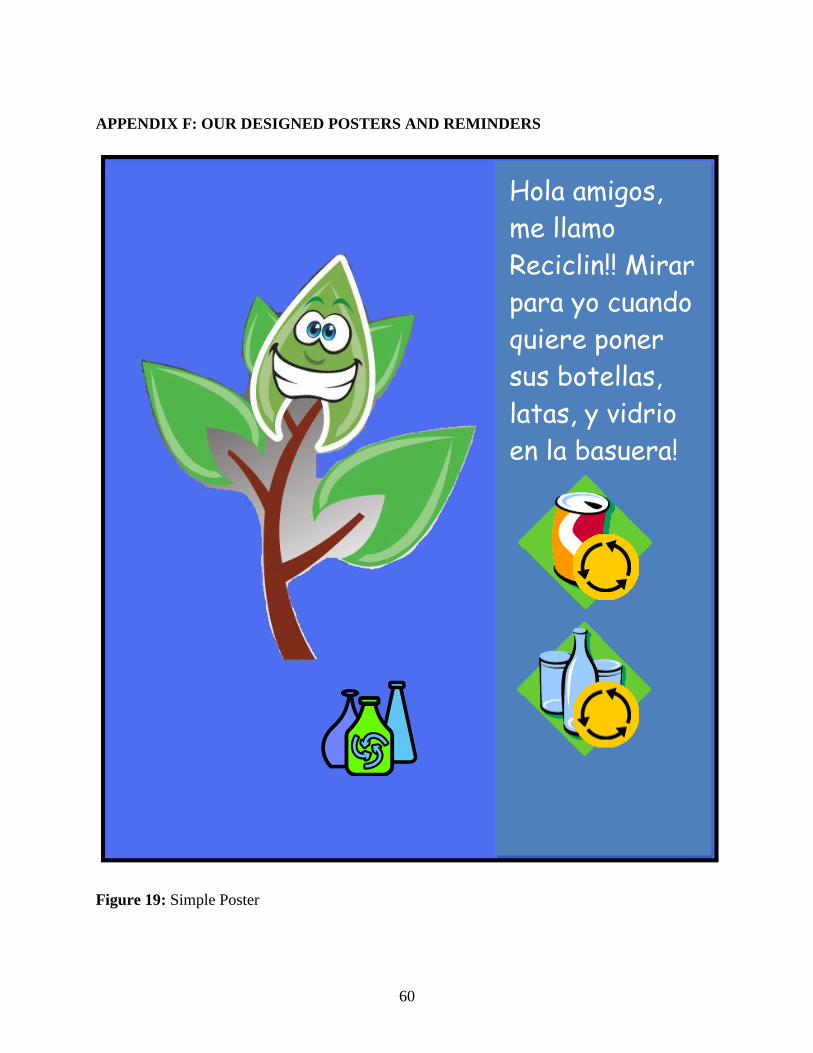
60
APPENDIX F: OUR DESIGNED POSTERS AND REMINDERS
Figure 19: Simple Poster
Hola amigos,
me llamo
Reciclin!! Mirar
para yo cuando
quiere poner
sus botellas,
latas, y vidrio
en la basuera!
61
Figure 20: Simple Reminder
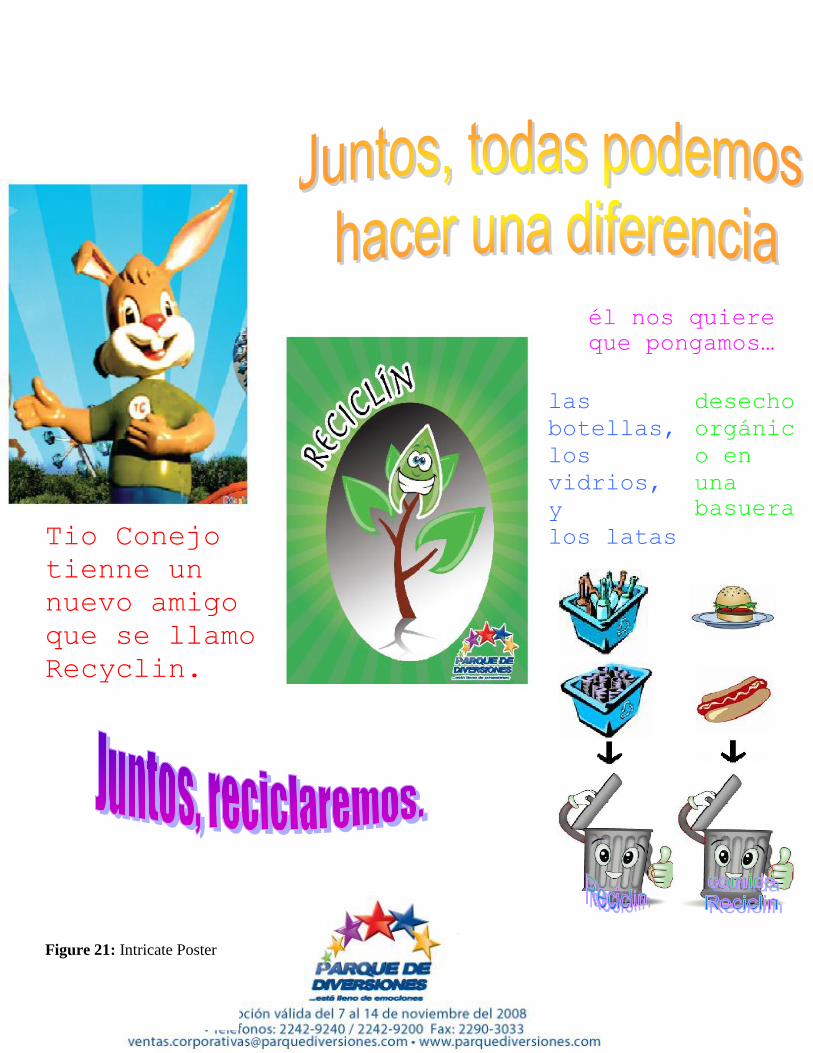
62
Tio Conejo
tienne un
nuevo amigo
que se llamo
Recyclin.
las
botellas,
los
vidrios,
y
los latas
en una
basuera
desecho
orgánic
o en
una
basuera
él nos quiere
que pongamos…
Figure 21: Intricate Poster
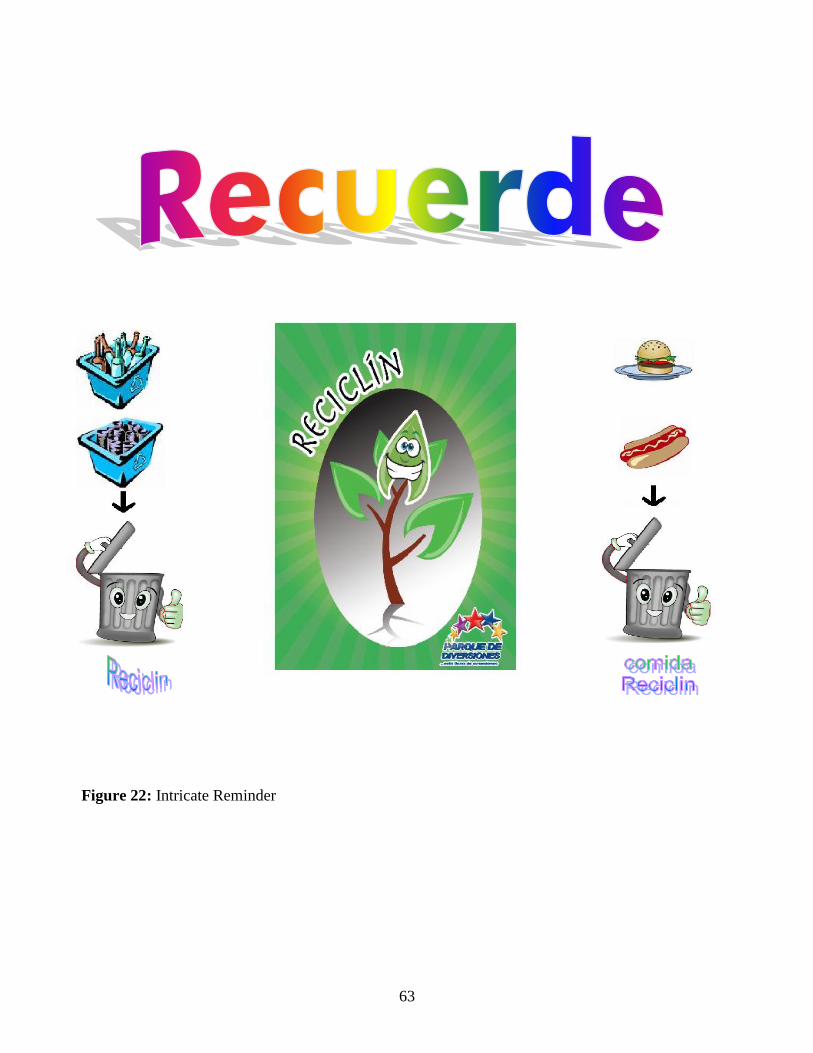
63
Figure 22: Intricate Reminder
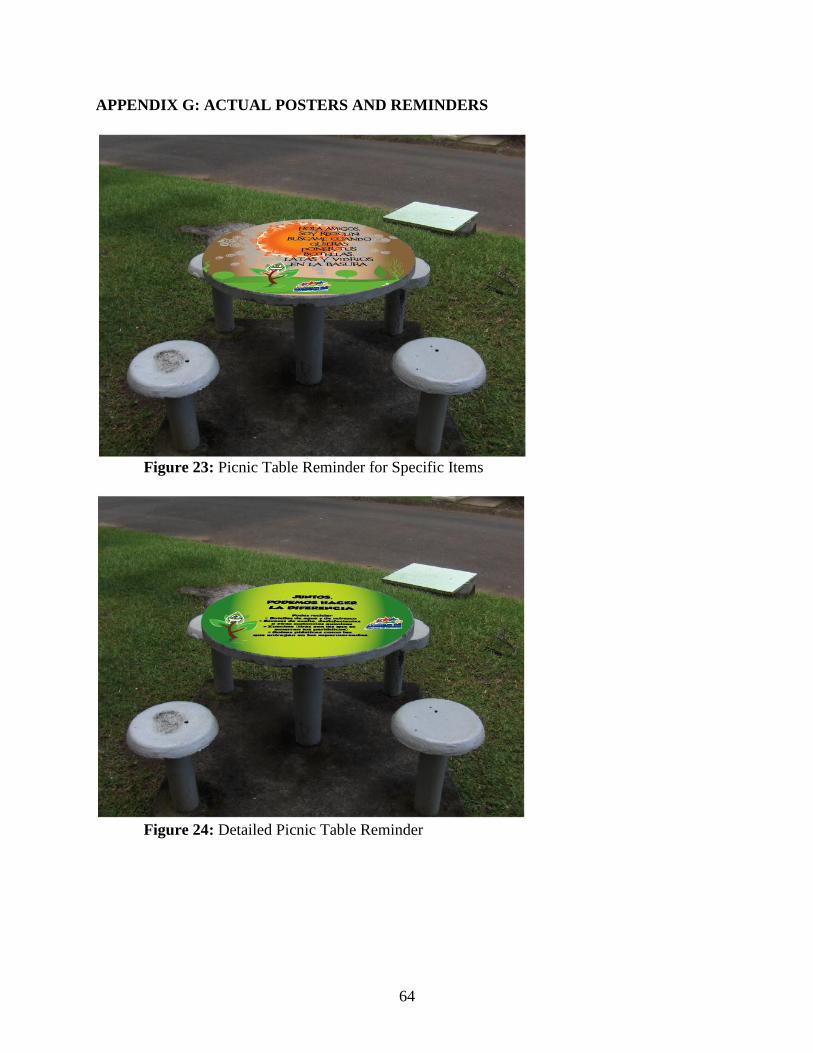
64
APPENDIX G: ACTUAL POSTERS AND REMINDERS
Figure 23: Picnic Table Reminder for Specific Items
Figure 24: Detailed Picnic Table Reminder
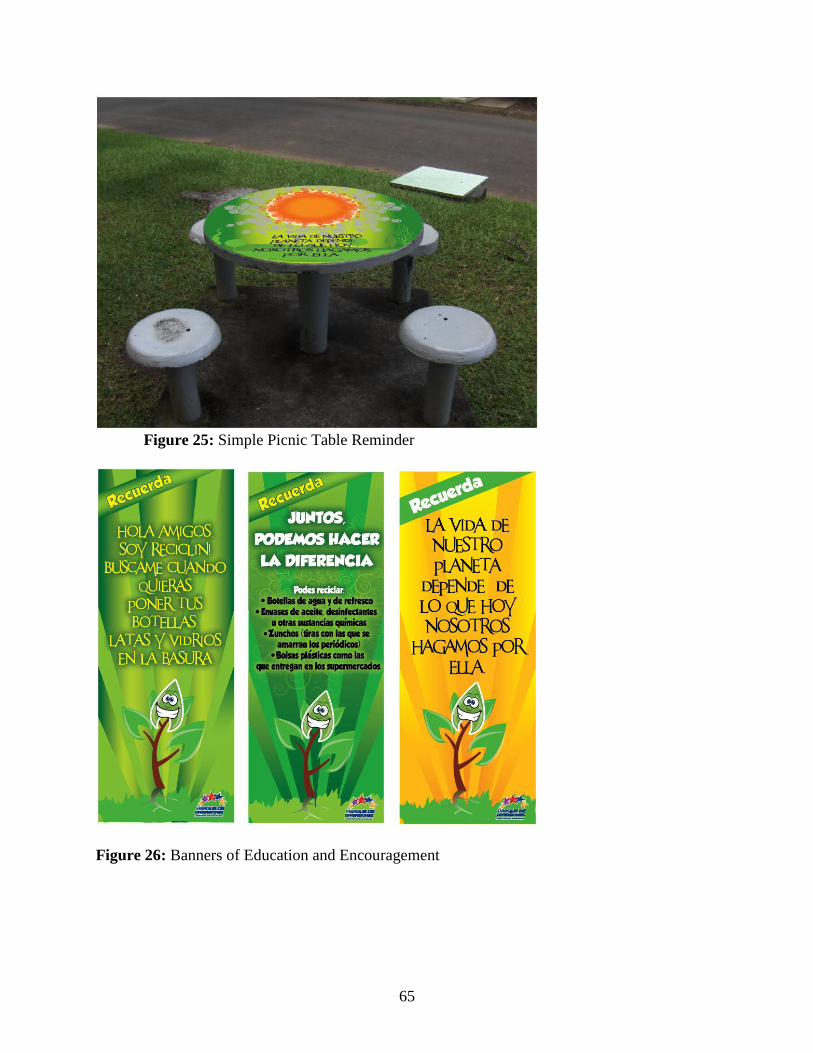
65
Figure 25: Simple Picnic Table Reminder
Figure 26: Banners of Education and Encouragement
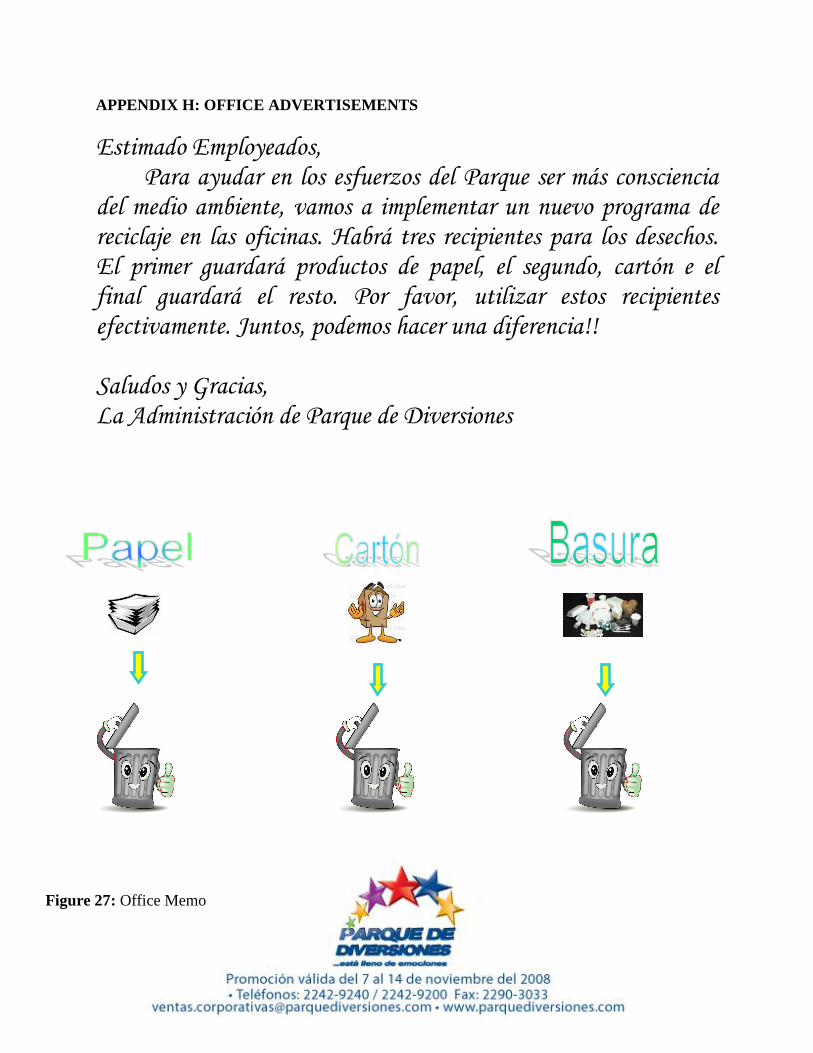
66
APPENDIX H: OFFICE ADVERTISEMENTS
Estimado Employeados, Para ayudar en los esfuerzos del Parque ser más consciencia
del medio ambiente, vamos a implementar un nuevo programa de reciclaje en las oficinas. Habrá tres recipientes para los desechos. El primer guardará productos de papel, el segundo, cartón e el final guardará el resto. Por favor, utilizar estos recipientes efectivamente. Juntos, podemos hacer una diferencia!! Saludos y Gracias, La Administración de Parque de Diversiones
Figure 27: Office Memo
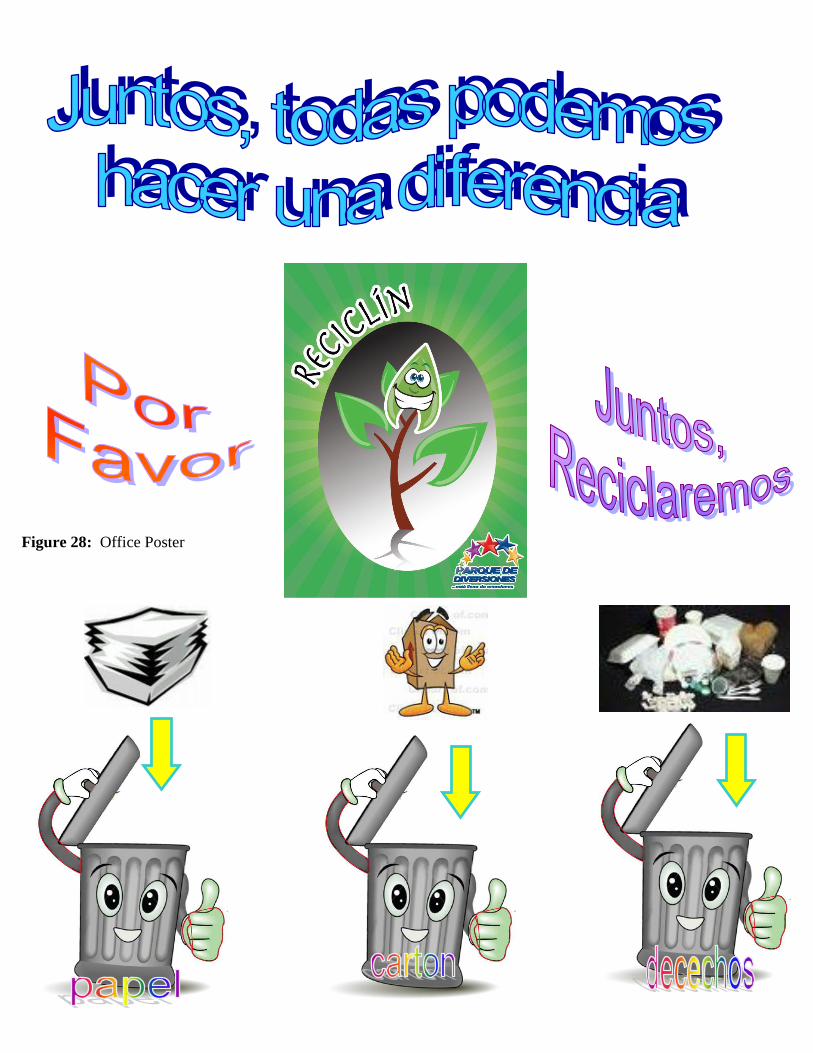
67
Figure 28: Office Poster
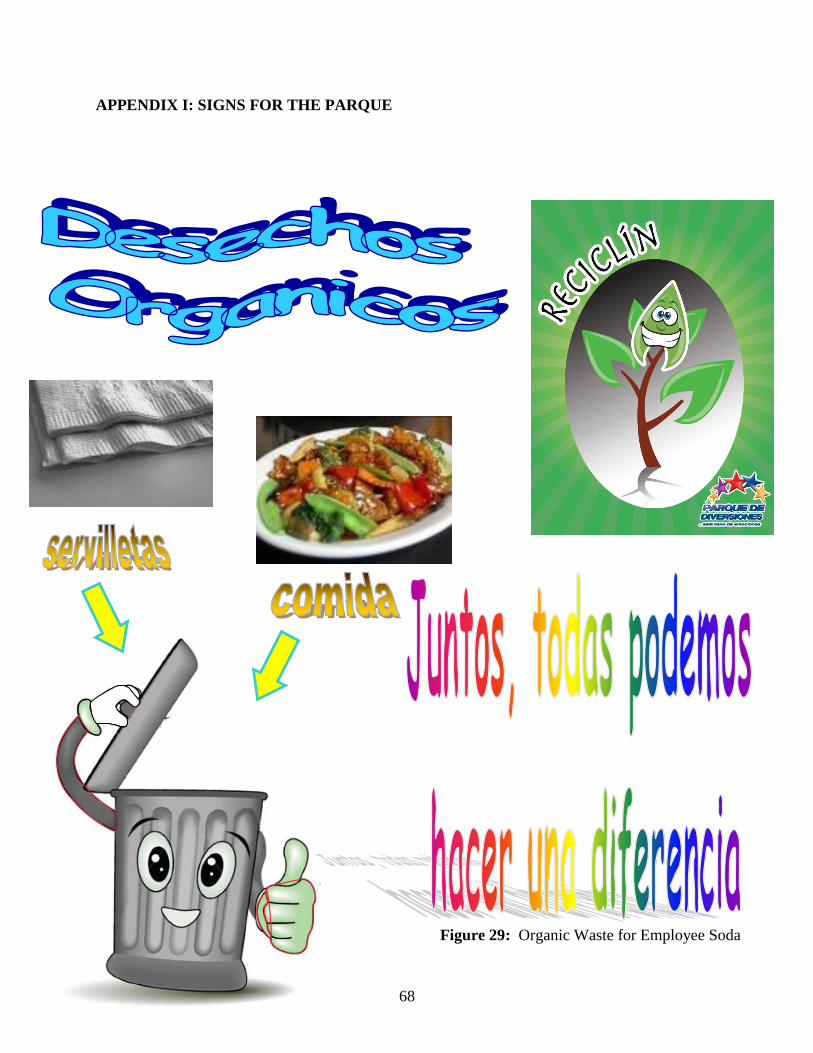
68
Figure 29: Organic Waste for Employee Soda
APPENDIX I: SIGNS FOR THE PARQUE
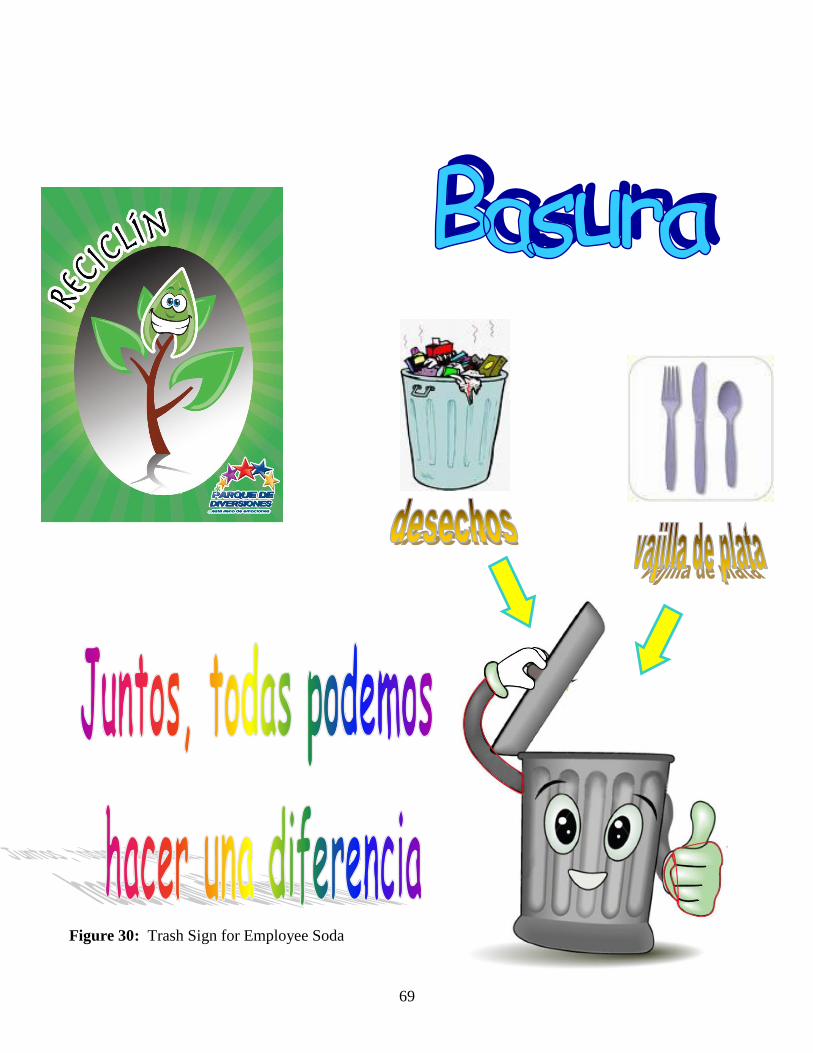
69
Figure 30: Trash Sign for Employee Soda
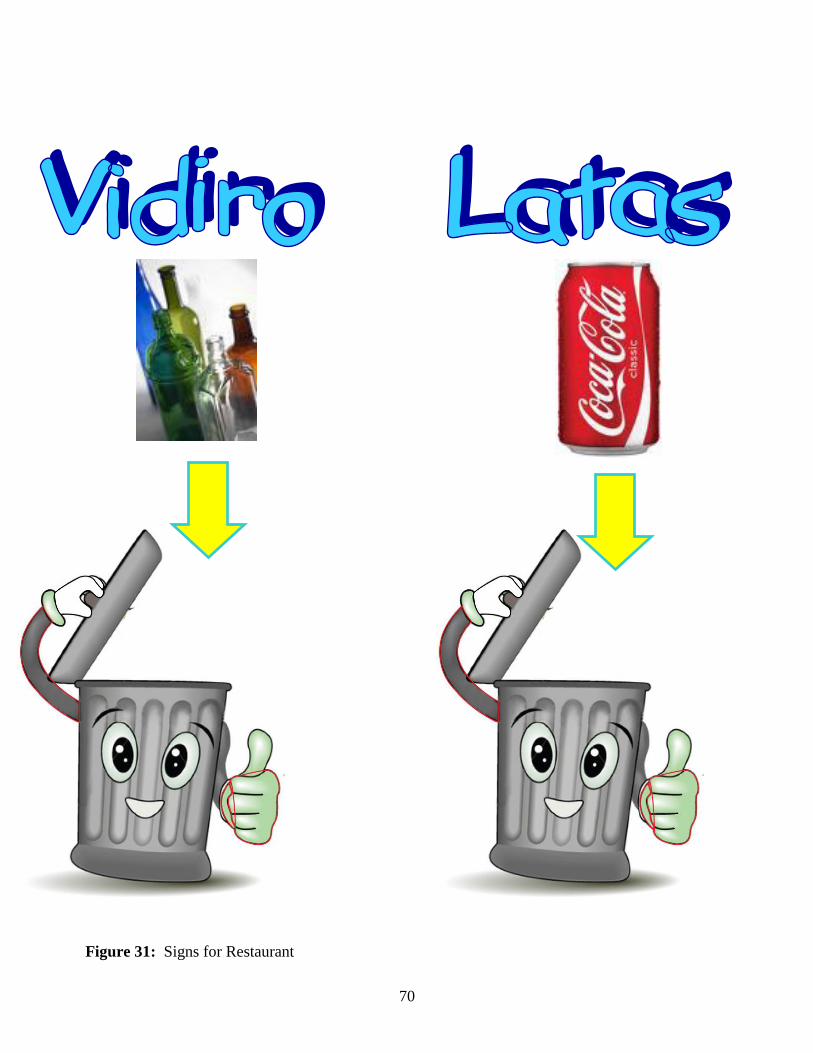
70
Figure 31: Signs for Restaurant