Embed Size (px)
Citation preview
Deborah G. Mayo
Despite increased public concern over the social consequences of policies regarding hazardous sub- stances and practices (e.g., nuclear technology, toxic wastes, carcinogenic substances), there has not been adequate public representation in the controversial decisions upon which these policies are based. The problem of inadequate public par- ticipation in controversies is therefore often raised in interdisciplinary studies of science, technology, and society. In a recent issue of Science, Tech- nology, & Human Values,~ for example, it was a common theme running through a diverse set of essays on the role of technical knowledge in regulatory decisionmaking. As those essays dem- onstrated, although many policy analysts appar- ently agree on the importance of public partici- pation, there is no clear consensus about how the problem should be tackled and about what role, if any, interdisciplinary work in science studies can play.
The problem of public participation in decisions on hazardous technologies arises out of the tension between the need for scientific expertise in as- sessing hazards and the desire that people in a democracy have control over important social de- cisions. Differing attitudes toward public partic- ipation reflect differing views on the nature and importance of the technical-scientific components of hazard regulation and the policy value ones.
Deborah G. Mayo is an Assistant Professor in the Department of Philosophy, and an Adjunct Professor in the Center for the Study of Science in Society at Virginia Polytechnic Institute and State University, Blacksburg, VA 24061.
What all discussions of the problem appear to share, however, is the idea that the public's par- ticipation (and, by inference, its interest) focuses not on technical-scientific issues but on issues concerning policy values.
I shall suggest a shift of focus to a set of tech- nical-scientific and, in particular, statistical issues for increasing the public's ability to understand and resolve controversies involving hazards. Stressing the importance of such scientific issues- especially if statistical complexity is involved- is not usually seen to go hand in hand with the aim of promoting democratic control of policy. Technical-scientific complexity, it is often argued, is precisely what precludes lor at least discourages) participation by the lay public. If, however, social values are to be reflected adequately in hazard regulations, then the public must be given tools for understanding and criticizing the statistical hazard assessments underlying them. I am not suggesting that laypersons be taught the formal techniques found in statistics texts. The ability to apply formal rules (or "recipes") does not confer the critical astuteness needed for effective public influence. The rules needed for critically examining statistical hazard assessments are, in fact, one level removed from mathematical statistics itself. Thus they may be referred to as metastatistical tools.
In this article, I shall develop two metastatistical tools and demonstrate their value for resolving a problem in hazard assessment which is often at the heart of policy controversies-namely, the problem of interpreting what negative statistical results indicate about the true extent of a sub-
? 1985 by the Massachusetts Institute of Technology and the President and Fellows of Harvard College. Published by John Wiley & Sons Science, Technology, & Human Values, Volume 10, Issue 4, pp. 55-68 (Fall 1985) CCC 0162-2439/85/040055-14$04.00
Increasing Public Participation in Controversies Involving Hazards: The Value of Metastatistical Rules
56 Science, Technology, & Human Values-Fall 1985
stance's hazard. My strategy will be first to discuss in a general fashion the problem of participation and to suggest how it might be tackled. Next, I will illustrate the problem by reference to a specific case study, and then I will develop and apply a set of metastatistical tools to that case.
I am focusing this article on the nature of me- tastatistical tools and their value for public par- ticipation. I do not intend to recommend how the resulting participation is to be implemented or how the participants should be chosen (see Note 40}. Although these latter issues must also be addressed in a complete metastatistical program, the tools themselves are primary regardless of how the logistics of participation are sorted out. Most importantly, the nature of these tools de- termines the role it is plausible to expect the public to play.2
Carrying out such a metastatistical program re- quires considerations from diverse fields and is a task uniquely suited to work in interdisciplinary studies of science. By pursuing this task, science studies can play a dynamic and socially significant role in promoting effective public influence in shaping policies and resolving controversies.
The Growing Problem of Public Participation and the Metastatistics of Hazard
Stages of Hazard Analysis
Hazard analysis is a multi-faceted enterprise that can be divided into three very broad stages: 1) data generation, 2) hazard assessment, and 3) hazard evaluation.3
Data generation includes (retrospective) case- control studies, and (prospective) randomized treatment-control experiments. For example, many studies were conducted in the 1960s and 1970s to obtain data on the hazards associated with oral contraceptives. One of the most controversial hazards investigated was that of thromboembolic diseases.
On the basis of data collected in such studies, statements of the hazards associated with the substance in question are made. Typical examples of hazard assessments are found in the reports on oral contraceptives by the Advisory Committee to the U.S. Food and Drug Administration (FDA) in 1966 and 1969, respectively:
The data .. . are not adequate to confirm or refute the role of oral contraceptives in thromboembolic disease. They do, however, suggest that if oral contraceptives act as a cause they do so very infrequently relative to the number of users.4
The fact remains that in the prospective trials of oral contraceptives [reported in a given study], no excess risk of thromboembolism has been shown.5
These hazard assessments can be distinguished from subsequent hazard evaluations, which ex- plicitly involve weighing benefits against risk. On the basis of the hazard assessments of the pill, for example, the 1966 Advisory Committee to the FDA made the following hazard evaluation: "The committee finds no adequate scientific data, at this time, proving these compounds unsafe for human use."6 The notion of "safety" is acknowl- edged to involve weighing benefits against risk, and the follow-up FDA report in 1969 makes the consideration of benefits explicit:
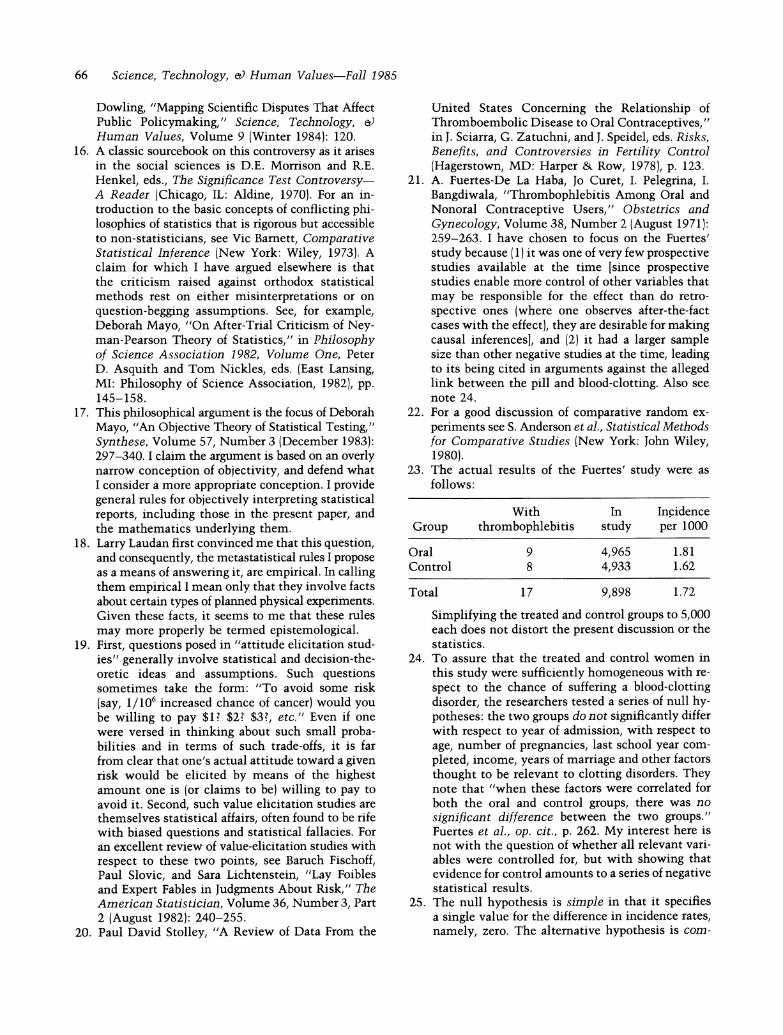
When these potential hazards and the value of the drugs are balanced, the Committee finds the ratio of benefit to risk sufficiently high to justify the designation safe within the intent of legislation.7
Relating hazard assessments to hazard evalu- ations, and to any subsequent policies, involves a deliberate and explicit injection of various so- cietal policy values. As is typical for such evaluations, the FDA Advisory Committee's evaluations gave rise to such controversial policy questions as: What is the meaning of the double negative "no proof of unsafety" or of "safe within the intent of legislation"? How are benefits to be weighed against risks, and to whom should these apply?
In contrast, the entry of values in relating data to hazard assessments is rarely made explicit, if it is not wholly denied. A common idealized view of hazard analysis is the following: A qualified expert makes a value-free assessment of the haz- ards involved; societal groups indicate the values they attach to certain hazards; and then, by some means appropriately sensitive to the two com- ponents, a hazard evaluation is reached. Echoing this ideal, Howard Raiffa, in a report to the Na- tional Academy of Sciences, argues that hazard assessments should meet the following criterion:
Free from the values of policy values. Report should not prejudge policy conclusions. Values
Mayo: Increasing Public Participation 57
appropriate to policy evaluation should not in- fluence assessments of uncertainties.8
Consequences of Finding All Stages of Hazard Analysis Imbued With Values
Many recent analyses of values and public policy seem to cast doubt on the possibility of satisfying Raiffa's criterion. These analyses argue that values impinge, not only at the hazard evaluation stage, but at the hazard assessment stage as well. Hazard assessments, it is argued, involve value-laden judgments both in generating data and in inter- preting results.
If even hazard assessments are not free of policy values, then the public, in a democratic society, should have some means to ensure that these assessments are sensitive to the values they hold. Understandably, the entrance of policy values at all stages of hazard analysis is stressed in many arguments to show the need for increased public participation in hazard regulation. Although such arguments have helped open up several new av- enues for public participation, the resulting par- ticipation has failed to reflect the broad societal concerns many hoped it would. Instead, as Harvey Brooks notes, "the economic interests have now learned how to use the newly created opportunities for public input to their own advantage."9
The problem, as I see it, is this: The hazard analyses with the most openings for injecting value judgments (and thus most acutely threatened by bias and controversy) are those based on incomplete or inaccurate data.1? Yet these analyses rest on hazard assessments depending heavily on scien- tific, especially statistical, expertise and are densely shrouded in technical-statistical complexities. So, on the one hand, the area of statistical hazard assessment justifies the strongest arguments for public participation (as it has many openings for value-judgments). But on the other hand, it is an area in which the lay public is in the weakest position to participate-at least at present.
Lack of statistical knowledge, if it does not keep the public out of technically intensive con- troversies entirely, is likely to render attempted public intervention ineffectual or actually counter- productive. As Baruch Fischoff and his colleagues remark:
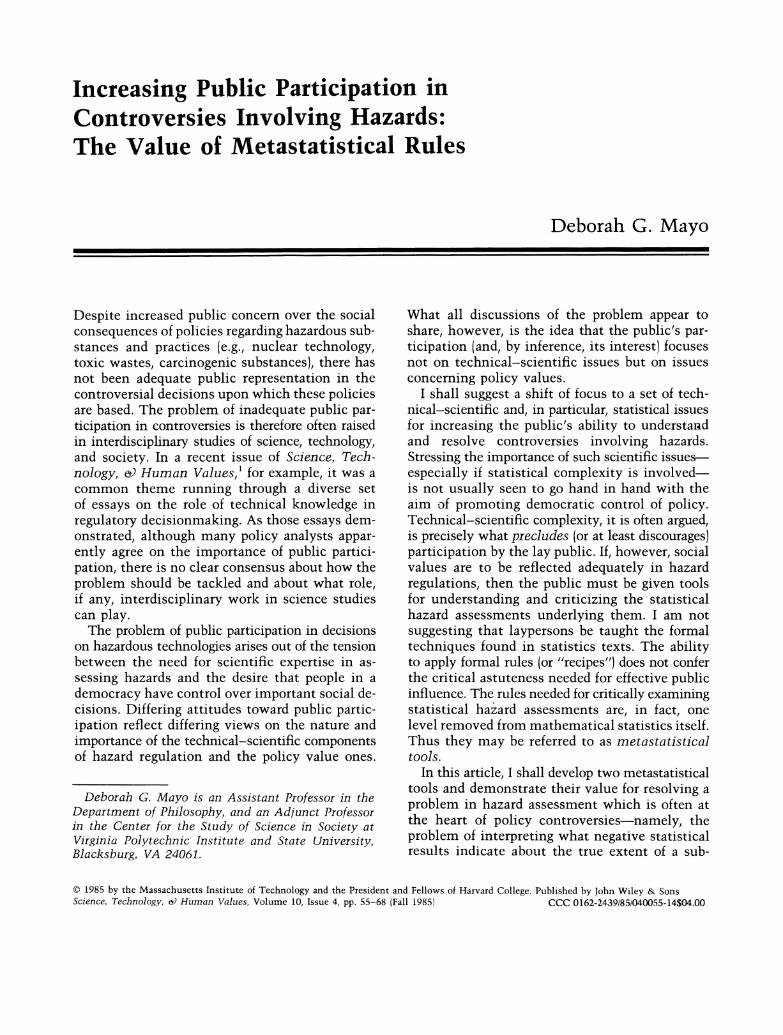
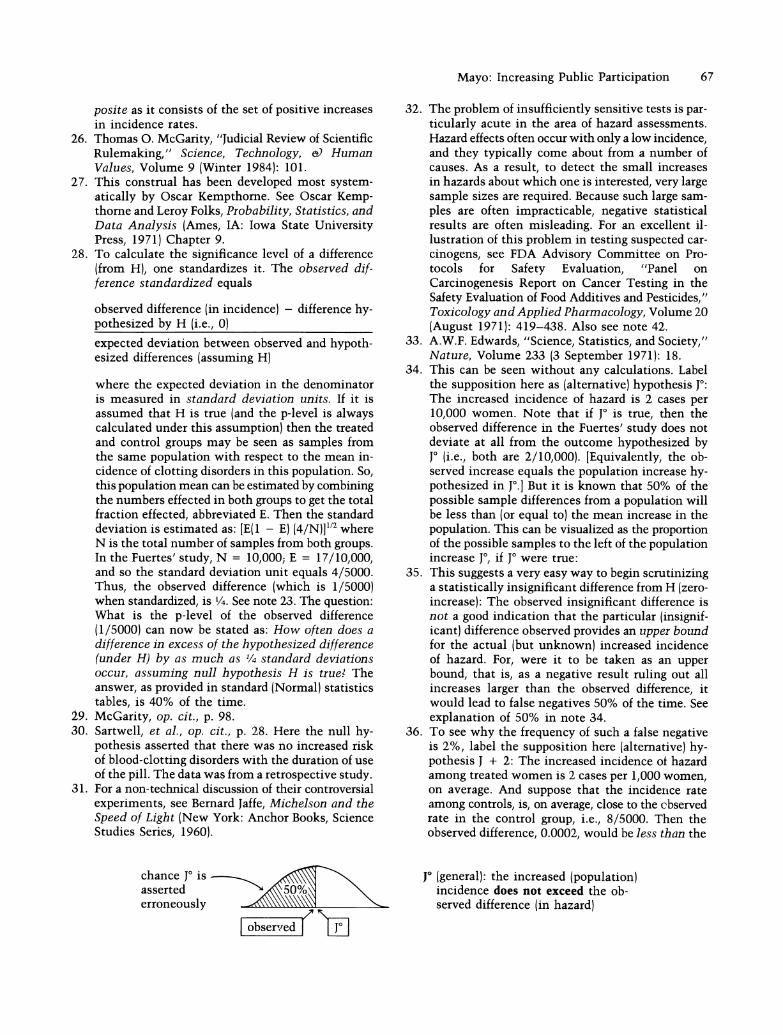
Citizens in a democratic society will eventually interfere with decisions in which they do not feel represented. When lay people do force their way
into hazard decisions, their vehemence and tech- nical naivete may leave the paid professionals aghast, reinforcing suspicions that the public is stupid.11
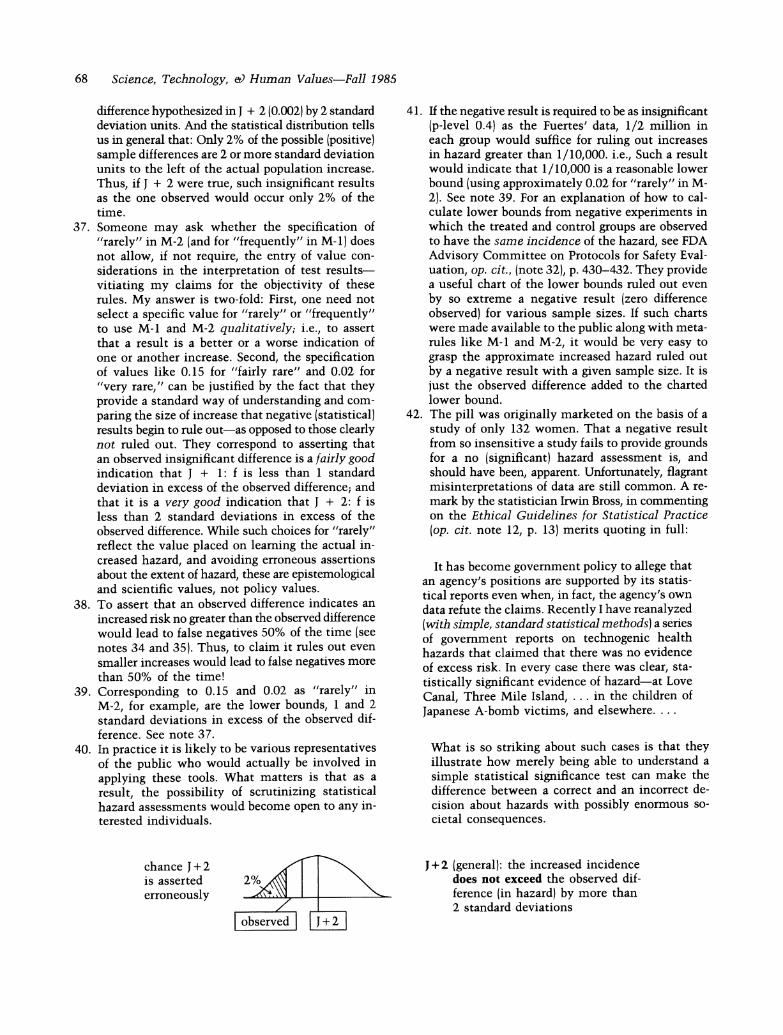
To forestall such mutual incomprehension, the public (or its representatives) requires an under- standing of the statistical evidence of hazards as- sociated with hazard evaluations.
Instead of encouraging a careful look at the nature and role of statistical evidence, however, the increasing awareness that values may enter at all stages of hazard analysis has tended to deflect attention away from the statistical-scientific is- sues in resolving controversial hazard assessments. The political and scientific communities have failed to recognize that in minimizing scientific- statistical issues the problem of effective public participation is exacerbated.
Why Decreasing Emphasis on Issues of Evidence Increases the Problem of Participation
The key problems of public participation revolve around the public's inability to hold expert risk assessors accountable to the policy values of so- ciety. And, ironically, finding that hazard assess- ments may ultimately depend on policy values seems to have helped free the experts from being held responsible for their assessments. For one thing, the view that conflicting hazard assessments largely reflect conflicting policy values provides a warrant for denying the validity of any assess- ment leading to policies deemed unfavorable. In- dividuals are encouraged to view "expert scientific support" as something that can be enlisted for any position whatever. Methods of statistical haz- ard assessment are regarded with general mistrust, rather than as instruments for adjudicating con- troversial assessments objectively.12
Moreover, if disagreements over hazard assess- ments are viewed as primarily disagreements over policy values, there would seem to be little jus- tification for criticizing an expert assessment as irresponsible or incompetent on objective scientific grounds. This situation provides regulatory agen- cies with a convenient defense against criticisms when their hazard assessments prove to be in- accurate.13 But, as I shall argue, the values ap- propriate at the stage of hazard assessment are scientific and evidential, not political. As such, there often is genuine warrant for criticizing hazard
58 Science, Technology, & Human Values-Fall 1985
assessments as invalid, and hazard assessors as incompetent or biased interpreters of data. Unable to scrutinize the evidence underlying assessments, the public-as well as many judges, lawyers, reg- ulators, and scientists-is unable to express such criticisms. As Marcel La Follette correctly notes:
when policymakers and the public become im- patient with expert dissensus, they often lack sufficient understanding of the reasons for such disagreement and rarely are able to argue effec- tively ... A strong case for efforts to establish such understanding can be made for scientists, lawyers, and policymakers as well as for the public .... 14
And this understanding requires a means for dis- tinguishing hazard assessments that are prejudged by policy values from those warranted by the evi- dence. Given its importance for participation, why has this understanding not been forthcoming? A rather disturbing, but no doubt partly correct, ex- planation is given in an article by Marc Roberts, Stephen Thomas, and Michael Dowling:
Too many of the participants have good reasons not to distinguish scientific evidence from policy preferences, not to analyze carefully the various sources of technical disagreement and not to accept responsibility for some decisions or judgments.1$
Can Judgments of Policy Value Be Distinguished from Judgments of Evidence? A Problem for Philosophy of Statistics
Failure to distinguish conflicts of scientific evi- dence from those of policy preference is not so much the result of deliberate attempts to insulate professionals from charges of incompetence as the failure to see how such a distinction can be drawn objectively. This deficiency in turn reflects a gen- uine misunderstanding of statistical evidence.
Given the widespread use of statistical methods in science, most individuals tend to assume that their logical basis is not a subject of controversy, and that they are well understood by those who employ them. This is not true. The validity of even the most routinely used methods is the sub- ject of enormous confusion and philosophical controversy.16 Conflicting hazard assessments, and the problem of adjudicating them, are closely con- nected to the statistical and philosophical con- troversies over the possibility of interpreting
statistical results objectively. The way in which these controversies intertwine is very poorly understood by both the experts and the lay public.
The problem as usually perceived is this: Using statistical methods to reach hazard assessments requires "extra-statistical" judgments as to what data to collect, how large a sample to take, and what level of reliability to use. Most philosophers of statistics maintain that these judgments are necessarily subjective, reflecting pragmatic and, in this case, policy value considerations.17 Since any resulting statistical reports depend on these subjective choices, they too are necessarily colored by subjective policy values-or so many philos- ophers argue. If one accepts this argument, conflicts over hazard assessments should be treated as con- flicts over policy value.
But this argument is erroneous; and conflating conflicts over hazard assessments and conflicts over policy values is a mistake. The judgments required in applying statistical methods to reach hazard assessments may reflect policy values, conventions, pragmatic considerations, or other factors. But it does not follow that given the sta- tistical method chosen, the question of whether a hazard assessment is warranted by the evidence need also be infected with the subjective values of the earlier judgments. Whether data warrant an assessment is an empirical question to which an objective answer can often be given;18 (that is, it may well meet Raiffa's criterion: "Free from the values of policy values").
A crude analogy may help. My interest in whether I have gained as little as one-half pound may be a matter of my subjective values. But whether a scale with a digital read-out in whole pounds, say, is a good tool for finding this out is not a matter of my subjective values. Neither is it a matter of pure logic. It involves empirical matters about the scale, the weighing conditions, my typical weight fluctuations, and so on. Whether or not a change in weight is detected depends on the type of scale chosen for the task. But given the scale chosen (as well as the weighing con- ditions), whether or not a gain is detected depends on how much I have actually gained! For this reason, knowledge of this dependency enables learning about my weight gain from the scale reading and expressing an interest in detecting a certain gain in terms of the scale that should be used.
The function of the metastatistical tools I am suggesting is analogous to that served by knowl-
Mayo: Increasing Public Participation 59
edge of the dependencies between scale used and actual weight gained. Lacking such knowledge prevents individuals from both understanding hazard assessments, and expressing their attitudes about hazards unambiguously to professionals purporting to elicit "what the public wants."19 Diminishing the importance of such statistical knowledge has had the (mostly unintended) effect of hampering, not helping, the public in holding risk assessors and regulators accountable to societal values.
Controversial Statistical Assessments of No-Increased Hazard: The Case of Oral Contraceptives
These points are best elucidated by means of an actual case study. Although many studies con- ducted in the 1960s and 1970s were taken as evi- dence that oral contraceptives seriously increase the risk of blood-clotting disease, several re- searchers disagreed with this assessment. Paul David Stolley's 1977 review of the U.S. evidence reported:
A study from Puerto Rico by Fuertes, et al., which was a randomized controlled trial of oral contra- ceptives, has reported no increased incidence of thromboembolic disease in persons taking the oral contraceptives ... this experiment is often cited as evidence that the case-control studies from the United States and from England, and observational cohort or prospective studies re- ported from England, may be finding a spurious association.20
The specific hazard assessment reached by Fuertes et al.21 is that the statistical analyses of the Fuertes' data
indicate that there is no significant difference in the risk of developing thrombophlebitis among pill users and among patients in the control group. (p. 262)
Hazard assessments of this type may be abbreviated as No-Increase or NI-assessments. Because such hazard assessments are often the source of con- troversy, it is desirable to develop a general set of tools for their clarification.
NI-assessments assert that, on average, the in-
cidence of the hazard among those exposed to the treatment in question is no higher than the in- cidence of the hazard were they not so exposed (or were they exposed to some other treatment). But rarely is it possible to undo the treatment to observe what would have occurred if none of the experimental subjects had been given the treat- ment. When possible, what is done in such cases is carry out a comparative random experiment.21 The idea of a comparative random experiment is, roughly, to assign the treatment randomly to half of the subjects studied, leaving the other half (the control group) untreated. At the end of the ex- periment, the average (i.e., the mean) numbers of subjects showing the effect of interest in the two groups are compared.
In the Fuertes' study, from 1961 to 1969, ap- proximately 10,000 women were randomly as- signed to either the treated group, where women were given an oral contraceptive or the control group, where women were given a different method of contraception. Each group contained approxi- mately 5,000 women. At the end of the study, nine of the 5,000 treated and eight of the 5,000 not treated were found to have had a blood-clotting disease.23 The observed (positive) difference, then, was 1/5000 (or 0.0002).
For a number of reasons, the methods by which such observed differences lead to assessments of "no (significant) increase" in hazard (i.e., NI- assessments) are statistical. First, the NI-assess- ment refers to two experimental populations of women: one where all take the pill and one where none do. The treated and control groups actually observed, however, only constitute samples from each. Second, numerous factors other than an oral contraceptive may cause or prevent blood-clotting diseases; so the difference observed may be due to these factors and not strictly to the presence or absence of the treatment of interest. As a result, the observed difference does not logically entail the NI-assessment. The data is first used to reach a statistical report; then that report leads to the NI-assessment. In the Fuertes' study, as in most studies of this type, this is accomplished by a test of the statistical significance of differences.
This test itself, of course, requires that certain assumptions be met by the study actually per- formed; and these assumptions must be checked in scrutinizing an NI-assessment. Such scrutiny calls for a separate analysis that I will not address here, but this separate analysis will itself involve running various tests of the significance of dif-
60 Science, Technology, & Human Values-Fall 1985
ferences.24 So, for either analysis, the place to start is with the significance test.
A Test of the Statistical Significance of Differences
A test of the significance of differences sets up a statistical hypothesis, H, the null hypothesis. In the Fuertes' study, the null hypothesis is that an oral contraceptive has a "null" effect on a woman's chance of suffering blood-clotting disorders:
H: The probable (mean) incidence of clotting dis- orders in women treated (with the pill) does not exceed the probable incidence among the controls.
So the null hypothesis asserts that any observed difference in clotting rates in the sample of treated and control subjects is merely due to accidental fluctuations.
The test consists of a rule that specifies which of the possible observed differences is to be taken as rejecting the null hypothesis. Rejecting H in this context is tantamount to accepting an al- ternative hypothesis, J, which in this case asserts that there is some positive increase in the inci- dence of blood-clotting disorders among women taking oral contraceptives.25 A rejection of H is a positive result; a failure to reject is a negative one. The observation of any positive difference in incidence-even if quite large-is logically consistent with the truth of the null hypothesis H. But H asserts that "large" differences are rare. Using statistical knowledge, it is possible to cal- culate how frequently a difference as large as, or larger than, the one observed would arise, assuming that the null hypothesis H is true. This is the significance level of the observed difference, often referred to as its p-value.
The statistical significance (p-level) of an observed difference measures how often a difference as large as or larger than the one observed would arise if the null hypothesis H (e.g., zero increase) were true.
Unfamiliarity with p-values has led many com- mentators to accept that such reports are likely to be inaccessible to various groups of non- scientists. Thomas 0. McGarity, for example, suggests that judges are unqualified to review technical aspects of disputes because
The appellate judge who has no idea what a 'p' value is will not find the answer in a typical scientific rulemaking record.26
It is implausible, he suggests, to train them in such technical matters. But, as I hope to show, it requires very minimal "technical training" to understand the central idea of p-levels.
Significance levels may be construed as giving standard units for measuring the distance between the observed difference in incidence and the dif- ferences expected assuming the truth of hypothesis H.27 This distance measure is inverted: The larger the significance level, the smaller the distance of the sample data from the data expected under hypothesis H. The smaller the significance level, the larger this distance; that is, the smaller the chance of such a difference occurring if in fact H is true. It is intuitively plausible to reject H when (and only when) the observed data is far from what would be expected if H were true. This in- tuition is precisely captured in a typical test of H:
Test of H: Reject H (zero increase) if and only if the significance level of the observed difference (in incidence rates) is sufficiently small.
How small should a significance level be required to be before the null hypothesis (of zero increase) is rejected? Conventional choices are 0.05 and 0.01; but the justification for these levels (as op- posed to, say, 0.08 or 0.03) is known to be con- troversial (see Note 161. Still, there is little lif any) dispute that unless a significance level is reasonably small (say, 0.15 or less) the result does not warrant rejecting the null hypothesis (i.e., it does not warrant a positive result). For the sig- nificance level equals the chance that such a re- jection is a false positive; and an inference with a high chance of being in error is not felt to be warranted.
What is the significance level of the difference observed in the Fuertes' study? Of the 5,000 women who took the oral contraceptive, there was only one more case of a blood-clotting disease than among the 5,000 who did not take the contra- ceptive; the difference was 1/5000. Even if the null hypothesis (zero increased incidence) were true, differences as large as (or larger than) 1/5000 would occur 40% of the time.28 Hence, the sta- tistical significance of the observed difference in the Fuertes' study is 0.4. Such a result (often re- ported simply as "not statistically significant") is
Mayo: Increasing Public Participation 61
that do not arise from unambiguous mathematical or scientific considerations are lumped under "policy value" choices. Second, whatever requires considerations of values or "discretion" is thought to fall outside the proper domain of purely sci- entific expertise. Given both these assumptions, it is not surprising to find the role of the statistical expert reduced to the formal calculation of such things as significance levels.
Such a view, however, is radically divorced from the uses to which statistical tests can be and often are put in reaching such evidential claims as that stated by the FDA Advisory Committee in 1969:
The probability of a series of differences as large or larger than that observed is greater than 0.5. Thus there is no evidence from this material that the risk is enhanced....30
Does the report of a high significance level, then, warrant the assessment "no evidence of increased incidence of hazard"? That admittedly requires going beyond formal statistical reports themselves. But it does not thereby go beyond the proper do- main of statistical-scientific expertise {even if we accept the second assumption excluding policy values from this domain).
What is required to answer such questions is an understanding of the scientific lor evidential) import of a statistical report, and more specifically, the import of "failing to find a statistically sig- nificant difference (with a given test)." Although there is much disagreement as to what information such a statistical report provides, these disagree- ments do not essentially revolve around policy values-at least not if they are correctly under- stood. These disagreements, rather, concern the metastatistical problem of interpreting negative statistical reports.
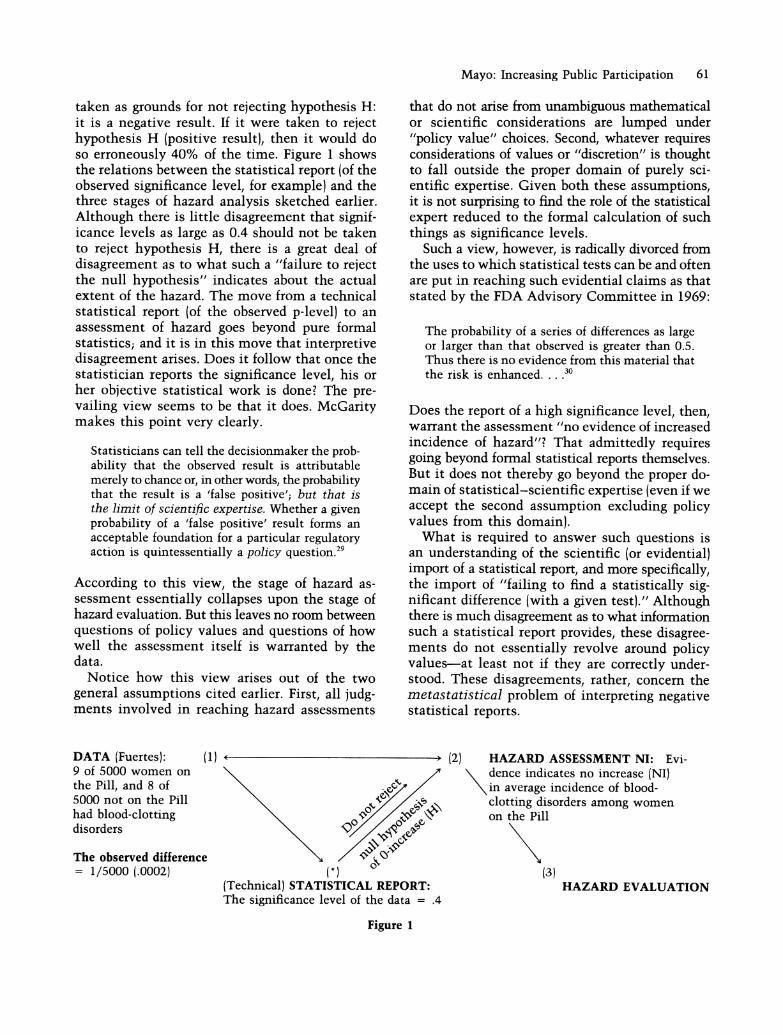
> (2) HAZARD ASSESSMENT NI: Evi- va \ dence indicates no increase ,NI,
:/ \in average incidence of blood- ^ <, clotting disorders among women
+ _
on the Pill
\
taken as grounds for not rejecting hypothesis H: it is a negative result. If it were taken to reject hypothesis H (positive result), then it would do so erroneously 40% of the time. Figure 1 shows the relations between the statistical report (of the observed significance level, for example) and the three stages of hazard analysis sketched earlier. Although there is little disagreement that signif- icance levels as large as 0.4 should not be taken to reject hypothesis H, there is a great deal of disagreement as to what such a "failure to reject the null hypothesis" indicates about the actual extent of the hazard. The move from a technical statistical report (of the observed p-level) to an assessment of hazard goes beyond pure formal statistics; and it is in this move that interpretive disagreement arises. Does it follow that once the statistician reports the significance level, his or her objective statistical work is done? The pre- vailing view seems to be that it does. McGarity makes this point very clearly.
Statisticians can tell the decisionmaker the prob- ability that the observed result is attributable merely to chance or, in other words, the probability that the result is a 'false positive'; but that is the limit of scientific expertise. Whether a given probability of a 'false positive' result forms an acceptable foundation for a particular regulatory action is quintessentially a policy question.29
According to this view, the stage of hazard as- sessment essentially collapses upon the stage of hazard evaluation. But this leaves no room between questions of policy values and questions of how well the assessment itself is warranted by the data.
Notice how this view arises out of the two general assumptions cited earlier. First, all judg- ments involved in reaching hazard assessments
DATA (Fuertes): 9 of 5000 women on the Pill, and 8 of 5000 not on the Pill had blood-clotting disorders
(1)
The observed difference = 1/5000 (.0002) 1n)
'
(Technical) STATISTICAL REPORT: The significance level of the data = .4
(3) HAZARD EVALUATION
Figure 1
62 Science, Technology, & Human Values-Fall 1985
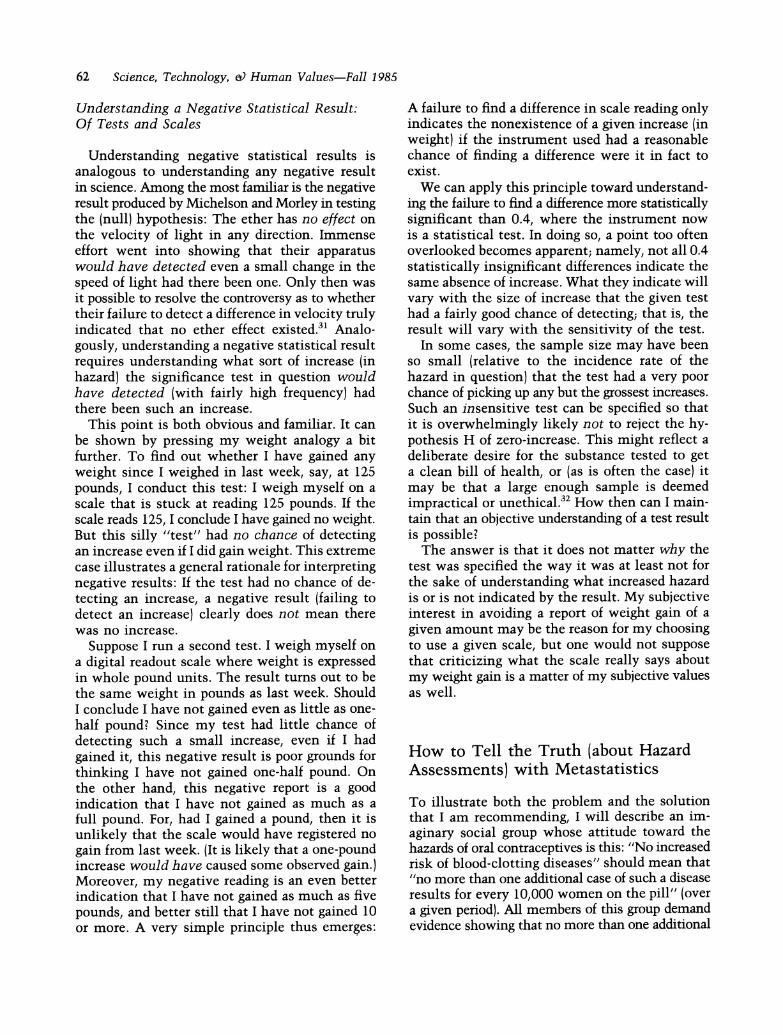
Understanding a Negative Statistical Result: Of Tests and Scales
Understanding negative statistical results is analogous to understanding any negative result in science. Among the most familiar is the negative result produced by Michelson and Morley in testing the (null) hypothesis: The ether has no effect on the velocity of light in any direction. Immense effort went into showing that their apparatus would have detected even a small change in the speed of light had there been one. Only then was it possible to resolve the controversy as to whether their failure to detect a difference in velocity truly indicated that no ether effect existed.31 Analo- gously, understanding a negative statistical result requires understanding what sort of increase (in hazard) the significance test in question would have detected (with fairly high frequency) had there been such an increase.
This point is both obvious and familiar. It can be shown by pressing my weight analogy a bit further. To find out whether I have gained any weight since I weighed in last week, say, at 125 pounds, I conduct this test: I weigh myself on a scale that is stuck at reading 125 pounds. If the scale reads 125, I conclude I have gained no weight. But this silly "test" had no chance of detecting an increase even if I did gain weight. This extreme case illustrates a general rationale for interpreting negative results: If the test had no chance of de- tecting an increase, a negative result (failing to detect an increase) clearly does not mean there was no increase.
Suppose I run a second test. I weigh myself on a digital readout scale where weight is expressed in whole pound units. The result turns out to be the same weight in pounds as last week. Should I conclude I have not gained even as little as one- half pound? Since my test had little chance of detecting such a small increase, even if I had gained it, this negative result is poor grounds for thinking I have not gained one-half pound. On the other hand, this negative report is a good indication that I have not gained as much as a full pound. For, had I gained a pound, then it is unlikely that the scale would have registered no gain from last week. (It is likely that a one-pound increase would have caused some observed gain.) Moreover, my negative reading is an even better indication that I have not gained as much as five pounds, and better still that I have not gained 10 or more. A very simple principle thus emerges:
A failure to find a difference in scale reading only indicates the nonexistence of a given increase (in weight) if the instrument used had a reasonable chance of finding a difference were it in fact to exist.
We can apply this principle toward understand- ing the failure to find a difference more statistically significant than 0.4, where the instrument now is a statistical test. In doing so, a point too often overlooked becomes apparent; namely, not all 0.4 statistically insignificant differences indicate the same absence of increase. What they indicate will vary with the size of increase that the given test had a fairly good chance of detecting; that is, the result will vary with the sensitivity of the test.
In some cases, the sample size may have been so small (relative to the incidence rate of the hazard in question) that the test had a very poor chance of picking up any but the grossest increases. Such an insensitive test can be specified so that it is overwhelmingly likely not to reject the hy- pothesis H of zero-increase. This might reflect a deliberate desire for the substance tested to get a clean bill of health, or (as is often the case) it may be that a large enough sample is deemed impractical or unethical.32 How then can I main- tain that an objective understanding of a test result is possible?
The answer is that it does not matter why the test was specified the way it was at least not for the sake of understanding what increased hazard is or is not indicated by the result. My subjective interest in avoiding a report of weight gain of a given amount may be the reason for my choosing to use a given scale, but one would not suppose that criticizing what the scale really says about my weight gain is a matter of my subjective values as well.
How to Tell the Truth (about Hazard Assessments) with Metastatistics
To illustrate both the problem and the solution that I am recommending, I will describe an im- aginary social group whose attitude toward the hazards of oral contraceptives is this: "No increased risk of blood-clotting diseases" should mean that "no more than one additional case of such a disease results for every 10,000 women on the pill" (over a given period). All members of this group demand evidence showing that no more than one additional
Mayo: Increasing Public Participation 63
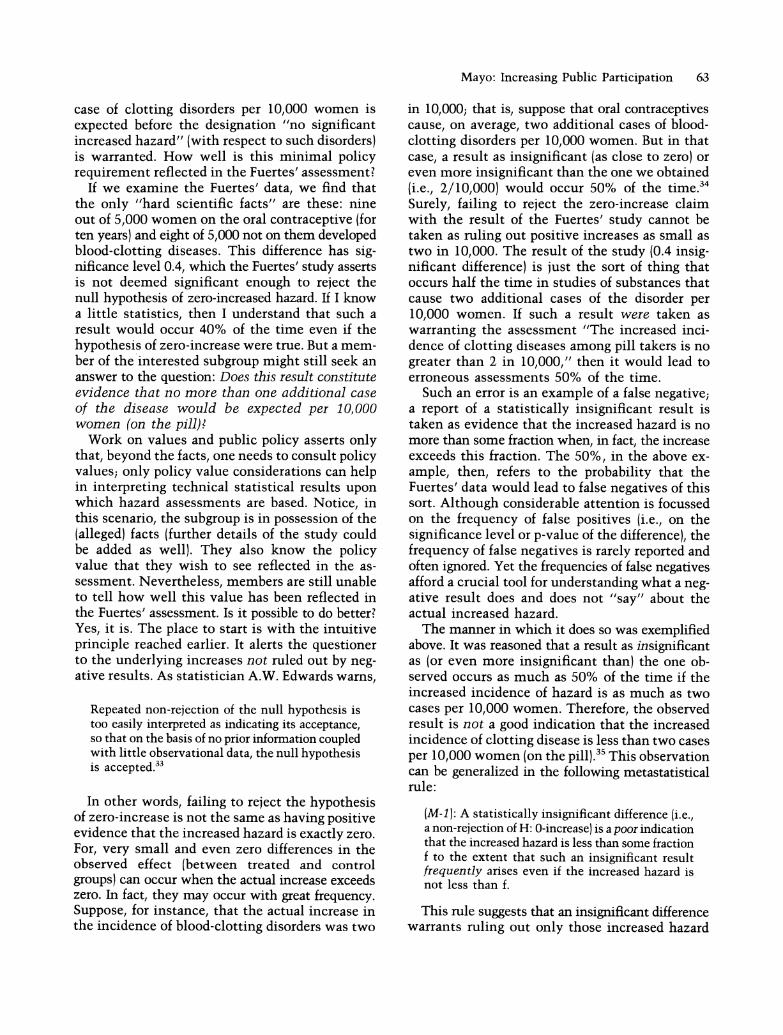
in 10,000; that is, suppose that oral contraceptives cause, on average, two additional cases of blood- clotting disorders per 10,000 women. But in that case, a result as insignificant (as close to zero) or even more insignificant than the one we obtained (i.e., 2/10,000) would occur 50% of the time.34 Surely, failing to reject the zero-increase claim with the result of the Fuertes' study cannot be taken as ruling out positive increases as small as two in 10,000. The result of the study (0.4 insig- nificant difference) is just the sort of thing that occurs half the time in studies of substances that cause two additional cases of the disorder per 10,000 women. If such a result were taken as warranting the assessment "The increased inci- dence of clotting diseases among pill takers is no greater than 2 in 10,000," then it would lead to erroneous assessments 50% of the time.
Such an error is an example of a false negative; a report of a statistically insignificant result is taken as evidence that the increased hazard is no more than some fraction when, in fact, the increase exceeds this fraction. The 50%, in the above ex- ample, then, refers to the probability that the Fuertes' data would lead to false negatives of this sort. Although considerable attention is focussed on the frequency of false positives (i.e., on the significance level or p-value of the difference), the frequency of false negatives is rarely reported and often ignored. Yet the frequencies of false negatives afford a crucial tool for understanding what a neg- ative result does and does not "say" about the actual increased hazard.
The manner in which it does so was exemplified above. It was reasoned that a result as insignificant as (or even more insignificant than) the one ob- served occurs as much as 50% of the time if the increased incidence of hazard is as much as two cases per 10,000 women. Therefore, the observed result is not a good indication that the increased incidence of clotting disease is less than two cases per 10,000 women (on the pill).35 This observation can be generalized in the following metastatistical rule:
(M-1): A statistically insignificant difference (i.e., a non-rejection of H: O-increase) is a poor indication that the increased hazard is less than some fraction f to the extent that such an insignificant result frequently arises even if the increased hazard is not less than f.
This rule suggests that an insigriificant difference warrants ruling out only those increased hazard
case of clotting disorders per 10,000 women is expected before the designation "no significant increased hazard" {with respect to such disorders) is warranted. How well is this minimal policy requirement reflected in the Fuertes' assessment?
If we examine the Fuertes' data, we find that the only "hard scientific facts" are these: nine out of 5,000 women on the oral contraceptive (for ten years) and eight of 5,000 not on them developed blood-clotting diseases. This difference has sig- nificance level 0.4, which the Fuertes' study asserts is not deemed significant enough to reject the null hypothesis of zero-increased hazard. If I know a little statistics, then I understand that such a result would occur 40% of the time even if the hypothesis of zero-increase were true. But a mem- ber of the interested subgroup might still seek an answer to the question: Does this result constitute evidence that no more than one additional case of the disease would be expected per 10,000 women (on the pill)?
Work on values and public policy asserts only that, beyond the facts, one needs to consult policy values; only policy value considerations can help in interpreting technical statistical results upon which hazard assessments are based. Notice, in this scenario, the subgroup is in possession of the (alleged) facts (further details of the study could be added as well). They also know the policy value that they wish to see reflected in the as- sessment. Nevertheless, members are still unable to tell how well this value has been reflected in the Fuertes' assessment. Is it possible to do better? Yes, it is. The place to start is with the intuitive principle reached earlier. It alerts the questioner to the underlying increases not ruled out by neg- ative results. As statistician A.W. Edwards warns,
Repeated non-rejection of the null hypothesis is too easily interpreted as indicating its acceptance, so that on the basis of no prior information coupled with little observational data, the null hypothesis is accepted.33
In other words, failing to reject the hypothesis of zero-increase is not the same as having positive evidence that the increased hazard is exactly zero. For, very small and even zero differences in the observed effect (between treated and control groups) can occur when the actual increase exceeds zero. In fact, they may occur with great frequency. Suppose, for instance, that the actual increase in the incidence of blood-clotting disorders was two
64 Science, Technology, & Human Values-Fall 1985
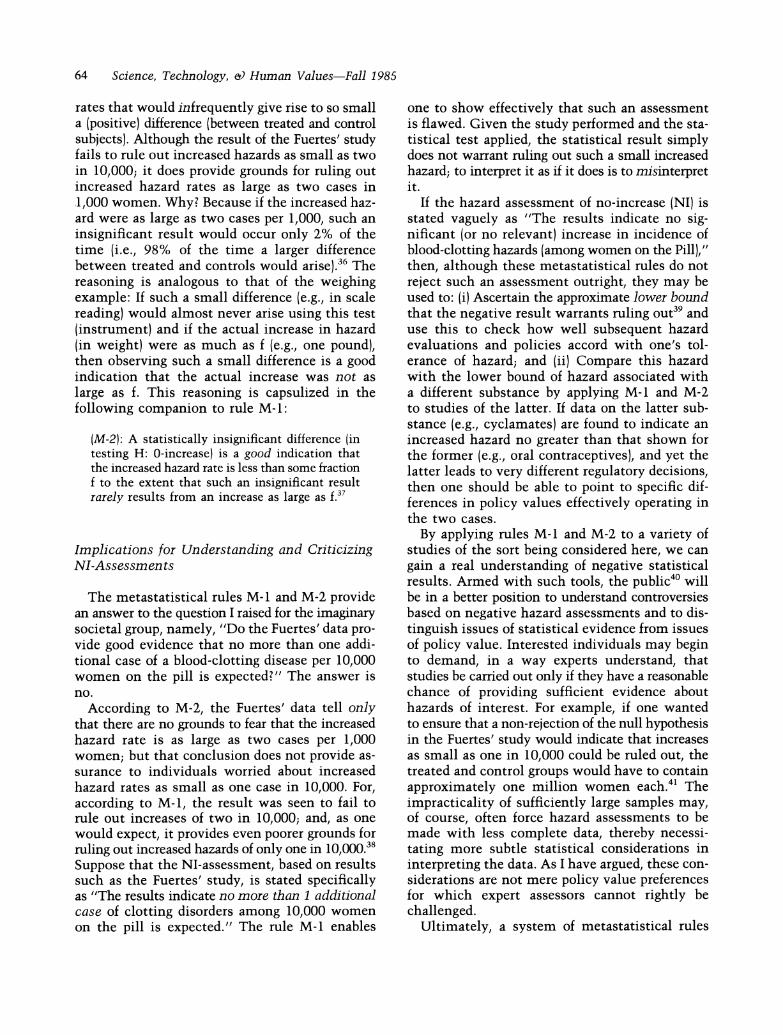
rates that would infrequently give rise to so small a (positive) difference (between treated and control subjects). Although the result of the Fuertes' study fails to rule out increased hazards as small as two in 10,000; it does provide grounds for ruling out increased hazard rates as large as two cases in 1,000 women. Why? Because if the increased haz- ard were as large as two cases per 1,000, such an insignificant result would occur only 2% of the time (i.e., 98% of the time a larger difference between treated and controls would arise).36 The reasoning is analogous to that of the weighing example: If such a small difference (e.g., in scale reading) would almost never arise using this test (instrument) and if the actual increase in hazard (in weight) were as much as f (e.g., one pound), then observing such a small difference is a good indication that the actual increase was not as large as f. This reasoning is capsulized in the following companion to rule M-l:
(M-2): A statistically insignificant difference (in testing H: O-increase) is a good indication that the increased hazard rate is less than some fraction f to the extent that such an insignificant result rarely results from an increase as large as f.37
Implications for Understanding and Criticizing NI-Assessments
The metastatistical rules M-1 and M-2 provide an answer to the question I raised for the imaginary societal group, namely, "Do the Fuertes' data pro- vide good evidence that no more than one addi- tional case of a blood-clotting disease per 10,000 women on the pill is expected?" The answer is no.
According to M-2, the Fuertes' data tell only that there are no grounds to fear that the increased hazard rate is as large as two cases per 1,000 women; but that conclusion does not provide as- surance to individuals worried about increased hazard rates as small as one case in 10,000. For, according to M-l, the result was seen to fail to rule out increases of two in 10,000; and, as one would expect, it provides even poorer grounds for ruling out increased hazards of only one in 10,000.38 Suppose that the NI-assessment, based on results such as the Fuertes' study, is stated specifically as "The results indicate no more than 1 additional case of clotting disorders among 10,000 women on the pill is expected." The rule M-1 enables
one to show effectively that such an assessment is flawed. Given the study performed and the sta- tistical test applied, the statistical result simply does not warrant ruling out such a small increased hazard; to interpret it as if it does is to misinterpret it.
If the hazard assessment of no-increase (NI) is stated vaguely as "The results indicate no sig- nificant (or no relevant) increase in incidence of blood-clotting hazards (among women on the Pill)," then, although these metastatistical rules do not reject such an assessment outright, they may be used to: (i) Ascertain the approximate lower bound that the negative result warrants ruling out39 and use this to check how well subsequent hazard evaluations and policies accord with one's tol- erance of hazard; and (ii) Compare this hazard with the lower bound of hazard associated with a different substance by applying M-1 and M-2 to studies of the latter. If data on the latter sub- stance (e.g., cyclamates) are found to indicate an increased hazard no greater than that shown for the former (e.g., oral contraceptives), and yet the latter leads to very different regulatory decisions, then one should be able to point to specific dif- ferences in policy values effectively operating in the two cases.
By applying rules M-1 and M-2 to a variety of studies of the sort being considered here, we can gain a real understanding of negative statistical results. Armed with such tools, the public40 will be in a better position to understand controversies based on negative hazard assessments and to dis- tinguish issues of statistical evidence from issues of policy value. Interested individuals may begin to demand, in a way experts understand, that studies be carried out only if they have a reasonable chance of providing sufficient evidence about hazards of interest. For example, if one wanted to ensure that a non-rejection of the null hypothesis in the Fuertes' study would indicate that increases as small as one in 10,000 could be ruled out, the treated and control groups would have to contain approximately one million women each.41 The impracticality of sufficiently large samples may, of course, often force hazard assessments to be made with less complete data, thereby necessi- tating more subtle statistical considerations in interpreting the data. As I have argued, these con- siderations are not mere policy value preferences for which expert assessors cannot rightly be challenged.
Ultimately, a system of metastatistical rules
Mayo: Increasing Public Participation 65
may be formulated not only for the assessment of no-increased hazard but also for other types of statistical claims upon which public policies are often based.42 Such metastatistical rules would require information from a great many areas, and hence formulating such rules is a task uniquely suited to the interdisciplinary study of science and society. By taking on this task, such in- terdisciplinary studies would begin to serve the important function of increasing the public's understanding of, and ability to resolve, policy controversies having serious consequences for society.
Acknowledgments-I am grateful to the following individuals for their very helpful comments on earlier drafts of this paper: Richard Burian, George Chatfield, Baruch Fischoff, Ronald Giere, Norman Gilinsky, I.J. Good, Rachel Laudan, and Harlan Miller.
Notes
1. Science, Technology, & Human Values, Volume 9 (Winter 1984): 14-183.
2. A number of empirical studies are often taken to show the cognitive limitations of laypersons in grasping statistical complexities (e.g., Amos Tversky and Daniel Kahneman, "Judgment Under Uncer- tainty: Heuristics and Biases," Science, Volume 185 (27 September 1974): 1124-1131). Whatever evidence these studies provide of existing defi- ciencies, they do not apply to the educational tools I propose. On the contrary, closer scrutiny of these studies reveals that the poor performance of those studied is largely due to the lack of information at their disposal. See Baruch Fischoff, Sara Lich- tenstein, Paul Slovic, S. Derby, and R. Keeney, Acceptable Risk (Cambridge, England: Cambridge University Press, 1981), Chapters 2 and 9. Also see note 19.
3. In distinguishing these three stages, I am following the conceptual distinctions made, for example, by Howard Raiffa, "Science and Policy: Their Sepa- ration and Integration in Risk Analysis," The American Statistician, Volume 36, Number 3, Part 2 (August 1982): 225-231, as Chairman of the Committee on Risk and Decision Making. Finer distinctions, such as that between hazards and risks, will not be needed for the present discussion.
4. N.J. Eastman, "Report of the Task Force on Thromboembolic Disease," in Food and Drug Ad- ministration: Report on the Oral Contraceptives (1 August 1966), p. 19. Emphasis added.
5. P.E. Sartwell, et al., "Report of the Task Force on Thromboembolic Disorders," in Food and Drug Administration: Second Report on the Oral Con- traceptives (1 August 1969), p. 29.
6. Advisory Committee on Obstetrics and Gynecology, FDA: Report on the Oral Contraceptives (1 August 1966): 13. Emphasis added.
7. Advisory Committee on Obstetrics and Gynecology, FDA: Second Report on the Oral Contraceptives (1 August 1969): 9. The Committee notes (p. 8) that "nowhere do they [the Kefauver-Harris Amendments of 1962] define safety .... Therefore, evaluating safety of a drug requires weighing benefit against risk."
8. Raiffa, op. cit., p. 228. Emphasis added. 9. Harvey Brooks, "The Resolution of Technically
Intensive Public Policy Disputes," Science, Tech- nology, & Human Values, Volume 9 (Winter 1984): 47. Brooks makes the useful suggestion that "by requiring each side in a controversy to specify in advance what type of experiment or evidence or analysis would convince them to alter their policy position" {p. 42) a key step toward understanding and possibly resolving the controversy is taken. The metastatistical rules I suggest may be used to carry this out.
10. Helen Longino discusses how the case of oral con- traceptives illustrates this in "Beyond 'Bad Science': Skeptical Reflections on the Value-Freedom of Sci- entific Inquiry," Science, Technology, &) Human Values, Volume 8 (Winter 1983): 15.
11. Fischoff et al., op. cit., (note 2), p. 148. This book is a notable exception to the tendency to downplay technical tools as instrumental for increasing public participation. The authors stress that "to participate responsibly, the public needs to understand those tools" (p. 149) used by the technical experts; and they offer a number of valuable arguments and recommendations.
12. Members of the statistics profession, well aware of the mistrust of statistics by the public, have sought to improve its image by devising an explicit ethical code, Ethical Guidelines for Statistical Practice. These guidelines, their history and the reactions of a number of well known statisticians to their implementation, are discussed in The American Statistician, Volume 37, Number 1 (Feb- ruary 1983): 1-20. This discussion offers rare insights regarding how better to hold statistical hazard as- sessors accountable.
13. Ted Greenwood, "The Myth of Scientific Incom- petence of Regulatory Agencies," Science, Tech- nology, & Human Values, Volume 9 (Winter 1984): 83-96.
14. Marcel C. La Follette, "Forging the Links," Science, Technology, & Human Values, Volume 9 (Winter 1984): 6.
15. Marc Roberts, Stephen Thomas, and Michael
United States Concerning the Relationship of Thromboembolic Disease to Oral Contraceptives," in J. Sciarra, G. Zatuchni, and J. Speidel, eds. Risks, Benefits, and Controversies in Fertility Control (Hagerstown, MD: Harper &t Row, 1978), p. 123.
21. A. Fuertes-De La Haba, Jo Curet, I. Pelegrina, I. Bangdiwala, "Thrombophlebitis Among Oral and Nonoral Contraceptive Users," Obstetrics and Gynecology, Volume 38, Number 2 (August 1971): 259-263. I have chosen to focus on the Fuertes' study because (1) it was one of very few prospective studies available at the time [since prospective studies enable more control of other variables that may be responsible for the effect than do retro- spective ones (where one observes after-the-fact cases with the effect), they are desirable for making causal inferences], and (2) it had a larger sample size than other negative studies at the time, leading to its being cited in arguments against the alleged link between the pill and blood-clotting. Also see note 24.
22. For a good discussion of comparative random ex- periments see S. Anderson et al., Statistical Methods for Comparative Studies (New York: John Wiley, 1980).
23. The actual results of the Fuertes' study were as follows:
With In Incidence Group thrombophlebitis study per 1000
Oral 9 4,965 1.81 Control 8 4,933 1.62
66 Science, Technology, & Human Values-Fall 1985
Dowling, "Mapping Scientific Disputes That Affect Public Policymaking," Science, Technology, & Human Values, Volume 9 (Winter 1984): 120.
16. A classic sourcebook on this controversy as it arises in the social sciences is D.E. Morrison and R.E. Henkel, eds., The Significance Test Controversy- A Reader (Chicago, IL: Aldine, 1970). For an in- troduction to the basic concepts of conflicting phi- losophies of statistics that is rigorous but accessible to non-statisticians, see Vic Barnett, Comparative Statistical Inference (New York: Wiley, 1973). A claim for which I have argued elsewhere is that the criticism raised against orthodox statistical methods rest on either misinterpretations or on question-begging assumptions. See, for example, Deborah Mayo, "On After-Trial Criticism of Ney- man-Pearson Theory of Statistics," in Philosophy of Science Association 1982, Volume One, Peter D. Asquith and Tom Nickles, eds. (East Lansing, MI: Philosophy of Science Association, 1982), pp. 145-158.
17. This philosophical argument is the focus of Deborah Mayo, "An Objective Theory of Statistical Testing," Synthese, Volume 57, Number 3 (December 1983): 297-340. I claim the argument is based on an overly narrow conception of objectivity, and defend what I consider a more appropriate conception. I provide general rules for objectively interpreting statistical reports, including those in the present paper, and the mathematics underlying them.
18. Larry Laudan first convinced me that this question, and consequently, the metastatistical rules I propose as a means of answering it, are empirical. In calling them empirical I mean only that they involve facts about certain types of planned physical experiments. Given these facts, it seems to me that these rules may more properly be termed epistemological.
19. First, questions posed in "attitude elicitation stud- ies" generally involve statistical and decision-the- oretic ideas and assumptions. Such questions sometimes take the form: "To avoid some risk (say, 1/106 increased chance of cancer) would you be willing to pay $1? $2? $3?, etc." Even if one were versed in thinking about such small proba- bilities and in terms of such trade-offs, it is far from clear that one's actual attitude toward a given risk would be elicited by means of the highest amount one is (or claims to be) willing to pay to avoid it. Second, such value elicitation studies are themselves statistical affairs, often found to be rife with biased questions and statistical fallacies. For an excellent review of value-elicitation studies with respect to these two points, see Baruch Fischoff, Paul Slovic, and Sara Lichtenstein, "Lay Foibles and Expert Fables in Judgments About Risk," The American Statistician, Volume 36, Number 3, Part 2 (August 1982): 240-255.
20. Paul David Stolley, "A Review of Data From the
Total 17 9,898 1.72
Simplifying the treated and control groups to 5,000 each does not distort the present discussion or the statistics.
24. To assure that the treated and control women in this study were sufficiently homogeneous with re- spect to the chance of suffering a blood-clotting disorder, the researchers tested a series of null hy- potheses: the two groups do not significantly differ with respect to year of admission, with respect to age, number of pregnancies, last school year com- pleted, income, years of marriage and other factors thought to be relevant to clotting disorders. They note that "when these factors were correlated for both the oral and control groups, there was no significant difference between the two groups." Fuertes et al., op. cit., p. 262. My interest here is not with the question of whether all relevant vari- ables were controlled for, but with showing that evidence for control amounts to a series of negative statistical results.
25. The null hypothesis is simple in that it specifies a single value for the difference in incidence rates, namely, zero. The alternative hypothesis is com-
Mayo: Increasing Public Participation 67
posite as it consists of the set of positive increases in incidence rates.
26. Thomas O. McGarity, "Judicial Review of Scientific Rulemaking," Science, Technology, & Human Values, Volume 9 {Winter 1984): 101.
27. This construal has been developed most system- atically by Oscar Kempthome. See Oscar Kemp- thome and Leroy Folks, Probability, Statistics, and Data Analysis {Ames, IA: Iowa State University Press, 1971 ) Chapter 9.
28. To calculate the significance level of a difference (from H), one standardizes it. The observed dif- ference standardized equals
observed difference (in incidence) - difference hy- pothesized by H (i.e., 0) expected deviation between observed and hypoth- esized differences (assuming H)
where the expected deviation in the denominator is measured in standard deviation units. If it is assumed that H is true (and the p-level is always calculated under this assumption) then the treated and control groups may be seen as samples from the same population with respect to the mean in- cidence of clotting disorders in this population. So, this population mean can be estimated by combining the numbers effected in both groups to get the total fraction effected, abbreviated E. Then the standard deviation is estimated as: [E(1 - E) (4/N)]1/2 where N is the total number of samples from both groups. In the Fuertes' study, N = 10,000; E = 17/10,000, and so the standard deviation unit equals 4/5000. Thus, the observed difference (which is 1/5000) when standardized, is 1/4. See note 23. The question: What is the p-level of the observed difference (1/5000) can now be stated as: How often does a difference in excess of the hypothesized difference (under H) by as much as 1/4 standard deviations occur, assuming null hypothesis H is true? The answer, as provided in standard (Normal) statistics tables, is 40% of the time.
29. McGarity, op. cit., p. 98. 30. Sartwell, et al., op. cit., p. 28. Here the null hy-
pothesis asserted that there was no increased risk of blood-clotting disorders with the duration of use of the pill. The data was from a retrospective study.
31. For a non-technical discussion of their controversial experiments, see Bernard Jaffe, Michelson and the Speed of Light (New York: Anchor Books, Science Studies Series, 1960).
chance J? is <^\ asserted ^^<^50% \ erroneously \\\\\\\\\\\
| observed | |
32. The problem of insufficiently sensitive tests is par- ticularly acute in the area of hazard assessments. Hazard effects often occur with only a low incidence, and they typically come about from a number of causes. As a result, to detect the small increases in hazards about which one is interested, very large sample sizes are required. Because such large sam- ples are often impracticable, negative statistical results are often misleading. For an excellent il- lustration of this problem in testing suspected car- cinogens, see FDA Advisory Committee on Pro- tocols for Safety Evaluation, "Panel on Carcinogenesis Report on Cancer Testing in the Safety Evaluation of Food Additives and Pesticides," Toxicology and Applied Pharmacology, Volume 20 {August 1971): 419-438. Also see note 42.
33. A.W.F. Edwards, "Science, Statistics, and Society," Nature, Volume 233 (3 September 1971): 18.
34. This can be seen without any calculations. Label the supposition here as (alternative) hypothesis J?: The increased incidence of hazard is 2 cases per 10,000 women. Note that if J? is true, then the observed difference in the Fuertes' study does not deviate at all from the outcome hypothesized by J? (i.e., both are 2/10,000). [Equivalently, the ob- served increase equals the population increase hy- pothesized in J?.] But it is known that 50% of the possible sample differences from a population will be less than (or equal to) the mean increase in the population. This can be visualized as the proportion of the possible samples to the left of the population increase J?, if j? were true:
35. This suggests a very easy way to begin scrutinizing a statistically insignificant difference from H (zero- increase): The observed insignificant difference is not a good indication that the particular (insignif- icant) difference observed provides an upper bound for the actual (but unknown) increased incidence of hazard. For, were it to be taken as an upper bound, that is, as a negative result ruling out all increases larger than the observed difference, it would lead to false negatives 50% of the time. See explanation of 50% in note 34.
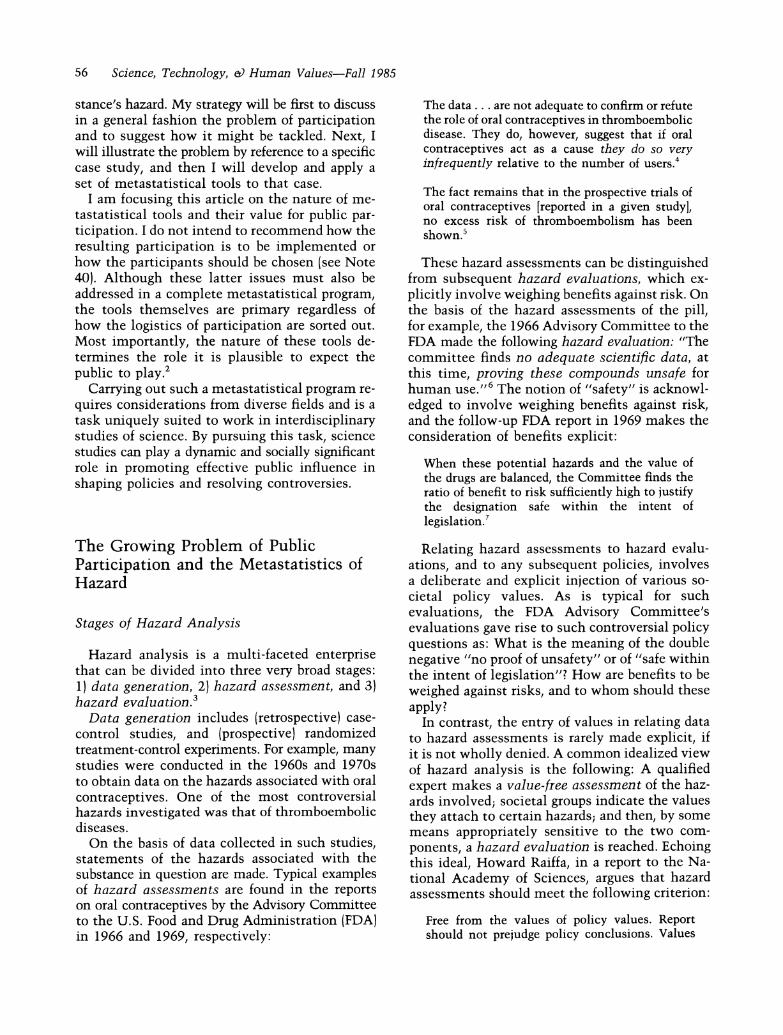
36. To see why the frequency of such a false negative is 2%, label the supposition here (alternative) hy- pothesis J + 2: The increased incidence of hazard among treated women is 2 cases per 1,000 women, on average. And suppose that the incidence rate among controls, is, on average, close to the cbserved rate in the control group, i.e., 8/5000. Then the observed difference, 0.0002, would be less than the
J? (general): the increased (population) incidence does not exceed the ob- served difference (in hazardl
68 Science, Technology, & Human Values-Fall 1985
difference hypothesized in J + 2 (0.002) by 2 standard deviation units. And the statistical distribution tells us in general that: Only 2% of the possible (positive) sample differences are 2 or more standard deviation units to the left of the actual population increase. Thus, if J + 2 were true, such insignificant results as the one observed would occur only 2% of the time.
37. Someone may ask whether the specification of "rarely" in M-2 (and for "frequently" in M-l) does not allow, if not require, the entry of value con- siderations in the interpretation of test results- vitiating my claims for the objectivity of these rules. My answer is two-fold: First, one need not select a specific value for "rarely" or "frequently" to use M-1 and M-2 qualitatively; i.e., to assert that a result is a better or a worse indication of one or another increase. Second, the specification of values like 0.15 for "fairly rare" and 0.02 for "very rare," can be justified by the fact that they provide a standard way of understanding and com- paring the size of increase that negative (statistical) results begin to rule out-as opposed to those clearly not ruled out. They correspond to asserting that an observed insignificant difference is a fairly good indication that J + 1: f is less than 1 standard deviation in excess of the observed difference; and that it is a very good indication that J + 2: f is less than 2 standard deviations in excess of the observed difference. While such choices for "rarely" reflect the value placed on learning the actual in- creased hazard, and avoiding erroneous assertions about the extent of hazard, these are epistemological and scientific values, not policy values.
38. To assert that an observed difference indicates an increased risk no greater than the observed difference would lead to false negatives 50% of the time (see notes 34 and 35). Thus, to claim it rules out even smaller increases would lead to false negatives more than 50% of the time!
39. Corresponding to 0.15 and 0.02 as "rarely" in M-2, for example, are the lower bounds, 1 and 2 standard deviations in excess of the observed dif- ference. See note 37.
40. In practice it is likely to be various representatives of the public who would actually be involved in applying these tools. What matters is that as a result, the possibility of scrutinizing statistical hazard assessments would become open to any in- terested individuals.
chance J + 2 is asserted 2 % \ erroneously \\.. x
41. If the negative result is required to be as insignificant {p-level 0.4) as the Fuertes' data, 1/2 million in each group would suffice for ruling out increases in hazard greater than 1/10,000. i.e., Such a result would indicate that 1/10,000 is a reasonable lower bound (using approximately 0.02 for "rarely" in M- 2). See note 39. For an explanation of how to cal- culate lower bounds from negative experiments in which the treated and control groups are observed to have the same incidence of the hazard, see FDA Advisory Committee on Protocols for Safety Eval- uation, op. cit., (note 32), p. 430-432. They provide a useful chart of the lower bounds ruled out even by so extreme a negative result (zero difference observed) for various sample sizes. If such charts were made available to the public along with meta- rules like M-1 and M-2, it would be very easy to grasp the approximate increased hazard ruled out by a negative result with a given sample size. It is just the observed difference added to the charted lower bound.
42. The pill was originally marketed on the basis of a study of only 132 women. That a negative result from so insensitive a study fails to provide grounds for a no (significant) hazard assessment is, and should have been, apparent. Unfortunately, flagrant misinterpretations of data are still common. A re- mark by the statistician Irwin Bross, in commenting on the Ethical Guidelines for Statistical Practice (op. cit. note 12, p. 13) merits quoting in full:
It has become government policy to allege that an agency's positions are supported by its statis- tical reports even when, in fact, the agency's own data refute the claims. Recently I have reanalyzed (with simple, standard statistical methods) a series of government reports on technogenic health hazards that claimed that there was no evidence of excess risk. In every case there was clear, sta- tistically significant evidence of hazardmat Love Canal, Three Mile Island, ... in the children of Japanese A-bomb victims, and elsewhere ....
What is so striking about such cases is that they illustrate how merely being able to understand a simple statistical significance test can make the difference between a correct and an incorrect de- cision about hazards with possibly enormous so- cietal consequences.
J+2 (general): the increased incidence does not exceed the observed dif- ference (in hazard) by more than 2 standard deviations


![243 Two Controversies Involving R’ Avraham … 10 Landerer.pdfTwo Controversies Involving R’ Avraham Yitzchak HaKohen Kook : 247 from the aforementioned rabbi [i.e., R’ Kook],15](https://img.pdfslide.us/doc/110x75/5af57b1c7f8b9a8d1c8da27a/243-two-controversies-involving-r-avraham-10-landererpdftwo-controversies.jpg)