Embed Size (px)
Citation preview
Increasing Labour Income Share in MalaysiaHow, why, and is it good?
Allen Ng
20 November 2017
Fifth Annual Bank Negara Malaysia Economics Research Workshop

2
‘It was known for some time that the share of wages and share of profits in the national income has shown a remarkable constancy…’
Nicholas Kaldor, 1957
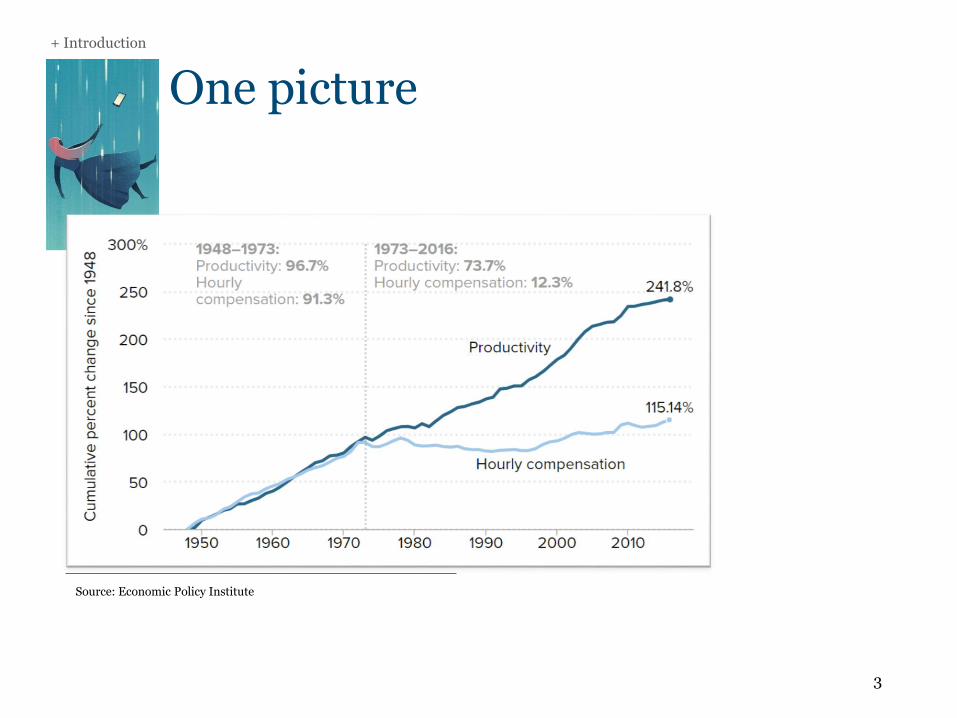
One picture+ Introduction
3
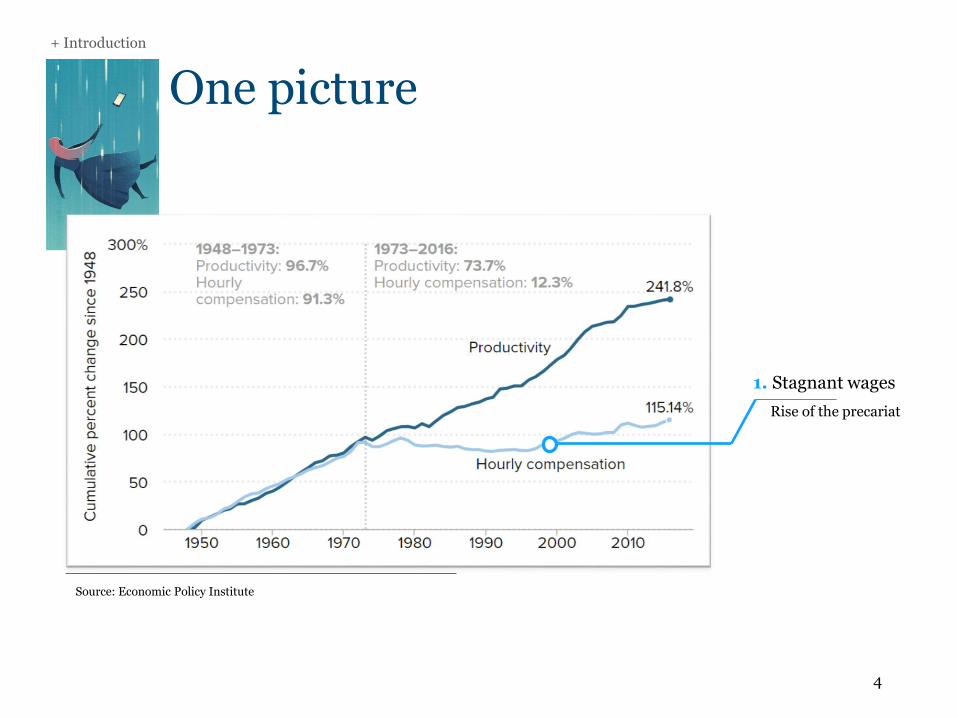
Source: Economic Policy Institute
One picture+ Introduction
4
Source: Economic Policy Institute
1. Stagnant wages
Rise of the precariat
One picture+ Introduction
5
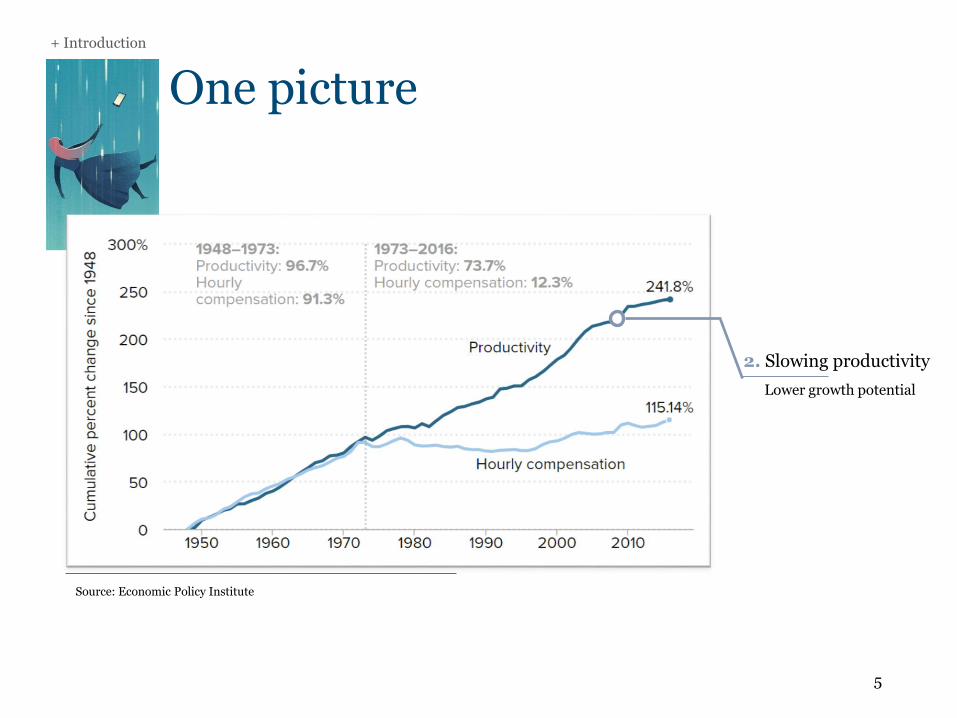
Source: Economic Policy Institute
2. Slowing productivity
Lower growth potential
One picture+ Introduction
6
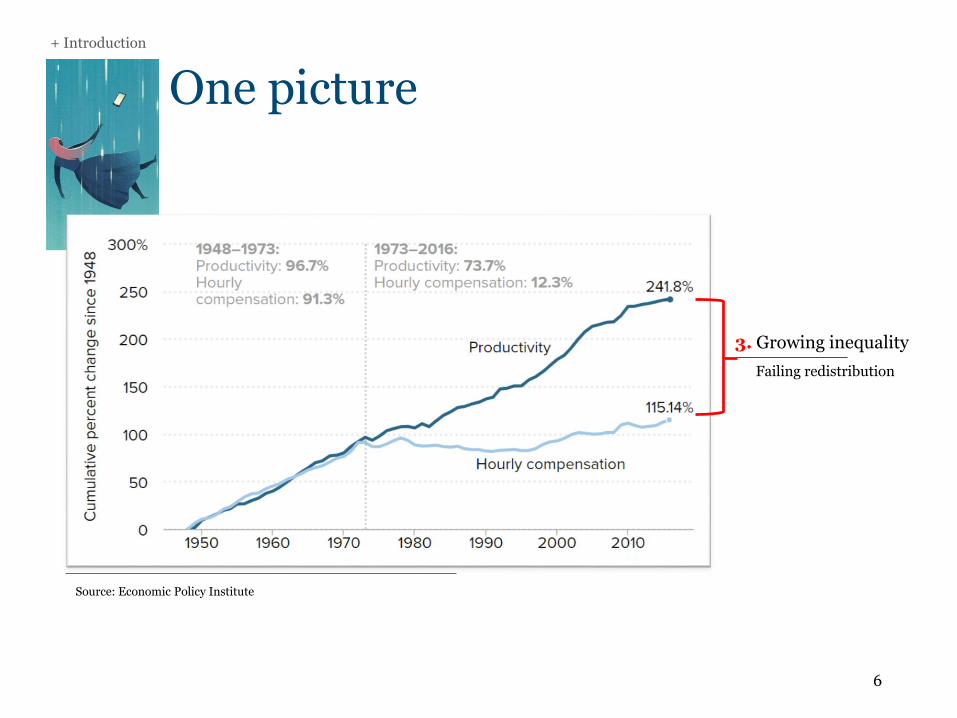
Source: Economic Policy Institute
3. Growing inequality
Failing redistribution
Counter-trend+ Introduction
7
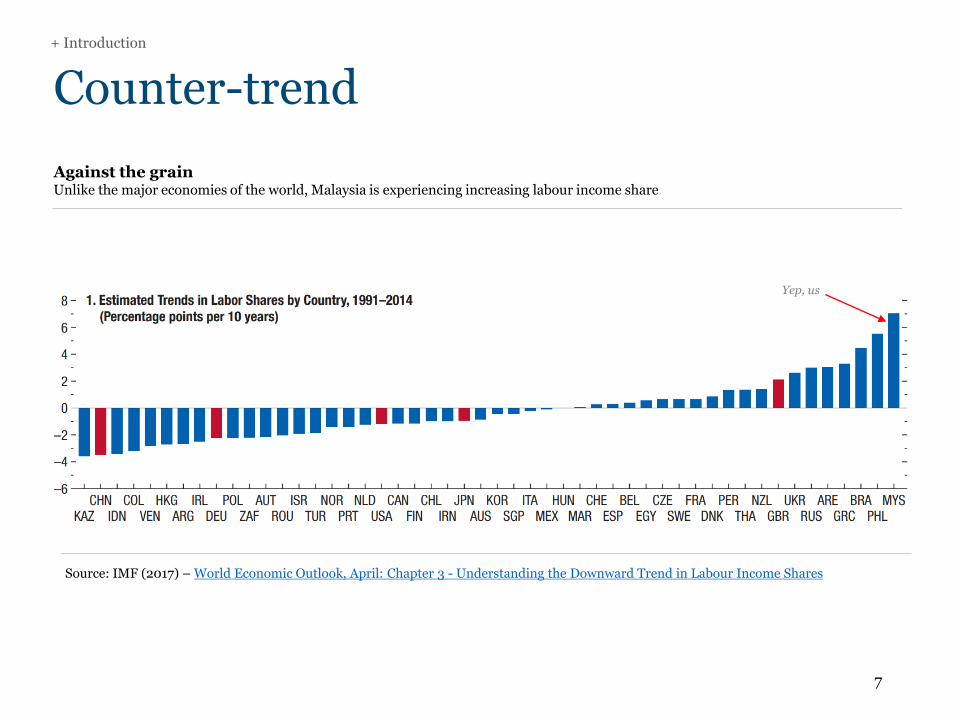
Against the grainUnlike the major economies of the world, Malaysia is experiencing increasing labour income share
Source: IMF (2017) – World Economic Outlook, April: Chapter 3 - Understanding the Downward Trend in Labour Income Shares
Yep, us
How has LIS increased?ContentsWhy has LIS increased?
Implications - is it good?
8
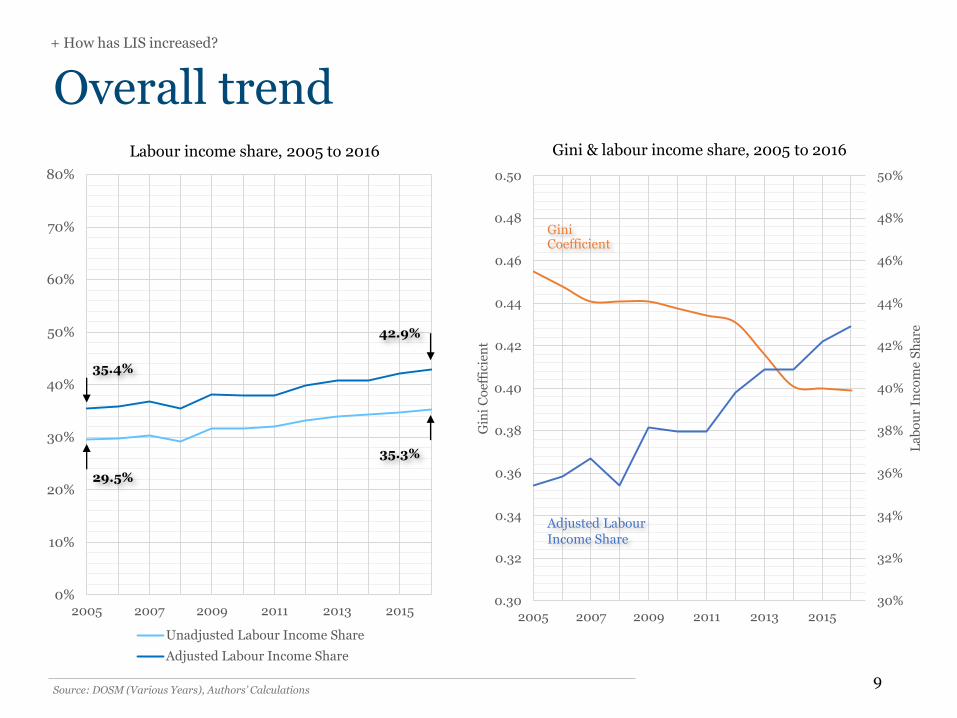
Overall trend+ How has LIS increased?
9
0%
10%
20%
30%
40%
50%
60%
70%
80%
2005 2007 2009 2011 2013 2015
Labour income share, 2005 to 2016
Unadjusted Labour Income Share
Adjusted Labour Income Share
29.5%
35.4%
Source: DOSM (Various Years), Authors’ Calculations
42.9%
35.3%
30%
32%
34%
36%
38%
40%
42%
44%
46%
48%
50%
0.30
0.32
0.34
0.36
0.38
0.40
0.42
0.44
0.46
0.48
0.50
2005 2007 2009 2011 2013 2015
La
bo
ur
Inco
me
Sh
are
Gin
i C
oef
fici
ent
Gini Coefficient
Gini & labour income share, 2005 to 2016
Adjusted LabourIncome Share
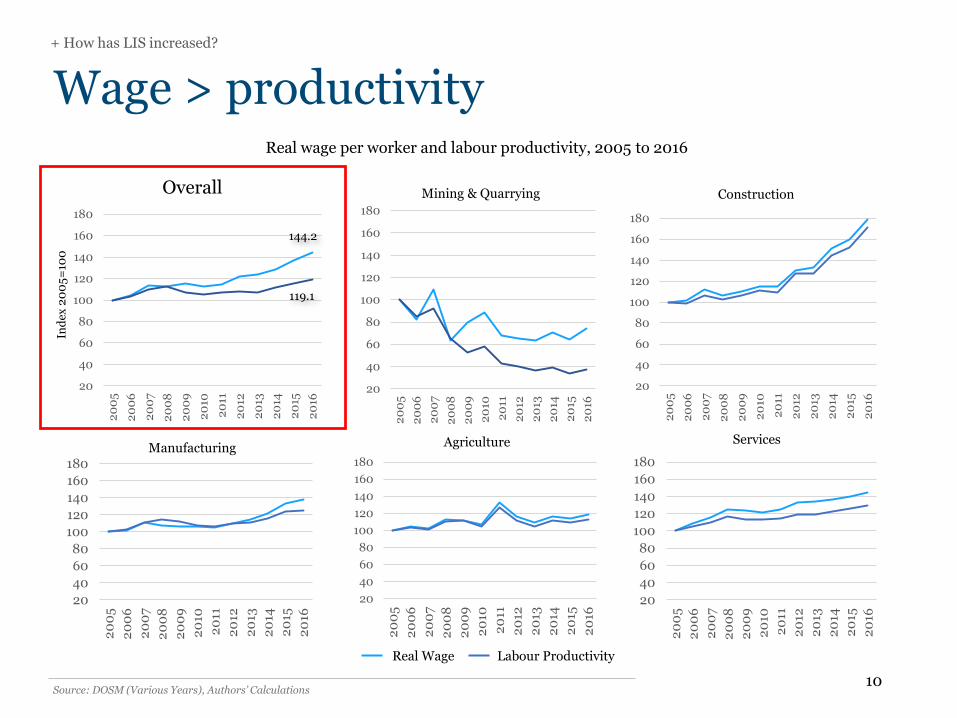
Wage > productivity+ How has LIS increased?
10Source: DOSM (Various Years), Authors’ Calculations
Real wage per worker and labour productivity, 2005 to 2016
20
40
60
80
100
120
140
160
180
20
05
20
06
20
07
20
08
20
09
20
10
20
11
20
12
20
13
20
14
20
15
20
16
Agriculture
20
40
60
80
100
120
140
160
180
20
05
20
06
20
07
20
08
20
09
20
10
20
11
20
12
20
13
20
14
20
15
20
16
Manufacturing
20
40
60
80
100
120
140
160
180
20
05
20
06
20
07
20
08
20
09
20
10
20
11
20
12
20
13
20
14
20
15
20
16
Services
Labour ProductivityReal Wage
Ind
ex 2
00
5=
100
20
40
60
80
100
120
140
160
180
20
05
20
06
20
07
20
08
20
09
20
10
20
11
20
12
20
13
20
14
20
15
20
16
Construction
20
40
60
80
100
120
140
160
180
20
05
20
06
20
07
20
08
20
09
20
10
20
11
20
12
20
13
20
14
20
15
20
16
Mining & Quarrying
20
40
60
80
100
120
140
160
180
20
05
20
06
20
07
20
08
20
09
20
10
20
11
20
12
20
13
20
14
20
15
20
16
Overall
144.2
119.1
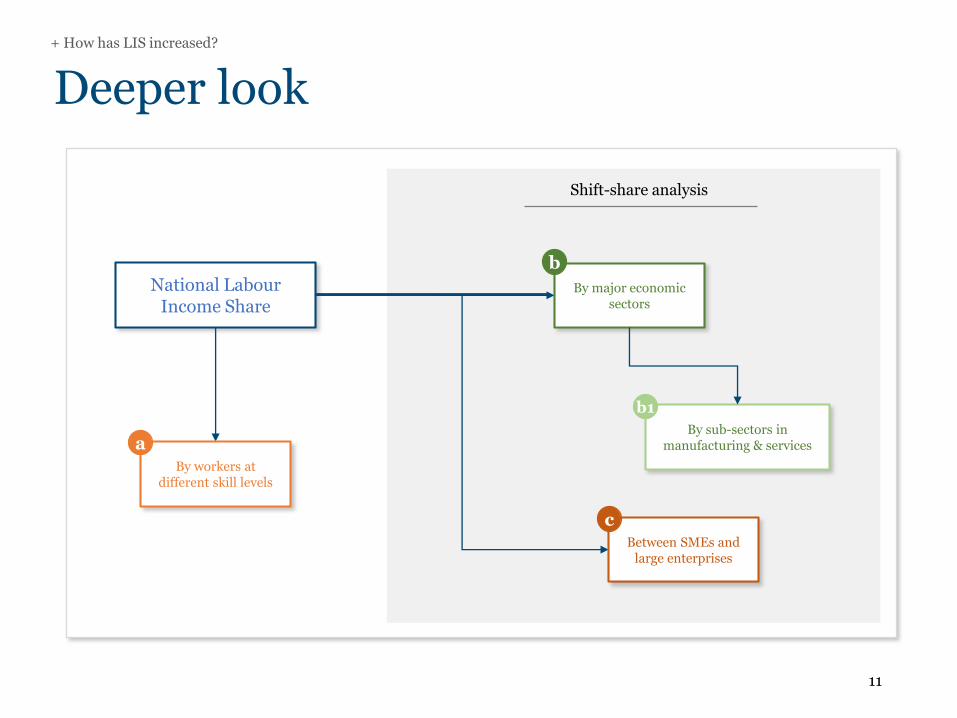
Deeper look+ How has LIS increased?
11
National LabourIncome Share
By workers at different skill levels
a
By major economic sectors
By sub-sectors in manufacturing & services
Between SMEs and large enterprises
b
b1
c
Shift-share analysis
Gain in the middle+ How has LIS increased?
12Source: DOSM (Various Years), Authors’ Calculations
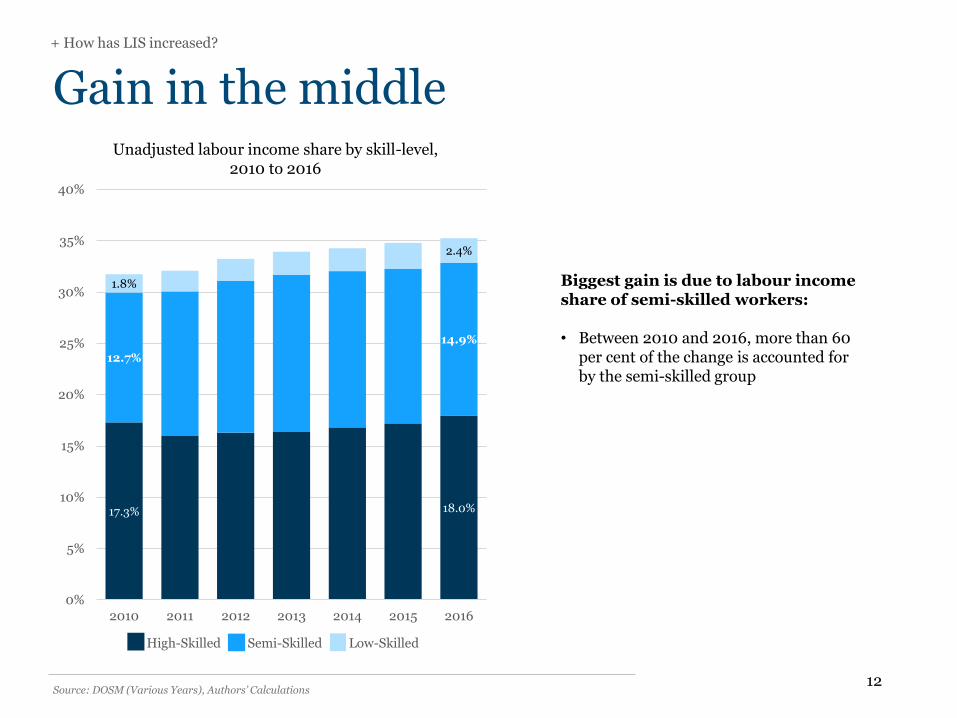
Unadjusted labour income share by skill-level, 2010 to 2016
17.3% 18.0%
12.7%
14.9%
1.8%
2.4%
0%
5%
10%
15%
20%
25%
30%
35%
40%
2010 2011 2012 2013 2014 2015 2016
High-Skilled Semi-Skilled Low-Skilled
Biggest gain is due to labour income share of semi-skilled workers:
• Between 2010 and 2016, more than 60 per cent of the change is accounted for by the semi-skilled group
Broad-based increase
Source: DOSM (Various Years), Authors’ Calculations
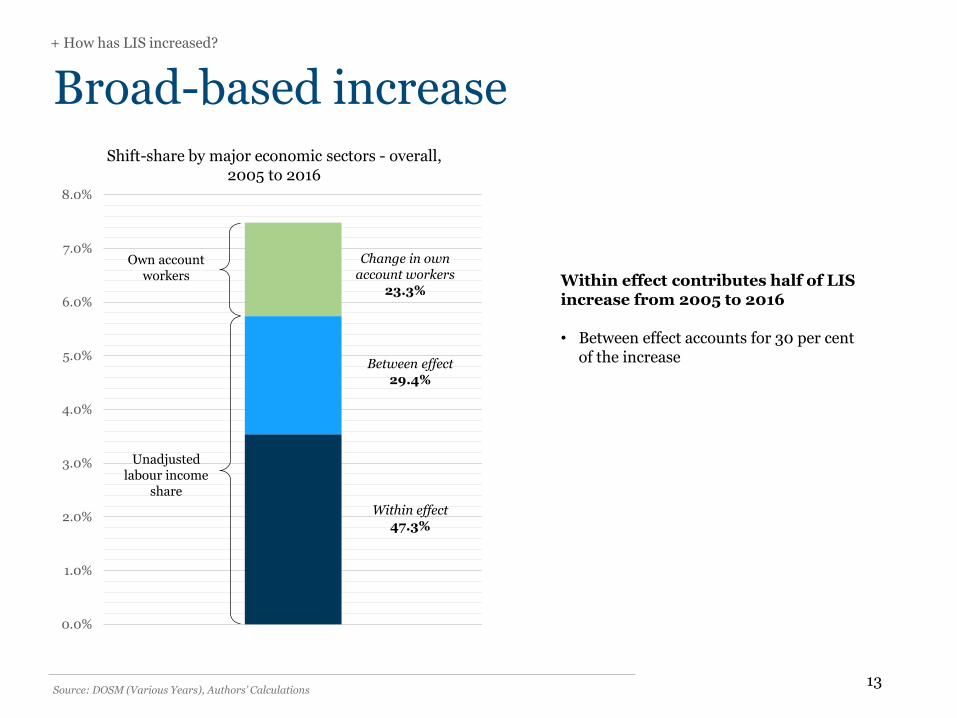
Within effect contributes half of LIS increase from 2005 to 2016
• Between effect accounts for 30 per cent of the increase
0.0%
1.0%
2.0%
3.0%
4.0%
5.0%
6.0%
7.0%
8.0%
Shift-share by major economic sectors - overall, 2005 to 2016
+ How has LIS increased?
Own account workers
Unadjusted labour income
share
Change in own account workers
23.3%
Between effect29.4%
Within effect47.3%
13

> 90% due to services+ How has LIS increased?
-0.34%
1.39%
0.08%
-1.90%
2.98%
-2.5%
-2.0%
-1.5%
-1.0%
-0.5%
0.0%
0.5%
1.0%
1.5%
2.0%
2.5%
3.0%
3.5%
4.0%
4.5%
2.24%
0.75%
0.30%0.16%0.08%
-2.5%
-2.0%
-1.5%
-1.0%
-0.5%
0.0%
0.5%
1.0%
1.5%
2.0%
2.5%
3.0%
3.5%
4.0%
4.5%
14Source: DOSM (Various Years), Authors’ Calculations
Agriculture Construction Mining & Quarrying Manufacturing Services
Shift-share by major economic sectors – within and between effects, 2005 to 2016
Within effect Between effect
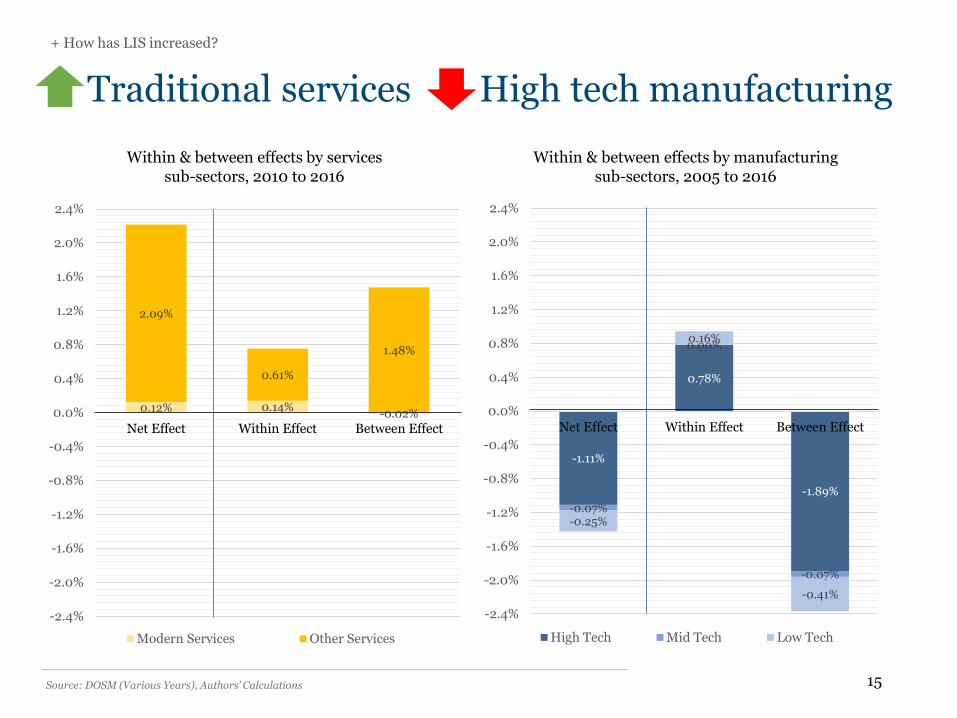
Traditional services High tech manufacturing
+ How has LIS increased?
15
Within & between effects by services sub-sectors, 2010 to 2016
0.12% 0.14%-0.02%
2.09%
0.61%
1.48%
-2.4%
-2.0%
-1.6%
-1.2%
-0.8%
-0.4%
0.0%
0.4%
0.8%
1.2%
1.6%
2.0%
2.4%
Net Effect Within Effect Between Effect
Modern Services Other Services
Source: DOSM (Various Years), Authors’ Calculations
-1.11%
0.78%
-1.89%
-0.07%
0.00%
-0.07%
-0.25%
0.16%
-0.41%
-2.4%
-2.0%
-1.6%
-1.2%
-0.8%
-0.4%
0.0%
0.4%
0.8%
1.2%
1.6%
2.0%
2.4%
Net Effect Within Effect Between Effect
High Tech Mid Tech Low Tech
Within & between effects by manufacturingsub-sectors, 2005 to 2016
Source: DOSM (Various Years), Authors’ Calculations
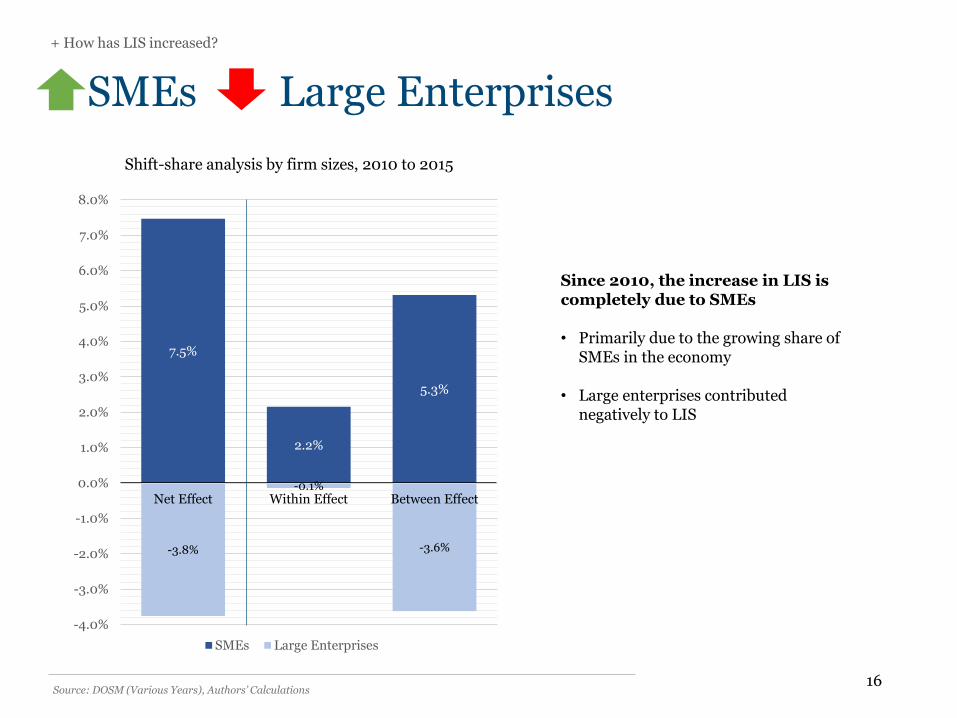
Since 2010, the increase in LIS is completely due to SMEs
• Primarily due to the growing share of SMEs in the economy
• Large enterprises contributed negatively to LIS
+ How has LIS increased?
16
Shift-share analysis by firm sizes, 2010 to 2015
7.5%
2.2%
5.3%
-3.8%
-0.1%
-3.6%
-4.0%
-3.0%
-2.0%
-1.0%
0.0%
1.0%
2.0%
3.0%
4.0%
5.0%
6.0%
7.0%
8.0%
Net Effect Within Effect Between Effect
SMEs Large Enterprises
SMEs Large Enterprises
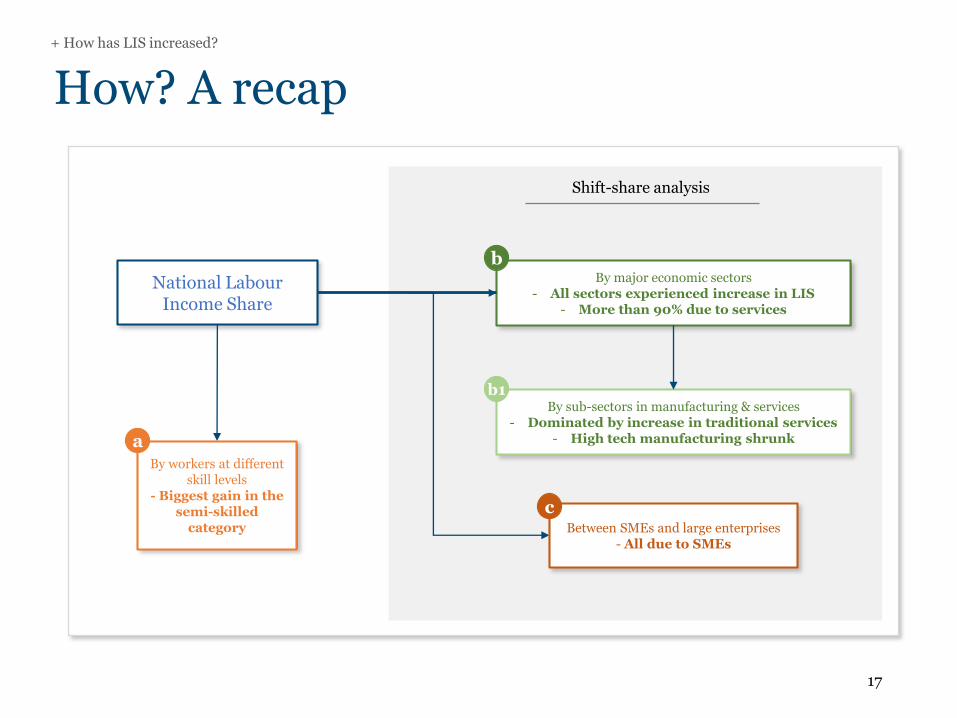
How? A recap+ How has LIS increased?
17
National LabourIncome Share
By workers at different skill levels
- Biggest gain in the semi-skilled
category
a
By major economic sectors- All sectors experienced increase in LIS
- More than 90% due to services
By sub-sectors in manufacturing & services- Dominated by increase in traditional services
- High tech manufacturing shrunk
Between SMEs and large enterprises- All due to SMEs
b
b1
c
Shift-share analysis

What could have caused this?+ Why has LIS increased?
18
TechnologyTechnology could reduce the relative cost of capital, incentivising the substitution of capital for labour
Potential common factors
TradeTrade, particularly participation in GVCs, could increase the share of capital intensive economic activities
Foreign workers (?)Abundant supply of low-skilled workers could reduce the relative cost of labour, encouraging labour-intensive production choices
Impact of production structure of the economy
Capital intensive vs
Labour intensive
Factor income shares
Change in labourincome shareWith elasticity of substitution between capital and labour above one, a more labourintensive structure will increase the share of income going to labour
Potential impact on labour productivity
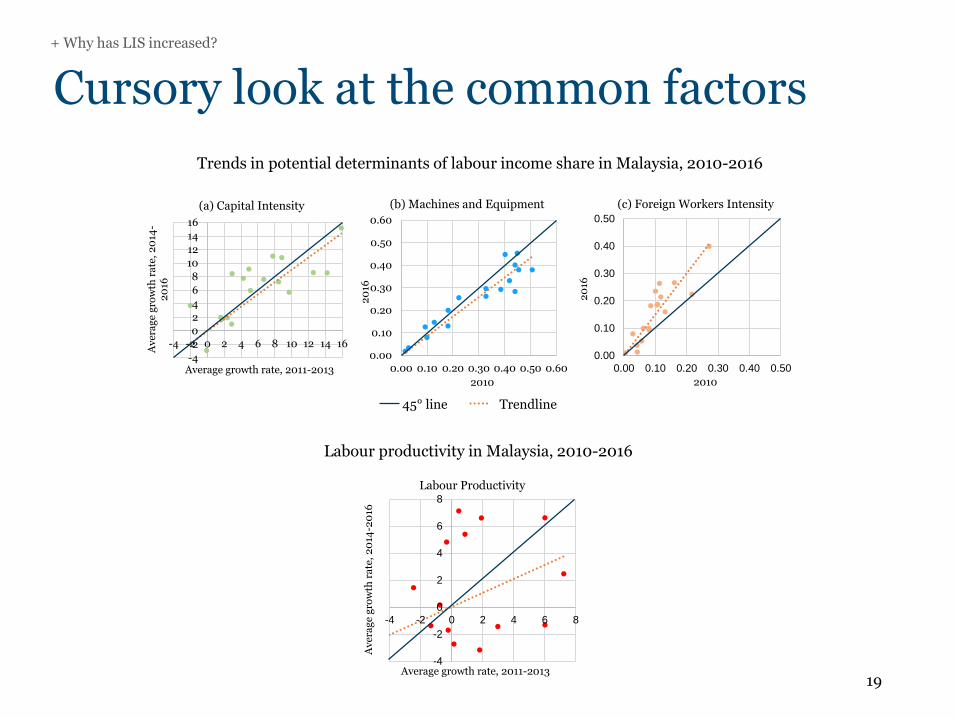
Cursory look at the common factors+ Why has LIS increased?
19
0.00
0.10
0.20
0.30
0.40
0.50
0.00 0.10 0.20 0.30 0.40 0.50
20
16
2010
(c) Foreign Workers Intensity
-4
-2
0
2
4
6
8
10
12
14
16
-4 -2 0 2 4 6 8 10 12 14 16
Av
era
ge
gro
wth
ra
te,
20
14-
20
16
Average growth rate, 2011-2013
(a) Capital Intensity
0.00
0.10
0.20
0.30
0.40
0.50
0.60
0.00 0.10 0.20 0.30 0.40 0.50 0.602
016
2010
(b) Machines and Equipment
-4
-2
0
2
4
6
8
-4 -2 0 2 4 6 8
Av
era
ge
gro
wth
ra
te,
20
14-2
016
Average growth rate, 2011-2013
Labour Productivity
Trends in potential determinants of labour income share in Malaysia, 2010-2016
Labour productivity in Malaysia, 2010-2016
Trendline45° line
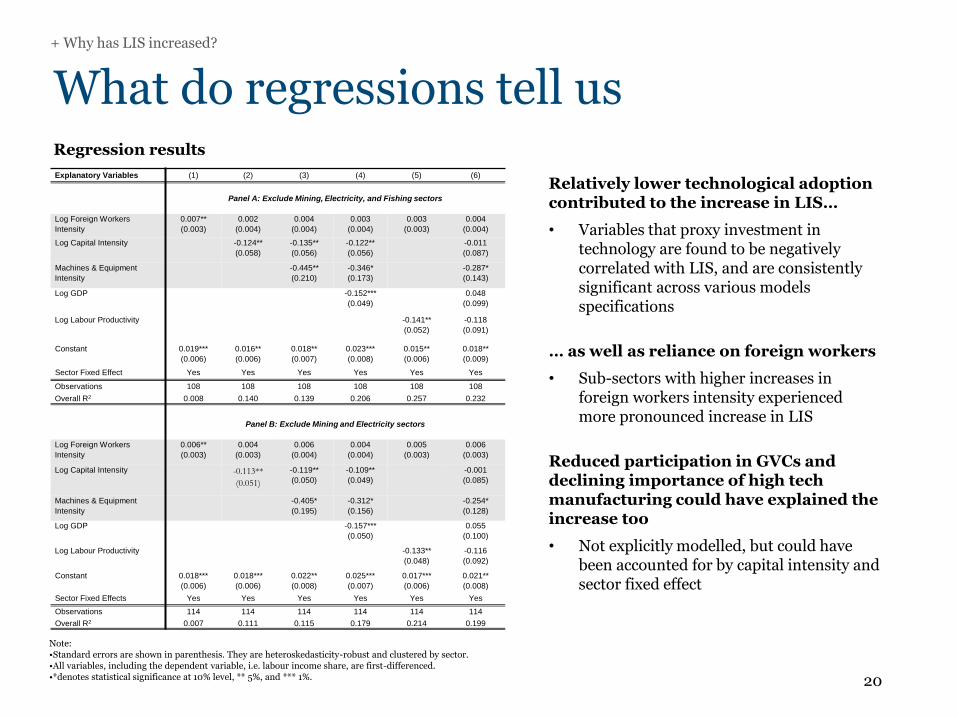
What do regressions tell us+ Why has LIS increased?
20
Relatively lower technological adoption contributed to the increase in LIS…
• Variables that proxy investment in technology are found to be negatively correlated with LIS, and are consistently significant across various models specifications
… as well as reliance on foreign workers
• Sub-sectors with higher increases in foreign workers intensity experienced more pronounced increase in LIS
Reduced participation in GVCs and declining importance of high tech manufacturing could have explained the increase too
• Not explicitly modelled, but could have been accounted for by capital intensity and sector fixed effect
Explanatory Variables (1) (2) (3) (4) (5) (6)
Panel A: Exclude Mining, Electricity, and Fishing sectors
Log Foreign Workers
Intensity
0.007**
(0.003)
0.002
(0.004)
0.004
(0.004)
0.003
(0.004)
0.003
(0.003)
0.004
(0.004)
Log Capital Intensity -0.124**
(0.058)
-0.135**
(0.056)
-0.122**
(0.056)
-0.011
(0.087)
Machines & Equipment
Intensity
-0.445**
(0.210)
-0.346*
(0.173)
-0.287*
(0.143)
Log GDP -0.152***
(0.049)
0.048
(0.099)
Log Labour Productivity -0.141**
(0.052)
-0.118
(0.091)
Constant 0.019***
(0.006)
0.016**
(0.006)
0.018**
(0.007)
0.023***
(0.008)
0.015**
(0.006)
0.018**
(0.009)
Sector Fixed Effect Yes Yes Yes Yes Yes Yes
Observations 108 108 108 108 108 108
Overall R2 0.008 0.140 0.139 0.206 0.257 0.232
Panel B: Exclude Mining and Electricity sectors
Log Foreign Workers
Intensity
0.006**
(0.003)
0.004
(0.003)
0.006
(0.004)
0.004
(0.004)
0.005
(0.003)
0.006
(0.003)
Log Capital Intensity -0.113**
(0.051)
-0.119**
(0.050)
-0.109**
(0.049)
-0.001
(0.085)
Machines & Equipment
Intensity
-0.405*
(0.195)
-0.312*
(0.156)
-0.254*
(0.128)
Log GDP -0.157***
(0.050)
0.055
(0.100)
Log Labour Productivity -0.133**
(0.048)
-0.116
(0.092)
Constant 0.018***
(0.006)
0.018***
(0.006)
0.022**
(0.008)
0.025***
(0.007)
0.017***
(0.006)
0.021**
(0.008)
Sector Fixed Effects Yes Yes Yes Yes Yes Yes
Observations 114 114 114 114 114 114
Overall R2 0.007 0.111 0.115 0.179 0.214 0.199
Note: •Standard errors are shown in parenthesis. They are heteroskedasticity-robust and clustered by sector. •All variables, including the dependent variable, i.e. labour income share, are first-differenced. •*denotes statistical significance at 10% level, ** 5%, and *** 1%.
Regression results

Conclusion
21
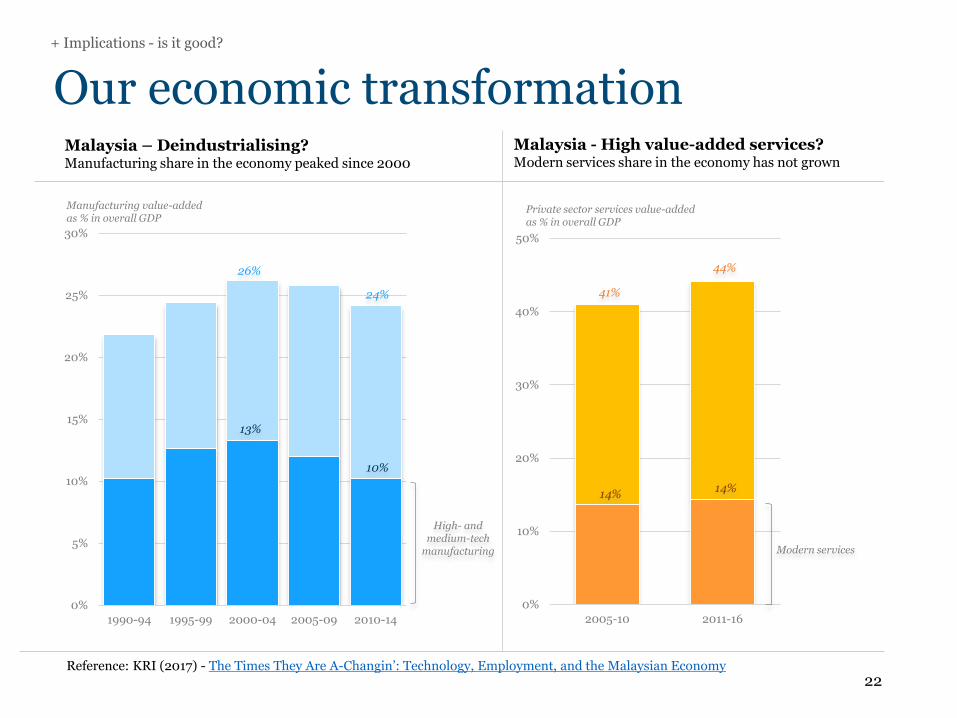
Our economic transformation+ Implications - is it good?
22
0%
5%
10%
15%
20%
25%
30%
1990-94 1995-99 2000-04 2005-09 2010-14
High- and medium-tech
manufacturing
26%
13%
24%
10%
Manufacturing value-added as % in overall GDP
Malaysia – Deindustrialising?Manufacturing share in the economy peaked since 2000
0%
10%
20%
30%
40%
50%
2005-10 2011-16
Private sector services value-added as % in overall GDP
Modern services
41%
44%
14%14%
Malaysia - High value-added services? Modern services share in the economy has not grown
Reference: KRI (2017) - The Times They Are A-Changin’: Technology, Employment, and the Malaysian Economy
Outcome of our deindustrialisation+ Implications - is it good?
23
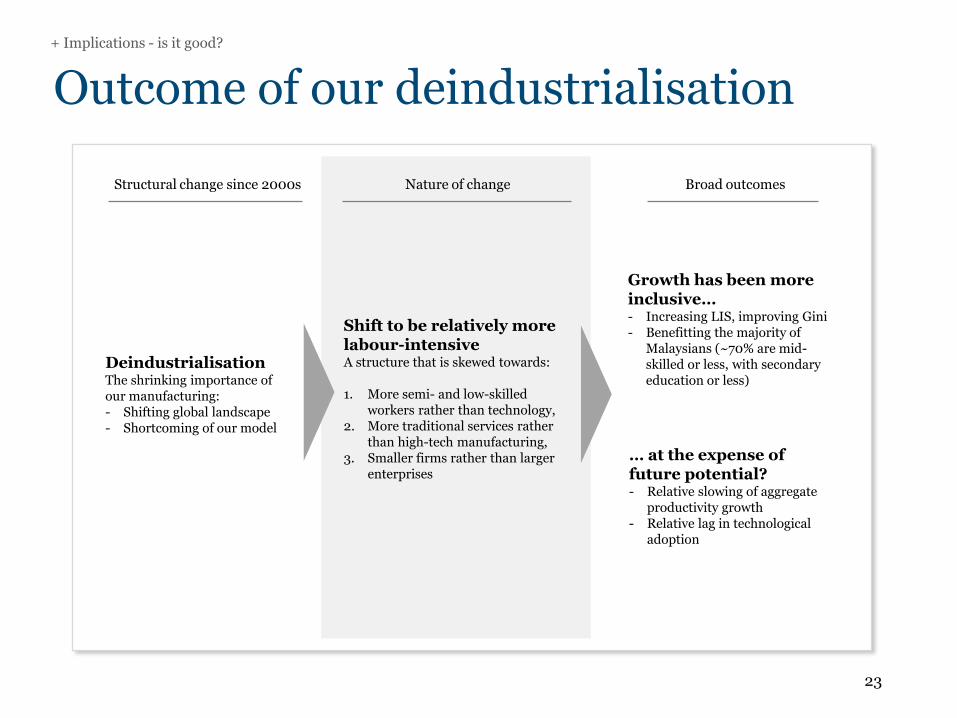
DeindustrialisationThe shrinking importance of our manufacturing:- Shifting global landscape- Shortcoming of our model
Structural change since 2000s Nature of change Broad outcomes
Shift to be relatively more labour-intensiveA structure that is skewed towards:
1. More semi- and low-skilled workers rather than technology,
2. More traditional services rather than high-tech manufacturing,
3. Smaller firms rather than larger enterprises
Growth has been more inclusive…- Increasing LIS, improving Gini- Benefitting the majority of
Malaysians (~70% are mid-skilled or less, with secondary education or less)
… at the expense of future potential?- Relative slowing of aggregate
productivity growth- Relative lag in technological
adoption
Trade-offs going forward?+ Implications - is it good?
24
This raises a number of important policy implications:
1. Promoting SMEs - Policies to raise the importance of SMEs in the economy, without significant effort to modernise them, could have an adverse impact on aggregate productivity and future growth potential of the overall economy
• SMEs create significant job opportunities – 65 per cent of all workers in Malaysia are employed by SMEs
• At the same time, SMEs are also significantly behind in terms of productivity and investment in technology. Labour productivity in large enterprises are 2.5 times higher than SMEs’
2. Enhancing technological adoption - Policies to drive technological adoption and productivity growth, without significant consideration on the impacts to jobs, could negatively impact the inclusiveness of growth
• Close to 70 per cent of all Malaysians in the workforce only have secondary education and below, and are working in low- and semi-skilled occupations
• They are at risk of being left behind without significant upskilling
3. Reducing reliance on foreign workers - Transitioning away from a labour intensive economic structure that is facilitated by the easy availability of low-skilled foreign workers could work against most Malaysians who are semi-skilled and benefit from the current structure
This paper highlights that the policies for Malaysia in moving towards an economy that is simultaneously productivity-driven and inclusive are wrought with multiple inter-linked trade-offs