Embed Size (px)
Citation preview

Samoa Labour Market Survey of Private Sector Employers
REPORT 2016

Samoa Labour Market Survey Report 2016. 1
FOREWORD BY CEO
The 2016 Labour Market Survey report of formal private employers in Samoa aims to have
comprehensive and reliable labour market information, to assist employment policy makers and
implementers so that the interests of the working population can continue to be reflected in the
national priorities and also enable planning for economic growth and full employment of locals.
The government of Samoa through the Ministry of Commerce, Industry and Labour continued to
improve the extraction and collection of labour statistics, to assist the creation of informative and
consolidated labour policies, for increasing employment opportunities in both domestic and
international labour markets. This is aligned with the objectives and goals towards development of
new Strategies as set out in the Strategy for Development of Samoa (SDSs) 2017-2020 in which
meeting set employment targets for different sectors are prioritized part of the overall national
targets.
The importance of labour statistics cannot be underestimated. The availability of labour statistics
make it easier to measure trends in the labour market, economic and social indicators, which in turn
is essential for providing necessary evidence critical for policy planning. More importantly, statistics
are critical for undertaking analysis, evaluation, and monitoring of the economy.
Samoa is currently involved in a series of negotiations at the regional, international and at global level.
Whilst engaging is such negotiations, it is critical that appropriate statistics especially of existing labour
force are taken into consideration, to enable appropriate decision making in seeking employments in
foreign markets.
To conclude, may I take this opportunity to express sincere gratitude to the employers of the formal
private sector, the business community and individuals for an endless support and commitments in
the provision of required information to MCIL staff and enumerators who were directory involved in
the implementation of the survey. We would also like to thank Mr. Stephen Musubire, Trade Adviser
(Commonwealth Secretariat Hubs and Spokes Programme) for the technical support in the
development of this report.
Samoa Labour Market Survey Report 2016. 2
Contents 1 ACRONYMS ..................................................................................................................................... 5
2 EXECUTIVE SUMMARY .................................................................................................................... 6
3 INTRODUCTION ............................................................................................................................... 8
3.1 The Survey ............................................................................................................................... 8
3.2 The Preparation ...................................................................................................................... 8
3.3 The Survey Questionnaire ....................................................................................................... 8
3.4 Training of Enumerators and Supervisors ............................................................................... 9
3.5 Methodology ........................................................................................................................... 9
3.6 Field Work ............................................................................................................................... 9
3.7 Coding ..................................................................................................................................... 9
3.8 Data Processing and Data Entry .............................................................................................. 9
3.9 Tabulation, Analysis and Reporting ...................................................................................... 10
4 THE OBJECTIVES ............................................................................................................................ 10
4.1 To identify and prioritize employment matters that are in demand, to ensure the supply
side is aligned to what is required within industries and the labour market in the formal private
sector. 10
4.2 To update the profile in the Private Sector Workforce. ....................................................... 10
4.3 To identify training needs and skill shortages of employees in the Private Sector. ............. 10
5 THE SURVEY COVERAGE ................................................................................................................ 10
6 THE SURVEY FINDINGS .................................................................................................................. 11
6.1 A general profile of the formal private sector workforce employment ............................... 11
7 WORKFORCE PROFILE BY AGE AND SEX ....................................................................................... 13
8 WORKFORCE BY INDUSTRY ........................................................................................................... 14
9 WORKFORCE PROFILE BY SKILLS AND OCCUPATIONS .................................................................. 17
10 WORKFORCE PROFILE BY CATEGORY OF WORKERS ................................................................. 19
10.1 Vacancies .............................................................................................................................. 20
10.2 Staff Turnover ....................................................................................................................... 21
10.3 Lowest Wage Payable ........................................................................................................... 23
10.4 Educational Attainment ........................................................................................................ 24
11 PUBLIC SECTOR WORKFORCE ................................................................................................... 25
11.1 Formal Sector Employment .................................................................................................. 25
12 SKILL SHORTAGES AND TRAINING NEEDS ................................................................................. 26
12.1 Skill Shortages ....................................................................................................................... 26

Samoa Labour Market Survey Report 2016. 3
12.2 Training Needs ...................................................................................................................... 27
12.3 Expatriates Employees .......................................................................................................... 29
13 OCCUPATIONAL HEALTH AND SAFETY ...................................................................................... 31
13.1 Evacuation Plans within Industries ....................................................................................... 31
13.2 Employers with OSH Officer .................................................................................................. 33
13.3 Employers with Accident Register ........................................................................................ 34
14 GREEN JOBS............................................................................................................................... 36
15 ANALYSIS OF AVERAGE HOURS OF WORK ................................................................................ 39
15.1 Normal Hours by Occupational Group .................................................................................. 39
16 ANALYSIS OF INDUSTRY AVERAGE EARNINGS .......................................................................... 40
16.1 Average Weekly Earnings by Industry................................................................................... 40
17 Conclusion ................................................................................................................................. 42
Samoa Labour Market Survey Report 2016. 4
LIST OF TABLES PAGE NUMBER
1. Private Sector Workforce by Age and Sex 13 2. Private Sector Workforce by Industry and Sex 14
2.1 Workforce by Year and Industry 16 3. Workforce by Industry and Occupations 18 4. Total Employment by Category of Workers 19 5. Vacancies by Industry 20 6. Total New Recruitment by Industry and by Sex 22
6.1 Total Cessation by Industry and by Sex 23 7. Lowest Wage Payable by Sex and Number of Employers 24 8. Private Sector Workforce by Educational Attainment and Sex 25 9. Total Formal Sector Employment 26 10. Skill Shortages by Industry 26 11. Training Needs Identification 27
11.1 Training Needs by year and Employer 29 12. Number of Work Permits by Occupation and Sex 29 13. Expatriate Employees by Age Group 30 14. Employers with Evacuation Plans 31 15. Employers with OSH Officers 33 16. Employers with Accident Register 34 17. Employers with Green Jobs 36 18. Average Normal Hours by Occupational Group 38 19. Average Normal Weekly earning by Industry and Sex 39
LIST OF FIGURES PAGE NUMBER
1. Composition of Formal Private Sector Workforce by Sex 11 2. Distribution of Workforce by Industry 12 3. Breakdown of Workforce by Occupation 12 4. Breakdown of Workforce by Age and Sex 13 5. Distribution of Workforce by Industry and Sex 15 6. Total number of Employment by Industry and Occupation 17 7. Composition of Workforce by Category 19 8. Vacancies by Industry 21 9. Recruitment by Sex 22 10. Cessation by Sex 23 11. Employment by Minimum Wage 24 12. Total Workforce by Level of Education 25 13. Number of Foreign Employment Permits 30 14. Total Number of Expatriates by Age Group 31 15. Employers with Evacuation Plans by Industry 32 16. Employers with OSH Officers by Industry 34 17. Employers with Accident Registers by Industry 35 18. Number of Employers by Employees by Green Jobs 37

Samoa Labour Market Survey Report 2016. 5
1 ACRONYMS
AELM Apprenticeship Employment and Labour Market
FEEP Foreign Employee Employment Permit
ICT Information Communication
ILO International Labour Organisation
ISCO 08 International Standard Classification of Occupations 2008
ISIC R4 International Standard Industrial Classification Revision 4
LMIS Labour Market Information System
LMS Labour Market Survey
MCIL Ministry of Commerce Industry and Labour
OSH Occupational Safety and Health
PPE Personal Protective Equipment
PSET Post-Secondary Education Training
RSE Recognised Seasonal Employment
SNEP Samoa National Employment Policy
SNYC Samoa National Youth Council
SWP Seasonal Work Programme
TVET Technical and Vocational Education Training
SDS Strategy for the Development of Samoa

Samoa Labour Market Survey Report 2016. 6
2 EXECUTIVE SUMMARY
The Ministry has noted some of the key findings during the analysis and assessment of the results of
the 2016 LMS in comparison to the LMS in 2013.
The 2016 survey findings reflect significant changes in terms of industries that have highest number of new recruits, increase average of weekly earnings plus other related factors. These industries were not included in the top 3 industries for the 2013 survey report. The change reflects the continuous consolidated efforts and commitments between government and the business community through supporting each other where necessary. The 2016 survey outcome indicates an increase of expatriate workers or foreigners being employed by employers which is 285 in comparison to 190 in 2013.
This is the first survey which extracted information on green jobs, OSH Matters and statistics on people with disability. Out of 780 employers that were covered during the survey, only four hundred and twenty-three (423) employers have had in place evacuation plans. About 102 employers out of 780 which employ OSH Officers with two hundred and forty (240) accidents being reported. The number of accidents is quite alarming and challenging taking into consideration our small population.
The implementation of the new SNEP is considered as the best strategy for more avenues and options to increase employability of our locals but the same time we will manage to identify obstacles and hindrance for creation of more job opportunities. The SNEP extends its coverage to employees in the public sector. This newly formulated policy is also aimed to build strong partnership with key stakeholders at national and international level for more employment opportunities through effective and efficient networking, enhancing facilitation of job matching and referrals, coordination of job seekers searching skills training, to ensure skills demand are matched with skills supply.
The creation of the link under the Labour Market Information (LMI) system and the signing of the Memorandum of Understanding (MOU) between MCIL and the Samoa National Youth Council (SNYC) early this year is seen as a vehicle for unemployed youth especially at the community level for getting jobs.
The implementation of the new LMI system in the coding, data entry, tabulation and analysis processes for preparation of the 2016 Labour Market Survey (LMS) report is quite challenging to IT and Employment Units of MCIL as this is the 1st survey which utilizes this new system. However, we managed to cope given the fact that the ministry is well versed in using an International Standard Classification of Occupation 2008 (ISCO-08) and the International Standard Industrial Classification Revision 4 (ISIC R4) which had been used for the coding process during previous surveys. The continuous using of international methodologies in the coding processes plus other aspects in the conduction and implementation of the 2016 LMS shed some light in carrying out this important
The findings of the 2016 LMS indicates a need for government, private entities, the business community and the training institutions to provide relevant training that matches what is required at the industry level, to avoid mismatch of knowledge and skills require by the industries and what is being taught in the formal classroom.

Samoa Labour Market Survey Report 2016. 7
The need for training providers to work collaboratively with industries in the development of training plans to be aligned with the industrial packages or the skills that are required within industries.

Samoa Labour Market Survey Report 2016. 8
3 INTRODUCTION
3.1 The Survey
The 2016 Labour Market Survey (LMS) report is quite unique in its scope and coverage in comparison
to previous surveys. This is the 1st survey that utilizes the new Labour Market Information (LMI) System
in terms of coding, data entry, tabulation, analysis and report writing processes. The survey content
includes needed employment information on green jobs, OSH matters and people with disabilities.
The report is an outcome of the Labour Market Survey (LMS) of the Formal Private Sector Employers
beings conducted by the Ministry of Commerce, Industry and Labour within three months’ period from
April to June 2016.
The implementation of this survey is very successful as it is one of the ministry’s great achievements
in comparison to previous surveys, in terms of survey coverage, modalities, and the system being used
to extract labour market information and statistics.
The collection of Labour stats during the survey using the new LMI system will assist government policy
makers and stakeholders to have consolidated efforts to identify gaps between the supply and
demands within industries as well as accommodating the newly emerging work models. This
establishment survey can better assist the ministry in terms of analysing the data being collected and
formulate appropriate policies base on skills required and demands in the labour market. This will
create further employment opportunities and required training needs. It will further encourage and
challenge training providers in designing prescribed training contents, to match the demand and
supply in the labour market and the same time provides enabling environment for the business
community, to generate more employment opportunities.
3.2 The Preparation
The 2016 Labour market Survey like the previous survey was funded from the ministry’s annual budget
for financial year (Fy2015/2016) under Output 5 (AELM division). The survey is one of the ministry’s
major activity and output performance measures under Output 5. Planning and performance of LMS
activities commenced on April 2016.
3.3 The Survey Questionnaire
The questionnaire was reviewed and re-designed to expand the coverage to reflect the involvement
of all employers in the country. The inclusion of green jobs currently introduced to our working
environment was a challenge since this type of employment is hard to find or even rare in the working
population. For the employees to be safe and healthy in their working environment, and on the other
hand for the compliance of employers to policies and laws in place for such questions were asked so
the ministry can rely on especially on issues mentioned. The classification of employees in areas like
the shift employees and piece employees were additional data collected for the workforce to be more
categorized and specific. The pre-testing of the questionnaire was done during the training of
enumerators and a number of questions were revised accordingly.

Samoa Labour Market Survey Report 2016. 9
3.4 Training of Enumerators and Supervisors
Four supervisors from the Ministry staff and the ten selected enumerators undertook one-week
training on the terminologies and different definitions, concepts and technical terms of the survey
which prepared for conducting the survey to extract the most correct and reliable information from
the selected employers. These enumerators were successfully selected from a pool of twenty
jobseekers that showed interests and applied for the positions when advertised. Two enumerators
left the survey for new employment offers just before the survey was completed, however this did
not affect the progress given the high level commitment of the remaining team members.
3.5 Methodology
The face to face interview method was used throughout the whole survey period. This method is
reliable and suits this survey. The assigned enumerators with the help of the supervisors are required
to visit the respondent, discuss and clarified the survey questions if required. Therefore, enumerators
were allocated to visit assigned employer from register of employers on a daily basis. Revisiting and
making appointments with unavailable employers is an important part of this method
3.6 Field Work
A total of two teams with five enumerators and two supervisors were on the field collecting data from
our target group. The current register of employers used for survey has a total number of 1320 active
operational employers for Samoa. All employers are grouped to a zone depending on the location or
area where business is operated. The survey area is currently divided to six zones namely Zone 1, 2, 3,
4, 5 in Upolu and Zone 6 on the Savaii island. Each team was to enumerate three allocated zones with
a target of four hundred eighty-three for Team 1 and eight hundred thirty-seven employers for Team
2 to visit and enumerate for the approved scheduled time-frame in survey plans. One survey team
visited the selected employers on Savaii Island for a period of five days. In regards to transportation
MCIL provided one vehicle while the other vehicle was hired, which facilitated travel for the survey
team in attending to daily planned schedules.
3.7 Coding
The employment staff members of MCIL were familiarized with the international codes, ISCO 08 and
ISIC R4 to use for coding of collected data. This process took a while since the usage of four digits was
not aligned with what has been designed in the system.
3.8 Data Processing and Data Entry
The questionnaire was reviewed and re-designed to include other important areas like Green jobs,
Occupational Health and Safety (OSH) measures to ensure reduction of hazards at workplaces and the
same time provide better facilities for the workforce. The inclusion of green jobs was a challenge since
this type of employment is hard to find or even rare in the working population. Most importantly is
for the employees to be safe and healthy in their working environment, and on the other hand for the
compliance of employers to policies and laws in place for such questions were asked so the ministry
can rely on especially on the concerned issues. The classification of employees in areas like the shift
employees and piece employees were additional data collected for the workforce to be more
categorized and specific. The pre-testing of the questionnaire was done during the training of

Samoa Labour Market Survey Report 2016. 10
enumerators where revising of a number of questions accordingly. A manual for supervisors and
enumerators was used as a helping tool or reference while on the field for enumeration of the target
group.
3.9 Tabulation, Analysis and Reporting
The Employment team was engaged in the tabulation, compilation and all other related activities
when the tabulation was finally done. The Line Manager, Principal Officer and the Senior Employment
officer took the lead in the graphical and data analysis, interpretation, comparisons to previous survey
findings prior to writing of the report. The main challenge encountered is the delay in getting feedback
from matters raised pertaining to survey data entry, coding and tabulations from the data system and
designed database due to technical requirements for obtaining this information and in responding to
our enquiries. There is a need for specialized capacity building for our ICT team on the technical
requirements for the LMS
4 THE OBJECTIVES
Survey objectives: 4.1 To identify and prioritize employment matters that are in demand, to ensure the supply side is
aligned to what is required within industries and the labour market in the formal private
sector.
4.2 To update the profile in the Private Sector Workforce.
4.3 To identify training needs and skill shortages of employees in the Private Sector.
5 THE SURVEY COVERAGE
The survey aimed at covering those employers who are currently operational and active on our
database register of employers.
The response rate of seventy-one percent (71%) for this survey is four percent cent (4%) higher than
that of the 2013 survey.
Not many issues were found during field work if compared to previous surveys. The incompleteness
of the information submitted is one of the issues encountered. On the other hand, some employers
have more than one branch, registered under one name but with different trading names. These
contributed to differentiating the total survey target from the actual responded group. A large number
of inactive employers were discovered during the survey but were offset by the number of newly set
up establishments.
Eight (8%) percent of employers submitted or disclosed incomplete information on worker
characteristics (Q14) with reference to gender, age, education, status of employment, country of
citizenship and wages. Hence all graphs and tables’ relating to Q14 are bound to have a shortfall in
numbers.

Samoa Labour Market Survey Report 2016. 11
6 THE SURVEY FINDINGS
6.1 A general profile of the formal private sector workforce employment
The survey results indicated a total of 12,075 employees are engaged in the formal private sector. The male participation rate represented 58% of the total workforce while female is reported occupying 42% respectively.
This same pattern remains unchanged for the last three surveys with the most employees being males across all industries.
The high number of males participated in most industries showed a decrease of 2% when compared to previous survey and for the females it is noted that an increase by 2% in comparison to past surveys illustrated the indication that there is a competition for both sexes in all types of employment opportunities.
Figure 1: Composition of Formal Private Sector Workforce by Sex
58%
42%Males
Females

Samoa Labour Market Survey Report 2016. 12
Figure 2: Distribution of Private Sector Workforce by Major Industries
Presented in Figure 2 is the distribution of employed population by industry (based on ISIC R4) and
which revealed that the top three industries with high number of both males and females’
participation are Wholesale 32%, Accommodation 18% and Manufacturing 16%
Figure 3: Breakdown of Private Sector Workforce by Occupation
Based on ISCO 08, the majority of the workforce are employed in the Service and Sales Category (26%0
an increase of 4% from previous survey. Elementary occupations 16% has increased by 3% more of
the 2013 survey. Managers 13% showed no change if compared to the 2013. Professionals with 11%
with 2% increase with Plant and Machine operators and Technical/Associated with 10% and 9%.
16%
32%
18%
10%
8%
9%
7%Manufacturing
Wholesale/Retail
Accommodation
Finance
Transport
Education
Construction
13%
9%
9%
16%
10%
11%
26%
6%
Managers
Clerical Support Workers
Craft And Related TradesWorkers
Elementary Occupations
Plant And MachineOperators And Assemblers
Professionals
Service And Sales Workers
Technicians And AssociateProfessionals

Samoa Labour Market Survey Report 2016. 13
7 WORKFORCE PROFILE BY AGE AND SEX
As mentioned earlier, the total workforce for the private sector employers was 12,078 of whom 58%
were males and 42% females. The graph and table below details the breakdown of this workforce by
age and sex and proportion of males to females in age-group, only from those employers who
submitted information on ages.
Table 1: Workforce by Age and by Sex
AGE GROUP Males Females Total % total M+F
15-19 359 349 708 1
20-29 2273 1735 4008 40
30-49 2484 1778 4262 46
50+ 604 450 1064 13
Unknown 11 9 20 0
TOTAL 5720 4322 10042 100
Note: Table based on Q14, hence above information covered only employers who submitted age of
employees
Figure 4: Workforce By Age and Sex
From Table 1 it indicates that the same pattern is seen from previous surveys where those at the age of 30-49 years represent the majority of the workforce. The data stated that males are 706 more than the females. This followed by the 20-29 age group. Males in all age groups outnumbered females suggested that males tend to leave school earlier or at the young age rather than females. Less employees in the 50+ category – reflected the effectiveness of the retiring age policy, and it tends to introduce earlier for the formal private sector employees. As reflected from the youths in the category 15-19 years participation and contribution (708) to the total workforce of the formal Private Sector, the majority and highest number were employed in the Wholesale/Retail Trade industry (256) or 22.5% of total employees in this respective industry. Manufacturing next which employed 158 youths or 9.8% percent, 105 (14.8%) of all youths in the same age group were engaged in the Accommodation industry, Finance industry was represented by
0
500
1000
1500
2000
2500
15-19 20-29 30-49 50 +
No
. of
Emp
loye
es
Age-group
Males
Females

Samoa Labour Market Survey Report 2016. 14
47 youths, and industries such as Construction, Administrative and Support services, Education and the Information and Communication recruited youths ranging from 1- 20 youths respectively. The Professional, scientific and technical industry employed 27 of the total youths with the same ages who participated and involved in the survey.
8 WORKFORCE BY INDUSTRY
The ISIC R4 (International Standard Industry Classification) was used for coding of all employers covered according to the ILO four-digit standards. The core business activity was used to classify all who took part, responded and were involved in the survey. The tables and figures below reflect all industries with the numbers of workforce in each segregated by gender Industry and segregated by gender.
Table 2: Workforce By Industry and Sex
Industry Males Females Total
Wholesale and Retail Trade; repair of motor vehicles and motorcycles
1836 1306 3142
Accommodation and food service activities 922 938 1860
Manufacturing 869 725 1594
Education 307 524 831
Financial and insurance activities 414 583 997
Construction 680 76 756
Transportation and storage 603 225 828
Administrative and support service activities 383 147 530
Other service activities 226 149 375
Professional, scientific and technical activities 173 157 330
Arts, entertainment and recreation 175 96 271
Information and communication 118 56 174
Human health and social work activities 16 27 43
Real estate activities 66 34 100
Agriculture, forestry and fishing 68 17 85
Electricity, gas, steam and air conditioning supply 35 8 43
Water supply, sewerage, waste management and remediation activities
26 2 28
Public administration and defence; compulsory social security 47 44 91
TOTAL 6964 5114 12078

Samoa Labour Market Survey Report 2016. 15
Figure 5: Workforce by Industry and Sex The Wholesale and Trade industry has the most number of employees 3142 (26%) an increase of
332 persons from that of the previous survey. This increase is due to the increasing number of
newly established businesses especially in the retailing area. A difference of 530 employees is seen
with males having the most than females. Another factor for such high number of male sin most
industries depends on the nature of work performed within industry.
Accommodation is second despite the fact that numbers for current survey is decreased by 405
employees from same survey carried out in 2013.The Manufacturing industry as in Table 2
suggested that more male employees are currently working here than females.
Other industries with the same pattern include Construction, Transportation and Administration.
A decrease is seen in the Manufacturing industry workforce as resulted from the near closure
targeting 2017 of the main employer in this industry due to unforeseen and unavoidable
circumstances.
The Agriculture industry remain with low number of employees as in previous surveys mainly
depicts the high demand of those looking for other job opportunities rather than working in farms
and on cultivating our lands, and also as the nature of this it is mostly for family use and supporting
our everyday lives or home consumption and that is the main reason why it stays unchanged from
survey to survey.
0
500
1,000
1,500
2,000
2,500
3,000
Emp
loye
es
Industries
Males
Females
Total

Samoa Labour Market Survey Report 2016. 16
Table 2.1: Workforces by Year and by Industry
INDUSTRY 2016 M+F
2013 M + F
2010 M + F
2007 M+F
Agriculture, forestry and fishing 85 38 234 122
Manufacturing 1594 1879 1805 3230
Electricity, gas, steam and air conditioning supply 43 47 648 704
Water supply; sewerage, waste management and remediation activities 28 308
Construction 756 729 887 1175
Wholesale and retail trade; repair of motor vehicles and motorcycles 3142 2810 2152 2898
Transportation and storage 828 845 995 1734
Accommodation and food service activities 1860 2267 2128 1999
Information and communication 174 205
Financial and insurance activities 997 1130 1837 2153
Professional, scientific and technical activities 100 289 0 0
Administrative and support service activities 330 621 0 0
Public administration and defence; compulsory social security 530 79 18 190
Education 91 742 1097 1544
Human health and social work activities 831 199 910 1161
Arts, entertainment and recreation 43 230
Other service activities 646 626
TOTAL 12075 13044 12711 16921
The decrease of 969 employees when compared to total employment in 2013 as reflected above is
mainly due to overseas employment opportunities, through the New Zealand quota scheme on an
annual basis, NZ Recognized Seasonal Scheme (RSE), Seasonal Australian Program (SWP), people
migrating on their own personal commitments and reasons. A possible contributing factor relates to
the incomplete information by targeted employers. Despite the effort put in by all survey members to
collect as much as data as possible for current employment situation analysis and comparisons from
time to time. The internal movement from public employment to private sectors and vice versa is also
noted, including the progressive reduction of employment opportunities at Yazaki Samoa EDS over
the past years.
Samoa Labour Market Survey Report 2016. 17
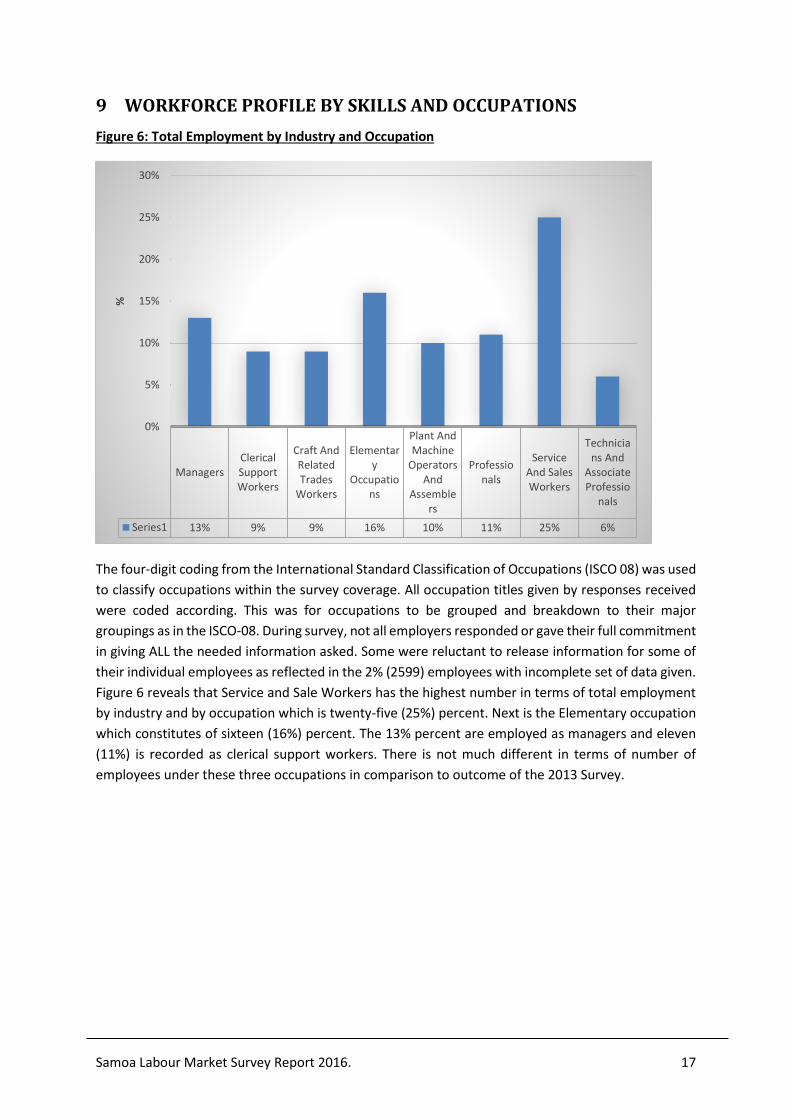
9 WORKFORCE PROFILE BY SKILLS AND OCCUPATIONS
Figure 6: Total Employment by Industry and Occupation
The four-digit coding from the International Standard Classification of Occupations (ISCO 08) was used
to classify occupations within the survey coverage. All occupation titles given by responses received
were coded according. This was for occupations to be grouped and breakdown to their major
groupings as in the ISCO-08. During survey, not all employers responded or gave their full commitment
in giving ALL the needed information asked. Some were reluctant to release information for some of
their individual employees as reflected in the 2% (2599) employees with incomplete set of data given.
Figure 6 reveals that Service and Sale Workers has the highest number in terms of total employment
by industry and by occupation which is twenty-five (25%) percent. Next is the Elementary occupation
which constitutes of sixteen (16%) percent. The 13% percent are employed as managers and eleven
(11%) is recorded as clerical support workers. There is not much different in terms of number of
employees under these three occupations in comparison to outcome of the 2013 Survey.
ManagersClericalSupportWorkers
Craft AndRelatedTrades
Workers
Elementary
Occupations
Plant AndMachine
OperatorsAnd
Assemblers
Professionals
ServiceAnd SalesWorkers
Technicians And
AssociateProfessio
nals
Series1 13% 9% 9% 16% 10% 11% 25% 6%
0%
5%
10%
15%
20%
25%
30%
%

Samoa Labour Market Survey Report 2016. 18
Table 3: Workforce by Industry and Occupation
Industry
Man
age
rs
Cle
rica
l Su
pp
ort
Wo
rke
rs
Cra
ft A
nd
Re
late
d
Trad
es
Wo
rke
rs
Ele
me
nta
ry
Occ
up
atio
ns
Pla
nt
An
d
Mac
hin
e
Op
era
tors
An
d
Ass
em
ble
rs
Pro
fess
ion
als
Serv
ice
An
d S
ale
s
Wo
rke
rs
Skill
ed
Agr
icu
ltu
ral
Fore
stry
An
d
Fish
ery
Wo
rke
rs
Tech
nic
ian
s A
nd
Ass
oci
ate
Pro
fess
ion
als
TOTA
L
Accommodation and food service activities
163 106 79 520 14 12 564 31 102 1591
Administrative and support service activities
67 58 21 72 8 19 138 0 7 390
Agriculture, forestry and fishing
10 7 0 35 18 1 0 4 4 79
Arts, entertainment and recreation
25 9 9 44 2 1 53 0 10 153
Construction 29 27 98 159 138 25 11 0 17 504
Education 50 44 4 33 4 487 77 0 9 708
Electricity, gas, steam and air conditioning supply
10 4 12 0 3 2 11 0 1 43
Financial and insurance activities
121 148 7 23 22 122 68 2 126 639
Human health and social work activities
16 17 4 6 5 25 31 0 14 118
Information and communication
18 19 4 1 5 34 15 0 31 127
Manufacturing 118 64 118 229 579 108 109 0 70
1395
Other service activities 48 20 19 72 5 63 65 0 21 313
Professional, scientific and technical activities
58 40 7 11 4 70 5 0 45 240
Public administration and defence; compulsory social security
2 2 0 1 1 2 0 0 1 9
Real estate activities 8 8 2 45 5 5 11 0 16 100
Transportation and storage
51 74 37 80 62 29 47 0 41 421
Water supply; sewerage, waste management and remediation activities
2 0 0 1 7 2 16 0 0 28
Wholesale and retail trade; repair of motor vehicles and motorcycles
420 159 476 201 78 44 1187
1 55 2621
TOTAL 1216
806 897 1533 960 1051
2408
38 570 9479
% 13% 9% 9% 16% 10% 11% 25% 0% 6% 100
The percentage of employees classified as Services and Sales workers was the highest occupation for
the private sector workforce a difference of 4% from the same industry in the 2013 survey. This is a
true reflection of the increased in numbers of new businesses in operational which also needs an
additional number of employees to perform and work there. Not only in this industry but the
Accommodation industry also contributes to the high number of people providing services and as sales
people during the survey period. Elementary occupations are second with 16% of workforce also
reflects the nature of such occupations provided in industries in areas in our communities and
individual or self-employment. In the Manager category, 1% dropped if to compare to 2013 showed

Samoa Labour Market Survey Report 2016. 19
no tremendous change as they are mostly decided or selected according to individual employer
policies implemented and being enforced from time to time. The Professional arrived at 11%, a 2%
decrease from previous survey. Others either remain as previous or reduced by 1 – 3% respectively.
These occupations above include Plant, Clerical/ Craft and Technicians. The skilled agriculture remains
constant due to the sector they fit in.
10 WORKFORCE PROFILE BY CATEGORY OF WORKERS
The target group (Employers) were asked to categorize their current active employees into paid
employees, paid non-citizens, proprietors, disabled persons and more. The two new categories
included in this survey were the shift employees1and piece employees 2, to enable the ministry to have
detailed workforce for the private sector. The result indicates that the bulk of the workforce are
categorized as the paid employees for both the locals and the non-citizen employees. Table and Graph
below give more detailed on the compositions of the private sector workforce by category and by
males or females.
Table 4: Total Employment by Category of Worker
Status Males Females TOTAL
Working Proprietor 486 460 946
Paid Employees 5247 3867 9114
Paid Employees - Non-Citizens 114 61 175
Contract officers 277 129 406
Volunteers 31 41 72
Unpaid Family Workers 87 75 162
Shift workers 675 447 1122
Piece worker 38 27 65
People with Disability 9 4 13
TOTAL 6964 5111 12075
Figure 7: Composition of Workforce by Category
About 76% of total workforce is made up of paid employees which include both part time and full
timers. Next with 8% of all employees are those in the shift worker category and followed with
1 Shift Employee refers to an employee who works in shift work or normally works on a Sunday or public holidays 2 Piece work is an agreement whereby an employer and employee agree that the employee is to be paid a wage based upon a specific task or number of tasks to be undertaken by the employees, after which, the employment arrangement is deemed to be terminated.
8%
76%
1%3%
1%1%
9%
1% 0%Working Proprietor
Paid Employees (Full &Part-Time Employees)Paid Non-Citizens (Full &Part-Time Employees)Contract officers (C + NC)
Volunteers

Samoa Labour Market Survey Report 2016. 20
Managers represented by 8%. Contract Officers occupying 3% cannot be compared to the public sector
where most of the high-level positions are on a contractual basis. The inclusive of numbers of the
workforce being classified as people with disability is represented by 1% of all the working people in
this sector.
10.1 Vacancies
The survey estimated a number of 340 vacancies being vacant at the time of the fieldwork. The focus
of the vacancy question is to identify the current status of labour force in terms of available
opportunities to be offered to those who are seeking for employment opportunities.
The survey estimated a number of 340 vacancies being vacant at the time of the fieldwork. The focus
of the vacancy question is to identify the current status of labour force in terms of available
opportunities to be offered to those who are seeking for employment opportunities.
Table 5. Vacancies by Industry
Industry Number
Of Vacancies
Total Employment in Industry
%
Agriculture, forestry and fishing 3 85 1%
Manufacturing 40 1594 13%
Electricity 0 43 0%
Water supply; sewage; waste management; redemption activities 0 28 0%
Construction 5 756 6%
Wholesale and retail trade; repair of motor vehicles and motorcycles 93 3142 26%
Transportation and storage 13 828 7%
Accommodation and food service activities 80 1860 15%
Information and communication 22 174 1%
Financial and insurance activities 15 997 8%
Real estates 0 100 1%
Professional, scientific and technical activities 19 330 3%
Public administration and defense; compulsory social security 1 91 1%
Administrative and support service activities 22 530 4%
Education 16 831 7%
Human health and social work activities 0 43 0%
Arts, entertainment and recreation 7 271 2%
Other service activities 4 375 3%
340 12078 100%
The Wholesale industry is referred to as the industry with the highest number of vacancies which is 26%. Accommodation with 15% and Manufacturing 13% respectively. The Finance industry showed that they have 8% available vacancies during survey period. Overall, 340 vacancies available during the survey in comparison to 185 only in 2013. An increase of one hundred fifty-five (155) number of vacancies available within private sector industries for the 2016 Labour Market Survey comparing to the 2013 LMS report

Samoa Labour Market Survey Report 2016. 21
Figure 8: Vacancies by Industry
10.2 Staff Turnover
The rationale behind staff turnover was mainly due to availability of employment opportunities
elsewhere like the NZ Quota Scheme, New Zealand Recognized Seasonal Employment (RSE) Scheme,
the Australian Seasonal Program (SWP) and Christchurch Rebuild. Employees prefer to be employed
in the public sector due to safer and better working conditions in terms of better salaries and other
remuneration packages. Others were terminated due to dishonesty, poor performances and
attitudinal problems. In actual fact, the cessation number is higher than the recruitments.
Table 6. Total Recruitment by Industry and by Sex (12 Sept 2015-Mar 2016)
Industry Males Females TOTAL
Wholesale and retail trade; repair of motor vehicles and motorcycles 370 233 603
Accommodat152ion and food service activities 208 210 418
Manufacturing 123 78 201
Transportation and storage 167 34 201
Administrative and support service activities 132 18 150
Construction 119 9 128
Education 45 61 106
Other service activities 40 17 57
Financial and insurance activities 22 33 55
Arts, entertainment and recreation 32 14 46
Professional, scientific and technical activities 19 20 39
Information and communication 23 6 29
0
500
1000
1500
2000
2500
3000
3500
Number Of Total Employment

Samoa Labour Market Survey Report 2016. 22
Human health and social work activities 20 6 26
Agriculture, forestry and fishing 12 0 12
Electricity, gas, steam and air conditioning supply 3 0 3
Water supply; sewerage, waste management and remediation activities
2 0 2
Public administration and defense; compulsory social security 1 1 2
Real estate activities 1 0 1
1339 740 2079
Most of the recruited employees were hired by employers in the Wholesale industry since new
businesses were set up and potential need for additional employees took place. Accommodation was
the next to recruit new employees while the Manufacturing and Transport are reported with the
numbers hired being 201 employees each.
Figure 9: Recruitment by Sex
Table 6.1: Total Cessation by Industry and Sex (Sept 2015-Mar 2016)
Industry TOTAL Males Females
Wholesale and retail trade; repair of motor vehicles and motorcycles
422 294 128
Accommodation and food service activities 372 188 184
Manufacturing 249 133 116
Transportation and storage 78 51 27
Administrative and support service activities 90 75 15
Construction 55 51 4
Education 53 21 32
Other service activities 32 17 15
Financial and insurance activities 58 21 37
Arts, entertainment and recreation 18 9 9
Professional, scientific and technical activities 29 16 13
Information and communication 30 17 13
Human health and social work activities 17 13 4
0
200
400
600
800
1000
1200
1400
Males Females TOTAL

Samoa Labour Market Survey Report 2016. 23
Agriculture, forestry and fishing 15 15 0
Electricity, gas, steam and air conditioning supply 3 3 0
Water supply; sewerage, waste management and remediation activities
3 3 0
Public administration and defence; compulsory social security 4 2 2
Real estate activities 4 4 0
1532 933 599
Employees who left or ceased employment for several reasons increased from the 2013 survey by 163
and majority of them were employed in the Accommodation industry. The Wholesale together with
the Manufacturing industries were the next which terminated or ceased employment of some of their
employees.
Figure 10: Cessation by Sex
10.3 Lowest Wage Payable
Table 7: Lowest Wage Payable by Sex and by Number of Employers
Lowest Wage Per Hour(Tala) Males Females TOTAL Number of Employers
6.61 and above 34 20 54 38
5.61-6.60 35 15 50 20
4.61-5.60 48 41 89 47
3.61-4.60 155 80 235 124
2.61-3.60 474 310 784 291
2.31-2.60 321 229 550 140
$2.30 (Minimum) 242 240 482 53
unknown 34 20 54 38
Below Min Wage (<$2.30) 73 30 103 31
1416 985 2401 782
Table 7 reveals 73.3% of employees are paid above the minimum wage, 20% paid at the current
050
100150200250300350400450
TOTAL Males Females

Samoa Labour Market Survey Report 2016. 24
minimum wage which is $2.30 an hour and 6.5 % paid under the minimum wage inclusive the unknown which is 34 employees. In actual fact, high compliance rate towards the required minimum wage is 93.5% of total workforce. According to the table above, it indicates that 53 employers paid some of their workers (482) with the current stipulated minimum wage of $2.30 an hour. As of this number a slight difference reflected on the number of males and females being 23 employers if compared to the 2013 survey.
Figure 11: Employment by Minimum Wage
10.4 Educational Attainment
Table 8: Workforce by Educational Attainment and Sex
Education Level Males Females Total
Primary 289 102 391
Secondary 3348 1986 5334
TVET/PSET 546 487 1033
Tertiary 1202 1310 2512
Total 5385 3885 9270
The result of the 2016 Labour Market Survey reflects that majority of private sector workforce
completed education at the secondary level which is 57.5% with male’s dominant than female. About
27% completed post- secondary education and 6% left school at the primary level. More females
completed tertiary education rather than males. This was the same situation as reported in the
previous survey in 2013.
050
100150200250300350400450500
Males Females

Samoa Labour Market Survey Report 2016. 25
Figure 12: Total Workforce by Level of Education
Males represented by 63% of those who finished and reached secondary level while females only 37% as indication of males’ preference in leaving education much earlier than females. The secondary education level has the most number of employees being 58% of workforce. Next is Tertiary level representing 27% with females having the higher number than males followed by TVET/PSET with 11%. Primary level remains the least number (391) suggesting that a very few employees finished schooling at this level.
11 PUBLIC SECTOR WORKFORCE
Statistics needed for the public sector were from our reliable source, the Office of the Public Service
Commission so a clear and full estimation of the total national workforce can be captured. As seen in
previous surveys, there was a continuously movement from sector to sector due to the high demand
of skills and wealth of knowledge, but on the hand mostly moved from public to private or vice- versa
is to do with attracted factors such as the pay or wages in terms of money, benefits and to name a
few. But not forgetting the working conditions and environment, work related rewards and
entitlements are other major contributing factors for such movements. Despite this it is another sign
of the significant efforts by both to strengthening partnerships and building strong emphasis on
keeping the best cooperation and strong relationships of all sectors for a better and even the best
national workforce for our country.
11.1 Formal Sector Employment
Table 9: Total Public + Private Sector Employees
Sector Total Employment
Male Female Total
Private sector employees 6964 5111 12075
Public sector employees 1848 2340 4188
Total 8812 7451 16263
The formal sector employment as reflected in Table 9 stated that females tend to be higher than
males. With percentages to public workforce of 56 to 44 percentages respectively. A slight decrease
in total public workforces of 18 employees determines the internal movement of officers within
0
1000
2000
3000
4000
Primary Secondary TVET/PSET Tertiary
No
. of
Emp
loye
es
Education
Males
Females

Samoa Labour Market Survey Report 2016. 26
ministries and limited new vacancies for recruitment of more staff. On the other hand, there are more
males than females in the private sector despite the big drop in number of males found in the 2013
survey. Males in this sector represents 58% as for females they only cover 42% of total workforce. The
national workforce for Samoa decrease by 987 employees from previous survey
12 SKILL SHORTAGES AND TRAINING NEEDS
12.1 Skill Shortages
One of the gorals for this survey is provide information concerning training needs and skills shortages
in the labour force, therefore each employer being interviewed has been asked to provide information
on what skills that are in demand and the trainings that are required to better the performances in
terms of knowledge and skills needed for the job overall.
Table 10: Skill Shortages by Industry
Industry
Number of Employers with skill Shortages
Total Employers covered
2016 2013 2016 2013
Accommodation and food service activities 32 41 128 145
Administrative and support service activities 10 14 54 57
Agriculture, forestry and fishing 1 2 4 5
Arts, entertainment and recreation 3 3 14 22
Construction 8 6 26 24
Education 12 8 36 38
Electricity, gas, steam and air conditioning supply 1 2 7 4
Financial and insurance activities 5 10 36 37
Human health and social work activities 4 2 16 14
Information and communication 7 4 15 18
Manufacturing 13 25 56 91
Other service activities 2 8 44 42
Professional, scientific and technical activities 7 9 36 35
Real estate activities 1 0 5 0
Transportation and storage 4 8 31 30
Wholesale and retail trade; repair of motor vehicles and motorcycles 56 47 271 217
Water supply; sewerage, waste management and remediation activities 0 2 1 4
Total 166 191 780 784
Table 10 indicates a total of 166 employers were reported to have skills shortages within their
workplaces. The figures in the table indicates a decrease in the number of employers having such
difficulty with some of the employees they hire. Though it’s a slight reduction but it is still an indication
of employers contributing in solving the issue of skills demand in the labour force where most of the
employers contribute in doing on-the-job trainings to familiarize employees with each one’s job. Most
of the industries have reduced number of employers having skills shortages. Agriculture with very low

Samoa Labour Market Survey Report 2016. 27
numbers reminded us of the nature of job in this industry where no intensive training on skills is
needed coz everyone in the communities already have such skills and knowledge. Transfer skills from
older generations to the youths now can be easily gained from our own farmers to generations
nowadays.
12.2 Training Needs
The training needs question looks specifically on the skills that employees needs to be equipped on
and the employers were asked to identify their staff members that needs training on their particular
areas of work to better improve their performance.
Table 11: Training Needs by Number of Employers and Employees
Training Needs
Number Of Employers With Training Needs
Number Of Employees To Be Trained
Total Employment In Industry
Manufacturing 29 81 340
Time management, Balance Receipts and financial skills, Customer and marketing, Stock management and computer skills, Fixing moles, Printing and machinery, Baking and decorating, Office management, Equipment appliances.
Construction 7 22 403
Engineering, Carpentry, Office management, Records keeping.
Wholesale and retail trade; repair of motor vehicles and motorcycles 80 245 2567
Customer service and communication skills, Stock control and hygiene handling course, Baking and cooking, Sewing, Computer skills, Advertising and literacy skills, Welding and plumbing, Connecting Fittings course, Panel and Engineering/Motor mechanical skills, Accounting skills, Photography, Management, Records keeping and filing, Electronic
Transportation and storage 9 12 414
Public relations and communication skills, Computer skills
Accommodation food service activities 68 262 1603
Customer service, Culinary training, Housekeeping and cleaning skills, Cooking and bartender/waiter, Stock management and control, Personality and Hospitality, Marketing and Management skills
Information and communication 14 17 91
Sales and Marketing, New presentation and shooting, Specialized video editing and graphic designs
Financial and insurance activities 37 126 620
Resource management and personnel, Accounting/Financial and book keeping skills, Database designing and website hosting, Reading and analysis, Customer service, Macroeconomic, Financial management, Project and time management, Insurance and filing skills

Samoa Labour Market Survey Report 2016. 28
Real Estate activities 1 2 100
Accurate skills
Professional, scientific and technical activities 18 31 240
Financial management, Project handling, Research writing skills, Office and Computer skills, Customer service and Marketing skills
Administrative and support service activities 15 65 301
PR/Customer service skills, Recording and Accounting, Computer skills, Honesty, Cleaning and Plumbing
Education 25 95 709
Teaching skills/techniques, Secretariat skills, Library and Computer skills, IT Management, Counselling, Special needs teaching skills, Payroll preparations
Human health and social work activities 4 12 65
Caretaker training, Customer service, Beauty therapy and massaging skills
Arts, entertainment and recreation 7 22 153
Financial skills, Museum and archives operations, Management, Research and collection
Other service activities 5 7 132
Hairdressing and Beautician, Marketing, Sewing, Customer service, Accounting and Computer skills
The response from employers who stated that some of their employees needed further training has increase from the previous two surveys carried out in 2010 and 2013. Of all 300+ employers responded, 80 of them are in the Wholesale industry, Accommodation 68 and Finance with 37 employers. These 300+ employers have a total of 1062 employees with a need for training a decrease when compared to numbers for 2010 and 2013 surveys. The majority of these employees needed training in customer service, communication skills, computing skills, Welding and plumbing skills and accounting skills to name a few. Table 11.1 Training Needs by Year & Number of Employers
Year of survey Employees with training needs Employers with workers needed
further training
2000 1,448 251
2004 1,028 305
2007 2,026 328
2010 1,342 213
2013 1,546 241
2016 1,062 351
The number of employees with training needs as shown in Table 12.1 only revealed that only a portion
of the total workforce for the private sector varies from survey year to year. The highest number was
found in the 2007 while the smallest or even the biggest decrease was in the 2013 survey. This is also
believed to the effectiveness of internal training or local training that the employer itself provided for
their employees for upskilling. In previous years there was never a year that the number of employers
reached half way of those surveyed. There is a huge increase in terms of numbers of employees with
training needs for the 2016 survey if compared to previous one.

Samoa Labour Market Survey Report 2016. 29
12.3 Expatriates Employees
Another significant question included in the survey focuses on the expatriate employees or of non-
citizens who wish to work in Samoa and have been granted a foreign employee employment permit
under the Labour Employment Relations Act 2013.
The table below outlines a comparison analysis of data from the 2013 and 2016 LMS. The trend
shows there is a growing demand of expatriates in all industries and in the different occupational
categories.
Table 12: Number of Employment Permits issued by Occupation and Sex
Occupations 2016 2013
Males Females Total Males Females Total
Managers 15 10 25 49 31 80
Professionals 34 24 58 11 21 32
Technicians and associate professionals 29 25 54 13 1 14
Clerical support workers 7 18 25 2 8 10
Service and sales workers 14 16 30 13 12 25
Skilled agricultural, forestry and fishery workers 4 0 4 0 0 0
Craft and related trades workers 36 7 43 11 6 17
Plant and machine operators, and assemblers 14 4 18 1 0 1
Elementary occupations 20 8 28 5 6 11
Total 173 112 285 105 85 190
The total number of foreign employee employment permits (FEEP) issued was amounts to 285 which
is a 51% increase to the number of non-citizens in 2013. The survey showed professionals had the
highest number of non-citizens while Technicians and Associate professionals had the second highest
representative of non-citizens. The outcome of 2016 survey reflects that the employment of
foreigners is more on the technical areas, taking into account this is only 10% of the formal economy.
Actual figures of FEEPs issued can be obtained from the Employment Permit Unit under the Ministry
of Commerce, Industry and Labour.

Samoa Labour Market Survey Report 2016. 30
Figure 13: Number of Foreign Employment Permits Issued
Male foreigners were more than females who applied and successfully issued with foreign
employment permits (FEEP) and the highest occupation categories are Professionals with Technicians
and associate professionals. This followed by the craft and related trades, the services and sales
employees then elementary, managers and clerical occupations. A decrease is noted with the
managers while there are increases with the professionals, technicians and craft occupations when
compared to the year 2013 findings.
Table 13: Expatriate Employees by Age Group
AGE GROUP Males (%) Females (%) Total (%)
15 - 1 9 years 3 (2%) 2 (3%) 5 (2%)
20 - 29 years 48 (32%) 21 (35%) 69 (33%)
30 - 49 years 77 (51%) 29 (48%) 106 (50%)
50 + 22 (15%) 8 (14%) 30 (15%)
Total 150 60 210
The age group 30-49 is shown as the group where majority of expatriate employees are, followed by
expats from the 15-29 age group with the lowest number being 15-19 years and 50+ years.
05
10152025303540
Foreign Employment Permits by Occupation by Sex
Males Females

Samoa Labour Market Survey Report 2016. 31
Figure 14: Total Number of Expatriates by Age Group
13 OCCUPATIONAL HEALTH AND SAFETY
13.1 Evacuation Plans within Industries
Due to the high importance of evacuation plans available for safety guidance of all employees in
workplaces, a question was included in the Labour Market survey for the first time. Employers were
requested to confirm whether an evacuation plan is in place. According to feedback from employers,
it is recorded that 423 (54%) out of the 780 surveyed employers have plans in place. This means that
56% of employers covered during the survey have no evacuation plans. As of this number the
Wholesale industry has more than a hundred employers who declared they have evacuation plans
practiced, followed by the Accommodation and Manufacturing industries respectively. This
information will assist the ministry in determining effective ways to update and work with employers
to comply with Occupational Health and Safety legislation and policies within work places.
Table 14: Employers with Evacuation Plans within Industries
Industry Number Of Employers with Evacuation Plans
Wholesale and retail trade; repair of motor vehicles and motorcycles
138
Accommodation and food service activities 75
Manufacturing 35
Education 28
Administrative and support service activities 25
Financial and insurance activities 22
0
20
40
60
80
100
120
15-19 20-29 30-49 50 +
Expatriates by Age
Males Females

Samoa Labour Market Survey Report 2016. 32
Other service activities 16
Transportation and storage 15
Construction 14
Human health and social work activities 12
Professional, scientific and technical activities 11
Information and communication 9
Arts, entertainment and recreation 9
Electricity, gas, steam and air conditioning supply 5
Agriculture, forestry and fishing 4
Real estate activities 3
Public administration and defense; compulsory social security
2
TOTAL 423
Figure 15: Employers with Evacuation Plans
0 20 40 60 80 100 120 140 160
Wholesale and retail trade; repair of motor vehicles and…
Accommodation and food service activities
Manufacturing
Education
Administrative and support service activities
Financial and insurance activities
Other service activities
Transportation and storage
Construction
Human health and social work activities
Professional, scientific and technical activities
Information and communication
Arts, entertainment and recreation
Electricity, gas, steam and air conditioning supply
Agriculture, forestry and fishing
Real estate activities
Public administration and defence; compulsory social…
Number Of Employers with Evacuation Plans

Samoa Labour Market Survey Report 2016. 33
13.2 Employers with OSH Officer
An important and useful component of the Ministry’s mandate relates to monitoring and evaluation
of employer compliance of OSH Standards.
A question on the recruitment of OSH officers was included in the survey in accordance with section
22 of the Occupational Safety and Health Act 2002. As presented in the table 15 below a total of 10
employers stated that they have OSH officers. The recruitment of OSH Officer was evident within the
Wholesale, Accommodation and Manufacturing Sector.
Table 15: Number of Employers with OSH Officers
Industry Number Of Employers with OSH
Officers
Wholesale and retail trade; repair of motor vehicles and motorcycles 26
Manufacturing 14
Accommodation and food service activities 14
Transportation and storage 7
Construction 7
Professional, scientific and technical activities 6
Education 6
Financial and insurance activities 5
Administrative and support service activities 3
Other service activities 3
Human health and social work activities 3
Information and communication 2
Agriculture, forestry and fishing 2
Arts, entertainment and recreation 2
Real estate activities 1
Electricity, gas, steam and air conditioning supply 1
102

Samoa Labour Market Survey Report 2016. 34
Figure 16: Employers with OSH Officers by Industry
13.3 Employers with Accident Register
Another important question that was asked during the survey relates to the existence of an Accident
Register to note accidents, incidents and illnesses that occurred in the workplace in accordance with
section 20 of the Occupational Safety and Health Act 2002.
The safety and wellbeing of employees is important and the need to maximize preventative measures
to eliminate potential risks and hazardous at the workplace is the priority of both the employer and
employee.
Employers are encouraged to have an Accident Register in place to document workplace accidents,
incidents and illnesses and in return make sound decisions on the implementation of OSH standards
and the protection of employees from risks and hazards, and to avoid costs implications to their
business. The table below reflects a total of 240 employers have Accident Registers.
Table 16: Employers with Accident Register
Industry Employers with Accident
Register
Wholesale and retail trade; repair of motor vehicles and motorcycles 75
Accommodation and food service activities 37
Manufacturing 22
0
5
10
15
20
25
30
Number Of Employers with OSH Officers
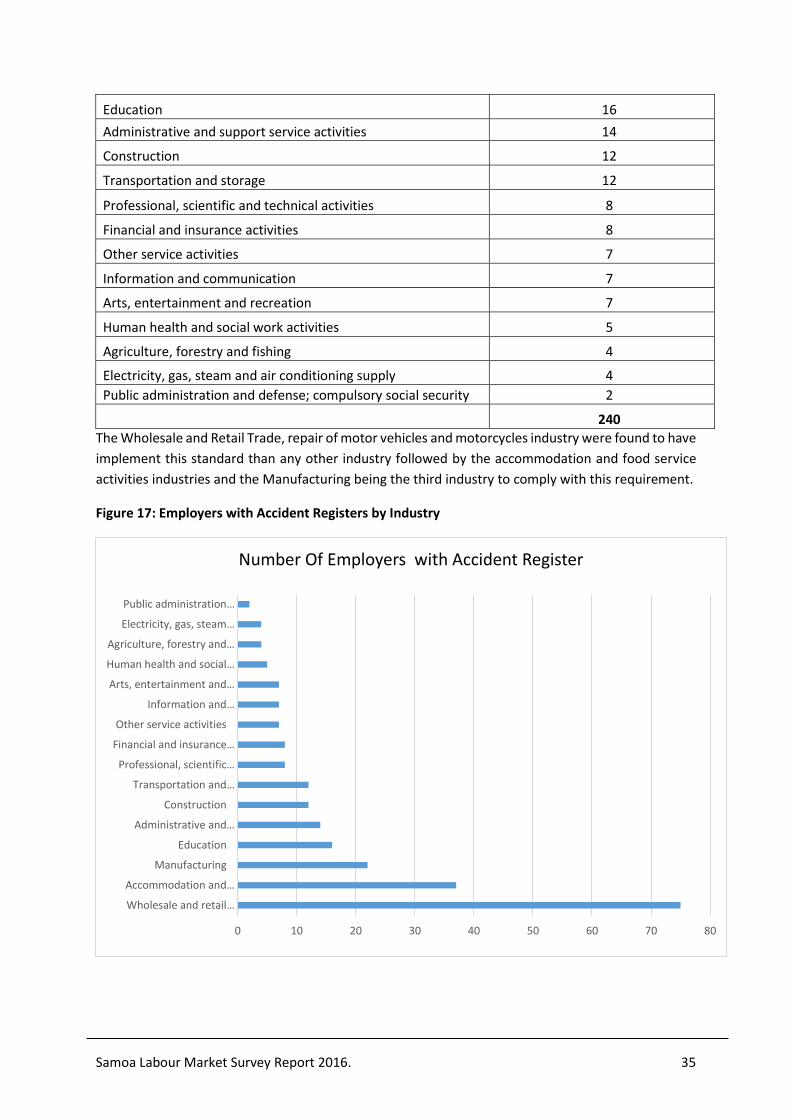
Samoa Labour Market Survey Report 2016. 35
Education 16
Administrative and support service activities 14
Construction 12
Transportation and storage 12
Professional, scientific and technical activities 8
Financial and insurance activities 8
Other service activities 7
Information and communication 7
Arts, entertainment and recreation 7
Human health and social work activities 5
Agriculture, forestry and fishing 4
Electricity, gas, steam and air conditioning supply 4
Public administration and defense; compulsory social security 2
240
The Wholesale and Retail Trade, repair of motor vehicles and motorcycles industry were found to have
implement this standard than any other industry followed by the accommodation and food service
activities industries and the Manufacturing being the third industry to comply with this requirement.
Figure 17: Employers with Accident Registers by Industry
0 10 20 30 40 50 60 70 80
Wholesale and retail…
Accommodation and…
Manufacturing
Education
Administrative and…
Construction
Transportation and…
Professional, scientific…
Financial and insurance…
Other service activities
Information and…
Arts, entertainment and…
Human health and social…
Agriculture, forestry and…
Electricity, gas, steam…
Public administration…
Number Of Employers with Accident Register

Samoa Labour Market Survey Report 2016. 36
14 GREEN JOBS
The concept of “Green Jobs” is relatively new in Samoa. For example, there is no mention of Green Jobs in the Labour and Employment Relations Act 2013. However, it has recently been recommended in the Samoan National Employment Policy 2016, that the Government promotes research studies
and develops Green Job opportunities given the country’s exposure and vulnerability to the impacts of climate change.
ILO has taken the lead on introducing the concept of Green Jobs and Green Works to the employment landscape. According to ILO, Green Jobs are decent jobs that contribute to preserve or restore the ecosystems and biodiversity, reduce energy consumption, raw materials and water, reduce greenhouse gas emissions and minimize or altogether avoid the generation of all forms of waste and pollution. Green Jobs include the provisions for decent work and proper living conditions to all those involved in production as well as respecting workers’ rights. Green Jobs help: Improve energy and raw materials efficiency; Limit greenhouse gas emissions; Minimize waste and pollution; Protect and restore ecosystems; and Support adaptation to the effects of climate change. In a report entitled “Skills for Green Jobs: A Global View” (2008), ILO identified four drivers of change in skills requirements. These included: physical changes in the environment itself; environmental policy and regulation; technology and innovation; and changes in prices, markets and consumer habits. In spite of the growing influence of globalization, skill changes resulting from the transition to a greener and low-carbon economy remain very much country specific. For example, in developed countries, the major drivers of change are usually driven by changes in consumer behavior and the way in which market forces have responded and interacted. In developing countries however, changes to the environment, regulation enforcement and policy changes are usually the main instruments for change.
There are very few examples of Green Work initiatives implemented in Samoa. In 2015, ILO under the
Samoa National Action Plan (SNAP) on Youth Employment (YE) Project implemented the Green Work
initiative in Samoa to demonstrate the value of Green Works and Green Jobs for youth in the
community. Fifteen young men and women were contracted as part of this initiative to install tsunami
warning signs in the capital. Despite the success of this initiative, it should be noted that coverage of
Green Jobs initiatives in Samoa has been limited due to social protection and employment registration
requirements which are often too high for candidates from the community that often have never been
employed before. For example, because of these requirements and due to time constraints only young
people with existing social protection were contracted through Samoa Red Cross Society in the 2015
ILO initiative.
Table 17 indicates the number of green jobs 3available in Samoa during the survey period. The number
of employees is limited however this is a promising sector in terms of introducing potential new jobs
in the long term to absorb our local talented youths to participate and take part and to be involved in
order for Samoa to have an active and energetic workforce and at the same time to reduce the number
of unemployed people.
3 Green Jobs is work specifically aimed at protecting the environment, reduce pollution, renewable
energy, or jobs using natural or organic materials.

Samoa Labour Market Survey Report 2016. 37
From survey findings, 48 out of 780 employers who responded relayed to the survey staff that they
are employing 195 employees who are involved green jobs. There is a need to further promote green
job opportunities through a coordinated effort by the responsible government and private sector
industries in order to fully benefit from this industry.
It is also seen at table 17 that most employees were in the farming, gardeners, agriculture and field
worker categories.
Table 17: Number of Employers with GREEN JOBS
Green Job Title Number Of Employers Number Of Employees
Farming & agriculture 1 56
Field Officers 1 23
Planters 1 10
Operators 1 9
Project Officer 1 6
Plants 1 6
Crops division 1 6
Manager 2 5
Plots preparation 1 5
Gardening 3 5
Refrigerant Recovery 1 4
Green Job Officer 1 4
All green waste (banana peelings) 1 4
Green house 2 4
Grounds men 1 4
Decomposition 1 3
7 double panel solar hot water system
1 3
Water tanks 1 3
Gardener - beautification 1 3
Grounds man 2 3
Planter 1 3
Organic Farmer 1 2
Vegetables 2 2
Animal manure 1 2
Proper coating of seeds 1 2
Sea Protection 1 2
Rubbish Sorter 1 2
School Cleaners 1 2
School Security 1 2
Grounds men 1 2
Remediation 1 2
Production 1 1
Managing director 1 1
Marine manager 1 1
Eco park gardener 1 1
Water Treatment 1 1
Gardener 1 1
Waste Oil 1

Samoa Labour Market Survey Report 2016. 38
Green hours 1
Lifesaving light bulb 1
Vapour Emission 1
Swimming pool 1
48 195
Figure 18: Number of Employers - Employees by Type of Green Jobs
0 10 20 30 40 50 60
farming & agriculture
Planters
Project Officer
crops division
plots preparation
Refrigerant Recovery
all green waste (banana peelings)
Goundsmen
7 double pannel solar hot water system
gardener - beautification
planter
Vegetables
propercating of seeds
Rubbish Sorter
School Security
Remediation
managing director
eco park gardener
gardener
green hours
Vapour Emission
Number Of Employers Number Of Employees
Samoa Labour Market Survey Report 2016. 39
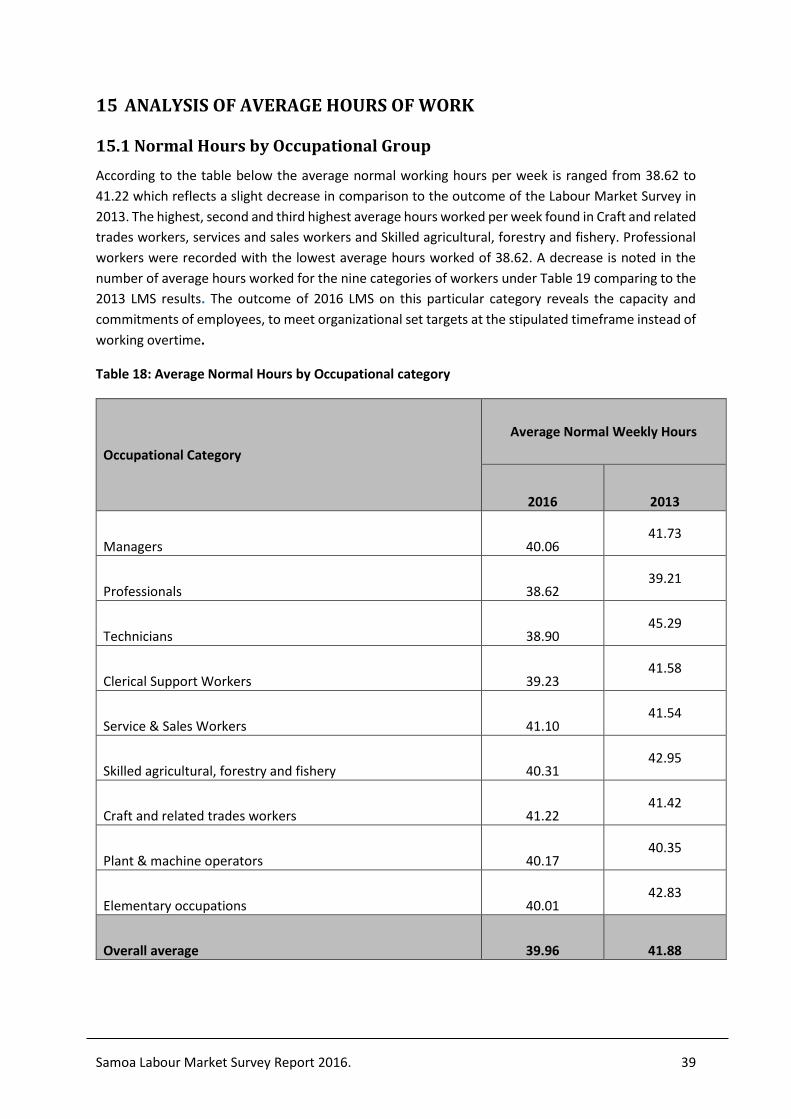
15 ANALYSIS OF AVERAGE HOURS OF WORK
15.1 Normal Hours by Occupational Group
According to the table below the average normal working hours per week is ranged from 38.62 to
41.22 which reflects a slight decrease in comparison to the outcome of the Labour Market Survey in
2013. The highest, second and third highest average hours worked per week found in Craft and related
trades workers, services and sales workers and Skilled agricultural, forestry and fishery. Professional
workers were recorded with the lowest average hours worked of 38.62. A decrease is noted in the
number of average hours worked for the nine categories of workers under Table 19 comparing to the
2013 LMS results. The outcome of 2016 LMS on this particular category reveals the capacity and
commitments of employees, to meet organizational set targets at the stipulated timeframe instead of
working overtime.
Table 18: Average Normal Hours by Occupational category
Occupational Category
Average Normal Weekly Hours
2016 2013
Managers 40.06 41.73
Professionals 38.62 39.21
Technicians 38.90 45.29
Clerical Support Workers 39.23 41.58
Service & Sales Workers 41.10 41.54
Skilled agricultural, forestry and fishery 40.31 42.95
Craft and related trades workers 41.22 41.42
Plant & machine operators 40.17 40.35
Elementary occupations 40.01 42.83
Overall average 39.96 41.88

Samoa Labour Market Survey Report 2016. 40
16 ANALYSIS OF INDUSTRY AVERAGE EARNINGS
16.1 Average Weekly Earnings by Industry
Table 19: Average weekly earnings by Industry and Sex
Industry
Average weekly wages Average Normal
Weekly Earnings Males Females
Financial and insurance activities 37.5 47.38 1373.4
Public administration and defense; compulsory social security
1.5 3 986.88
Professional, scientific and technical activities 21.86 19.43 705.88
Wholesale and retail trade; repair of motor vehicles and motorcycles
55.63 42.59 542.96
Real estate activities 65 35 517.47
Education 41.33 77 474.25
Electricity, gas, steam and air conditioning supply 12 3 367.31
Agriculture, forestry and fishing 21 5.33 366.32
Other service activities 20.67 14.33 362.67
Human health and social work activities 7.14 10 360.25
Information and communication 12.29 5.86 333.93
Construction 97.4 9.4 286.43
Water supply; sewerage, waste management and remediation activities
26 2 249.29
Administrative and support service activities 22.17 10.33 244.24
Transportation and storage 47.5 15.5 215.82
Accommodation and food service activities 200.5 201 169.66
Manufacturing 28.62 23.86 166.65
Arts, entertainment and recreation 22.6 8.6 155.06
The results of the 2016 Labour Market Survey reveals significant increase of average weekly earnings in four major industries and the recruitment of more employees;
The four industries namely Financial and Insurance activities, Public Administration and defense; compulsory social security, Professional, scientific and technical activities and Real estate activities. This is quite significant as these four industries were not included in the top three industries as recorded in the outcome report of 2013 Labour Market Survey.
The survey findings indicated that Financial and insurance activities had the highest average normal weekly earnings of 1374.4 in comparison to 198.8 in 2013 survey report. Second to the highest is the Public administration and defense; compulsory social security which is 986.88 in 2016 comparing to 316.8 in the previous survey. Third is the Professional, scientific and technical activities 705.88 in 2016 survey and only 385.2 in the 2013 LMS and fourth are the Real estate activities.
Samoa Labour Market Survey Report 2016. 41
The dramatic change was mainly due to the continuous growth and increase in terms of profits gained from the two top industries namely Financial and Insurance activities and Public Administration and defense; compulsory social security. One of the factors that attributes to the significant change is the calibre of employees who are employed at these specialized areas with matching of skills demands and supply within these industries. The consistency for the increase of productivity and the achievement of projected and targeted outputs each year is also considered as one of the contributing factor.
The government under its many initiatives through the Ministry of Commerce, Industry and Labour is expecting more positive changes in the future in terms of encouraging an increase of salaries and wages for the private sector employees. This will further motivate employees, to continue being proactive in the performance of allocated duties and responsibilities and the provision of quality services to business clients and stakeholders

Samoa Labour Market Survey Report 2016. 42
17 Conclusion
The findings and results of the 2016 Labour Market Survey reflect the demands for Accommodation
and food services activities which is a good reflection for Samoa having more newly established large
hotels, motels, beach resorts and small operations at the rural area. This provides more employment
opportunities to our local people especially the unemployed youth at the community level. The
outcome of the 2016 LMS also reveals the types of industries and employment opportunities that are
currently in demand in the labour market. For instance, the Wholesale and retail trade; repair of motor
vehicle and motor cycles. Second is Accommodation with food services activities and third is
manufacturing.
It is understandable that development and improvement of Samoa’s economy is everyone’s business
through introducing more incentives, to attract foreign investment and also local business community
which provide more jobs opportunities at the national level. There is great need for appropriate
training to meet the demand and supply side at earlier stage to ensure what is being taught at training
institutions is aligned on what is expected in the Labour market or industries. It is imperative for the
ministry to continuous strengthening partnership with stakeholders both nationally and
internationally to increase employability of locals in both formal and informal types of employment.
The rapid growth of high technology and the newly emerged patterns of employment with limited
resources is also a challenge for Samoa, to keep up-skilling its workforce, to address current and future
employment issues. It is imperative for government, employers, employees, training institutions,
formal and informal providers, to realize that they have crucial roles to play in addressing and resolving
the emerging employment issues through strong partnership, better networking and exchanging of
labour stats amongst stakeholders.
We acknowledge with great appreciation the support from all employers, stakeholders that assisted
the ministry through the provision of required information and statistics to the assigned enumerators
during the course of the survey. The Ministry of Commerce, Industry and Labour through this survey
is also focused to improve facilitation and creation of more job opportunities both national and
international markets by having consolidated efforts between government and its social partners,
employers and employees.

Samoa Labour Market Survey Report 2016. 43
EMPLOYER DETAILS CHECK
This check of details is used to update the employer register held in the Ministry of Commerce
Industry and Labour. It is a separate document from the survey form.
1. BUSINESS NAME
2. BUSINESS
ADDRESS/LOCATION
___________________________________________
___________________________________________
3. PHONE AND FAX
NUMBER
PHONE ____________________________________
FAX : ___________________________________
4. CONTACT PERSON AND
TITLE
EMAIL/WEBSITE
___________________________________________
___________________________________________
5. NATURE OF BUSINESS
Office use only
Employer Code
.
.
Industry Code
Zone
CONFIDENTIAL
All information collected in this
survey is strictly confidential and
will be used for labour statistical
purposes only
Samoa Labour Market Survey Report 2016. 44
2016 SAMOA LABOUR MARKET / ESTABLISHMENT SURVEY
MINISTRY OF COMMERCE INDUSTRY AND LABOUR
ADDRESS: PO BOX 681, APIA
TELEPHONE : 20441
FAX: 20443
EMAIL: [email protected]
WEBSITE: www.mcil.gov.ws
Purpose of Survey
The purpose of this survey is to collect information from Government Corporations and all
employers in the private sector inclusive Individual employers concerning employment
situation, vacancies, skill shortages and training needs in Samoa.
Confidentiality
All data supplied in this questionnaire will remain strictly confidential to the Ministry of
Commerce Industry and Labour and will not be released in any form that would allow any
individual or business to be identified.
Requirement to provide information
The requirement for employers to provide employment information is covered under the
Labour and Employment Relations Act 2013
Your cooperation and assistance in participating this survey is highly appreciated.
Instructions for the completion of the Survey.
The survey will be conducted by the interviewer/enumerator and in most cases should take
more than 30 minutes.
Information, Assistance or Advice
If you would like any additional information, help or advice in completing this survey, please
contact the AELM Division or Sau Taupisi Faamau, Assistant Chief Executive Officer, on
phone 20 441, 22 323 or Fax 20 443 at the Ministry of Commerce Industry and Labour.

Samoa Labour Market Survey Report 2016. 45
2016 SAMOA LABOUR MARKET / ESTABLISHMENT SURVEY
QUESTION 1. EMPLOYMENT LEVELS
How many employees were employed in your organisation during the last pay period?
Please provide the information in the following categories
Category of Employee Citizen Non-citizen
Male Female Male Female
How many Working Proprietors?
How many Full-time employees?
Of all full time employees above, how many
Shift employees?
Piece employees?
Employees with Disability?
How many Contract officers?
How many Volunteer employees?
How many Part-timers?
How many Unpaid family employees?
Total
QUESTION 2. STAFF TURNOVER
Male Female Total
How many new employees started working
for the organisation in the last 6 months?
(Oct 2015 – March 2016)
How many employees resigned / terminated
from your organisation for any reason in the
last 6 months?
(Oct 2015 – March 2016)

Samoa Labour Market Survey Report 2016. 46
QUESTION 3. VACANT POSITIONS
Do you have any vacant positions at present?
Yes
Go to Q 4
No
Go to Q 5
QUESTION 4. DETAILS OF VACANCIES
Which positions are vacant and give reasons why?
Position title Number
of
vacancies
Why is the position vacant?
1.
2.
3.
4.

47
QUESTION 5. SKILL SHORTAGES
Are you having difficulties recruiting employees with the right skills?
Yes
Go to Q6
No
Go to Q7
QUESTION 6. DETAILS ON SKILL SHORTAGES
Which positions are affected by skill shortages? List in order of priority.
Position title Skills shortages (Provide / describe the skills needed)
1.
2.
3.
4.

48
QUESTION 7. TRAINING NEEDS
Do some of your existing employees need further training of the required skills to
improve performances and quality services?
Yes
Go to Q 8
No
Go to Q 9
QUESTION 8. SPECIFIC TRAINING REQUIRED
Position title
What Skills or Training is required (Provide brief description)
Number of employees to be trained
Males Females TOTAL
1.
2.
3.
4.

QUESTION 9. TRAINING COURSES
Have any of your employees completed a skills training course at the School of
Applied Science, vocational training institute, or a private training provider in
Samoa?
Yes
Go to Q10
No
Go to Q11
QUESTION 10. TRAINING COURSES COMPLETED BY EMPLOYEES
Position Title Training Course
completed
Name of Training
Provider
Is the course
relevant to
employee’s
current
position?
Yes/No
Skill level of employee
Describe whether trade
certificate, office skills course
School certificate or tertiary
courses
List the name of the training
provider Satisfactory
List any particular strength
Unsatisfactory Comment on why skills were
unsatisfactory
Use additional sheet if necessary
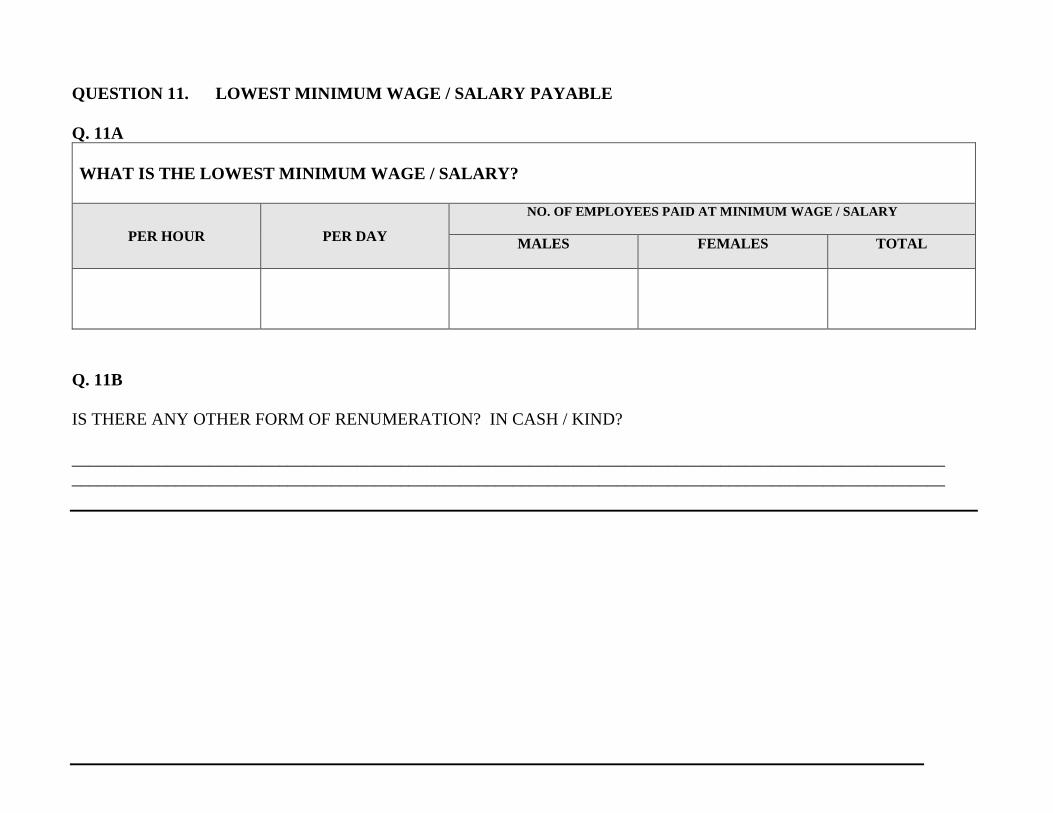
1
QUESTION 11. LOWEST MINIMUM WAGE / SALARY PAYABLE
Q. 11A
WHAT IS THE LOWEST MINIMUM WAGE / SALARY?
PER HOUR PER DAY
NO. OF EMPLOYEES PAID AT MINIMUM WAGE / SALARY
MALES
FEMALES TOTAL
Q. 11B
IS THERE ANY OTHER FORM OF RENUMERATION? IN CASH / KIND?
_____________________________________________________________________________________________________
_____________________________________________________________________________________________________

2
QUESTION 12. OCCUPATIONAL HEALTH AND SAFETY
Does your business / company have in place an evacuation plan in case of an
emergency or natural disaster?
Yes
No
Does the work your business / company require employees to provide personal
protective equipments (PPE)?
Yes
No
If so, what Personal Protective Equipments (PPE) and clothing do you provide to your employees?
List of PPEs List of PPEs continue
1.
2
5
6
3
4.
7
8
Does your business / company have a OSH safety officer?
Yes
No
Does your business / company have in place an Accident Register to document all
accidents, incidents and near misses that take place in the work place?
Yes
No
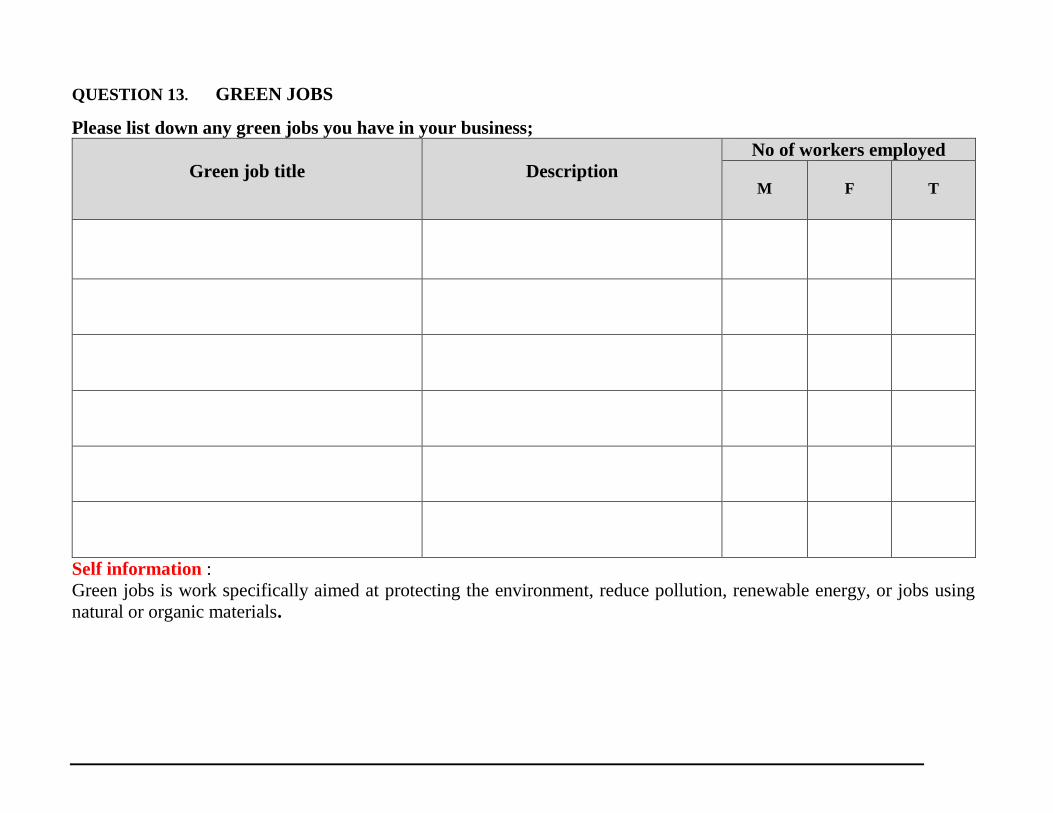
3
QUESTION 13. GREEN JOBS
Please list down any green jobs you have in your business;
Green job title
Description
No of workers employed
M
F
T
Self information :
Green jobs is work specifically aimed at protecting the environment, reduce pollution, renewable energy, or jobs using
natural or organic materials.

4
QUESTION 14. EMPLOYEE CHARACTERISTICS 1 2 3 4 5 6 7 8 9 10 11
Job Title
ISCO
code
Gender
Age
Group
Highest
education
level reached
Status of
present
employment
Country of
Citizenship (Only if non
Samoan)
Work
Permit
Normal
Hours
worked
per day
Normal
hours
worked
per week
Pay Period
Normal
wages
per pay
period
List each employee once.
Where an employee does
different jobs list the position
where he/she spends most of
his/her time
Office
use
only
Male 1
Female 2
Code
<15yrs1
15-19 2
20-29 3
30-49 4
50 + 5
Code
Primary 1
Secondary 2
TVET/PSET 3
Tertiary 4
Code
Full-time 1
Part-time 2
Contract 3
Volunteer 4
Unpaid 5
Shift 6
Piece 7
Work
permit
expiry
date
mm//yy
Code Daily 1
Weekly 2
F/night 3
Monthly 4
1
2
3
4
5
6
7
8
9
10

5