Embed Size (px)
Citation preview
Increasing Labor Demand andLabor Productivity in Ghana
African Economic PolicyDiscussion Paper Number 50
February 2001
George Gyan-Baffour, Howard UniversityCharles Betsey, Howard University
in collaboration with
Kwadwo Tutu, University of GhanaKwabia Boateng, University of Ghana
Funded byUnited States Agency for International Development
Bureau for AfricaOffice of Sustainable Development
Washington, DC 20523-4600
The views and interpretations in this paper are those of the author(s)and not necessarily of the affiliated institutions.
Equity and Growth through Economic Research
EAGER supports economic and social science policy analysis in Sub-Saharan Africa. Its primary goal is to increasethe availability and the use of policy analysis by both public and private sector decision-makers. In addition to the goalof achieving policy reform, EAGER seeks to improve the capacity of African researchers and research organizationsto contribute to policy debates in their countries. In support of this goal, EAGER sponsors collaboration amongAmerican and African researchers and research organizations.
EAGER is implemented through two cooperative agreements and a communications logistics contract financed by theUnited States Agency for International Development (USAID), Strategic Analysis Division, The Office of SustainableDevelopment, Bureau for Africa. A consortium led by the Harvard Institute for International Development (HIID)holds the cooperative agreement for Public Strategies for Growth and Equity. Associates for International Resourcesand Development (AIRD) leads the group that holds the cooperative agreement for Trade Regimes and Growth. TheCommunications Logistics Contract (CLC) is held by a consortium led by BHM International, Inc. (BHM). Othercapacity-building support provides for policy analysis by African institutions including the African Economic ResearchConsortium, Réseau sur Les Politiques Industrielles (Network on Industrial Policy), Programme Troisième CycleInteruniversitaire en Economie, and the International Center for Economic Growth. Clients for EAGER researchactivities include African governments and private organizations, USAID country missions and USAID/Washington,and other donors.
For information contact:
Yoon Lee, Project OfficerUSAID
AFR/SD/SA (4.06-115)Washington, D.C. 20523
Tel: 202-712-4281 Fax: 202-216-3373E-mail: [email protected]
J. Dirck Stryker, Chief of PartyAssociates for International
Resources and Development (AIRD)185 Alewife Brook Parkway
Cambridge, MA 02138Tel: 617-864-7770 Fax: 617-864-5386
E-mail: [email protected] AOT-0546-A-00-5073-00
Lisa M. Matt, Senior Advisor
BHM InternationalP.O. Box 3415
Alexandria, VA 22302Tel: 703-299-0650 Fax: 703-299-0651
E-mail: [email protected] AOT-0546-Q-00-5271-00
Sarah Van Norden, Project AdministratorBelfer Center for Science & International Affairs
John F. Kennedy School of Government 79 John F. Kennedy Street
Cambridge, MA 02138 USA Phone: 617-496-0112 Fax: 617-496-2911 E-mail: [email protected]
Contract AOT-0546-A-00-5133-00
Abstract
The purpose of this study is to propose policies aimed at enhancing labor demand and laborproductivity in Ghana. Consequently, the study has three main objectives. The first objective is toidentify the determinants of labor demand in Ghana. This includes measuring the substitutionparameters between homogenous labor and capital, and indirectly estimating the own-wageelasticity of demand for labor as well as the cross-elasticities among heterogeneous labor inputs.The second objective is to assess the effects of some conceptually identified non-firm-levelfactors, such as hiring and firing regulations, on the demand for labor. The third objective is tomodel value-added per worker, a surrogate for labor productivity, as a function of firm-levelvariables such as the capital-labor ratio, the real wages paid to workers, the type of ownership,the age of machinery and equipment used by firms, and the capacity utilization.
The study used panel data from five manufacturing industries and cross-sectional data from firmsacross all sectors of the economy. The panel data covers the period 1972 to 1984 while the cross-sectional data was collected in 1995. Results of the study revealed that there is considerable easein substitution between capital and labor in the industries studied. This suggests that firms replaceworkers with machinery and thus reduce the demand for labor when the price of machinerybecomes cheaper relative to wages either through subsidized cost of credit or overvaluedcurrency. The study found that firms’ labor demand is to a large extent influenced by whooperates the firms and how. For example, foreign-owned firms tend to hire more workers, whilefirms with higher capacity utilization also employ more workers. While the data could not allowus to discriminate between public and private ownership, we think such a distinction may haverevealed profound effects on the employment level and productivity. Further assessment of labordemand concluded that capital constraints, concerns about firing laws, and labor costs are majorfactors reducing the likelihood that firms will hire more workers.
The assessment of the determinants of labor productivity showed that the capital-labor ratio,wages of production workers, and capacity utilization are the major factors with statisticallysignificant impacts on value-added per worker. Finally, the study found out that there has been aconsistent technical retrogression over time in the manufacturing industries studied. Variouspolicy recommendations have been made in the executive summary based on the findings.
Authors:
George Gyan-Baffour [[email protected]] is a Professor of Management in the Department ofManagement, School of Business at Howard University. He holds a Ph.D. in industrial relationsfrom the University of Wisconsin - Madison. He worked in investment promotions for theMinistry of Industries, Science and Technology in Ghana between 1974 and 1984. His researchinterests are in the areas of employment, human resources development and management, andpoverty alleviation through investment promotion.
Charles Betsey [[email protected]] is Graduate Professor in the Department of Economicsat Howard University. He holds a Ph.D. in economics from the University of Michigan-AnnArbor. His experience has included work at the Congressional Budget Office, the U.S.Department of Labor, and in various research organizations including the Urban Institute and theNational Research Council. His research covers a number of areas including, foreign trade and itsimpact on the U.S. economy, low-wage labor markets, the effectiveness of employment ofemployment and training programs, the economic status of minorities, and labor economicsgenerally.
Acknowledgement
The preparation of this report was made possible by the dedicated efforts of several researchersfrom Howard University and the University of Ghana. Notable among them were Dr. CharlesBetsey of the economics department at Howard University, who was the co-principal investigator,and Drs. Kwadwo Tutu and Kwabia Boateng of the economics department, University of Ghana,who were the local researchers. Their input was immense and critical to the successful completionof the study.
I would also like to thank Dr. J. L. S. Abbey, of CEPA, the chairman of the Research AdvisoryCommittee (RAC) for the study, and all the members of the committee, including Dr. Jones OforiAtta, Mr. Vurmawo, Deputy Secretary General of the TUC, and Mr. Amoasi, Ghana EmployersAssociation. Their useful comments on the initial proposal and the subsequent presentationshelped sharpen the focus of the study.
Finally, my sincere thanks go to Bob Young of USAID for his personal interest and informedcritique of the study. Even though I could not satisfy Bob's intellectual curiosity fully, hiscritiques, comments, and suggestions enhanced the quality of the final product and I thank him forthat.
While the invaluable contributions and comments from all parties acknowledged here helpedenrich the study and made it a better document, the responsibility for any errors, omissions, anddefects in the study are solely mine.
George Gyan-Baffour, Washington, D.C
Table of Contents
Executive Summary ……………………………………………………………………….1Introduction…………………………………………………………………………………6Characteristics of the Labor Markets in Ghana……………………………………………. 7Labor Force, Employment, and Unemployment…………………………………………… 7Formal/Informal Sectors…………………………………………………………………… 8Rural/Urban Labor Markets……………………………………………………………….. 10
Education, Gender, and the Labor Market………………………………………….10The Industrial Relations System…………………………………………………… 11
The Actors…………………………………………………………………. 11The Context ……………………………………………………………….. 12The Outcome………………………………………………………………. 12
Labor Supply and Demand……………….……………………………………….. 12Labor Productivity………………………………………………………………… 13
The Theoretical and Analytical Framework……………………………………………….. 15The Effect of the Wage Rate and other Factor Prices on Labor Demand…………..15The Ease of Use in the Production Process…………………………………………16
The Effects of Labor Market Policies on Labor Demand………………………………….. 16Productivity and the Production Process………………………………………….. 17Determinants of Productivity……………………………………………………… 17Labor Demand & Labor Productivity and Labor Productivity Models…………… 18
The Data Used ……………………………………………………………………..18Results………………………………………………………………………………………19
Food, Tobacco, and Beverages Industry (ISIC 31)…..……………………………. 19The Comparative Analysis Across all Five Industries ……………………………. 22
Policy Implications of the Study…………………………………………………………… 25References…………………………………………………………………………………..28Appendix A -Tables……………………………………………………………………….. 30Appendix B - Models of Labor Demand/Labor Productivity……………………………… 43
EXECUTIVE SUMMARY
The Ghanaian economy is characterized by low employment growth and low labor productivityagainst a backdrop of a relatively high growth in population. The labor force is growing fasterthan the rate of job creation. This imbalance is exerting negative pressure on economic growthand development. Reversal of the tendency requires a vigorous policy aimed at promotingemployment. Trends, however, indicate that not only has employment not been able to keep upwith growth in the labor force, but that for over three decades formal sector employment has beendeclining. Furthermore, the level of real wages cannot be sustained because productivity has notbeen rising enough to cope with increases in the size of the labor force. Available data on laborproductivity in the manufacturing sector suggests that the productivity in Ghanaian firms is lowerthan that of firms in other African nations, and certainly lower than the productivity of firms indeveloped economies. The purpose of this study is to identify the determinants of employmentdemand and labor productivity in Ghana. This study also proposes policies that will help increaseemployment levels, enhance the purchasing power of the population, improve labor productivity,and make local firms more competitive in an interdependent global economy.
Historical data (1972-1984) from five manufacturing industries and a 1995 cross-sectional surveyof selected firms across all sectors of the Ghanaian economy were used to assess the impact oftheoretically developed factors on labor demand and labor productivity. This study provides adetailed analysis of labor demand and labor productivity in the five industries studied. It alsoprovides recent trends in employment levels across major occupational categories and acrosssectors.
Employment Trends Across Occupational Categories and Sectors
Results from the survey data shows that employers think that the overall employment level in thesurveyed firms went up between 1980 and 1990 but declined slightly between 1990 and 1995.However, there was some slight increase in employment at the managerial level between 1990 and1995. Furthermore, employment of the technical or production workers actually went up in 1990but declined precipitously thereafter. This is obviously the effect of the well-discussed decline inemployment in the manufacturing sector since 1990. While there was a decline in employment ofunskilled workers between 1980 and 1990, there has been a strong rally in this employmentcategory in the interim.
The study also shows that the bulk of employment has been in the non-tradable sector. It is alsoobvious that while the employment level in the tradable sector has increased dramatically, theincrease does not translate into large head counts because of its low employment base comparedwith the base in the non-tradable sector where, unfortunately, the level has been declining. Withtrade liberalization, it is expected that there will be a decline in labor demand in the importablesector, and we expect an increase in demand in the exportable sector (Edwards and Edwards,1994). The evidence of an overall increase in demand in the tradable sector suggests that theincrease in labor demand in the exportable sector more than offsets the decline in employment inthe importable sector. This seems to be a good employment response to the trade liberalizationregime that began in 1984. The policy implication is that there is a need for further incentives for
2
firms in the exportable sector, either financial or non-financial. On the other hand, we alsoexpected that the removal of capital controls in 1984 should have increased employment in thenon-tradable sector through a positive expenditure effect (Edwards and Edwards, 1994, p143).The evidence here, however, suggests the opposite has occurred.
Determinants of Employment Demand
The elasticity of substitution between labor and capital based on the historical data ranged from0.226 in the garment industry to 0.572 in the paper and printing industry. This suggests that as therelative price of labor to capital increases (declines) by 10%, the relative use of capital to laborincreases (declines) by between 2.26 % in the garment industry and by about 5.70% in the paperand printing industry. Thus a policy that reduces the relative price of capital tends to discouragethe hiring of labor and encourage the use of more capital in all industries studied, but more so inthe paper and printing industry. This finding of the greater ease of substitutability between capitaland labor in the paper and printing industry supports the high capital-labor ratio in the industryreported elsewhere in this report. It should be noted that during the period under study, importedmachinery and equipment were relatively cheap due to overvalued currency. Consequently, it wascheaper for firms in the paper and printing industry to replace people with machinery. In general,the relatively high elasticity of substitution across the five industries provided firms greaterincentive to replace people with machinery. The current liberalization of the capital market andthe removal of subsidies on credit as a result of the structural adjustment program will makecapital relatively more expensive than labor and will encourage more employment in the industrialsector unless existing hiring and firing rigidities encourage employers to do otherwise.
The own-wage elasticity of demand for homogenous labor in the sectors studied ranges from0.171 in the non-metallic industry through 0.287 in the food, tobacco, and beverages industry, toa high of 0.495 in the paper and printing industry. These estimates fall within the expected rangeof 0.15 and 0.75 (Hammermesh, 1993, p.135). These suggest that the manufacturing sector inGhana will benefit from average labor demand increases when the general level of wages declines,and vice-versa with the paper and printing sector experiencing more changes, followed by thefood, tobacco, and beverages sector. Given that the food sector is also the major employer amongthe industries surveyed, it will lose the most workers in response to mandated increase in wagesand will absorb the most when wages are flexible downwards.
The study shows that skilled labor demand is more sensitive to wage changes in the garmentindustry, followed by the food, tobacco, and beverages industry. The industries with the leastsensitivity to skilled labor wage changes are the paper and printing and the non-metallic industries.Again, unskilled labor demand is most sensitive to wage changes in the garment industry,followed by the metal and food industries. In general, the own-wage elasticity of demand forskilled labor is greater than that of unskilled labor in all but the metal industry. This findingsuggests that an increase in skilled wage will reduce skilled employment more than a similar
3
proportionate increase in unskilled wage will affect unskilled employment. Consequently, selectiveincreases in wages of skilled workers require caution lest they reduce overall employment.
The cross-elasticity of demand for skilled and unskilled labor indicates that they are substitutes.When the wage of skilled labor increases, more unskilled workers are hired to replace the skilledlabor lost due to wage increases. Similarly, when the wage of unskilled labor increases, there isthe tendency for skilled labor to be hired to replace the lost unskilled workers. Thus, while anincrease in unskilled wages generates a relatively higher decline in unskilled employment than theincrease in skilled employment that ensues, the high cost of hiring skilled workers can raiseproduction cost drastically. On the other hand, an increase in the wages of skilled workers willtend to reduce the number of skilled workers hired and to increase the number of unskilledworkers hired, thus reducing the total cost of production. The resulting policy implication is thatmandated minimum wage increases have the tendency to increase employment of higher paidskilled workers with an associated increase in production cost. Unless the use of more skilledworkers results in higher productivity, the higher cost of production may have to be absorbed byfirms or passed on as higher prices to consumers. Either case may make the firms lesscompetitive.
The study also shows that a major determinant of labor demand is real output produced by thefirm. The implication for the robust positive effects of real output on employment is that firms thatare able to produce more are more likely to hire more workers. First, firms will produce moreonly if they can sell more. Controlling for demand, firms can sell more if their products arecompetitive on the market. The implication of this finding is that firms will be able to employmore if they can be competitive, and that policies that increase competitiveness such asproductivity enhancement, privatization, and openness will enhance labor absorption.
Furthermore, the study shows that the capital-labor ratio bore no negative effect on the level ofemployment. This suggests that capital-intensive technologies do not necessarily lead to lowerlevels of employment. The study also suggests that a firm’s demand for labor is influenced by whooperates the firm and how. For example, the effect of capacity utilization on employment demandwas in the expected direction for all the equations and was significant in the food, tobacco andbeverages industry equations. The implication here is that firms that operate at near capacity tendto hire more workers. The ability of firms within a given industry to operate at levels of capacityhigher than competitors depends on the resourcefulness of the firm’s management. Another policyimplication of this finding regards the benefit of increased training for current and futuremanagers. Furthermore, the results show that the effect of foreign ownership on employmentlevels was positive and significant in most equations. This suggests that multinational corporationstend to employ more workers than do indigenous firms. This is also probably due to bettermanagement and efficiency associated with these multinationals. It follows that there is a need tovigorously encourage foreign direct investment. Finally, the survey data suggests that capitalconstraints, concerns about firing laws, and labor cost constraints are major factors reducing thelikelihood that firms will hire additional workers. Furthermore, while unions may have negative

4
effects on the likelihood of firms hiring more workers, the effect is not statistically significant.However, firms that are facing more industrial actions are likely to hire less. The policyimplications here are obvious. First, there is the need to ease credit availability to businesses ingeneral. Second, there has to be some review of the current hiring and firing laws in order toreduce the cost of hiring workers. Third, there is the need to shift labor actions from the politicalarena into the industrial realm as a way of encouraging direct, non-political, and more peacefulemployer-employee/union bargaining and negotiations processes.
Determinants of Labor Productivity
As indicated earlier, the highest value-added per employee was recorded in the food, tobacco, andbeverages industry, followed by the paper and printing industry. The study also shows that realwages for production workers were highest in the food, tobacco, and beverages industry. Thisfinding is not surprising. Since the food, tobacco, and beverages industry is the most efficientindustry, it can pay its workers high wages. Alternatively, the industry is perhaps the mostefficient because it can attract highly qualified workers. This finding suggests that productivitycorrelates positively with level of training, experience, and qualification. A significant implicationof this finding is the need for increasing both on-the-job and general training in order to provideworkers with the necessary skills and qualifications.
The study confirms that capital-labor ratio, wages, and capacity utilization are the majordeterminants of value-added per worker in the industries surveyed. There are several implicationsfor these findings. First, there is the need to update the firms’ technology to include relativelymore capital-intensive technologies. A major policy recommendation is to ease credit availabilityfor the purpose of updating technologies. Second, even though capital-intensive technology isneeded to increase productivity, investment in human capital, as demonstrated by the level ofwages, is critical for productivity increase. Another policy implication of this finding is the needto encourage both on-the-job training as well as general skill training through government-industry partnership.
The study also indicates that for many of the years under study, the coefficients of the yeardummy variables were negative and highly significant across all sectors. This finding implies thatthere has been a consistent technological retrogression in the manufacturing sector over the yearsunder investigation. There is therefore a need for purposeful research and development programsin the industrial sector. This can take the form of a partnership between the corporate world andthe research institutions, such as those under the Council for Scientific and Industrial Research ofGhana (CSIR) facilitated by Government.
5
Employment, Productivity, and Wage Nexus
The study shows that the food, tobacco, and beverages industry (ISIC 31) was the majoremployer of production workers. The industry with the least average employment was paper andprinting (ISIC 34). It is further shown that value-added per worker was highest in the food,tobacco, and beverages industry followed by the paper and printing industry. Thus the food,tobacco, and beverages industry is both the major employer and the most productive industryamong the industries studied. The industry is more likely to hire more workers and also be morecompetitive with imports than any other industry studied due to its high level of productivity. Toenhance both labor absorption and labor productivity in the manufacturing sector, resourcesshould be directed to the food, tobacco and beverages sector.
Again, while the paper and printing industry registered the lowest level of employment, it had thesecond highest value-added per worker. This finding, together with the finding that the food,tobacco, and beverages industry had the highest employment level and highest value-added perworker, indicates that there is no a priori relationship between employment level and productivity.Both high and low employment levels are compatible with high levels of productivity.
Finally, the study shows that the paper and printing industry is the most capital-intensive industry,followed by the metal industry. The food, tobacco, and beverages industry is the least capital-intensive. The interesting finding here is that while the food, tobacco, and beverages industry isthe least capital-intensive, it is the one with the highest value-added per worker and with thehighest paid employees. This suggests that the wage rate, as a surrogate for human capital, is abetter predictor of productivity than capital intensity. The implication of this finding is clear.Productivity and competitiveness of firms in Ghana hinge, to a very large extent, on theappropriateness of available human capital. This requires a vigorous campaign of relevanttechnical and managerial training geared towards the needs of the marketplace.
6
Introduction
The Ghanaian economy is characterized by low employment growth and low labor productivityagainst a backdrop of a relatively high growth in population. The labor force is growing fasterthan the rate of job creation. This imbalance is exerting pressure on economic growth anddevelopment of the country. Reversal of the tendency requires a vigorous policy aimed atpromoting employment. Trends, however, indicate that not only has employment not been able tokeep up with growth in the labor force, but that employment decreased at an annual rate of 1.4%in the formal sector between 1960 and 1991 (ISSER, 1995) and has continued to decline.Furthermore, with such an increase in labor force, productivity of labor has to increase enough toprovide employment at the same level of real wage. Additional increase in real wage will requirefurther increase in productivity. However, available data on labor productivity in themanufacturing sector suggests that the productivity of firms in Ghana is lower than that of firms inother African nations, and has been declining since 1991. A more recent study (Teal, 1998) alsoconcludes that the substantial growth recorded in the manufacturing sector between 1991 and1995 occurred through increases in both labor and capital inputs, with no evidence of a rise inunderlying productivity over time. The current study focuses on efforts to increase labor demandand labor productivity in Ghana. First, it assesses the determinants of employers' decisions aboutthe number of workers employed. Second, it assesses the determinants of the variability inworkers’ productivity. Based on the relative importance of identified determinants of labordemand and productivity, the paper will propose policies for increasing labor absorption and forenhancing labor productivity in Ghana. The aims of such policy proposals are to help reduceunemployment, enhance the purchasing power of the population, reduce poverty, pre-empt morehardships in the future, and make firms more efficient in the utilization of labor resources in orderto strengthen them and prevent further de-industrialization of the economy.
The research has three main objectives. The first objective is to identify the determinants of firms’choices regarding the appropriate inputs of workers used in production in relation to otherproductive inputs. This includes measuring the parameters describing the demand for labor, suchas the elasticity of demand for labor and the substitution parameters between homogenous laborand capital, as well as among heterogeneous labor inputs. Second, the study focuses on the effectsof regulations and other policies on demand for labor. This includes the effects of hiring and firingregulations on the demand for labor. Additionally, we explore other labor market distortions, suchas unionism and their impact on labor demand. Third, the study focuses on the effects of firm-level factors on labor productivity. In the following section, we describe the labor market and theindustrial relations system in Ghana to provide readers with some understanding of the context inwhich the exchange of Ghana’s labor resources and their utilization in production take place.
7
Characteristics of the Labor Markets in Ghana
Social inequities such as persistent poverty, income inequality, unequal access to education andtraining, and the emergence of non-competing groups in labor markets are more pronouncedwhen these markets are subject to many market imperfections. In a developing economy with ahigh degree of imperfection like Ghana’s, markets are often sheltered from competitive forces dueto constraints such as physical or occupational mobility, technological dualism, and differences ineducation across regions and groups. Consequently, the labor market in Ghana is characterized bysubtle yet profound segmentation by region, by socio-economic status, by gender, and, to a lesserextent, by institutional factors such as unions and social employment norms and customs. Thelabor market segmentation affects the degree of labor force participation, employers’ decisionsabout employment, and wage setting across various sectors of the economy and population.
Labor Force, Employment and Unemployment
The UN African Statistical Yearbook for 1990/91 estimated the economically active population inGhana in 1990 to be 5,686,000, or 38% of a total population of 15,028,0001. The economicallyactive population is equally divided between the agricultural labor force, with a population of2,839,000, and the non-agricultural labor force, with a population of 2,847,000. The GhanaStatistical Services Quarterly Digest of Statistics estimates that only 229,000 of the economicallyactive population (4% of the non-agricultural labor force) were employed in the formal sector. Onthe other hand, the Jobs and Skills Program for Africa (JASPA) estimates that about 1,266,000,or 44% of the non-agricultural labor force, is employed in the informal sector. Assuming that allinformal sector employment were in the non-agricultural sector, then unemployment in the non-agricultural sector alone in 1990 was as high as 1,282,000 or 45% of the non-agricultural laborforce. While the data reported here is somewhat dated, it nonetheless gives a more realisticdepiction of the employment situation in Ghana than most official statistics seem to suggest.
For example, The ILO Yearbook of Labor Statistics reported a registered non-agriculturalunemployment figure of 31,000 for 1990. This figure, considered as a percentage of the non-agricultural labor force of 2.847 million, suggests an unemployment rate of 1%. A more recentestimate puts the unemployment rate at 5.5% of the active population (Beaudry and Sowa, 1994).The first estimate is admittedly based on registered unemployment. Considering the infantile stageof labor market institutions in Ghana, recorded information by the employment agencies is a grossunder-representation of actual unemployment. The second estimate was calculated from theGhana Living Standards Survey (GLSS). The GLSS defines unemployment to include activepeople either searching for jobs in the last one week, waiting to start new jobs, or not searchingfor jobs because they did not believe jobs were available.
The estimates from the GLSS and the ILO Labor Statistics notwithstanding, a casual observationof the streets and alleys in both the rural and urban areas in Ghana during working hours suggests 1 It is estimated that the population was 19 million in 1995 and would be 24 million by this year (ISSER, 1995).
8
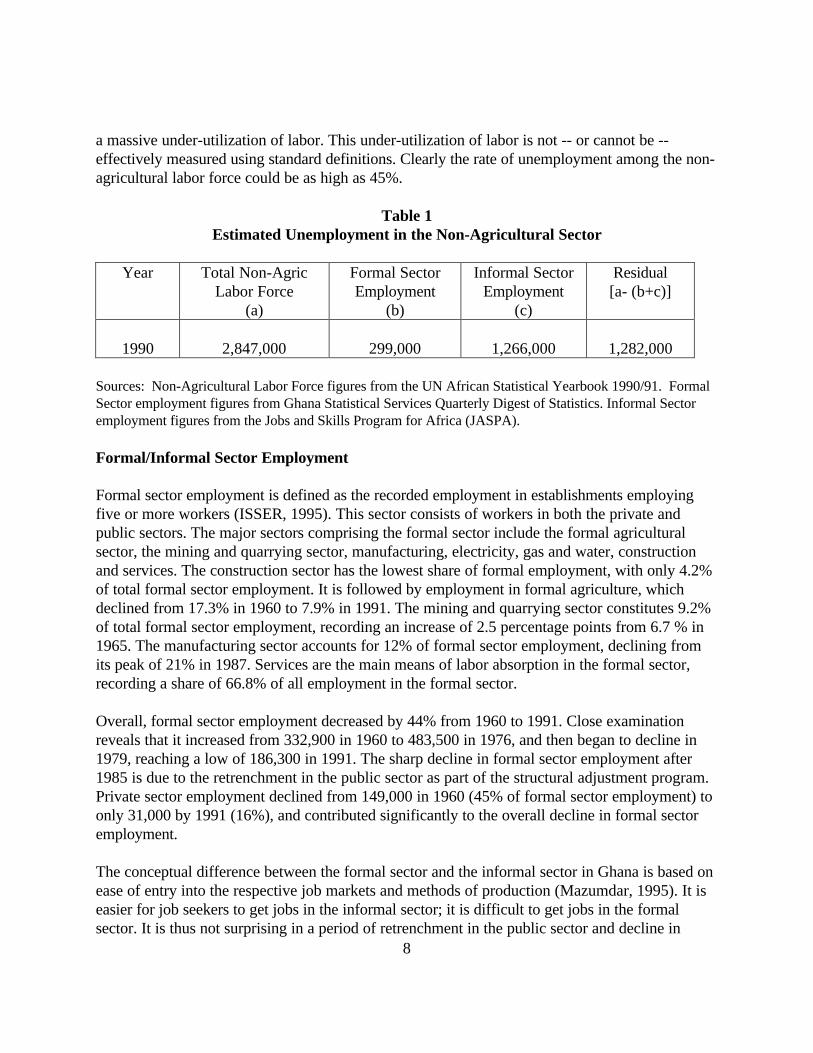
a massive under-utilization of labor. This under-utilization of labor is not -- or cannot be --effectively measured using standard definitions. Clearly the rate of unemployment among the non-agricultural labor force could be as high as 45%.
Table 1Estimated Unemployment in the Non-Agricultural Sector
Year Total Non-AgricLabor Force
(a)
Formal SectorEmployment
(b)
Informal SectorEmployment
(c)
Residual[a- (b+c)]
1990 2,847,000 299,000 1,266,000 1,282,000
Sources: Non-Agricultural Labor Force figures from the UN African Statistical Yearbook 1990/91. FormalSector employment figures from Ghana Statistical Services Quarterly Digest of Statistics. Informal Sectoremployment figures from the Jobs and Skills Program for Africa (JASPA).
Formal/Informal Sector Employment
Formal sector employment is defined as the recorded employment in establishments employingfive or more workers (ISSER, 1995). This sector consists of workers in both the private andpublic sectors. The major sectors comprising the formal sector include the formal agriculturalsector, the mining and quarrying sector, manufacturing, electricity, gas and water, constructionand services. The construction sector has the lowest share of formal employment, with only 4.2%of total formal sector employment. It is followed by employment in formal agriculture, whichdeclined from 17.3% in 1960 to 7.9% in 1991. The mining and quarrying sector constitutes 9.2%of total formal sector employment, recording an increase of 2.5 percentage points from 6.7 % in1965. The manufacturing sector accounts for 12% of formal sector employment, declining fromits peak of 21% in 1987. Services are the main means of labor absorption in the formal sector,recording a share of 66.8% of all employment in the formal sector.
Overall, formal sector employment decreased by 44% from 1960 to 1991. Close examinationreveals that it increased from 332,900 in 1960 to 483,500 in 1976, and then began to decline in1979, reaching a low of 186,300 in 1991. The sharp decline in formal sector employment after1985 is due to the retrenchment in the public sector as part of the structural adjustment program.Private sector employment declined from 149,000 in 1960 (45% of formal sector employment) toonly 31,000 by 1991 (16%), and contributed significantly to the overall decline in formal sectoremployment.
The conceptual difference between the formal sector and the informal sector in Ghana is based onease of entry into the respective job markets and methods of production (Mazumdar, 1995). It iseasier for job seekers to get jobs in the informal sector; it is difficult to get jobs in the formalsector. It is thus not surprising in a period of retrenchment in the public sector and decline in
9
overall employment in the formal sector that employment in the informal sector has beenincreasing. It is estimated that in 1990, the share of informal sector employment in total overallemployment was 45%, and its share of urban employment was between 60% and 84%.
The informal sector in Ghana consists of two major sub-groups: the wage earners and the self-employed. Although casual observation suggests a surge in the number of self-employed workers,entry into the informal sector may be easier for the wage earners than for the self-employed. Thisis because the wage earners tend to operate in a more flexible labor market with no institutionalconstraints, such as union-bargained wages and legislated minimum wages. Consequently, wagesare not held above the supply price. Wage flexibility in this sector provides job seekers with easyaccess to jobs as long as they are willing to accept wages below the prevailing levels.
Self-employed labor is characterized by the existence of entrepreneurial skills as well as workingcapital, and it can be divided into different categories according to the size of capital and/or theextent of overhead carried. In fact, the return on investment of this group of "owner-workers"reflects, to a large extent, the size of capital available to them and the overhead cost incurred. Theearnings that self-employed gain are usually for their labor, their enterprise, and their capital.
The wide disparity in the use of capital and entrepreneurial skills tends to define the dispersion ofearnings in the sector. Owner-workers possessing large capital and good entrepreneurial skillsmay earn more than workers in the formal sector. Nevertheless, it is quite obvious that some ofthem with little or virtually no personal capital who rely on financial means owned by largerbusinessmen, may face wages lower than those earned by casual laborers.
A major segmentation in the Ghanaian labor market is the division between the formal andinformal sector. Whereas it is easy to enter the informal sector, entry into the formal sector isdifficult. The reasons for the difficulty in entering the formal sector include the retrenchmentexercise carried out in the public sector during the Structural Adjustment Program (SAP) and theeffects of import liberalization on manufacturing employment.
Even though there is no data on average earnings in the informal sector, the surge of employmentin the sector and the flexibility associated with its wages suggest a downward pressure oninformal earnings. At the same time, compression of wages in the public sector and the minimumwage increases paid by employers in the formal sector suggest that average earnings in the formalsector exceed average earnings in the informal sector. The differences in earnings between thetwo sectors and the protection accorded the employees in the formal sector due to a de factoemployment freeze in the public sector, has created a "labor aristocracy" in the urban labormarket. A small proportion of the labor force privileged to be employed in the formal sectorcontrols a large proportion of the income generated in this more modern sector. Meanwhile, alarge number of workers are left to share the dwindling income in the informal sector and deniedentry into the formal sector.
10
As mentioned earlier, the JASPA estimates that total employment in the informal sector hasincreased in the last two decades by 250%, moving from 356,000 in 1970 to 1,266,000 in 1990.The informal sector is usually the employer of last resort, mainly because of the ease of entryassociated with it and the relatively unstructured nature of its operations. Consequently, it attractsworkers with low potential to obtain employment in the formal sector, especially migrants fromrural communities possessing little or no formal education.
Rural/Urban Labor Markets
The rural labor market in Ghana has the largest share of the active population, with a ratio of ruralto urban employment of 4:3. Farm labor dominates the rural labor market; while the formal andinformal sectors of the economy are diffused into both the rural and urban markets, there is agreater concentration of both in the urban labor market.
Even though there seems to be evidence of a rural-urban shift in Ghana, the transmissionmechanism may be different from that postulated in the Harris and Todaro model. Migrants donot move to the urban areas with expectations of jobs in the formal sector. In general, migrantsseem to have accepted the fact that there are no jobs in the formal sector, and come to the urbancenters with the hope of owning their own businesses. The expectation is not to join the formalsector but to be part of the informal sector, which is easier to enter. This interpretation suggeststhat the wages in the urban informal sectors are higher than rural wages.
Education, Gender and the Labor Market
Segmentation of the labor market also occurs when attributes of labor are used as labels in hiringemployees or selecting occupations. When this happens, the labor market may be split into non-competing groups. In Ghana, the most significant of such attributes are gender and education.Women typically self-select themselves into retail self-employment. For instance, over 33% ofwomen, as compared with 17% of men, work in household businesses, while the ratio of men towomen in the formal sector exceeds 3.0 (Beaudry and Sowa, 1994, p. 370). Even though somewomen’s incomes in the household business sector may be relatively high, a large proportion ofwomen, especially among the younger ones, is driven into a narrow and lower band of householdbusiness (e.g. as peddlers of, say, "iced water"). Another characteristic associated with women’semployment is the relatively lower level of education received by women. According to recentestimates, fewer than 30% of women in Ghana have education above primary school level, ascompared with 50% for men. The women’s lower level of education, as well as their self-selectionprocess, restricts their entry into higher paying jobs in government, state enterprises, and theprivate non-household sectors.
Another source of segmentation in the labor market is unionism. Even though unions in Ghana arenot as militant as elsewhere in Africa, they have the potential of creating competing groups thatare worth mentioning. We therefore discuss the industrial relations system in Ghana and discuss
11
the legal and regulatory framework in which the exchange of labor takes place.
The Industrial Relations System
The Actors
The main actors in the industrial relations system of Ghana are the workers and their unions, theemployers and their representatives, and the government agencies concerned with workers,enterprises, and their relationships. The role of government in most industrial relations systems isindirect. However, since the government of Ghana has historically been the single most importantemployer of labor, its role in the system of industrial relations has been unusually strong.
During the 1960s and throughout the First Republic, the Trades Union Congress (TUC) -- thefederation of all unions in Ghana -- was an instrument of government control over labor as thegovernment appointed its leaders. Between 1966 and 1971, the First Military government and,later, the Busiah administration, attempted to sever relations with the unions and adopt a policy ofconfrontation by decentralizing TUC’ s operations. With the overthrow of the Busiahadministration, attempts by the Second Military government of 1972-78 to coopt the unionsfailed. Between 1985 and 1992, the PNDC military Junta used coercive measures to cope withlabor agitation and to allow government to implement wage, employment, and pricing policiesprescribed by the SAP. Labor-government relations in the Fourth Republic have been erodedfurther due to declining real wages, increasing unemployment, and the general sense of insecurityamong workers.
The Trade Union Congress of Ghana is a federation of 8 national unions. These are the GeneralAgricultural Workers Union (GAWU), the Industrial & Commercial Workers Union (ICU), theLocal Government Workers Union (LOWU), the Maritime & Dock-Workers' Union (MDU), theNational Union of Seamen (NSU), the Public Utility Workers Union (PUWU), the RailwayWorkers Union (RWU), and the Teachers & Education Workers Union (TEWU). In 1988, thetotal membership of all unions combined was 371,339, with the Industrial & Commercial WorkersUnion and the General Agricultural Workers Union alone representing about 40% of the totalunionized sector. However, by 1991, membership in unions had dwindled to 297,332, recording adecline of 20% since 1988. In absolute terms, the major decline came from the Industrial &Commercial Workers Union, the Local Government Workers Union, and the Teachers &Educational Workers Union, which combined lost over 50,000 members.
Although private sector employers traditionally have not been major actors in the industrialrelations system in Ghana, less restrictive labor regulations under the Economic RecoveryProgram (ERP) have strengthened the bargaining power of employers and have allowed them toshed excess labor. This action on the part of employers, coupled with the retrenchment in thepublic sector, contributed to the shrinkage in the size of union membership in the country.
12
The Context
The actors in an industrial relations system operate within a context of technical, market andpower relations within the larger community. These contexts, which are external to the industrialrelations system, are decisive in shaping the rules established by the actors. In Ghana, the technicaland market constraints facing actors in the system in the last decade or so have largely beendefined by the Economic Recovery Program (ERP) or the Structural Adjustment Program (SAP).The three most important aspects of the ERP/SAP, as they affect the industrial relations system inGhana, have been the liberalization of trade, divestiture, and the retrenchment in the public sector.These three aspects of the recovery and adjustment programs have influenced labor regulations inthe country. To carry through the liberalization, divestiture, and retrenchment policies, thegovernment had to move away from its traditional alliance with labor, which was prevalent in the1960s, to a position of non-cooperation. The government did this in two ways. First, its supportfor a centralized collective bargaining system was withdrawn, leaving national and local unions tobargain individually. Second, the government abandoned the national incomes policy. Laborreacted to these changes through frequent disputes and strike actions. These actions have soaredsince 1989. In 1990 and 1991, 24 strike activities were recorded each year, in comparison withan average of 18 strikes in the previous three years.
The Outcome
Historically, the outcome of the interaction among the actors within the context of the technical,market, and political environment in Ghana has been characterized by a system of centralizedcollective bargaining, under which wage levels and structures, as well as working conditions, wereestablished at the national level. Individual local unions then negotiated with their employerswithin the framework of the national agreement. This system was, however, abolished with theintroduction of the ERP and SAP in 1983-84. The abandonment of centralized bargaining pavedthe way for the massive retrenchment exercise embarked upon by the government in the publicsector. Workers were then left to negotiate with their employers at the local level. The result hasbeen a "chaotic situation whereby wages and wage structures ...are being settled through strikeactions and other ad hoc procedures rather than through bargaining and negotiation" (ISSER,1995, p.159).
Labor Supply and Demand
The population of Ghana was estimated at 12.8 million in 1985 and 19.0 million in 1995 (ISSER,1995). With a total fertility rate of 5.5, a crude birth rate of 38/1000, and a relatively low deathrate of 13/1000, the natural rate of population growth over the period is estimated at 3.0%(Ghana Statistical Services, 1994). If these trends continue, it is projected that the population ofGhana will reach 24 million by the year 2000. With the current rate of increase in population, thelabor force is expected to increase from 4.9 million in 1985 to 7.7 million by 2000, representingan average annual growth rate of over 3% (ISSER, 1995 p. 136). The labor supply curve in a
13
developing nation like Ghana is very elastic. A rapid increase in labor force will shift the laborsupply curve2 so that a significant shift in labor demand will be necessary to simply increaseemployment at constant real wage with constant rate of unemployment (The World Bank, 1984).However, the current trend in employment demand has not been able to keep pace with thegrowth in the labor force.
The relatively low level of labor absorption in the country as the population grows at such arelatively high rate would throw more and more people into unemployment and/or intounderemployment in the low-wage informal sector. As a result, an increasingly large proportionof the people would be pushed below the poverty level. This dynamic will trigger the need forstate intervention through welfare programs that will put pressure on government spending, whichwill in turn undermine the stabilization process. In the absence of such poverty alleviationmeasures, a high level of unemployment and underemployment could lead to social discontent thatmight endanger the sustainability of current and future growth-related policies.
2 For a complete assessment of the labor supply in Ghana see P. Beaudry and N. K. Sowah in “Labor Markets in an Eraof Adjustment”, Vol. 2, EDI Development Studies, 1994
Labor Productivity
The rapidly increasing labor force in Ghana will require the marginal labor productivity to increasejust high enough to provide employment at a constant real wage (The World Bank, 1984).Additional increase in the real wage, which would improve the purchasing power of the people,will require a further increase in the marginal productivity of labor. Estimates of the productivityof labor in Ghana are generally hard to come by. However, recent measures of labor productivityin selected manufacturing industries in three African countries, including Ghana, indicate thatmost African firms, particularly those in Ghana, are generally poor performers as compared to themost efficient firms within these countries (Biggs, Shah & Srivastava, 1996).
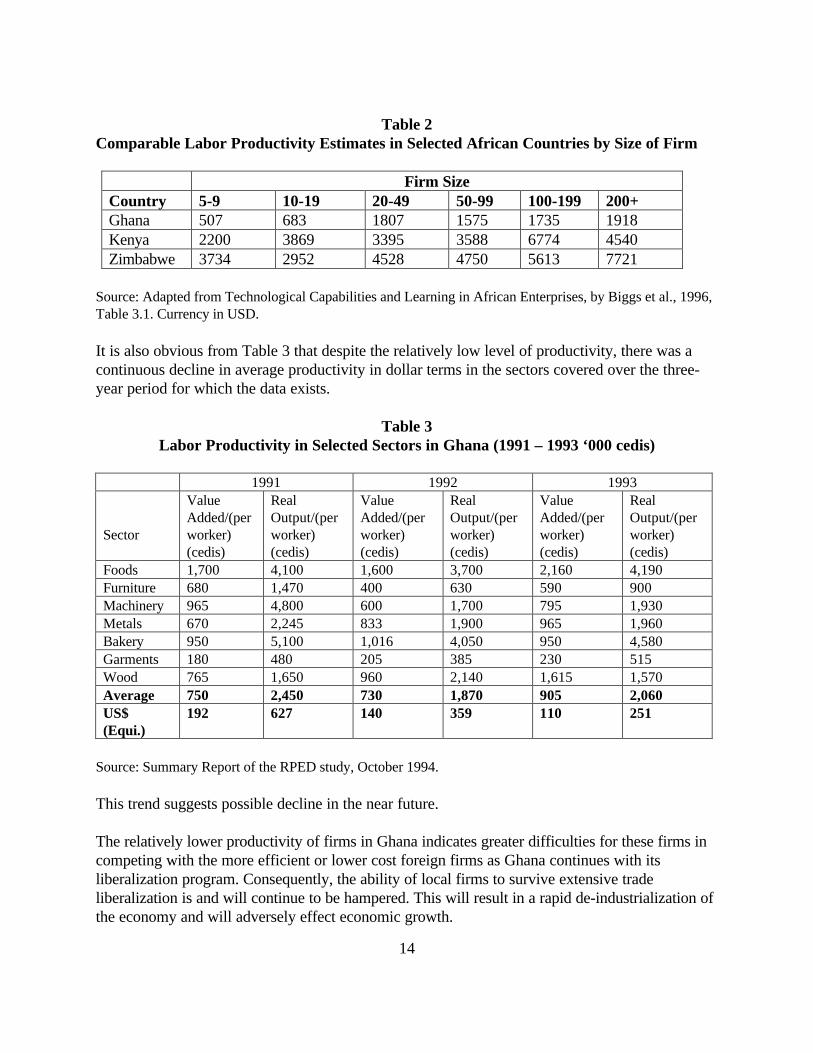
It is clear from Table 2 that estimates of labor productivity in the manufacturing sectors surveyedin Ghana are by far lower than estimates from similar sectors in other African countries.
14
Table 2Comparable Labor Productivity Estimates in Selected African Countries by Size of Firm
Firm SizeCountry 5-9 10-19 20-49 50-99 100-199 200+Ghana 507 683 1807 1575 1735 1918Kenya 2200 3869 3395 3588 6774 4540Zimbabwe 3734 2952 4528 4750 5613 7721
Source: Adapted from Technological Capabilities and Learning in African Enterprises, by Biggs et al., 1996,Table 3.1. Currency in USD.
It is also obvious from Table 3 that despite the relatively low level of productivity, there was acontinuous decline in average productivity in dollar terms in the sectors covered over the three-year period for which the data exists.
Table 3Labor Productivity in Selected Sectors in Ghana (1991 – 1993 ‘000 cedis)
1991 1992 1993
Sector
ValueAdded/(perworker)(cedis)
RealOutput/(perworker)(cedis)
ValueAdded/(perworker)(cedis)
RealOutput/(perworker)(cedis)
ValueAdded/(perworker)(cedis)
RealOutput/(perworker)(cedis)
Foods 1,700 4,100 1,600 3,700 2,160 4,190Furniture 680 1,470 400 630 590 900Machinery 965 4,800 600 1,700 795 1,930Metals 670 2,245 833 1,900 965 1,960Bakery 950 5,100 1,016 4,050 950 4,580Garments 180 480 205 385 230 515Wood 765 1,650 960 2,140 1,615 1,570Average 750 2,450 730 1,870 905 2,060US$(Equi.)
192 627 140 359 110 251
Source: Summary Report of the RPED study, October 1994.
This trend suggests possible decline in the near future.
The relatively lower productivity of firms in Ghana indicates greater difficulties for these firms incompeting with the more efficient or lower cost foreign firms as Ghana continues with itsliberalization program. Consequently, the ability of local firms to survive extensive tradeliberalization is and will continue to be hampered. This will result in a rapid de-industrialization ofthe economy and will adversely effect economic growth.
15
The Theoretical and Analytical Framework
Employers’ demand for labor depends on several factors. Standard economic theory suggests thatlabor demand is a function of the characteristics of demand for the products that labor services areused to produce. Thus labor demand will be high if the demand for the products that the laborresources are used to produce is high. Next, labor demand is also a function of the characteristicsof the production process used. The ease with which labor can be substituted with other factors,such as capital, influences the amount of labor that will be demanded. If it is easier to use laborinputs instead of machinery and equipment when producing a given set of goods or services,employers will have an incentive to employ more labor when there is an increase in the relativeprice of capital. Finally, and most importantly, the demand for labor is a function of the wage paidto workers and the prices of other factors of production.
The Effects of the Wage Rate and other Factor Prices on Labor Demand
In a competitive market, a profit-maximizing firm will employ labor up to the point where themarginal revenue (MR) or the additional revenue derived from hiring the last worker equals themoney wage rate. The schedule of points combining the nominal wage paid by employers and thenumber of workers hired traces the labor demand curve. Because the labor demand curve isnegatively sloping, an increase in nominal wage leads to a decline in the number of workersemployed, and vice-versa. Thus, for a given production process and all other things being equal, achange in wages will result in a change in demand for the labor used in production. The extent ofthe change, however, depends on the slopes of the demand curve. The slope indicates thepercentage change in employment that can be induced by a percentage change in the wage rate.This is called the wage elasticity of demand for the type of labor in question. Therefore, whetherthe responsiveness of demand to changes in the wage rate will be high or low depends on thewage elasticity of demand for the particular labor. Any factor that can influence the elasticity ofdemand to make it more responsive to changes in nominal wages can, in principle, change thedemand for labor when wages change either through minimum wage legislation or through marketforces.
The product market condition that can affect the elasticity of demand can be inferred from Hicks-Marshall’s First Law of Derived Demand. According to Hicks-Marshall, the own-elasticity ofdemand for a category of labor is high when the quantity demanded for the product beingproduced is very sensitive to price change. If a slight decline in the price of the product beingproduced will lead to a high increase in quantity demanded, then a slight decrease in the wage ofthe labor used to produce it will lead to a high increase in the demand for the labor. This will beso because the decline in wages will be translated into a decline in product price. This decline inproduct price will lead to an increase in the quantity of products demanded, which will lead to anincrease in the factors such as labor used to produce the additional products. So when demand inthe product market is very elastic with respect to price, then demand for labor in the labor marketwill also be very responsive with respect to the wage rate.
16
The Ease of Use in the Production Process
The three remaining Hicks-Marshall laws of derived demand focus on the production process.They are concerned with how the ease of use of labor resources in the production process,combined with the prices of other factors of production, affect the elasticity of demand for laborresources. First, these laws suggest that the elasticity of demand for labor will be high if otherfactors of production can be easily substituted for a given category of labor. If machines can easilysubstitute for a category of labor, then a small increase in wage rate will lead to a large shifttoward the use of the machines and to a massive decline in the category of labor employed.Alternatively, if the category of labor can easily substitute for the use of machines, then a slightincrease in the price of the machines will lead to a large increase in labor demand. The extent towhich a category of labor can be easily substituted by other factors of production depends on theproduction function or the technologies used. In some technologies, labor can easily substitute forcapital, whereas substitution possibilities do not exist easily in other technologies. Thus, thepossibility of substitutability factors and their impact on the wage elasticity of demand depends onthe state of technological development and employers’ choice of particular technologies. If thosechoices can be influenced by policy, it will provide policy makers an opportunity to influence theelasticity of demand for labor. Limitations or ease of substitution possibilities need not be solelytechnical ones. For instance, government can legislate limitations by specifying minimumemployment levels for safety reasons, such as requiring every airplane to have a copilot. Somelimitations can also be bargained for by unions, such as a contract’s (mandatory) inclusion of aminimum crew size regulation for railroad locomotives.
The elasticity of labor demand will also be high when the prices of other factors of production donot increase substantially with use. If additional use of machines will not lead to an increase intheir price, then a slight increase in wages will result in a large use of the machines and a largedecline in the employment of labor. Finally, the elasticity of labor demand will be high when thecost of employing labor is a large portion of the cost of production. Thus if the wage rateincreases, the total cost of production increases astronomically. Firms will therefore reduce theuse of labor resources in order to minimize total cost. Consequently, the elasticity of demand forlabor depends on the production process, the technical and non-technical substitutability of laborfor other factors of production, the supply condition of other factors, and the share of labor intotal cost of production.
The Effects of Labor Market Policies on Labor Demand
Various government policies may have direct or indirect impact on labor demand. These policiescan be grouped into two major categories: those that immediately affect factor prices, especiallywages, and those that affect labor demand indirectly through the policy’s effects on quantity oflabor supplied. The first group consists of policies such as payroll taxes and subsidies, andminimum wage laws and requirements for hiring, firing and severance pay. The second groupconsists of policies including those that help increase the number of workers available through

17
subsidized higher education and training; programs for developing skills through on-the-jobtraining in the private sector; and programs that increase the stock of trained workers. Thesepolicies may be reclassified further into those that affect all categories of labor and those thataffect specific categories of labor. All of these policies however affect labor demand through theeffects of changes in factor-price elasticities or cross-factor-demand elasticities.
Productivity and the Production Process
Productivity change has been conceptualized in the literature as a shift in the production functionover time, as opposed to a mere movement along the production function (Solow, 1957). Definedthis way productivity change is synonymous with technical change. This definition makesestimating productivity interesting by linking productivity with an underlying productivity theory.However, operating on a production possibility frontier assumes the prevalence of technicalefficiency. This assumption has its empirical problems. First, merely being on the productionpossibility frontier or having the new technology does not ensure an increase in productivity. Forinstance, factors of production could be employed wastefully due to inefficiency or boundedrationality. Changes in the degree of inefficiencies will affect productivity but will not necessarilyaffect technical change. Thus, productivity can be linked with output increases resulting fromincreases in the quality of labor and other inputs. Since these input-output relationships areengineering concepts that apply to the production process of individual plants, the measure ofproductivity is most easily understood at the micro level.
Determinants of Productivity
There are several factors that cause change in labor productivity. A major factor is investment inphysical capital. Capital investment is the means by which human energy is replaced by mechanicalpower, which raises labor productivity. Capital investment is also the vehicle through which newmethods of production are absorbed into the capital stock, creating efficiencies of both capital andlabor. Another determinant of labor productivity is the change in the quality of labor. Thissuggests that as the labor force becomes more educated or more experienced, its output is morelikely to increase. The third factor influencing productivity is improvement in technologies, whichI define here as new ways of combining the labor and capital that are frequently embodied in newtechnological innovations. When these new technologies are applied to production, they lead toincreases in the efficiency of both labor and capital. While, for instance, increases in both capitaland labor can lead to proportionate increases in value-added to output, new technologies withembodied productivity enhancement attributes can increase value-added over and above whatmere input increases will provide. In this study we assess the effects of physical capital, humancapital, and technical progress on productivity in Ghana. We determine the relative effects ofthese factors on value-added per worker, which is the measure of labor productivity used. Wethen discuss the implications of the findings, and provide some suggestions regarding the policiesthat can enhance productivity in the economy.

18
The Labor Demand and Labor Productivity Models Specification
The study uses two main models to estimate the demand parameters for the manufacturingindustry data. Data from the survey will be interpreted using various types of analytical tools. Forthe manufacturing industry data we use the production function approach. We first estimate theelasticity of substitution between labor and capital and then derive the labor demand elasticitiesfrom firm-level data using the constant elasticity of substitution (CES) technology productionfunction. Then we use a more general approach where labor demand is modeled as a function ofseveral firm-level factors. We include factors that may affect firms’ employment decisions but arenot traditionally included in production functions. We estimate three equations using totalproduction workers, skilled labor, and unskilled labor sub-aggregates as dependent variables. Weuse real value-added per worker as the measure of productivity. We use this measure becausegross output in this data set overestimates the productivity measure due to a very high ratio ofimported intermediate input. This use of value-added per worker as a measure of productivity,however, risks the implicit assumption of an additive and separable production function (Y=VA +M where Y is gross output, VA is value-added and M is the intermediate input). Details of themodel specification are in Appendix B.
The Data Used
The data used for the study was from two main sources: manufacturing industry data and datafrom a 1995 survey of selected firms across all sectors of the economy. The manufacturingindustry data consists of information from annual returns of manufacturing firms from five 2-digitISIC industries. These include the food, tobacco and beverages industries (ISIC 31), the garmentindustry (ISIC 32), the paper and printing industry (ISIC 34), the non-metallic minerals productsindustry (ISIC 36), and the metals and metal fabrication industry (ISIC 38). The data covers aperiod of 11 years in some industries (1972-1983). The annual returns data was collected from allmanufacturing firms under section 2 of the Manufacturing Industries Regulations of 1972. Thisact was later repealed and there has not been any other law in place requiring firms to submit suchreturns to the Ministry of Trade and Industries. Therefore, no such comprehensive data existsafter 1984. The returns contain information about ownership, fixed assets in land, buildings andmachinery, types of machinery used, maximum or installed output capacity, and actual annualoutput. It also contains quantity and value of raw materials used, stock of finished products at thebeginning of the year, the quantity and value of raw materials imported and actually consumed,local raw materials used, utilities consumed, and employment and earnings by skill category.
This data set covers the 1970s and the early 1980s. The extended period of coverage permits abetter understanding of the underlying technical and structural factors influencing labor demandand productivity. Furthermore, while using more recent data from the 1990s tells us more aboutthe current state of labor demand and labor productivity in Ghana, their comparative utility islimited. The current study provides a benchmark for comparing current labor demand andproductivity conditions with pre-SAP situations. Such a comparison will throw more light on theso-called “slackened response from the structural adjustment.”
19
The survey data used was collected in 1995 from firms across all sectors of the economy. Whilethe data collected was more perceptual, it supplemented the industrial sector data and alsopermitted investigation of the effect of some non-firm-level factors such as hiring and firing lawson labor demand.
Results
In the following section we present the results from the manufacturing industry returns and thesurvey data. Because we assumed a CES production function, we estimated separate labordemand equations for each of the five industries studied. Due to spatial constraint -- but withoutloss of generality -- we only present and discuss fully the equations for the food, tobacco, andbeverages industry.3 We do, however, provide four additional tables with estimates that permit acomparative analysis of all five industries studied. The survey results are reported entirely. Alltables are in Appendix A.
Food, Tobacco, and Beverages Industry (ISIC 31)
The means and standard deviation for average production employment and real value-added perproduction worker in the food, tobacco, and beverage industry are presented in Table M.1. Thetable suggests some similarity in the pattern of employment changes and the changes in value-added per employee. On the average, 212 production workers were employed in a typical foodand beverages firm over the period. While there was a continuous decline in employment from the1973 peak of 226 production employees through 1978, employment levels shot up in 1979 andagain in 1981. Meanwhile, value-added per employee also declined continuously over the periodreaching its lowest level in 1978, and then began rising in 1979. Even though value-added peremployee began to rise in 1979, the upward climb was much slower in comparison to the rise inemployment level.
Table M.2 presents the factors relevant for explaining the employment pattern found in the data;the explanation for the value-added changes will be explained in subsequent discussions. The tableshows that larger firms with higher employment levels tend to have relatively higher levels ofcapital-labor ratio, produce more, pay their workers higher wages, and have higher shares offoreign ownership than smaller firms. This suggests that in the food, beverages, and tobaccoindustry, larger firms or firms that employ more workers were relatively more capital-intensive,that they paid premium wages, and were more multinational in ownership than smaller firms.
These findings are not surprising, since the larger firms in this sector included the more efficientmultinational companies with more capital-intensive technologies than the small indigenousdistilleries and bakeries, such as the breweries, the large tobacco companies, the milk and flourcompanies, and cocoa product companies. Interestingly, the larger firms tended to have much
3 Detailed estimates of the equations for the remaining four industries can be obtained from the author.

20
older machinery and equipment, and they also produced at lower capacity levels. The oldermachinery probably reflects the fact that the larger firms are the more entrenched firms in theindustry and that the smaller ones were more recently established with newer machinery. Thecapacity utilization levels of the larger firms were lower than the levels for the smaller firms. Thissuggests the flexibility associated with smaller firms. Frequent breakdowns of older machines forlarger firms could also be one major cause.
While most of the labor demand determinants were positively related to employment size, thedescriptive statistics do not allow for the isolation of the partial effects of each variable. Wetherefore sought explanation for the labor demand pattern through estimates of elasticities andother regression coefficients. The labor demand elasticities for the food and beverages industryare presented in Table M.3. The elasticity of substitution between labor and capital (σLK) wasestimated at 0.439. This suggests that as the relative price of labor to capital decreases by 10%,the relative use of labor to capital increases by 4%. As shown in the table, the own-wageelasticity of demand for homogenous labor is 0.287, suggesting that for every 10% decrease in thewage rate, the number of production workers employed increased by 2.8 %. These findingssuggest that policies that reduce (increase) the wage rate would likely increase (reduce) thenumber of workers employed in the food and beverages industry.
The partial elasticity of demand for skilled labor is 0.623, while the partial elasticity of demand forunskilled labor is 0.459. These also suggest that the own-wage elasticity of demand for labor ishigher when one considers skilled and unskilled labor individually, as opposed to homogenouslabor. The table shows that an increase in the wage of skilled labor by 10% will lead to a declinein the demand for skilled labor by 6%. Similarly, an increase in the wage of unskilled labor by10% will lead to a decline in unskilled employment by over 4%. However, a similar, across-the-board increase for all production workers will reduce employment by 2.8%, or less than 3%. Thissuggests that in the food, tobacco, and beverages industry, employment changes tend to be moreresponsive to selective wage changes than to across-the-board wage changes. The estimates forthe cross-elasticities also suggest a strong substitutability in production between skilled workersand unskilled workers in the food, tobacco and beverages industry.
The effects of other factors not traditionally included in the production function equations but thatnonetheless affect the demand for labor are considered in the following regression equations.Table M.4 reports the estimates of the hierarchical regression of labor demand for allproductionworkers4 on log of wage rate, log of real output, log of capital-labor ratio, log ofcapacity utilization, log of age of machinery, percentage of foreign ownership, location, and yeardummies. Model 1 includes the log of wage rate and real output as the determinants of labordemand. Included variables are foreign ownership, location of plant, and year dummies. Themodel suggests that the effect of the log of real output on demand for labor was positive andstatistically significant. Similarly, the effect of foreign ownership was positive and significant. Themodel also shows that the year dummies for 4 out of the 10 years, beginning from 1973 through1976, were negative and significant. These suggest that the level of employment fell in each ofthese years. This suggests an underlying structural problem in the firms studied which encouraged
21
job losses instead of job creation. Model 2 includes log of capital-labor ratio, log of capacityutilization and age as additional predictors of labor demand. The R2 for the model increasedsubstantially, suggesting that the additional variables do explain some of the variations in theemployment level. The model shows that in addition to real output and foreign ownership, thecapital-labor ratio and capacity utilization had positive and significant effects on employmentlevels in the food, tobacco, and beverages industry. These findings suggest that the major factorsaffecting the level of employment in the food, tobacco, and beverages industries are the level ofoutput and whether or not a higher percentage of the company is foreign-owned. The implicationof the positive effect of real output on employment is that if firms are able to produce more, theyare likely to hire more workers. The effect of foreign ownership probably suggests that foreign-owned firms were able to keep their companies operating and hiring more workers continuously,even through hard times. This seems to support the positive effect of capacity utilization onemployment level shown in the full model. In this industry, the data also indicates that the morecapital-intensive the firm, the more workers they employed. This suggests that in the food,tobacco, and beverages industry, capital-intensive firms tend to hire more workers than do thosewith lower capital intensity. The coefficients of all the year dummies were negative. Thesignificant ones were reported, and they suggest an underlying negative trend in employmentbecause of government policies and inherent industry structure.
Table M.5 reports the coefficients for the demand for skilled labor and unskilled labor equations.The table shows that for skilled labor, real output level is the major determinant of employment. For unskilled labor, the coefficients for real output, capital-labor ratio, capacity utilization, andforeign ownership were all positive and significant. Additionally, while the dummies were notsignificant in the skilled labor equation, they were significant in the unskilled labor equation for1973 through 1976. This suggests that the decline in the level of employment in the food andbeverages industry was probably limited to unskilled employment. The signs for the coefficientsfor wages were in the expected direction but not significant in any of the equations.
Table M.6 reports the means and standard deviations of firms across the four levels of value-added per worker. The table shows that firms in the higher productivity group have higher levelsof capital-labor ratios. This means that firms that have higher levels of value-added per employeetend to be more capital-intensive. The table also shows a positive association between value-added per employee and number of production workers employed. This suggests that firms withhigher value-added per employee are larger ones with high levels of employment. Similarly, firmswith higher levels of value-added per employee have higher levels of real wages, newermachinery, and produce at higher capacity levels.
To explore these relationships further, we present regression results in Table M.7 with value-added per employee as the dependent variable. The equation for all firms shows that the wage ratehad positive and significant effects on value-added per employee in both the reduced and fullmodels. In addition, all the year dummies were negative, and one was statistically significant ineach of the equations.
22
The positive and significant effect of wage rate on value-added per employee suggests that thehigher the wage rate, the higher the value-added per worker. Since firms are likely to pay workerswith better skills higher wages than those with lower skills, this finding is indicative of the positiveeffect of human capital accumulation on firm productivity. The negative effects of all the yeardummies, and its significance in 1977, reflect the underlying technical change on value-added perworker in the food sector. While the negative coefficients cover the entire period, their effect wasonly significant in 1977, suggesting this to be the highest point in technical regression in theindustry over the period under study.
Table M.8 presents two equations. The first equation regresses the percentage difference betweenvalue-added per worker for high productivity firms and the industry average value-added perworker based on the differences between the predictor values for high productivity firms ascompared with the industry’s average values for the predictors. The table shows that the variationin the difference in value-added per worker between firms in the top quartile in terms ofproductivity and the average firm can be explained by the differences in the wage rate paid, thecapacity utilization, and the age of the plant. The regression coefficient of 0.578 in line 2 of theTable shows that for each 10% increment in a high-productivity firm's real wage, the firm's excessof value-added over the average was 5.78% higher. This does not mean that any firm couldachieve 5.78% higher value-added simply by giving its production workers a 10% raise (althoughsome incentive effect from a higher wage cannot be ruled out.) Rather, the higher the real wagepaid by a firm, the more skilled its labor force is likely to be. Therefore, ceteris paribus,abstracting from changes in the other independent variables, raising the skill level of its labor forceenables a firm to increase the margin of its value-added over the average. The finding suggeststhat productivity enhancement requires enhanced human capital investment. The Table furthershows that there is an underlying technological regression throughout the period under study,especially among the low productivity firms and in 1972 and 1974.
The Comparative Analysis Across all Five Industries
In this section we provide a comparative analysis of the study across all five industries studied. Table C.1 compares the means of the relevant variables across the 5 industries. The table showsthat the food, tobacco, and beverages industry (SIC 32) was the major employer of productionworkers. The industry with the least average employment was paper and printing (SIC 34). Thetable also shows that value-added per employee varied across industries with the highest value-added per worker recorded in the food, tobacco, and beverages industry, followed by the paperand printing industry.
The table also shows that real wages for production workers vary across industries, with thehighest wage paid in the food, tobacco, and beverages industry. The data further shows that realoutput is highest in the food, tobacco, and beverages industry, followed by the metal industry.The paper and printing industry is the most capital-intensive industry, followed by the metalindustry. The food, tobacco, and beverages industry is the least capital-intensive. The interestingfinding here is that while the food, tobacco, and beverages industry is the least capital-intensive, it
23
is the one with the highest value-added per worker and with the highest number of employees, aswell as the highest paid employees.
Table C.2 presents the labor demand elasticities. The elasticity of substitution between labor andcapital ranged from 0.226 in the garment industry to 0.572 in the paper and printing industry. Thissuggests that as the relative price of labor to capital increases by 10%, the relative use of capitalto labor increases by between 2.2 % in the garment industry and by about 5.7% in the paper andprinting industry. Thus a policy that increases the price of capital tends to encourage the hiring ofmore labor in all the industries studied, but more so in the paper and printing industry.
The own-wage elasticity of demand for homogenous labor in the sectors studied ranges from0.171 in the non-metallic sector through 0.287 in the food, tobacco, and beverages industry, to ahigh of 0.495 in the paper and printing industry. These estimates fall within the expected range of0.15 and 0.75 (Hammermesh, 1993, p.135).
The table also presents the own-wage demand elasticity for skilled and unskilled labor. Skilledlabor demand is more sensitive to wage change in the garment industry, followed by the food,tobacco, and beverages industry. The industries with the least sensitivity to skilled wage changesare the paper and printing and the non-metallic industries. In general, the own-wage elasticity ofsubstitution for skilled labor is greater than that for unskilled labor in all but the metal industry.This finding contradicts the empirical findings in studies in developed economies, which suggestthat the own-wage elasticity of demand decreases as the skills embodied in a group of workersincrease (Hammermesh, 1993).
The cross-elasticity of demand for skilled and unskilled labor indicates that they are substitutes.When the wage of skilled labor increases, more unskilled labor will be hired to replace the skilledlabor lost because of its wage increase. Similarly, when the wage of unskilled labor increases,more skilled labor will have to be hired to replace the lost unskilled workers. Thus, even thoughan increase in unskilled wages generates the same percentage decline in unskilled employment asthe increase in skilled employment that follows, the high cost of hiring skilled workers can raiseproduction costs drastically. On the other hand, an increase in the wages of skilled workers leadsto replacement of skilled workers by unskilled workers at a lower per unit cost, reducing totalproduction costs. This suggests that increasing the wages of skilled workers instead of unskilledworkers, though a very controversial proposition, will make firms more competitive.
Table C.3 provides an industry summary of the results of the regression equations that relateemployment demand with a set of independent variables. As indicated in the table, we expectedreal output to have a positive influence on level of employment. As evident in the first row, thecoefficients for the regression of real output on employment level were positive, significant androbust across all industries. Also, the results suggest that a firm’s demand for labor is influencedby who operates the firm and how. For example, the effect of capacity utilization on employmentdemand was in the expected direction for all the equations and significant in the food, tobacco,and beverages industry equations. Furthermore, the results show that the effect of foreign
24
ownership on employment levels was positive and significant in 3 of the 5 industries. Thissuggests that multinational corporations tend to employ more workers than do indigenous firms.This is probably due to the better management and efficiency associated with these multinationals.
Table C.4 summarizes the regression of relative productivity difference on relative differences inthe variables between high productivity and average productivity firms. The table confirms thatcapital-labor ratio, production wages, and capacity utilization are the major determinants of value-added per worker in the industries surveyed. Finally, the data indicated that for many of the yearsunder study, the coefficients of the year dummy variables were negative and highly significantacross all sectors. This finding implies that there has been a consistent technological retrogressionin all the manufacturing industries studied throughout the years under investigation.
Results from the survey data are clear. As shown in Table S.1, the overall average employmentlevel in the surveyed firms has declined slightly since 1990. There was a decline of 1.7% in 1990,compared to the 1980’s average and a decline of 9.4% in 1995. However, as shown in the table,there was some slight increase in employment at the managerial level. Furthermore, employmentof technical/production workers actually went up in 1990 before it started to decline thereafter.This is obviously the effect of the well-discussed decline in employment in the manufacturingsector since 1990. While there was a decline in employment of other non-managerial, non-technical/production workers, there has been a strong rally in this employment category since1990.
It is also clear from Table S.2 that the bulk of employment is in the non-tradable sector.Moreover, it is obvious that while employment in the tradable sector has been particularly strong,the increases do not translate to significant head counts due to its low employment base ascompared to the base in the non-tradable sector where, unfortunately, the level has been declining.
With trade liberalization, it is expected that there will be a decline in labor demand in theimportable sector, and we expect an increase in demand in the exportable sector (Edwards andEdwards, 1994). The evidence of an overall increase in labor demand in the tradable sectorsuggests that the increase in labor demand in the exportable sector more than compensates for thedecline in employment in the importable sector. This seems to be a good employment response totrade liberalization. Finally, Table S.3 suggests that capital constraints, concerns about firing laws,and labor cost constraints are major factors that reduce the likelihood that firms will hireadditional workers. Furthermore, while unions may have negative effects on the likelihood offirms’ hiring more workers, the effect is not statistically significant. However, firms that are facingmore industrial actions are likely to hire less.
25
Policy Implications of the Study
In this section we discuss the implications of the study's results and provide some policyrecommendations. Major implications of the study are as follows:
• The food, tobacco, and beverages industry is both the major employer and the mostproductive industry among the industries studied. This industry is more likely to hire moreworkers and also be more competitive with imports than any other industry studied due to itshigh level of productivity. To enhance both labor absorption and labor productivity in themanufacturing sector, investments in the food, tobacco, and beverages industry need to beencouraged.
• Efficient industries such as the food, tobacco, and beverages industry are those that employhighly qualified workers, which suggests that productivity correlates positively with level oftraining, experience, and qualification. Hence, there is the need for increasing both on-the-joband general training that will provide workers with the necessary skills and qualifications tomake the firms competitive.
• Value-added was highest in the food, tobacco, and beverages industry, followed by the paperand printing industry. Food, tobacco, and beverages registered the highest level ofemployment, while paper and printing registered the lowest level of employment. Observingthese findings jointly indicates that there is no a priori relationship between employment leveland productivity. Both high and low employment levels are compatible with high levels ofproductivity.
• The food, tobacco, and beverages industry is the least capital-intensive but it is also the one
with the highest value-added per worker and with the highest paid employees. This suggeststhat wages, when used as a surrogate for human capital, is a better predictor of productivitythan capital intensity. Hence, there is the need for increased technical training.
• The relatively high elasticity of substitution across the five industries provided firms greaterincentive to replace people with machinery. Overvalued currency and policies that reduce therelative price of capital will result in a decline in labor demand. The current liberalization ofthe capital markets and the removal of subsidies on credit as a result of the structuraladjustment program will make capital relatively more expensive than labor and encouragemore employment in the industrial sector. This policy should be pursued vigorously.
• In general, the own-wage elasticity of substitution for skilled labor is greater than that forunskilled labor in most industries studied. This finding suggests that an increase in skilledwage will reduce skilled employment more than a similar proportionate increase in unskilledwage will affect unskilled employment. Consequently, selective increases in wages of skilledworkers require caution lest they reduce overall employment.

26
• Increases in wages of unskilled workers have the tendency through substitution to increaseemployment of the higher paid skilled workers, and cause an associated increase in productioncost. Unless the use of more skilled workers results in higher productivity, the higher cost ofproduction may have to be absorbed by firms or passed on as higher prices to consumers.Either case may make the firms less competitive.
• Firms will be able to employ more workers only if they can be competitive; policies thatincrease competitiveness, such as productivity enhancement, privatization, and openness, willenhance labor absorption.
• Firms that operate at near capacity tend to hire more workers. The ability of firms within agiven industry to operate at levels of capacity higher than competitors depends on theresourcefulness of the firm’s management. Existing and future managers will benefitimmensely from effective management training.
• Multinational corporations tend to employ more workers than do indigenous firms. This isalso probably due to better management and efficiency associated with these multinationals.This indicates a need to vigorously encourage foreign direct investment.
• There is the need to update the technology used by firms to include relatively more capital-intensive technologies.
• Even though capital-intensive technology is needed to increase productivity, investment inhuman capital is also critical for productivity increase. There is the need to encourage bothon-the-job training as well as general skill training through government-industry partnership.
• There has been a consistent technological retrogression in the manufacturing industry duringthe years under investigation. The solution lies in purposeful research and developmentprograms in the industrial sector. This can take the form of a partnership between thecorporate world and the research institutions such as those under the Council for Scientificand Industrial Research of Ghana (CSIR) facilitated by Government.
• The bulk of employment is in the non-tradable sector. While employment in the tradablesector has been particularly strong, the increases do not translate into large head counts due toits low employment base compared with the base in the non-tradable sector, whereunfortunately, the level has been declining.
• The overall increase in labor demand in the tradable sector suggests that the increase in labordemand in the exportable sector more than compensates for the expected decline inemployment in the importable sector. This seems to be a good employment response to tradeliberalization. Further incentives for firms in the exportables sector are necessary; these couldbe financial or non-financial incentives.
27
• Capital constraints, concerns about firing laws, and labor cost constraints are major factorsreducing the likelihood that firms will hire additional workers. There is the need for easingcredit availability to businesses in general. There also has to be some review of the currenthiring and firing laws in order to reduce the cost of hiring workers.
• Firms that are facing more industrial actions are likely to hire less. There is the need to shiftlabor actions from the political arena into the industrial realm as a way of encouraging direct,non-political, and more peaceful employer-employee/union bargaining and negotiationprocesses.
28
References
Beaudry, P. and N.K.Sowa. 1994. “Ghana; Labor Markets in an Era of Adjustment.” Vol. 2,Susan Horton, Ravi Kanbur, and Dipak Mazumdar (ed.). EDI Development Studies. TheWorld Bank, Washington D.C.
Berndt. Ernst, and David Wood, 1979. “Engineering and Econometrics Interpretation of Energy-Capital Complementarity.” American Economic Review 69:342-54.
Biggs, Tyler, Shah, Manju, Srivastava, Pradeep. 1995. Technological Capabilities and LearningEnterprises.” World Bank Technical Paper #288, Africa Technical Department Series.,The World Bank, Washington D.C.
Centre for the Study of African Economies. 1995. "The Ghanaian Manufacturing Sector 1991-1993, Findings of Waves 1 to 3.” A Report of the Regional Program on EnterpriseDevelopment (RPED).
Deutsch, Edwin, and Kurt Rodler. 1990. "Aggregation Problems in a Model of Wage Formationand Employment Demand." In Dis-aggregation in Econometric Modeling. Edited byTerry Barker and Hasham Pesaran, Billings and Sons Ltd. Worcester, U.K.
Drazen, Allan, Daniel Hamermesh, and Norman Obst 1984. "Recent Development inMacro-economic Disequilibrium Theory". Econometrica, 48:283-306.
Edwards, Alejandra Cox and Edwards Sebastian. 1994. “Labor Market Distortions and StructuralAdjustment in Developing Countries.” Labor Markets in an Era of Adjustment.” Vol. 1,Susan Horton, Ravi Kanbur, and Dipak Mazumdar (ed.). EDI Development Studies. TheWorld Bank, Washington D.C.
Ehrenberg, Ronald and Robert Smith. 1985. Modern Labor Economics: Theory and Public Policy,Scott Foresman and Co., Illinois
Ferguson, Charles. 1969. The Neoclassical Theory of Production and Distribution. Cambridge,England: Cambridge University Press.
Fleisher, Belton M,. and Thomas J. Kniesner. 1984. Labor Economics: Theory, Evidence, andPolicy. New Jersey: Prentice Hall.
Freeman, Richard, B. 1972. Labor Economics. New York: Prentice Hall Inc, New York.Ghana Statistical Services. 1997. Quarterly Digest of Statistics. Vol. XV. Safeway Printing Press,
Accra, Ghana.Hammermesh, Daniel, S. 1993. Labor Demand. Princeton University Press, Princeton New
Jersey.Harris, John, and Michael Todaro. 1970. "Migration, Unemployment and Development: A Two
Sector Analysis." American Economic Review, 60: 126-142Klotz, Benjamin, Ray Madoo, and Reed Hansen. 1980." A Study of High and Low Labor
Productivity Establishments in U.S. Manufacturing.” New Development in ProductivityMeasurement and Analysis. W. Kendrick and Beatrice N. Vaccara (eds.). The Universityof Chicago Press, Chicago and London.
Mazumdar, Dipak. 1989. Microeconomic Issues of Labor Markets in Developing Countries,Analysis and Policy Implications. EDI Seminar Paper # 40.The World Bank, WashingtonD.C.
29
Solow, Robert M. 1957. "Technical Change and the Aggregate Production Functions." Reviewof Economics and Statistics. 39:312-20.
Teal Francis. 1995. “Real Wages and the Demand for Labour in Ghana’s Manufacturing Sector”Centre for the Study of African Economies, Institute of Economics and Statistics,Oxford, U.K.
Teal Francis. 1997. “Real Wages and the Demand for Skilled and Unskilled Male Labour inGhana’s Manufacturing Sector:1991-1995.” Centre for the Study of African Economies,Institute of Economics and Statistics, Oxford, U.K.
Teal, Francis. 1998. “The Ghanaian Manufacturing Sector 1991-1995: Firm Growth, Productivityand Convergence.” Centre for the Study of African Economies, Institute of Economicsand Statistics, Oxford, U.K.
The ILO Year Book of Labour Statistics.1996. International Labour Office, Geneva.The World Bank. 1984. A World Bank Country Study: Ghana Policies and Programs for
Adjustment, Washington, D.C. U.S.A.UN Statistical Year Book. 1990/91.
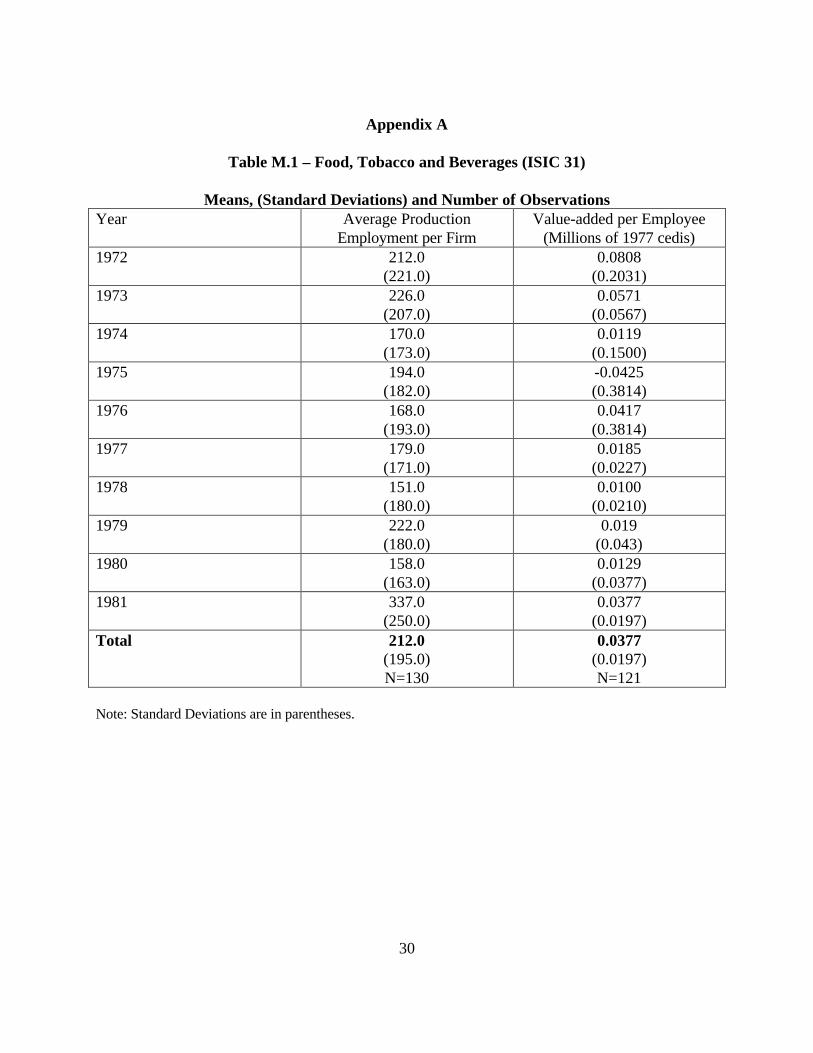
30
Appendix A
Table M.1 – Food, Tobacco and Beverages (ISIC 31)
Means, (Standard Deviations) and Number of ObservationsYear Average Production
Employment per FirmValue-added per Employee
(Millions of 1977 cedis)1972 212.0
(221.0)0.0808
(0.2031)1973 226.0
(207.0)0.0571
(0.0567)1974 170.0
(173.0)0.0119
(0.1500)1975 194.0
(182.0)-0.0425(0.3814)
1976 168.0(193.0)
0.0417(0.3814)
1977 179.0(171.0)
0.0185(0.0227)
1978 151.0(180.0)
0.0100(0.0210)
1979 222.0(180.0)
0.019(0.043)
1980 158.0(163.0)
0.0129(0.0377)
1981 337.0(250.0)
0.0377(0.0197)
Total 212.0(195.0)N=130
0.0377(0.0197)N=121
Note: Standard Deviations are in parentheses.

31
Table M.2 - Food, Tobacco and Beverages (ISIC 31)
Means and Standard Deviation of Selected Variables by Employment LevelEmployment
LevelK/L
RatioReal
OutputRealWage(All)
RealWage
(Skilled)
RealWage
(Unskill)
PlantAge
CapacityUsed
ForeignShare(%)
Micro 0.11
(0.28)
1.043
(0.001)
0.0013
(0.0012)
0.0025
0.0056)
0.0011
(0.008)
6.3
(3.1)
0.73
(1.02)
7.18
(14.36)
Small 0.13
(0.1)
5.934
(12.48)
0.0019
(0.001)
0.0026
(0.002)
0.0015
(0.001)
6.3
(3.7)
0.30
(0.30)
26.81
(36.61)
Medium 0.05
(0.07)
15.526
(20.629)
00024
(0.002)
0.0024
(0.001)
0.0023
(0.004)
8.9
(5.8)
0.59
(0.353)
48.17
(39.05)
Large 0.23
(0.4)
38.47
39.99
0.0024
(0.0019)
0.0027
(0.002)
0.0022
(0.0019)
7.5
(5.2)
0.60
(0.50)
40.37
(32.78)
Total 0.13
(0.27)
N=129
15.06
(26.98)
N=128
0.002
(0.002)
N=130
0.0026
(0.003)
N=130
0.0018
(0.0023)
N=130
7.28
(4.66)
N=125
0.420
(0.501)
N=122
29.79
(35.27)
N=120
Notes: All wage and output values in millions of 1977 cedisStandard deviations (SD) in parentheses
Micro: Firms with employment lower than one SD below the meanSmall: Firms with employment greater than one SD below the mean but less than the meanMedium: Firms with employment greater than the mean but less than one SD above the meanLarge: Firms with average employment greater than one SD above the mean
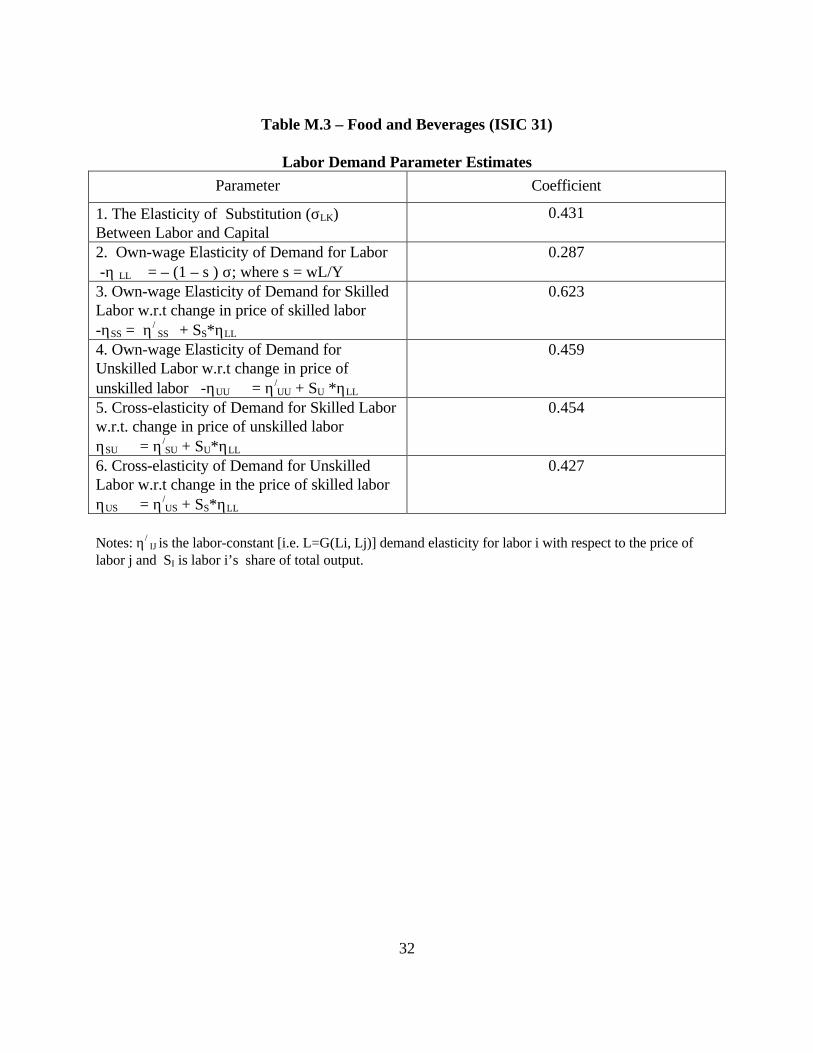
32
Table M.3 – Food and Beverages (ISIC 31)
Labor Demand Parameter Estimates
Parameter Coefficient
1. The Elasticity of Substitution (σLK)Between Labor and Capital
0.431
2. Own-wage Elasticity of Demand for Labor -η LL = – (1 – s ) σ; where s = wL/Y
0.287
3. Own-wage Elasticity of Demand for SkilledLabor w.r.t change in price of skilled labor-ηSS = η/
SS + SS*ηLL
0.623
4. Own-wage Elasticity of Demand forUnskilled Labor w.r.t change in price ofunskilled labor -ηUU = η/
UU + SU *ηLL
0.459
5. Cross-elasticity of Demand for Skilled Laborw.r.t. change in price of unskilled laborηSU = η/
SU + SU*ηLL
0.454
6. Cross-elasticity of Demand for UnskilledLabor w.r.t change in the price of skilled laborηUS = η/
US + SS*ηLL
0.427
Notes: η/ IJ is the labor-constant [i.e. L=G(Li, Lj)] demand elasticity for labor i with respect to the price of
labor j and SI is labor i’s share of total output.

33
Table M.4- Food and Beverages Industry (ISIC 31)
2-Stage Least Squares Estimates with Production Employment Demandas Dependent Variables
Variables Model 1 Model 2
Ln (Wage rate) .220(.267)
.238(.350)
Ln (Real Output) (.507)***(.079)
.515(.104)
Ln (K/L ratio) - .201**(.092)
Ln (Capacity Utilization) - .190*(.109)
Ln (Age of Equipment) - .252(.221)
Foreign Ownership .004**(.002)
.007**(.003)
Location .103(.105)
.065(.087)
Year Dummies2
1973 -1.612***(.610)
-2.537***(.992)
1974 -1.404***(.520)
-2.226***(.958)
1975 -1.765***(.539)
-2.474***(.885)
1976 -1.253**(.541)
-1.963**(.878)
1977 -1500*(.843)
Constant 6.121**(2.158)
8.196(3.175)
Adjusted R2 .723 .785
R2 Change .060*
Notes:1. * = p<.1; ** = p<.05; *** = p<.01.2. Panel data from 1972-1981. Only years with significant coefficients are reported.
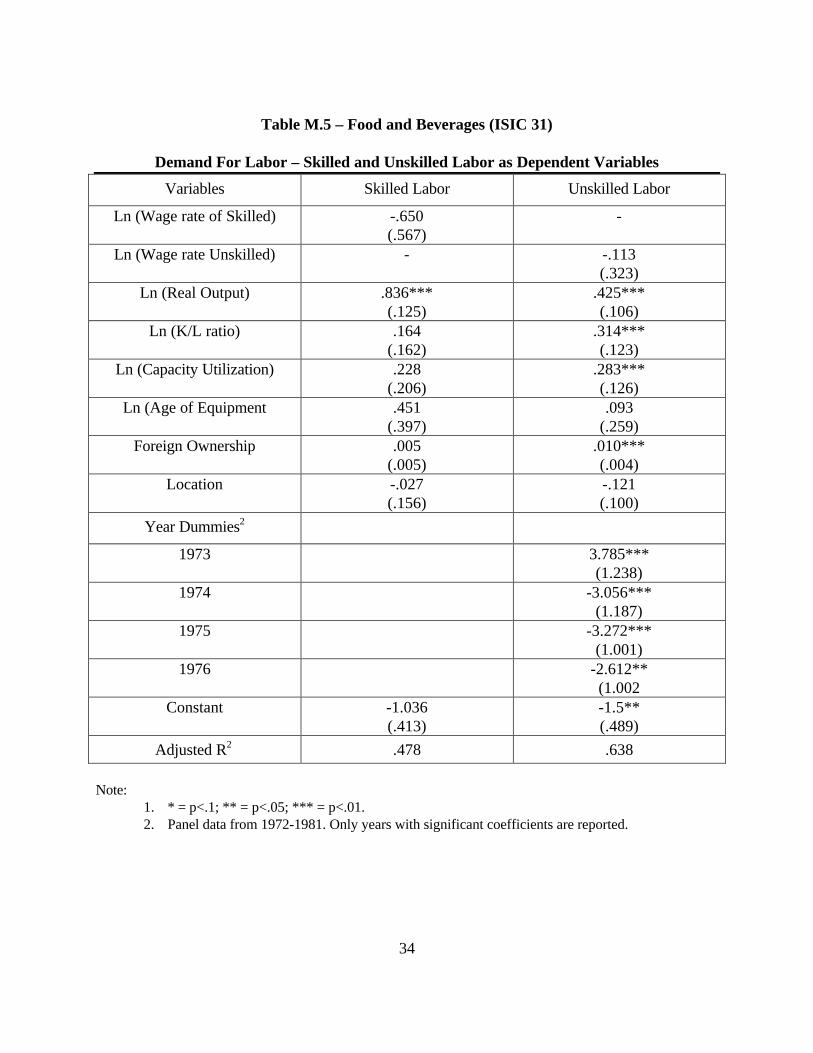
34
Table M.5 – Food and Beverages (ISIC 31)
Demand For Labor – Skilled and Unskilled Labor as Dependent Variables
Variables Skilled Labor Unskilled Labor
Ln (Wage rate of Skilled) -.650(.567)
-
Ln (Wage rate Unskilled) - -.113(.323)
Ln (Real Output) .836***(.125)
.425***(.106)
Ln (K/L ratio) .164(.162)
.314***(.123)
Ln (Capacity Utilization) .228(.206)
.283***(.126)
Ln (Age of Equipment .451(.397)
.093(.259)
Foreign Ownership .005(.005)
.010***(.004)
Location -.027(.156)
-.121(.100)
Year Dummies2
1973 3.785***(1.238)
1974 -3.056***(1.187)
1975 -3.272***(1.001)
1976 -2.612**(1.002
Constant -1.036(.413)
-1.5**(.489)
Adjusted R2 .478 .638
Note:1. * = p<.1; ** = p<.05; *** = p<.01.2. Panel data from 1972-1981. Only years with significant coefficients are reported.
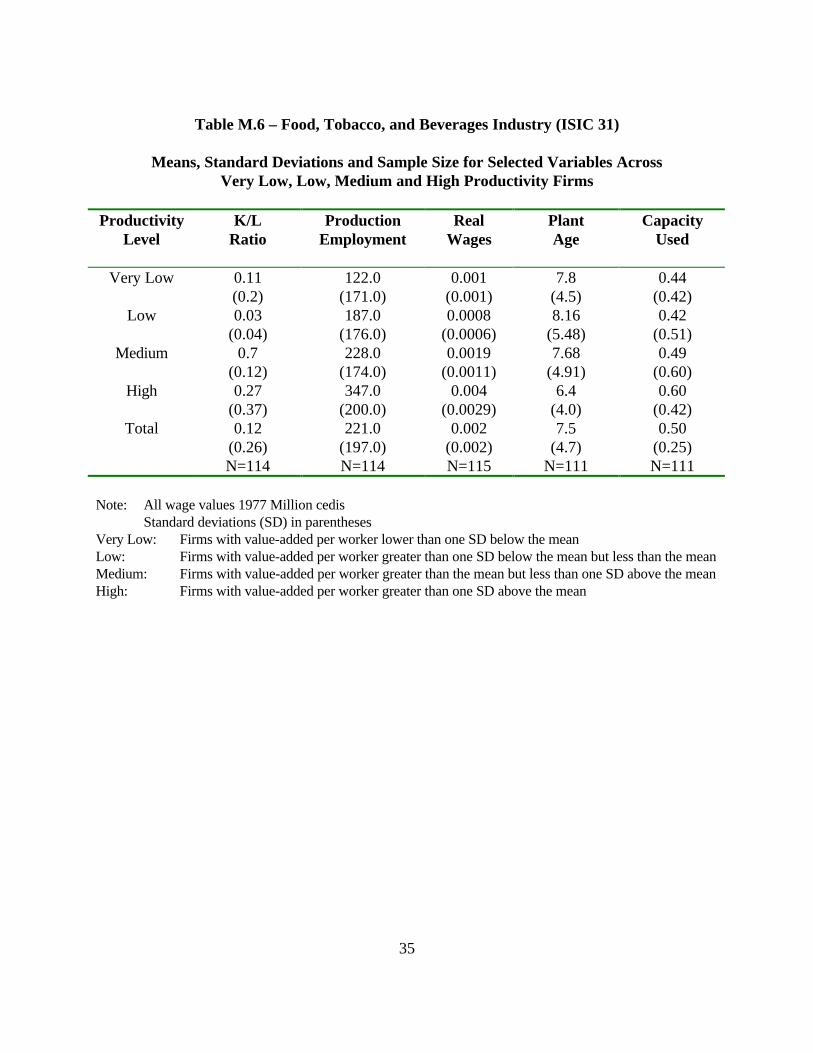
35
Table M.6 – Food, Tobacco, and Beverages Industry (ISIC 31)
Means, Standard Deviations and Sample Size for Selected Variables AcrossVery Low, Low, Medium and High Productivity Firms
ProductivityLevel
K/LRatio
ProductionEmployment
RealWages
PlantAge
CapacityUsed
Very Low 0.11(0.2)
122.0(171.0)
0.001(0.001)
7.8(4.5)
0.44(0.42)
Low 0.03(0.04)
187.0(176.0)
0.0008(0.0006)
8.16(5.48)
0.42(0.51)
Medium 0.7(0.12)
228.0(174.0)
0.0019(0.0011)
7.68(4.91)
0.49(0.60)
High 0.27(0.37)
347.0(200.0)
0.004(0.0029)
6.4(4.0)
0.60(0.42)
Total 0.12(0.26)N=114
221.0(197.0)N=114
0.002(0.002)N=115
7.5(4.7)
N=111
0.50(0.25)N=111
Note: All wage values 1977 Million cedisStandard deviations (SD) in parentheses
Very Low: Firms with value-added per worker lower than one SD below the meanLow: Firms with value-added per worker greater than one SD below the mean but less than the meanMedium: Firms with value-added per worker greater than the mean but less than one SD above the meanHigh: Firms with value-added per worker greater than one SD above the mean
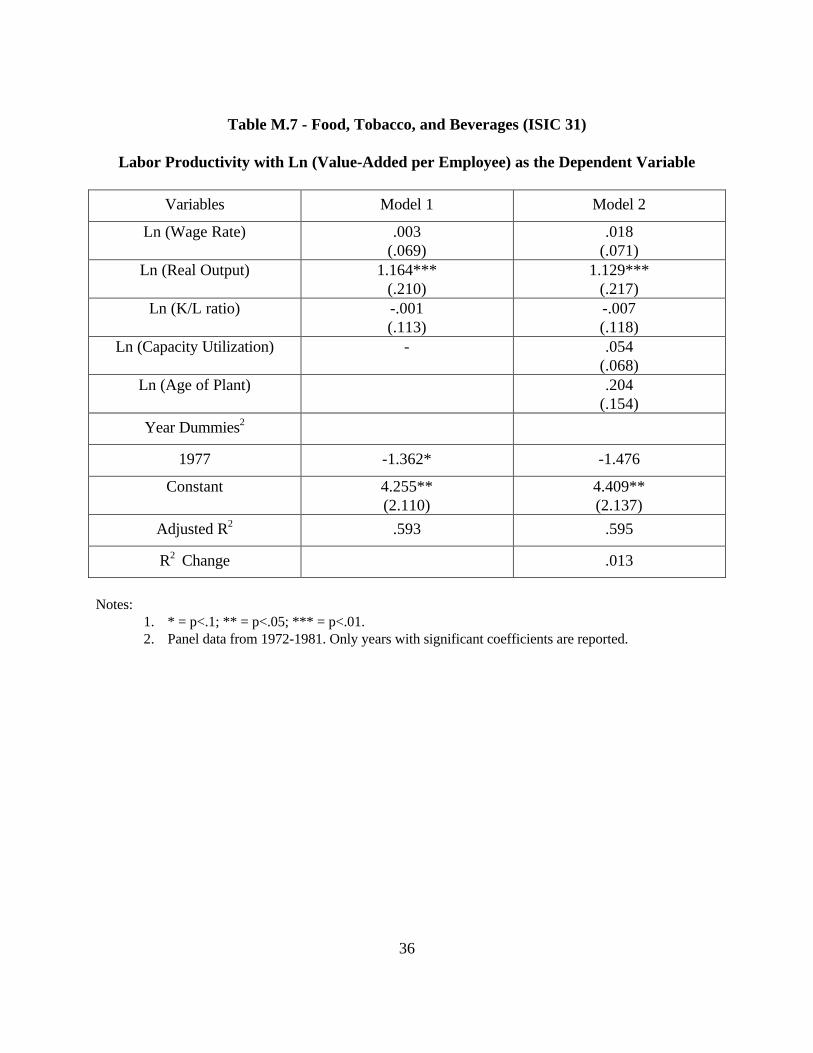
36
Table M.7 - Food, Tobacco, and Beverages (ISIC 31)
Labor Productivity with Ln (Value-Added per Employee) as the Dependent Variable
Variables Model 1 Model 2
Ln (Wage Rate) .003(.069)
.018(.071)
Ln (Real Output) 1.164***(.210)
1.129***(.217)
Ln (K/L ratio) -.001(.113)
-.007(.118)
Ln (Capacity Utilization) - .054(.068)
Ln (Age of Plant) .204(.154)
Year Dummies2
1977 -1.362* -1.476
Constant 4.255**(2.110)
4.409**(2.137)
Adjusted R2 .593 .595
R2 Change .013
Notes:1. * = p<.1; ** = p<.05; *** = p<.01.2. Panel data from 1972-1981. Only years with significant coefficients are reported.
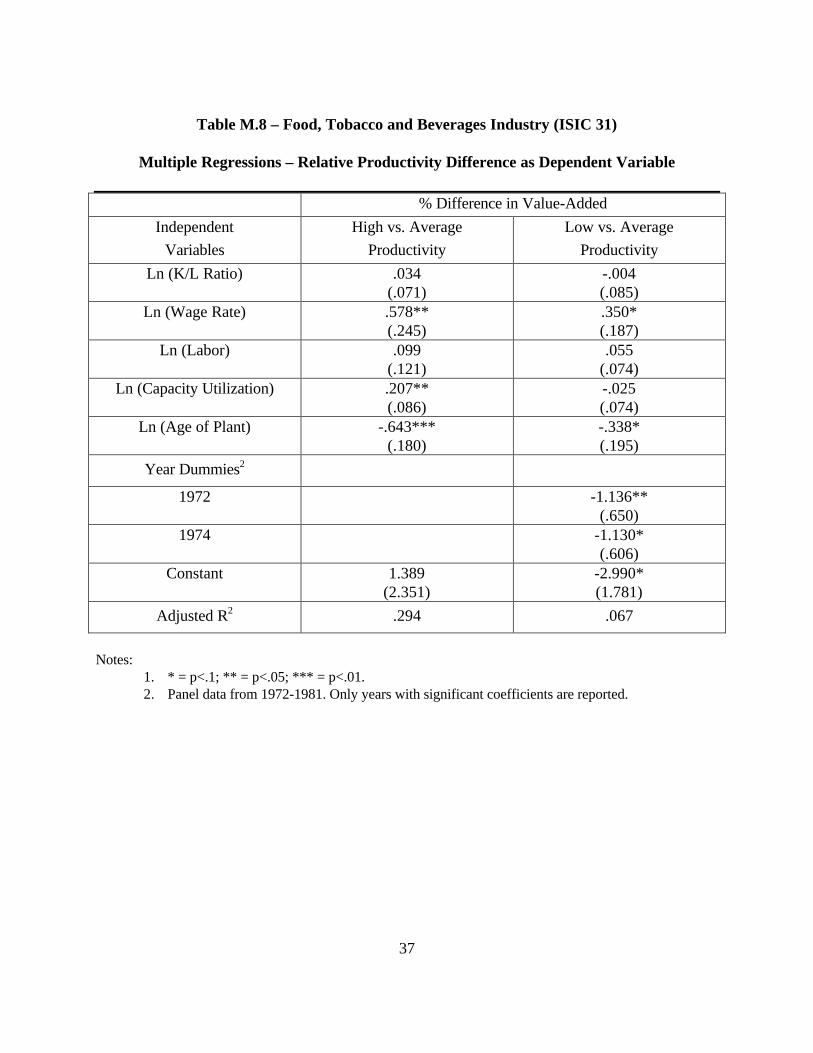
37
Table M.8 – Food, Tobacco and Beverages Industry (ISIC 31)
Multiple Regressions – Relative Productivity Difference as Dependent Variable
% Difference in Value-Added
Independent
Variables
High vs. Average
Productivity
Low vs. Average
Productivity
Ln (K/L Ratio) .034(.071)
-.004(.085)
Ln (Wage Rate) .578**(.245)
.350*(.187)
Ln (Labor) .099(.121)
.055(.074)
Ln (Capacity Utilization) .207**(.086)
-.025(.074)
Ln (Age of Plant) -.643***(.180)
-.338*(.195)
Year Dummies2
1972 -1.136**(.650)
1974 -1.130*(.606)
Constant 1.389(2.351)
-2.990*(1.781)
Adjusted R2 .294 .067
Notes:1. * = p<.1; ** = p<.05; *** = p<.01.2. Panel data from 1972-1981. Only years with significant coefficients are reported.
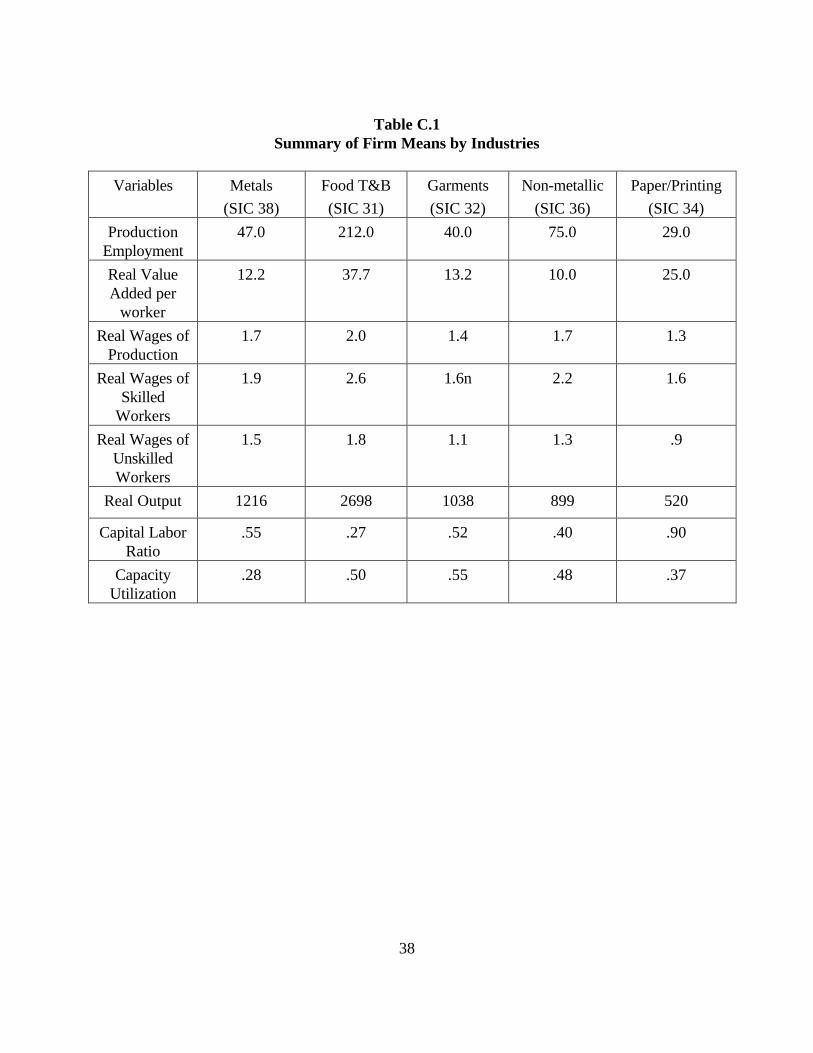
38
Table C.1Summary of Firm Means by Industries
Variables Metals
(SIC 38)
Food T&B
(SIC 31)
Garments
(SIC 32)
Non-metallic
(SIC 36)
Paper/Printing
(SIC 34)
ProductionEmployment
47.0 212.0 40.0 75.0 29.0
Real ValueAdded per
worker
12.2 37.7 13.2 10.0 25.0
Real Wages ofProduction
1.7 2.0 1.4 1.7 1.3
Real Wages ofSkilled
Workers
1.9 2.6 1.6n 2.2 1.6
Real Wages ofUnskilledWorkers
1.5 1.8 1.1 1.3 .9
Real Output 1216 2698 1038 899 520
Capital LaborRatio
.55 .27 .52 .40 .90
CapacityUtilization
.28 .50 .55 .48 .37
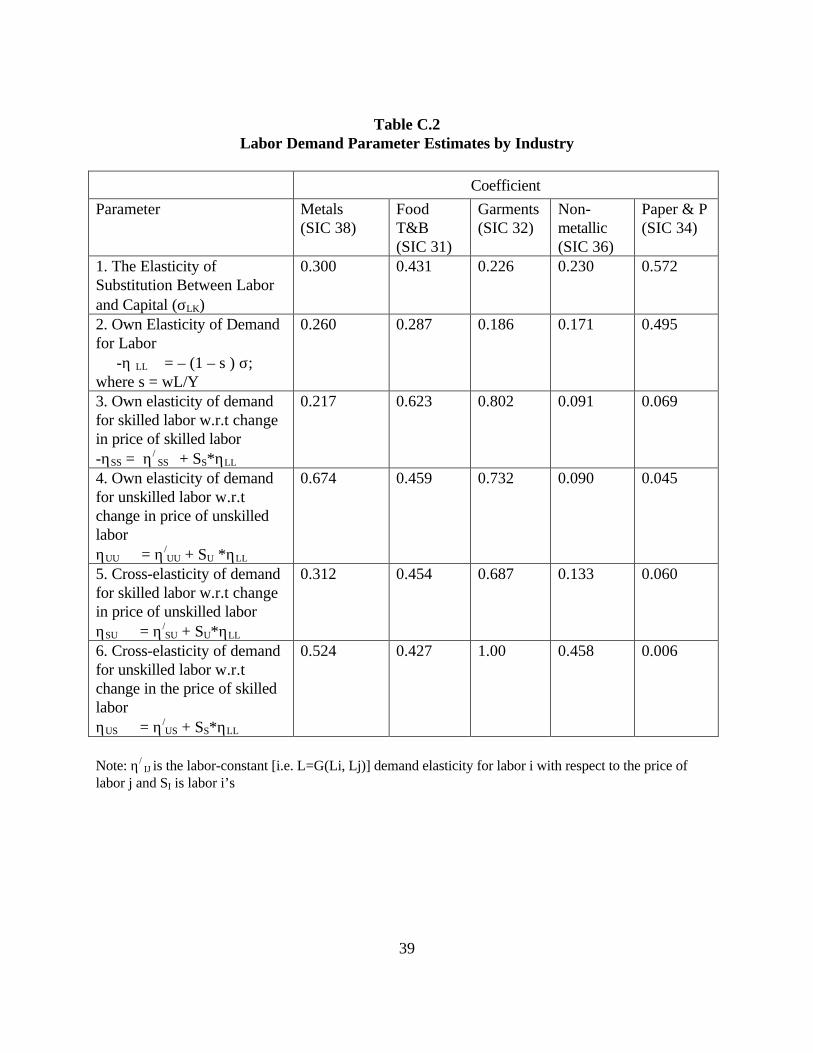
39
Table C.2Labor Demand Parameter Estimates by Industry
Coefficient
Parameter Metals(SIC 38)
FoodT&B(SIC 31)
Garments(SIC 32)
Non-metallic(SIC 36)
Paper & P(SIC 34)
1. The Elasticity ofSubstitution Between Laborand Capital (σLK)
0.300 0.431 0.226 0.230 0.572
2. Own Elasticity of Demandfor Labor -η LL = – (1 – s ) σ;where s = wL/Y
0.260 0.287 0.186 0.171 0.495
3. Own elasticity of demandfor skilled labor w.r.t changein price of skilled labor -ηSS = η/
SS + SS*ηLL
0.217 0.623 0.802 0.091 0.069
4. Own elasticity of demandfor unskilled labor w.r.tchange in price of unskilledlaborηUU = η/
UU + SU *ηLL
0.674 0.459 0.732 0.090 0.045
5. Cross-elasticity of demandfor skilled labor w.r.t changein price of unskilled laborηSU = η/
SU + SU*ηLL
0.312 0.454 0.687 0.133 0.060
6. Cross-elasticity of demandfor unskilled labor w.r.tchange in the price of skilledlaborηUS = η/
US + SS*ηLL
0.524 0.427 1.00 0.458 0.006
Note: η/ IJ is the labor-constant [i.e. L=G(Li, Lj)] demand elasticity for labor i with respect to the price of
labor j and SI is labor i’s
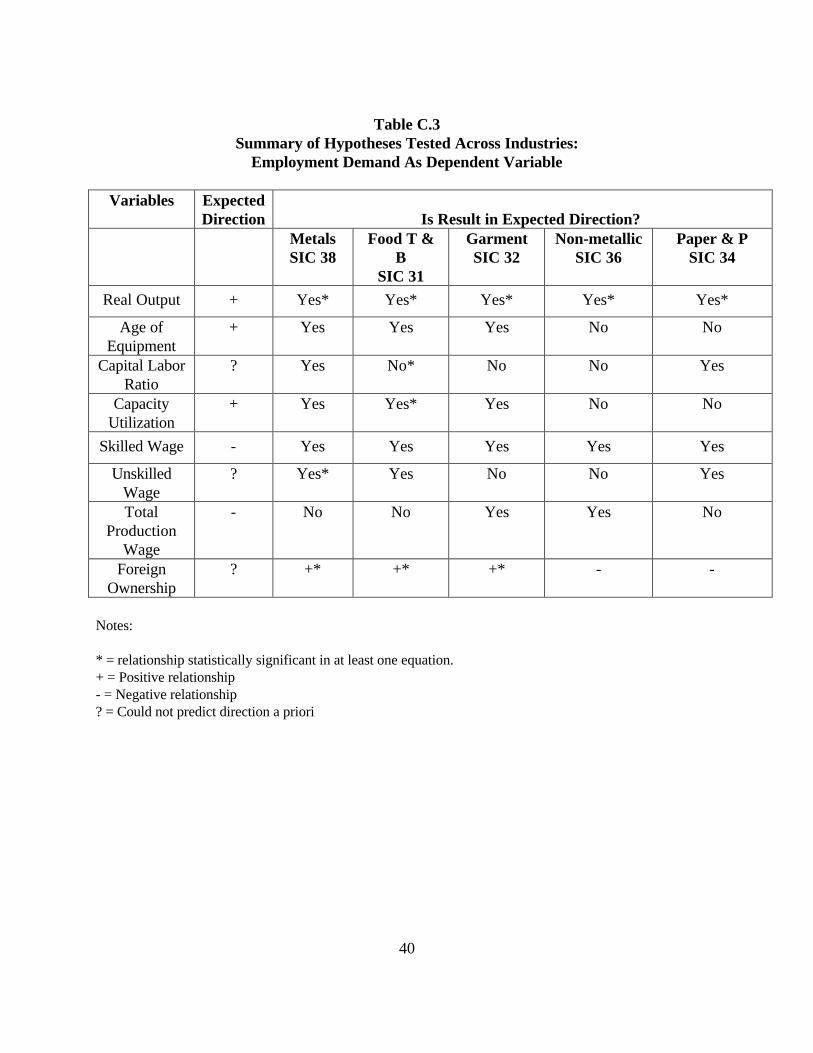
40
Table C.3Summary of Hypotheses Tested Across Industries:
Employment Demand As Dependent Variable
Variables ExpectedDirection Is Result in Expected Direction?
MetalsSIC 38
Food T &B
SIC 31
GarmentSIC 32
Non-metallicSIC 36
Paper & PSIC 34
Real Output + Yes* Yes* Yes* Yes* Yes*
Age ofEquipment
+ Yes Yes Yes No No
Capital LaborRatio
? Yes No* No No Yes
CapacityUtilization
+ Yes Yes* Yes No No
Skilled Wage - Yes Yes Yes Yes Yes
UnskilledWage
? Yes* Yes No No Yes
TotalProduction
Wage
- No No Yes Yes No
ForeignOwnership
? +* +* +* - -
Notes:
* = relationship statistically significant in at least one equation.+ = Positive relationship- = Negative relationship? = Could not predict direction a priori
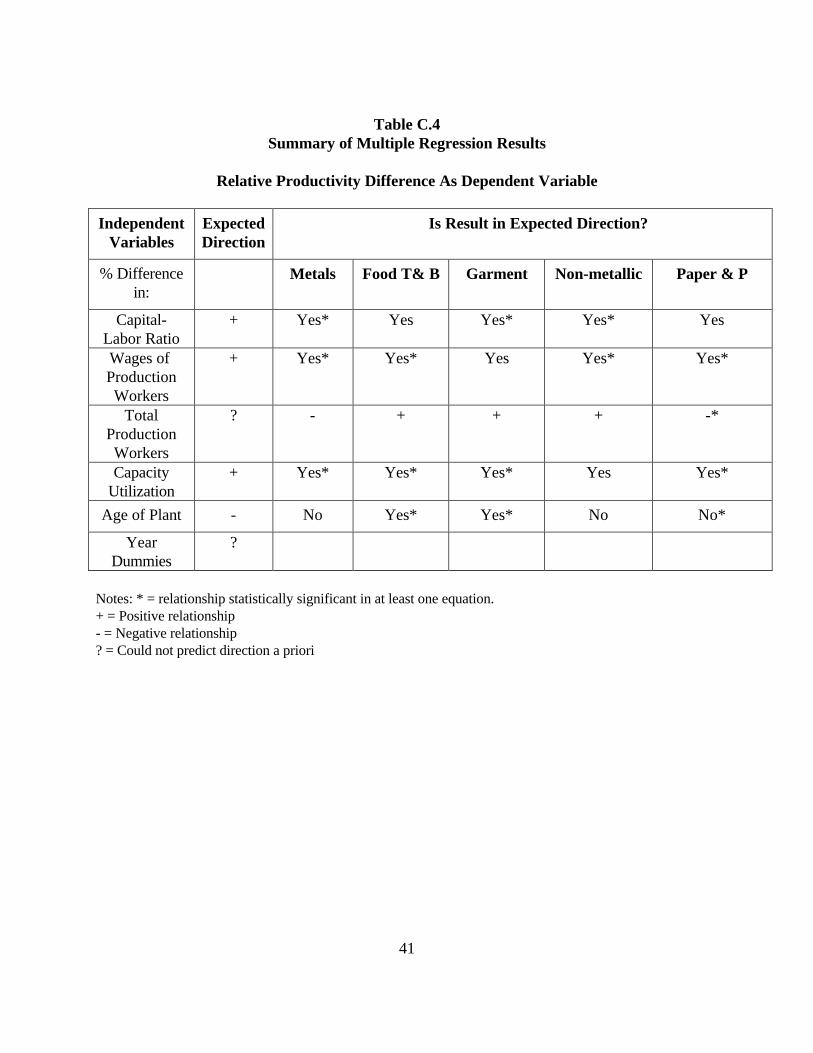
41
Table C.4Summary of Multiple Regression Results
Relative Productivity Difference As Dependent Variable
IndependentVariables
ExpectedDirection
Is Result in Expected Direction?
% Differencein:
Metals Food T& B Garment Non-metallic Paper & P
Capital-Labor Ratio
+ Yes* Yes Yes* Yes* Yes
Wages of ProductionWorkers
+ Yes* Yes* Yes Yes* Yes*
TotalProductionWorkers
? - + + + -*
CapacityUtilization
+ Yes* Yes* Yes* Yes Yes*
Age of Plant - No Yes* Yes* No No*
YearDummies
?
Notes: * = relationship statistically significant in at least one equation.+ = Positive relationship- = Negative relationship? = Could not predict direction a priori
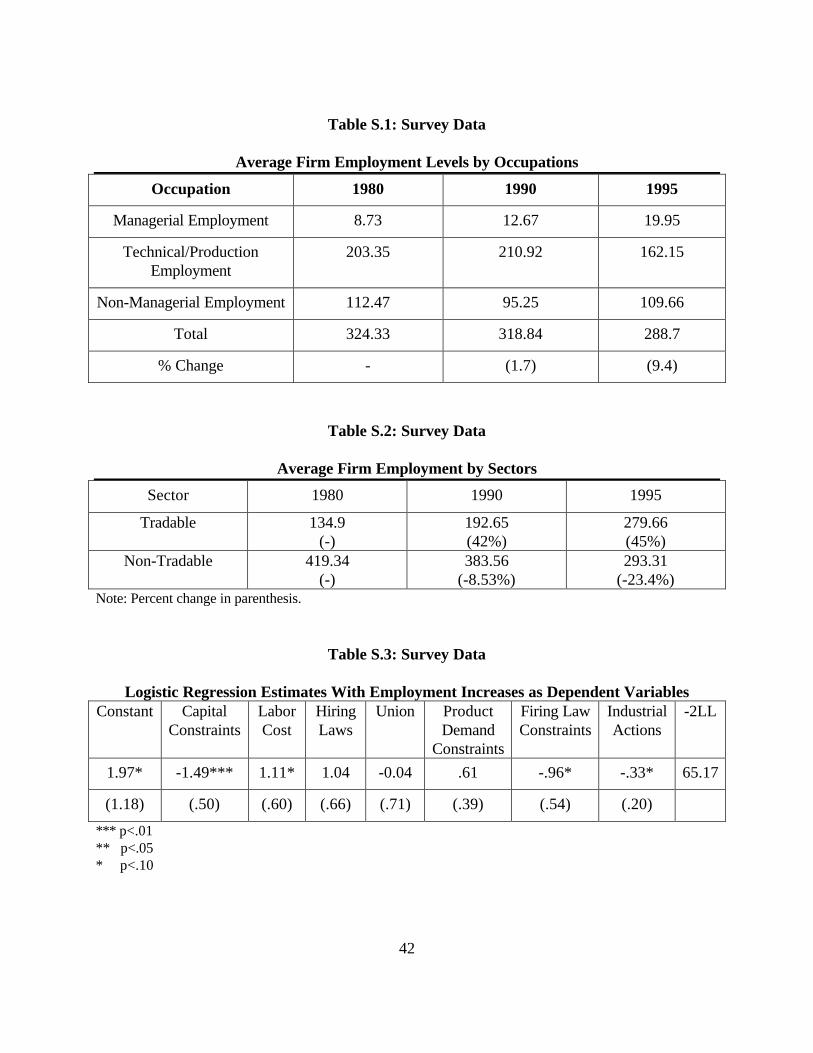
42
Table S.1: Survey Data
Average Firm Employment Levels by Occupations
Occupation 1980 1990 1995
Managerial Employment 8.73 12.67 19.95
Technical/ProductionEmployment
203.35 210.92 162.15
Non-Managerial Employment 112.47 95.25 109.66
Total 324.33 318.84 288.7
% Change - (1.7) (9.4)
Table S.2: Survey Data
Average Firm Employment by Sectors
Sector 1980 1990 1995
Tradable 134.9(-)
192.65(42%)
279.66(45%)
Non-Tradable 419.34(-)
383.56(-8.53%)
293.31(-23.4%)
Note: Percent change in parenthesis.
Table S.3: Survey Data
Logistic Regression Estimates With Employment Increases as Dependent VariablesConstant Capital
ConstraintsLaborCost
HiringLaws
Union ProductDemand
Constraints
Firing LawConstraints
IndustrialActions
-2LL
1.97* -1.49*** 1.11* 1.04 -0.04 .61 -.96* -.33* 65.17
(1.18) (.50) (.60) (.66) (.71) (.39) (.54) (.20)
*** p<.01** p<.05* p<.10

43
Appendix B
I. Models of Labor Demand
Following Hammermesh, (1993), the linear homogenous production function used is asfollows:
Y = [αLρ + (1 - α) Kρ]1/ρ …………………………(1)Where α and ρ are parameters, 1 > α > 0, 1 ≥ ρ ≥ -∝ . Marginal products are∂Y/ ∂L = α(Y/L)1-ρ .…………………………….(2)and∂Y/ ∂K = [1 - α] (Y/K)1-ρ…………………….…(3)Letting the ratio of (2) and (3) equal to the factor price ratio, taking logarithms and
differentiating with respect to Log (w/r) gives∂Log(K/L)/ ∂Log (w/r) = σ = 1/[1- ρ] …………(4)From this production function, the CES cost function was derived a la Ferguson
(1969,167) as follows:C = Y [ασw 1-σ + [1 - α]σ r 1-σ ]1/(1-σ) ………………(5)Where σ = 1/ [1- ρ] ≥ 0.The demand for labor isL = δC/δw = ασw -σY ………………………….(6)Taking logarithms on both the left and right hand sides of the equation yieldslnL = α* - σln w + lnY ………………. ……..…(7)Where α* is a constant. This equation will be used to estimate the elasticity of
substitution as follows (Hammermesh, 1991):-δln(K/L)/δln(w/r) = σ = 1/ [1- ρ] ………………(8)
From (8), the own-price elasticity of labor demand can be indirectly estimated as follows: ηLL = -[1- s]σ ………………………………….…(9)Where s = w*L/Y, the share of labor in total revenue.
The cross-elasticity of labor demand with respect to a change in the price of capital can beestimated as follows:
ηLk = [1- s]σ …………………………………….(10)We also obtain the own partial elasticity of demand for skilled and unskilled labor as well
as their cross-elasticities as follows:-ηSS = η/
SS + SS*ηLL.…………………………….………(11)-ηUU = η/
UU + SU*ηLL……………………………………(12)
ηSU = η/SU + SU*ηLL……………………………. (13)
ηUS = η/US + SS*ηLL……………………………. (14)
where η/ ij is the labor-constant [i.e. L=G(Li, Lj)] demand elasticity for labor i with respect to the
price of labor j and Si is labor i’s share of total output (Berndt and Wood, 1979).So we estimate the elasticity of substitution from equation (7) and then indirectly calculate
the demand elasticity parameters for homogenous production workers, skilled workers and
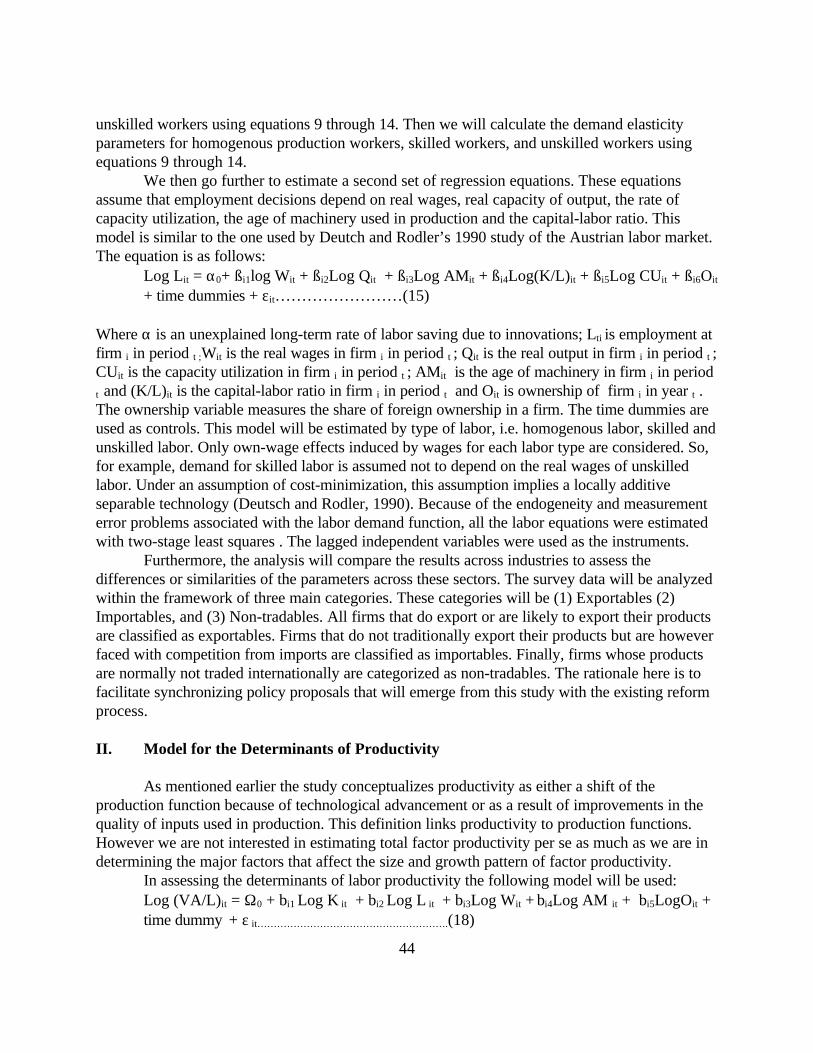
44
unskilled workers using equations 9 through 14. Then we will calculate the demand elasticityparameters for homogenous production workers, skilled workers, and unskilled workers usingequations 9 through 14.
We then go further to estimate a second set of regression equations. These equationsassume that employment decisions depend on real wages, real capacity of output, the rate ofcapacity utilization, the age of machinery used in production and the capital-labor ratio. Thismodel is similar to the one used by Deutch and Rodler’s 1990 study of the Austrian labor market.The equation is as follows:
Log Lit = α0+ ßi1log Wit + ßi2Log Qit + ßi3Log AMit + ßi4Log(K/L)it + ßi5Log CUit + ßi6Oit
+ time dummies + εit……………………(15)
Where α is an unexplained long-term rate of labor saving due to innovations; Lti is employment atfirm i in period t ;Wit is the real wages in firm i in period t ; Qit is the real output in firm i in period t ;CUit is the capacity utilization in firm i in period t ; AMit is the age of machinery in firm i in periodt and (K/L)it is the capital-labor ratio in firm i in period t and Oit is ownership of firm i in year t .The ownership variable measures the share of foreign ownership in a firm. The time dummies areused as controls. This model will be estimated by type of labor, i.e. homogenous labor, skilled andunskilled labor. Only own-wage effects induced by wages for each labor type are considered. So,for example, demand for skilled labor is assumed not to depend on the real wages of unskilledlabor. Under an assumption of cost-minimization, this assumption implies a locally additiveseparable technology (Deutsch and Rodler, 1990). Because of the endogeneity and measurementerror problems associated with the labor demand function, all the labor equations were estimatedwith two-stage least squares . The lagged independent variables were used as the instruments.
Furthermore, the analysis will compare the results across industries to assess thedifferences or similarities of the parameters across these sectors. The survey data will be analyzedwithin the framework of three main categories. These categories will be (1) Exportables (2)Importables, and (3) Non-tradables. All firms that do export or are likely to export their productsare classified as exportables. Firms that do not traditionally export their products but are howeverfaced with competition from imports are classified as importables. Finally, firms whose productsare normally not traded internationally are categorized as non-tradables. The rationale here is tofacilitate synchronizing policy proposals that will emerge from this study with the existing reformprocess.
II. Model for the Determinants of Productivity
As mentioned earlier the study conceptualizes productivity as either a shift of theproduction function because of technological advancement or as a result of improvements in thequality of inputs used in production. This definition links productivity to production functions.However we are not interested in estimating total factor productivity per se as much as we are indetermining the major factors that affect the size and growth pattern of factor productivity.
In assessing the determinants of labor productivity the following model will be used:Log (VA/L)it = Ω0 + bi1 Log K it + bi2 Log L it + bi3Log Wit + bi4Log AM it + bi5LogOit +time dummy + ε it………………………………………………….(18)
45
Where (VA/L) it is real value-added per employee in firm i in year t as proxy for productivity; K it isreal capital stock in firm i in yeart ; L it is employment in firm i in year t; Wit is real wages in firm i inyear t; AMit is the average age of machinery in firm i in year t ; and Oit is ownership of firm i inyear t. The ownership is measured by the percent of foreign ownership in the firm. The timedummies are included to measure the underlying changes in the production function or technicalprogress. Productivity of labor (value-added per employee) will further be modeled across groupsof high productivity firms and low productivity firms to find out if the determinants differ acrossgroups. Then we will find out the factors that influence the differences in productivity betweenhigh and low productivity firms in the same industry. We use ordinary least squares (OLS) forestimating the productivity equations.

To Order EAGER Publications
EAGER Publications/BHMP.O. Box 3415
Alexandria, Virginia 22302Tel: (703) 299-0650 Fax: (703) 299-0651
e-mail: [email protected]
EAGER Publications can be downloaded from www.eagerproject.comor through USAID’s website at www.dec.org
Policy Briefs based on EAGER researchfunded by the U.S. Agency for International Development:
1. Can Mali Increase Red Meat Exports? Metzel, Jeffrey, Abou Doumbia, Lamissa Diakite, and N’Thio AlphaDiarra. Prospects for Developing Malian Livestock Exports. Cambridge, MA: Associates for International Resourcesand Development, 1997. Available in French.
2. The Livestock Sector in Mali - Potential for the Future. Metzel, Jeffrey, Abou Doumbia, Lamissa Diakite, andN’Thio Alpha Diarra. Prospects for Developing Malian Livestock Exports. Cambridge, MA: Associates forInternational Resources and Development, 1997. Available in French.
3. Mali’s Manufacturing Sector: Policy Reform for Success. Cockburn, John, Eckhard Siggel, Massaoly Coulibaly,and Sylvain Vézina. Manufacturing Competitiveness and the Structure of Incentives in Mali. Cambridge, MA:Associates for International Resources and Development, 1997. Available in French.
4. Growth and Equity: Gemstone and Gold Mining in Tanzania. Phillips, Lucie Colvin, Rogers Sezinga, HajiSemboja, and Godius Kahyarara. Gemstone and Gold Marketing for Small-Scale Mining in Tanzania. Arlington,VA: International Business Initiatives, 1997. Available in French.
5. Financial Services and Poverty in Senegal. Ndour, Hamet, and Aziz Wané. Financial Intermediation for thePoor. Cambridge, MA: Harvard Institute for International Development, 1997. Available in French.
6. Need to Promote Exports of Malian Rice. Barry, Abdoul W., Salif B. Diarra, and Daouda Diarra. Promotion ofthe Regional Export of Malian Rice. Cambridge, MA: Associates for International Resources and Development, 1997.Available in French.
7. Trade Policy Reform: A Success? Metzel, Jeffrey, and Lucie C. Phillips. Bringing Down Barriers to Trade: TheExperience of Trade Policy Reform. Cambridge, MA: Associates for International Resources and Development, 1997.Available in French.
8. Excise Taxes: A Greater Role in Sub-Saharan Africa? Bolnick, Bruce, and Jonathan Haughton. Tax Policy inSub-Saharan Africa: Reexamining the Role of Excise Taxation. Cambridge, MA: Harvard Institute for InternationalDevelopment, 1997. Available in French.
9. Status of Financial Intermediation for the Poor in Africa. Nelson, Eric. Financial Intermediation for the Poor:Survey of the State of the Art. Bethesda, MD: Development Alternatives Incorporated, 1997. Available in French.
10. Foreign Direct Investment and Institutions. Wilhelms, Saskia K.S. Foreign Direct Investment and ItsDeterminants in Emerging Economies. Cambridge, MA: Associates for International Resources and Development,1997. Available in French.
11. Strong Institutions Support Market-Oriented Policies. Goldsmith, Arthur. Institutions and Economic Growthin Africa. Cambridge, MA: Harvard Institute for International Development, 1997. Available in French.
12. Reducing Tax Evasion. Wadhawan, Satish, and Clive Gray. Enhancing Transparency in Tax Administration: ASurvey. Cambridge, MA: Harvard Institute for International Development, 1997. Available in French.
13. Can Africa Take Lessons from the U.S. Approach to Tax Evasion? Gray, Clive. Enhancing Transparency inTax Administration: United States Practice in Estimating and Publicizing Tax Evasion. Cambridge, MA: HarvardInstitute for International Development, 1997. Available in French.
14. Estimating Tax Buoyancy, Elasticity and Stability. Haughton, Jonathan. Estimating Tax Buoyancy, Elasticity,and Stability. Cambridge, MA: Harvard Institute for International Development, 1997. Available in French.
15. Estimating Demand Curves for Goods Subject to Excise Taxes. Jonathan Haughton. Estimating DemandCurves for Goods Subject to Excise Taxes. Cambridge, MA: Harvard Institute for International Development, 1997. Available in French.
16. Fixed or Floating Exchange Rates? Amvouna, Anatolie Marie. Determinants of Trade and GrowthPerformance in Africa: A Cross-Country Analysis of Fixed Versus Floating Exchange Rate Regimes. Cambridge,MA: Associates for International Resources and Development, 1997. Available in French.
17. Trade and Development in Africa. Stryker, J. Dirck. Trade and Development in Africa. Cambridge, MA:Associates for International Resources and Development, 1997. Available in French.
18. Increasing Demand for Labor in South Africa. Stryker, J. Dirck, Fuad Cassim, Balakanapathy Rajaratnam,Haroon Bhorat, and Murray Leibbrandt. Increasing Demand for Labor in South Africa. Cambridge, MA: Associatesfor International Resources and Development, 1998.
19. Structural Adjustment: Implications for Trade. Barry, Abdoul W., B. Lynn Salinger, and Selina Pandolfi.Sahelian West Africa: Impact of Structural Adjustment Programs on Agricultural Competitiveness and RegionalTrade. Cambridge, MA: Associates for International Resources and Development, 1998. Available in French.
20. The Uruguay Round: Impact on Africa. Hertel, Thomas W., William A. Masters, and Aziz Elbehri. TheUruguay Round and Africa: A Global, General Equilibrium Analysis. Cambridge, MA: Associates for InternationalResources and Development, 1998. Available in French.
21. Are Formal Trade Agreements the Right Strategy? Radelet, Steven. Regional Integration and Cooperation inSub-Saharan Africa: Are Formal Trade Agreements the Right Strategy? Cambridge, MA: Harvard Institute forInternational Development, 1997.
22. Textiles in South Africa. Flaherty, Diane P., and B. Lynn Salinger. Learning to Compete: Innovation andGender in the South African Clothing Industry. Cambridge, MA: Associates for International Resources andDevelopment, 1998. Available in French.

23. Barriers to Business Expansion in a New Environment: The Case of Senegal. Beltchika-St. Juste, Ndaya,Mabousso Thiam, J. Dirck Stryker, with assistance from Pape Ibrahima Sow. Barriers to Business Expansion in a NewEnvironment: The Case of Senegal. Cambridge, MA: Associates for International Resources and Development, 1999.Available in French.
24. Government and Bureaucracy. Goldsmith, Arthur. Africa’s Overgrown State Reconsidered: Bureaucracy andEconomic Growth. Cambridge, MA: Harvard Institute for International Development, 1998.
25. What Can We Do To Stop Smuggling in Tanzania? Phillips, Lucie Colvin, Rogers Sezinga, and Haji Semboja. Based on EAGER research in Tanzania on gold and gems marketing. Arlington, VA: International Business Initiatives,1997.
26. Financial Programming in East and Southern Africa. Workshop held in Lilongwe, Malawi. June, 1999.
27. Restarting and Sustaining Growth and Development in Africa: A Framework for Action. Duesenberry,James S., Arthur A. Goldsmith, and Malcolm F. McPherson. Restarting and Sustaining Growth and Development inAfrica. Cambridge, MA: Harvard Institute for International Development, 2000.
28. Restarting and Sustaining Growth and Development in Africa: Enhancing Productivity. Duesenberry,James S., Arthur A. Goldsmith, and Malcolm F. McPherson. Restarting and Sustaining Growth and Development inAfrica. Cambridge, MA: Harvard Institute for International Development, 2000.
29. A Pragmatic Approach to Policy Change. Duesenberry, James S., and Malcolm F. McPherson. Restarting andSustaining Growth and Development in Africa: The Role of Macroeconomic Management. Cambridge, MA:Harvard Institute for International Development, forthcoming in 2000.
30. Finance Capital and Real Resources. Duesenberry, James S., and Malcolm F. McPherson. Restarting andSustaining Growth and Development in Africa: The Role of Macroeconomic Management. Cambridge, MA:Harvard Institute for International Development, forthcoming in 2000.
31. The Role of Central Bank Independence in Improved Macroeconomic Management. Duesenberry, James S.,and Malcolm F. McPherson. Restarting and Sustaining Growth and Development in Africa: The Role ofMacroeconomic Management. Cambridge, MA: Harvard Institute for International Development, forthcoming in2000.
32. Governance and Macroeconomic Management. Duesenberry, James S., and Malcolm F. McPherson. Restartingand Sustaining Growth and Development in Africa: The Role of Improved Macroeconomic Management.Cambridge, MA: Harvard Institute for International Development, 2000.
33. The Benefits and Costs of Seignorage. McPherson, Malcolm F. Seignorage in Highly Indebted DevelopingCountries. Cambridge, MA: Harvard Institute for International Development, 2000.
35. Global Trade Analysis for Southern Africa. Masters, William A. Based on EAGER research in Southern Africa.West Lafayette, IN: Purdue University, 2000.
36. Modeling Long-Term Capacity Expansion Options for the Southern African Power Pool (SAPP). Sparrow,F. T., Brian H. Bowen, and Zuwei Yu. Modeling Long-Term Capacity Expansion Options for the Southern AfricanPower Pool (SAPP). West Lafayette, IN: Purdue University, 1999.
38. Africa’s Opportunities in the New Global Trading Scene. Salinger, B. Lynn, Anatolie Marie Amvouna, andDeirdre Murphy Savarese. New Trade Opportunities for Africa. Cambridge, MA: Associates for InternationalResources and Development, 1998. Available in French.

39. Implications for Africa of Initiatives by WTO, EU and US. Plunkett, Daniel. Implications for Africa ofInitiatives by WTO, EU and US. Cambridge, MA: Associates for International Resources and Development, 1999.
40. Domestic Vanilla Marketing in Madagascar. Metzel, Jeffrey, Emilienne Raparson, Eric Thosun Mandrara. TheCase of Vanilla in Madagascar. Cambridge, MA: Associates for International Resources and Development, 1999.
41. The Transformation of Microfinance in Kenya. Rosengard, Jay, Ashok S. Rai, Aleke Dondo, and Henry O.Oketch. Microfinance Development in Kenya: Transforming K-Rep’s Microenterprise Credit Program into aCommercial Bank. Cambridge, MA: Harvard Institute for International Development, 1999.
42. Africans Trading with Africans: Cross-Border Trade – The Case of Ghana. Morris, Gayle A., and John Dadson. Ghana: Cross Border Trade Issues. Arlington, Virginia: International Business Initiatives, 2000.
43. Trade Liberalization and Growth in Kenya. Glenday, Graham, and T. C. I. Ryan. Based on EAGER Research.Cambridge, MA: Belfer Center for Science & International Affairs, 2000.
46. Labor Demand and Labor Productivity in Ghana. Gyan-Baffour, George, and Charles Betsey, in collaborationwith Kwadwo Tutu and Kwabia Boateng. Increasing Labor Demand and Labor Productivity in Ghana. Cambridge,MA: Belfer Center for Science & International Affairs, 2000.
47. Foreign & Local Investment in East Africa. Phillips, Lucie C., Marios Obwona, Margaret McMillan, with AloysB. Ayako. Foreign and Local Investment In East Africa, Interactions and Policy Implications: Case Studies onMauritius, Uganda and Kenya. Arlington, Virginia: International Business Initiatives, 2000.
48. Does it pay to court foreign investment? Phillips, Lucie C., Marios Obwona, Margaret McMillan, with Aloys B.Ayako. Foreign and Local Investment in East Africa: Interactions and Policy Implications. Arlington, Virginia:International Business Initiatives, 2000.
49. Ethnicity & Investment Promotion: A Thorny Path for Policy Makers. Phillips, Lucie C., Marios Obwona,Margaret McMillan, with Aloys B. Ayako. Foreign and Local Investment in East Africa: Interactions and PolicyImplications. Arlington, Virginia: International Business Initiatives, 2000.
50. Monetary and Exchange Rate Policy in Uganda. Musinguzi, Polycarp, with Marios Obwona, and J. DirckStryker. Monetary and Exchange Rate Policy in Uganda. Cambridge, MA: Associates for International Resourcesand Development, 2000.
African Economic Policy Discussion Papers
1. Kähkönen, S., and P. Meagher. July 1998. Contract Enforcement and Economic Performance. Available inFrench.
2. Bolnick, B., and J. Haughton. July 1998. Tax Policy in Sub-Saharan Africa: Examining the Role of ExciseTaxation. Available in French.
3. Wadhawan, S. C., and C. Gray. July 1998. Enhancing Transparency in Tax Administration: A Survey. Availablein French.
4. Phillips, L. C. July 1998. The Political Economy of Policy Making in Africa. 5. Metzel, J., and L. C. Phillips. July 1998. Bringing Down Barriers to Trade: The Experience of Trade PolicyReform. Available in French.
6. Salinger, B. L., A. M. Amvouna, and D. M. Savarese. July 1998. New Trade Opportunities for Africa. Availablein French.
7. Goldsmith, Arthur. July 1998. Institutions and Economic Growth in Africa. Available in French.
8. Flaherty, D. P., and B. L. Salinger. July 1998. Learning to Compete: Innovation and Gender in the South AfricanClothing Industry.
9. Wilhelms, S. K. S. July 1998. Foreign Direct Investment and Its Determinants in Emerging Economies.Available in French.
10. Nelson, E. R. August 1998. Financial Intermediation for the Poor: Survey of the State of the Art. Available inFrench.
11. Haughton, J. August 1998. Estimating Tax Buoyancy, Elasticity, and Stability.
12. Haughton, J. August 1998. Estimating Demand Curves for Goods Subject to Excise Taxes.
13. Haughton, J. August 1998. Calculating the Revenue-Maximizing Excise Tax.
14. Haughton, J. August 1998. Measuring the Compliance Cost of Excise Taxation.
15. Gray, C. August 1998. United States Practice in Estimating and Publicizing Tax Evasion.
16. Cockburn, J., E. Siggel, M. Coulibaly, and S. Vézina. August 1998. Measuring Competitiveness and its Sources:The Case of Mali’s Manufacturing Sector. Available in French.
17. Barry, A. W., S. B. Diarra, and D. Diarra. April 1999. Promotion of Regional Exports of Malian Rice. Availablein French.
18. Amvouna, A. M. July 1998. Determinants of Trade and Growth Performance in Africa: A Cross-CountryAnalysis of Fixed verus Floating Exchange Rate Regimes. Available in French.
19. Stryker, J. D. June 1999. Dollarization and Its Implications in Ghana. Available in French.
20. Radelet, S. July 1999. Regional Integration and Cooperation in Sub-Saharan Africa: Are Formal TradeAgreements the Right Strategy?
21. Plunkett, D. September 1999. Implications for Africa of Initiatives by the WTO, EU and US.
22. Morris, G. A. and J. Dadson. March 2000. Ghana: Cross-Border Trade Issues.
23. Musinguzi, P., with M. Obwona and J. D. Stryker. April 2000. Monetary and Exchange Rate Policy in Uganda.
24. Siggel, E., and G. Ssemogerere. June 2000. Uganda’s Policy Reforms, Industry Competitiveness and RegionalIntegration: A comparison with Kenya.
25. Siggel, E., G. Ikiara, and B. Nganda. June 2000. Policy Reforms, Competitiveness and Prospects of Kenya’sManufacturing Industries: 1984-1997 and Comparisons with Uganda.
26. McPherson, M. F. July 2000. Strategic Issues in Infrastructure and Trade Policy.
27. Sparrow, F. T., B. H. Bowen, and Z. Yu. July 1999. Modeling Long-Term Capacity Expansion Options for theSouthern African Power Pool (SAPP). Available in French.
28. Goldsmith, A., M. F. McPherson, and J. Duesenberry. January 2000. Restarting and Sustaining Growth andDevelopment in Africa.
29. Gray, C., and M. F. McPherson. January 2000. The Leadership Factor in African Policy Reform and Growth.
30. Masters, W. A., R. Davies, and T. W. Hertel. November 1998 revised June 1999. Europe, South Africa, andSouthern Africa: Regional Integration in a Global Context. Available in French.
31. Beltchika-St. Juste, N., M. Thiam, J. D. Stryker, with assistance from P. I. Sow. 1999. Barriers to BusinessExpansion in a New Environment: The Case of Senegal. Available in French.
32. Salinger, B. L., D. P. Flaherty, and M. Keswell. September 1999. Promoting the Competitiveness of Textiles andClothing Manufacture in South Africa.
33. Block, S. A. August 1999. Does Africa Grow Differently?
34. McPherson, M. F. and T. Rakovski. January 2000. A Small Econometric Model of the Zambian Economy.
37. Barry, A. W., Salinger, B. L., and S. Pandolfi. December 2000. Sahelian West Africa: Impact of StructuralAdjustment Programs on Agricultural Competitiveness and Regional Trade.
40. Bräutigam, D. July 2000. Interest Groups, Economic Policy, and Growth in Sub-Saharan Africa.
43. Glenday, G., and D. Ndii. July 2000. Export Platforms in Kenya.
44. Glenday, G. July 2000. Trade Liberalization and Customs Revenues: Does trade liberalization lead to lowercustoms revenues? The Case of Kenya.
46. Goldsmith, A. June 2000. Risk, Rule, and Reason in Africa.
47. Goldsmith, A. June 2000. Foreign Aid and Statehood in Africa.
49. McPherson, M. F., and C. Gray. July 2000. An ‘Aid Exit’ Strategy for African Countries: A Debate.
51. Isimbabi, M. J. December 2000. Globalization and the WTO Agreement on Financial Services in AfricanCountries.
53. McPherson, M. F., and C. B. Hill. June 2000. Economic Growth and Development in Zambia: The WayForward.
56. McPherson, M. F., and T. Rakovski. July 2000. Exchange Rates and Economic Growth in Kenya: AnEconometric Analysis.
57. McPherson, M. F. July 2000. Exchange Rates and Economic Growth in Kenya.
58. McPherson, M. F. July 2000. Seignorage in Highly Indebted Developing Countries.
67. Phillips, L. C., M. Obwona, M. McMillan, with A. B. Ayako. December 2000. Foreign and Local Investment inEast Africa: Interactions and Policy Implications.
EAGER Research Reports
Cockburn, John, E. Siggel, M. Coulibaly, and S. Vézina. October 1998. Measuring Competitiveness and its Sources:The Case of Mali’s Manufacturing Sector. Available in French.
McEwan, Tom et al. A Report on Six Studies of Small, Medium and Micro Enterprise Developments in Kwazulu-Natal.
McPherson, Malcolm F. Sustaining Trade and Exchange Rate Reform in Africa: Lessons for MacroeconomicManagement.
Metzel, Jeffrey, A. Doumbia, L. Diakite, and N. A. Diarra. July 1998. Prospects for Developing Malian Red Meatand Livestock Exports. Available in French.
Phillips, Lucie C., M. Obwona, M. McMillan, with A. B. Ayako. December 2000. Foreign and Local Investment InEast Africa, Interactions and Policy Implications: Case Studies on Mauritius, Uganda and Kenya.
Salinger, Lynn B., H. Bhorat, D. P. Flaherty, and M. Keswell. August 1999. Promoting the Competitiveness ofTextiles and Clothing Manufacture in South Africa.
Sparrow, F. T., and B. H. Bowen. July 1999. Modeling Electricity Trade in South Africa: User Manual for theLong-Term Model.
Other Publications
McPherson, Malcolm F., and Arthur Goldsmith. Summer-Fall 1998. Africa: On the Move? SAIS Review, A Journal ofInternational Affairs, The Paul H. Nitze School of Advanced International Studies, The John Hopkins University,Volume XVIII, Number Two, p. 153.
EAGER All Africa Conference Proceedings. October 18-20, 1999.
EAGER Regional Workshop Proceedings on the Implementation of Financial Programming. Lilongwe, Malawi. June10-11, 1999.
EAGER Workshop Proceedings Senegal. November 4-6, 1998.
EAGER Workshop Proceedings South Africa. February 4-6, 1998.
EAGER Workshop Proceedings Tanzania. August 13-16, 1997.
EAGER Workshop Proceedings Ghana. February 5-8, 1997.
EAGER Workshop Proceedings. Howard University. July 17-19, 1996.
EAGER Workshop Proceedings Uganda. June 19-22, 1996.