Embed Size (px)
Citation preview
SURFACE AND INTERFACE ANALYSIS, VOL. 25, 741È746 (1997)
Incorporation of Surface Topography in the XPSAnalysis of Curved or Rough Samples Covered byThin Multilayers
Ronald C. Chatelier,* Heather A. W. St John, Thomas R. Gengenbach, Peter Kingshott andHans J. GriesserDivision of Chemicals and Polymers, CSIRO, Private Bag 10, Rosebank MDC, Clayton 3169, Australia
Approaches are described for the analysis of XPS signals from samples comprising thin conformal coatings onsubstrates with non-ideal surface topography. In particular, attention is focused on arbitrarily shaped rough orcurved substrates. Relations are derived for the relative x-ray photoelectron intensities emitted from various ele-ments in such non-ideal samples. The surface topography of arbitrarily rough samples is analysed by atomic forcemicroscopy to provide a frequency histogram of the local slopes, which is incorporated into a global, multi-elementanalysis method for interpretation of the observed XPS elemental intensities. An analogous approach is used for theanalysis of curved samples. Our algorithms also enable simultaneous analysis of successively coated multilayerstructures. When the elemental composition of the individual layers is known, the Ðt procedure enables determi-nation of the thickness values of single-layer and multilayer coatings. The range of validity of the theory is dis-cussed. 1997 by John Wiley & Sons, Ltd.(
Surf. Interface Anal. 25, 741È746 (1997)No. of Figures : 7 No. of Tables : 0 No. of Refs : 20
KEYWORDS: XPS; coating thickness ; global analysis ; multilayers ; curvature ; roughness ; atomic force microscopy
INTRODUCTION
The analysis by XPS of thin coatings is essential in thedevelopment and manufacturing quality assurance ofmultilayer materials intended for a variety of applica-tions. For instance, contact lenses intended for extendedwear must meet the requirement of high oxygen per-meability. As this is achievable only with hydrophobicpolymers such as silicones, hydrophilic coatings need tobe applied onto the bulk of the contact lens in order toprovide a surface that is comfortable to the eye.1h4 Suchcoatings should be very thin so that they do not reduceoxygen permeability, and XPS has been particularlysuitable for the analysis of such ultrathin organicÈpolymeric coatings.5
Many samples of applied interest possess complex,non-ideal surface topographies, for instance character-ized by roughness with a random distribution of featureshapes and sizes. Other samples, such as contact lenses,catheters and sutures, possess a curved shape uponwhich features such as scratches and random roughnesscan be superimposed. However, current methods for theanalysis of angle-resolved XPS data recorded onsamples comprising thin surface coatings are applicableeither to atomically smooth structures6 or requireextensive data collection at several photoelectron emis-sion angles.7 When the signal from a unique element in
* Correspondence to : R. C. Chatelier, Division of Chemicals andPolymers, CSIRO, Private Bag 10, Rosebank MDC, Clayton 3169,Australia. E-mail : r.chatelier=chem.csiro.au
Contract grant sponsor : Commonwealth GovernmentÏs Co-operative Research Centre.
Contract grant sponsor : Ciba Vision Corporation.
a single layer of a multilayer system is analysed therecan be considerable uncertainty in the calculated thick-ness of the coating,8 highlighting the importance of per-forming a global (simultaneous) analysis of all the XPSsignals from elements present in the various layers.
The e†ect of roughness on XPS signals has been con-sidered by assuming that the rugosities were perfecthemispheres,9h12 a model thought to be useful for theanalysis of powders. A review of methods for analysingXPS signals from overlayers on rough surfaces hascovered a variety of models.13 However, no treatmentexists for the global analysis of XPS signals from multi-layers on surfaces of arbitrary measurable roughnessor curvature. In this communication we describeapproaches for the XPS analysis of samples that possesssuch topographies.
We will present a method that can utilize sparse datasets and can take account of non-ideal samplegeometry. The method requires topographical measure-ments of the surface, which can most conveniently andaccurately be done using atomic force microscopy(AFM). The topographical raw data are converted intoa frequency histogram of the “local slopesÏ on thesurface and are then convolved with XPS theory formultilayer systems. This procedure can be used tosimultaneously Ðt signals from all elements in all layersof a rough or curved multilayer system.
The global analysis method will be applied to twopractical examples : macroscopically Ñat samples thatare rough on the nanometre scale, and macroscopicallycurved samples such as contact lenses. These exampleswill be used to highlight the strengths and weaknessesof the analysis method. We will then consider sinusoidalsurfaces with various amplitude : period ratios and assess
CCC 0142È2421/97/010741È06 $17.50 Received 21 October 1996( 1997 by John Wiley & Sons, Ltd. Accepted 19 March 1997
742 R. C. CHATELIER ET AL .
three simple methods for taking the topography intoaccount when analysing XPS signal intensities from thinmultilayers.
THEORY
In the following sections we will assume that the photo-electrons from a particular element have identical meanfree paths in all layers. We will further assume that eachlayer is homogeneous, isotropic and conformal, i.e.parallel to the other layers and of uniform thickness.The validity of these assumptions will need to be assess-ed for each sample that is analysed.
Smooth multilayers
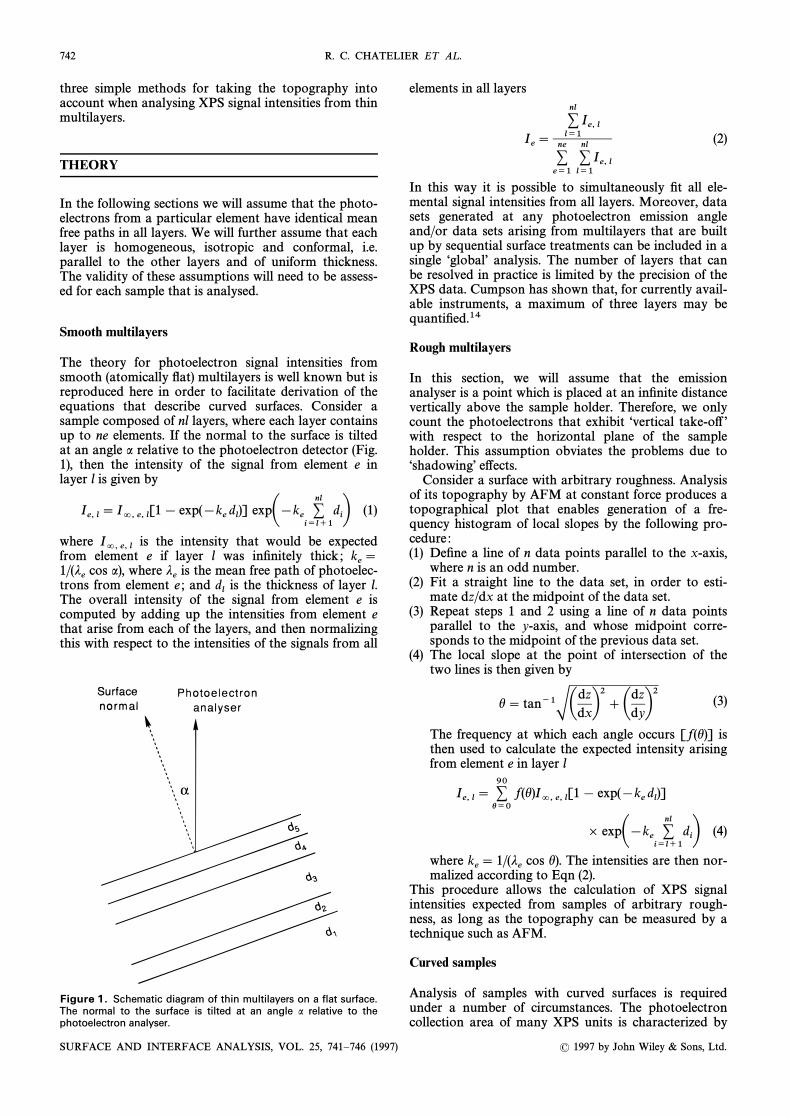
The theory for photoelectron signal intensities fromsmooth (atomically Ñat) multilayers is well known but isreproduced here in order to facilitate derivation of theequations that describe curved surfaces. Consider asample composed of nl layers, where each layer containsup to ne elements. If the normal to the surface is tiltedat an angle a relative to the photoelectron detector (Fig.1), then the intensity of the signal from element e inlayer l is given by
Ie, l\ I=, e, l[1 [ exp([k
edl)] exp
A[k
e;
i/l`1
nldi
B(1)
where is the intensity that would be expectedI=, e, lfrom element e if layer l was inÐnitely thick ; ke\
cos a), where is the mean free path of photoelec-1/(je
jetrons from element e ; and is the thickness of layer l.d
lThe overall intensity of the signal from element e iscomputed by adding up the intensities from element ethat arise from each of the layers, and then normalizingthis with respect to the intensities of the signals from all
Figure 1. Schematic diagram of thin multilayers on a flat surface.The normal to the surface is tilted at an angle a relative to thephotoelectron analyser.
elements in all layers
Ie\
;l/1
nlIe, l
;e/1
ne;l/1
nlIe, l
(2)
In this way it is possible to simultaneously Ðt all ele-mental signal intensities from all layers. Moreover, datasets generated at any photoelectron emission angleand/or data sets arising from multilayers that are builtup by sequential surface treatments can be included in asingle “globalÏ analysis. The number of layers that canbe resolved in practice is limited by the precision of theXPS data. Cumpson has shown that, for currently avail-able instruments, a maximum of three layers may bequantiÐed.14
Rough multilayers
In this section, we will assume that the emissionanalyser is a point which is placed at an inÐnite distancevertically above the sample holder. Therefore, we onlycount the photoelectrons that exhibit “vertical take-o†Ïwith respect to the horizontal plane of the sampleholder. This assumption obviates the problems due to“shadowingÏ e†ects.
Consider a surface with arbitrary roughness. Analysisof its topography by AFM at constant force produces atopographical plot that enables generation of a fre-quency histogram of local slopes by the following pro-cedure :(1) DeÐne a line of n data points parallel to the x-axis,
where n is an odd number.(2) Fit a straight line to the data set, in order to esti-
mate dz/dx at the midpoint of the data set.(3) Repeat steps 1 and 2 using a line of n data points
parallel to the y-axis, and whose midpoint corre-sponds to the midpoint of the previous data set.
(4) The local slope at the point of intersection of thetwo lines is then given by
h \ tan~1SAdz
dxB2]
AdzdyB2 (3)
The frequency at which each angle occurs [ f (h)] isthen used to calculate the expected intensity arisingfrom element e in layer l
Ie, l\ ;
h/0
90f (h)I=, e, l[1 [ exp([k
edl)]
] expA[k
e;
i/l`1
nldi
B(4)
where cos h). The intensities are then nor-ke\ 1/(j
emalized according to Eqn (2).This procedure allows the calculation of XPS signalintensities expected from samples of arbitrary rough-ness, as long as the topography can be measured by atechnique such as AFM.
Curved samples
Analysis of samples with curved surfaces is requiredunder a number of circumstances. The photoelectroncollection area of many XPS units is characterized by
SURFACE AND INTERFACE ANALYSIS, VOL. 25, 741È746 (1997) ( 1997 by John Wiley & Sons, Ltd.

SURFACE TOPOGRAPHY AND XPS ANALYSIS 743
Figure 2. Schematic diagram of a section of sphere that iscovered by thin layers. For simplicity, only one quadrant of the‘curvi-rectangular’ sample is shown; thus the vertical solid linegoes through the midpoint (apex) of the sample.
dimensions over which samples such as contact lensesand catheters possess substantial curvature. A furtherexample is given by sutures that have dimensions com-parable to the analysis area even of instruments thatcan access small spot sizes.
Figure 2 illustrates the shape of the area from whichphotoelectrons are collected when a thin-Ðlm-coatedcontact lens, whose radius is typically D9 mm, isanalysed using a VG Escalab V spectrometer with anXPS analysis slit of 1È4 mm by 10 mm. The variation inthe local slopes must be taken into account in theanalysis and thickness determination of thin coatings oncurved samples. Assuming that the photoelectronanalyser is placed vertically above the sample, the slopefrequency histogram may be derived by discretizing thesurface in the x- and y-directions, and by recalling thatfor a sphere
h \ tan~1S x2] y2
r2[ x2[ y2(5)
where r is the radius of the sphere. The resulting slopefrequency histogram may be substituted into Eqn (4) inorder to calculate the expected XPS signals.
A caveat concerning layer thickness and local curvature
The above theoretical considerations assumed that allthe layers are conformal. Assume that the height of thesurface shown in Fig. 3 may be described by a di†eren-
Figure 3. Schematic diagram of a thick film on a highly curvedsurface.
tiable function z(x). The height of the surface at a posi-tion x ] *x is given by the TaylorÏs series expansion
z(x ] *x)\ z(x) ] z@(x)*x ] 0.5zA(x)(*x)2] É É É (6)
However, Eqn (4) was derived by assuming that
z(x ] *x) \ z(x) ] z@(x)*x (7)
which only holds true when
zA(x)*x > 2z@(x) (8)
In other words, the validity of the theory should bereassessed when the layers are very thick and when thesurface is highly curved.
RESULTS
Rough surfaces (etched glass)
Figure 4(a) shows an AFM image of glass. The surfaceis smooth on the nanometre scale, and so we wouldanticipate that XPS signals from overlayers on thissample could be treated using conventional theories[e.g. Eqns (1) and (2)]. The slope frequency histogramfor this sample is shown in Fig. 5, curve “aÏ (note the logscale on the ordinate axis). Most of the microscopicsurface areas are tilted by 0È3¡ with respect to themacroscopic surface plane, so it is reasonable to applyformalisms requiring surface smoothness.
In contrast, glass that has been etched with NaOHcan be extremely rough, as shown by the AFM image inFig. 4(b). The slope frequency histograms for etchedglass specimens, shown in Fig. 5, reveal that substantialmicroscopic areas of the surface are tilted at up to 40¡relative to the macroscopic surface plane. It is thereforenecessary to analyse XPS signals from overlayers onthese samples using a theory that explicitly takesaccount of the roughness of the surface.
The magnitude of the error that can be introducedinto overlayer calculations when neglecting micro-scopic, random surface roughness is illustrated by thefollowing example. Consider an inÐnitely thick sampleof that has a surface roughness corresponding toSiO2the slope frequency histogram in Fig. 5(d), i.e. glass thathas been etched with 5% NaOH. For such a substratecoated with a 50 thick layer of hydrocarbon, it is pos-Ósible to use Eqn 4 to calculate the intensities of the Si, Oand C signals that would be measured by XPS. If wehad no knowledge of the non-ideal topography of thesample, then we would have analysed the data using the“Ñat surfaceÏ formalism given in Eqn (1). However, whenEqn (1) is used, we obtain a best-Ðt thickness of 51.7 Ófor the hydrocarbon overlayer, which corresponds to anerror of 3.4%. Although this error is relatively minor,we shall see in the next section that it is possible toencounter errors that are larger. We will also discusssimple methods of reducing these errors to insigniÐcantlevels.
Spherical surfaces
As a further example, we will illustrate the method forthe analysis of contact lenses coated with thin Ðlms.Figure 6 shows slope frequency histograms for a com-mercially available contact lens, Advent, calculated for
( 1997 by John Wiley & Sons, Ltd. SURFACE AND INTERFACE ANALYSIS, VOL. 25, 741È746 (1997)

744 R. C. CHATELIER ET AL .
(a)
(b)
Figure 4. Atomic force microscopy images obtained with a Nanoscope IIIa (Digital Instruments Inc.) on window glass surfaces that havebeen etched overnight at 60 ¡C with : (a) 0% (w/v) NaOH; (b) 5% (w/v) NaOH.
di†erent “emission slit widthsÏ that are relevant to a VGEscalab XPS unit. As the slit width is increased, a largerfraction of photoelectrons is collected closer to the edgeof the contact lens, and hence the histogram is weightedtowards larger angles. The spread of emission anglesshows that a conventional “Ñat surfaceÏ theory for XPS
Figure 5. Slope frequency histograms obtained with glass incu-bated overnight at 60 ¡C with the following concentrations ofNaOH (% w/v) : (a) 0; (b) 1; (c) 3; (d) 5.
will be inadequate, and it will be necessary to use theimproved theory described in this paper.
The magnitude of the error in thickness estimatesthat can arise from making an incorrect assumptionabout surface geometry can again be illustrated with asimple example. Consider an Advent lens with a 50 Óthick hydrocarbon coating, analysed using a VG
Figure 6. Slope frequency histograms of Advent contact lensesthat would be probed by a VG Escalab with photoemissionanalyser slits of 10 mm by: (a) 1 mm; (b) 2 mm; (c) 4 mm.
SURFACE AND INTERFACE ANALYSIS, VOL. 25, 741È746 (1997) ( 1997 by John Wiley & Sons, Ltd.
SURFACE TOPOGRAPHY AND XPS ANALYSIS 745
Escalab unit with a 4 mm emission slit. The XPS signalsexpected from this system can be predicted using Eqn(4). When these simulated data are Ðtted using Eqn (1),however, the best-Ðt thickness for the hydrocarbonoverlayer is 53.4 which corresponds to an error ofÓ,6.8%.
Sinusoidal surfaces
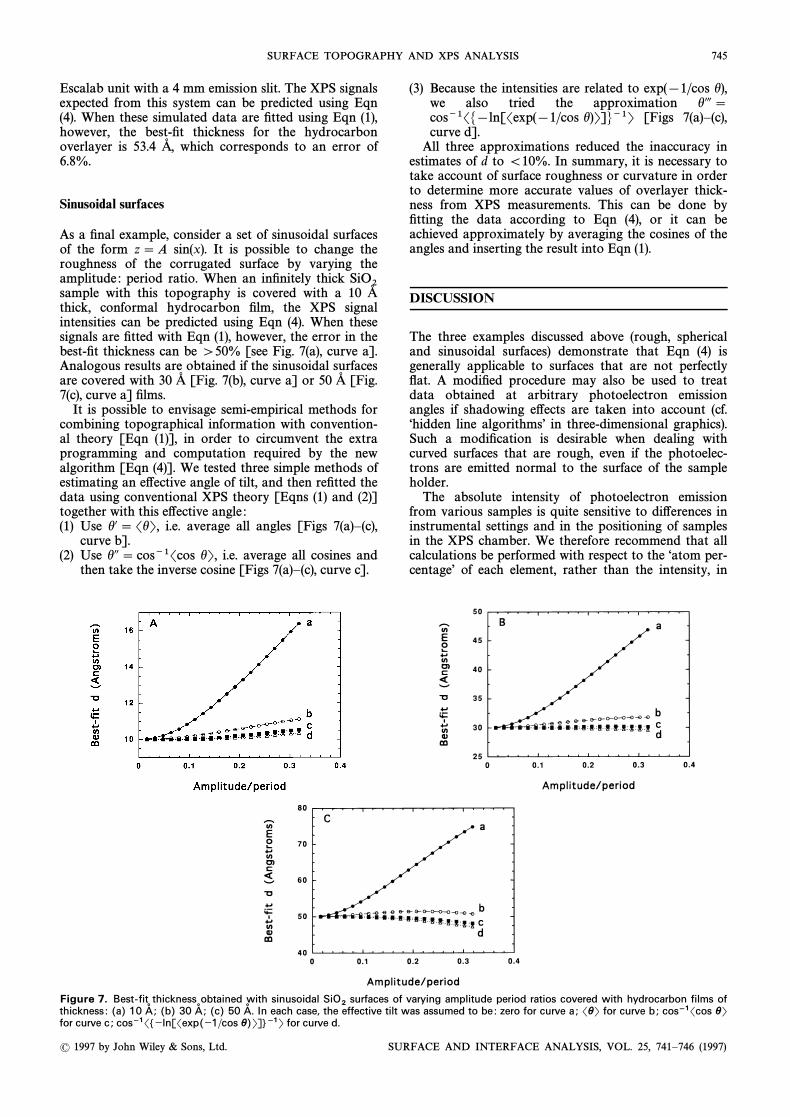
As a Ðnal example, consider a set of sinusoidal surfacesof the form z\ A sin(x). It is possible to change theroughness of the corrugated surface by varying theamplitude : period ratio. When an inÐnitely thick SiO2sample with this topography is covered with a 10 Óthick, conformal hydrocarbon Ðlm, the XPS signalintensities can be predicted using Eqn (4). When thesesignals are Ðtted with Eqn (1), however, the error in thebest-Ðt thickness can be [50% [see Fig. 7(a), curve a].Analogous results are obtained if the sinusoidal surfacesare covered with 30 [Fig. 7(b), curve a] or 50 [Fig.Ó Ó7(c), curve a] Ðlms.
It is possible to envisage semi-empirical methods forcombining topographical information with convention-al theory [Eqn (1)], in order to circumvent the extraprogramming and computation required by the newalgorithm [Eqn (4)]. We tested three simple methods ofestimating an e†ective angle of tilt, and then reÐtted thedata using conventional XPS theory [Eqns (1) and (2)]together with this e†ective angle :(1) Use h@\ ShT, i.e. average all angles [Figs 7(a)È(c),
curve b].(2) Use hA \ cos~1Scos hT, i.e. average all cosines and
then take the inverse cosine [Figs 7(a)È(c), curve c].
(3) Because the intensities are related to exp([1/cos h),we also tried the approximation hÓ \cos~1SM[ln[Sexp([1/cos h)T]N~1T [Figs 7(a)È(c),curve d].
All three approximations reduced the inaccuracy inestimates of d to \10%. In summary, it is necessary totake account of surface roughness or curvature in orderto determine more accurate values of overlayer thick-ness from XPS measurements. This can be done byÐtting the data according to Eqn (4), or it can beachieved approximately by averaging the cosines of theangles and inserting the result into Eqn (1).
DISCUSSION
The three examples discussed above (rough, sphericaland sinusoidal surfaces) demonstrate that Eqn (4) isgenerally applicable to surfaces that are not perfectlyÑat. A modiÐed procedure may also be used to treatdata obtained at arbitrary photoelectron emissionangles if shadowing e†ects are taken into account (cf.“hidden line algorithmsÏ in three-dimensional graphics).Such a modiÐcation is desirable when dealing withcurved surfaces that are rough, even if the photoelec-trons are emitted normal to the surface of the sampleholder.
The absolute intensity of photoelectron emissionfrom various samples is quite sensitive to di†erences ininstrumental settings and in the positioning of samplesin the XPS chamber. We therefore recommend that allcalculations be performed with respect to the “atom per-centageÏ of each element, rather than the intensity, in
Figure 7. Best-fit thickness obtained with sinusoidal surfaces of varying amplitude period ratios covered with hydrocarbon films ofSiO2
thickness : (a) 10 (b) 30 (c) 50 In each case, the effective tilt was assumed to be: zero for curve a ; ShT for curve b; cosÉ1Scos hTA� ; A� ; A� .for curve c ; cosÉ1SÊÉlnÍSexp(É1/cos h)TËÌÉ1T for curve d.
( 1997 by John Wiley & Sons, Ltd. SURFACE AND INTERFACE ANALYSIS, VOL. 25, 741È746 (1997)
746 R. C. CHATELIER ET AL .
order to obtain reproducible values of the thickness.15The advantages of using intensity ratios rather than rawintensities have also been noted previously.14,16
One weakness of this algorithm is that it requires I=values for each element in each data set. When dealingwith the adsorption of single components it is easy tomeasure or calculate values. However, when study-I=ing the adsorption of components from a mixture it isnot possible to unambiguously assign values,I=because there may be preferential adsorption of particu-lar components onto the surface. Moreover, complexcoatings such as glow-discharge plasma polymers havecompositions that change with storage time,17 thusmaking it difficult to determine values.I=Following generation of the slope frequency histo-gram, it might be tempting to use an average angleto correct for the e†ects of roughness on the XPSsignal. We tested three di†erent methods for deter-mining an average angle : ShT, cos~1Scos hT andcos~1SM[ln(Sexp[[1/cos h)T]N~1T. The secondmethod was simple to implement and yet it was strik-ingly e†ective in mimicking simulations that took intoaccount the full distribution of angles. This is analogousto one of the conclusions of Gunter and Niemantver-driet,18 who showed that the average slope (Stan hT) ofa rough surface could be used to correct for the e†ect ofnon-ideal topography.
The theory described in this paper assumes thatphotoelectrons from a given element have the samemean free path in all layers. However, if the layers havesigniÐcantly di†erent valence electron densities, then itis unlikely that this assumption is valid. In principle, itis possible to reÐne the algorithm further by allowingphotoelectrons from each element to have a di†erentmean free path in each layer. However, such an exten-sion of the theory is outside the scope of this paper.
Although we carried out the above analyses on dis-tinct elemental species, the algorithm can also be usedon other entities such as chemical groups. For example,if the percentage of carbon in the form of CwO,CH
x,
CxO and OwCxO is known in the various layers, it
is possible to use these values together with the atompercentages in order to better deÐne the thicknesses ofthe individual layers.
The theory described in this paper is able to takeaccount of measurable roughness. For example, undu-lations on a solid surface that are less curved than anAFM or STM tip can be classed as measurable. Insome samples, it may be necessary to deconvolve thee†ect of AFM tip curvature from the measured image.19However, signals from deep cracks or pores cannot betreated using this theory.
Various algorithms exist for dealing with perfectly Ñatsamples whose surface composition varies continuouslywith depth.20 However, when compositional gradientsare present in a rough or curved sample, it may benecessary to modify the depth-proÐle algorithms using atheory that is analogous to Eqn (4).
CONCLUDING REMARKS
We have presented a quantitative theory for the inten-sities of XPS photoelectron signals originating frommultilayer structures that possess surfaces of arbitrarytopography. The topography of each surface was mea-sured by AFM and summarized as a frequency histo-gram of the local slopes of the surface. This histogramwas convolved with XPS theory for multilayer coatingsto allow determination of the thickness of each layer inthe coating. A copy of the computer program based onthe above theory is available from the authors onrequest.
Acknowledgements
We are grateful to Ms Sally MacArthur for etching the glass samples.This work was partially supported by the Commonwealth Govern-mentÏs Co-operative Research Centres Scheme (Co-operativeResearch Centre for Eye Research and Technology) and by the CibaVision Corportion.
REFERENCES
1. R. C. Chatelier, L. Dai, H. J. Griesser, S. Li, P. Zientek, D.Lohmann and P. Chabrecek, EP 93/02420 and WO 94/06485.
2. H. J. Griesser and P. Zientek, Polym. Mater . Sci . Eng. 69, 468(1993).
3. L. Dai, P. Zientek, H. A. W. St John, P. Pasic, R. C. Chatelierand H. J. Griesser, in Surface Modification of Polymeric Bio-materials , ed. by B. D. Ratner and D. Castner, p. 147. PlenumPress, New York (1996).
4. S. Li, R. C. Chatelier, P. Zientek, T. R. Gengenbach and H. J.Griesser in Surface Modification of Polymeric Biomaterials ,ed. by B. D. Ratner and D. Castner, Plenum Press. p. 165(1996).
5. L. Dai, H. A. W. St John, J. Bi, P. Zientek, R. C. Chatelier andH. J. Griesser, Surf . Interface Anal . (submitted).
6. J. D. Andrade, in Surface and Interfacial Aspects of Bio-medical Polymers , Volume 1, Surface Chemistry and Physics .Plenum Press, New York (1985).
7. B. J. Tyler, D. G. Castner and B. D. Ratner, Surf . InterfaceAnal . 14, 443 (1989).
8. T. Horr, J. Ralston and R. St Smart, Colloids Surf . A 92, 277(1994).
9. H. P. C. E. Kuipers, H. C. E. van Leuven and W. M. Visser,Surf . Interface Anal . 8, 235 (1986).
10. S. M. Davis, J . Catal . 122, 240 (1990).11. L. Griffiths and L. Bradley, Appl . Spectrosc. 46, 1426 (1992).12. A. Frydman, D. G. Castner, M. Schmal and C. T. Campbell, J .
Catal . 157, 133 (1995).13. J. E. Fulghum and R. W. Linton, Surf . Interface Anal . 13, 186
(1988).14. P. J. Cumpson, J. Electron Spectrosc . Relat . Phenom. 73, 25
(1995).15. H. A. W. St John, PhD Thesis , University of Queensland
(1994).16. J. E. Fulghum, Surf . Interface Anal . 20, 161 (1993).17. T. R. Gengenbach, Z. V. Vasic, R. C. Chatelier and H. J.
Griesser, J . Polym.Sci ., Polym.Chem. Ed. 32, 1399 (1994).18. P. L. J. Gunter and J. W. Niemantverdriet, J . Vac. Sci .
Technol . A 13, 1290 (1995).19. D. L. Wilson, K. S. Kump, S. J. Eppell and R. E. Marchant,
Langmuir 11, 265 (1995).20. B. J. Tielsch and J. E. Fulghum, Surf . Interface Anal . 21, 621
(1994).
SURFACE AND INTERFACE ANALYSIS, VOL. 25, 741È746 (1997) ( 1997 by John Wiley & Sons, Ltd.